 Alice C. Ortmann1*
 Ho Yin Poon1
 Meng Ji1
 Susan E. Cobanli1Gary Wohlgeschaffen1
 Charles W. Greer2Brian Robinson1
 Thomas L. King1
- 1Centre for Offshore Oil, Gas and Energy Research, Fisheries and Oceans Canada, Bedford Institute of Oceanography, Dartmouth, NS, Canada
- 2Energy, Mining and Environment, National Research Council of Canada, Montreal, QC, Canada
Dilution affects the distribution and weathering of oil following a spill into coastal seawater, but including dilution in experiments is rare. In open water, dilution is expected to rapidly reduce the concentrations of hydrocarbons, and estimates of impacts and microbial responses from batch experiments may overestimate what happens during a spill event. Three experiments carried out in the southern Gulf of St. Lawrence incorporated periods of incubation of natural microbial communities with either Heidrun medium crude or Bunker C fuel oil followed by dilutions using unexposed seawater. Higher concentrations of n-alkanes (C10 – C35) in Heidrun, resulted in higher initial total hydrocarbon concentrations in incubations with Heidrun compared to Bunker C. Similar polycyclic aromatic hydrocarbon concentrations and potential toxicity were measured in the water column for both oils. Dilution effectively decreased the hydrocarbon concentrations, reducing them to background levels after two dilutions (13.8-fold). Neither the abundance nor the diversity of the prokaryote community was strongly affected by the addition of oil. The natural coastal microbiome was dominated by bacteria that may be facultative hydrocarbon degraders. The abundance of phytoplankton and the diversity of the microeukaryote community decreased during the second incubation in response to both Heidrun and Bunker C, potentially due to photooxidative byproducts produced under full sunlight. Dilution appears to limit the bacterial response to oil, but low hydrocarbon concentrations may still be linked to impacts on the microeukaryote community.
1 Introduction
Following a surface spill into the marine environment, oil weathers through physical, chemical and biological processes (reviewed in National Academies of Sciences, Engineering, and Medicine, 2022). Some volatile hydrocarbons evaporate, some hydrocarbons dissolve into the water column and some oil disperses as droplets, releasing hydrocarbons within the water column. Spreading on the surface increases the surface area between water and the oil, increasing the likelihood of hydrocarbons entering the water column. Currents and tides move the water horizontally, often with different speeds and directions depending on depth. Bottom topography, density changes and physiochemical variability encourage vertical transport of oil or dissolved hydrocarbons. All of these processes increase the volume of water exposed to the oil, while diluting water column hydrocarbon concentrations.
Microbes able to degrade hydrocarbons increase in abundance in response to the oil, but there is often a lag as microorganisms adjust to a new oiled environment (Cobanli et al., 2022; Ryther et al., 2022). In the absence of hydrocarbons, obligate hydrocarbon degraders occur at low abundances, often below detection levels in amplicon surveys. Following exposure to oil, these microbes increase rapidly in abundance and begin to degrade the oil. In extreme cases, obligate hydrocarbon degraders may dominate the community within a few days of oil exposure, comprising up to 97% of the relative abundance (Redmond and Valentine, 2012; Gutierrez et al., 2013). Fewer studies have focused on the impacts of oil on phytoplankton and microzooplankton, but shifts in community diversity and abundances have been observed following oil exposure (Gertler et al., 2010; Ortmann et al., 2012; Ozhan et al., 2014; Parsons et al., 2015).
Incubation experiments are often used to understand the microbial response to oil as conducting experimental spills are rare (Brussaard et al., 2016). Many experiments measuring the microbial response to oil omit naturally occurring dilution from the experimental design (Cappello et al., 2007; Ortmann et al., 2012; Williams et al., 2017; Cobanli et al., 2022). In batch experiments, hydrocarbon concentrations may stay high over time, leading to amplification of impacts on biological communities, potentially affecting biodegradation rates (Lee et al., 2013). In open water, dilution is expected to rapidly reduce the concentrations of hydrocarbons, and estimates of impacts and microbial responses from batch experiments may overestimate what happens in situ. Batch experiments may also result in higher exposure of microbial communities to transformation products produced from weathering of the oil, either through photooxidation by UV or biodegradation (Aeppli et al., 2012; Bacosa et al., 2015; Vergeynst et al., 2019). Chemostats or flow through systems can be used to incorporate dilution, but these systems are difficult to deploy on a ship (Horowitz and Atlas, 1977; Bertrand et al., 1983).
To test the effects of dilution on the microbial response to hydrocarbons, three oil exposure incubations were carried out in the southern Gulf of St. Lawrence, Canada, in August 2019 during a ship-based field campaign. The Gulf represents a temperate coastal environment, with several economically important fisheries, high usage by endangered North Atlantic Right Whales (Simard et al., 2019) and high volumes of ship traffic. In 2022, 6,931 voyages were recorded, of which 1,807 were oil tankers (Laurentian Pilotage Authority, 2022). In this study, incubation periods were alternated with dilution using unexposed surface seawater. Water column hydrocarbon concentrations and microbial communities were sampled over a short period of time representing the immediate aftermath of a spill. Dilution of the hydrocarbons would be expected to dampen the microbial response to the oil, resulting in microbial communities that closely resemble the pre-spill communities in both abundance and diversity.
2 Experimental
2.1 Experimental set up and sampling
A series of three incubation experiments were conducted during a mission in the southern Gulf of St. Lawrence on the RV Coriolis II in August 2019 using a flow-through incubator system. Within the 6 flow-through incubators (Coleman® coolers) were 18 enclosures. The enclosures were composed of PTFE lined buckets equipped with a PVC sampling pipe (Figure 1). The pipe supported a HOBO® temperature and light logger (Onset, Bourne, MA) and aeration was provided by an aquarium pump attached to a silicone tube that passed through the sampling pipe to an aquarium air stone resting at the bottom of the enclosure. Pumps were adjusted manually to provide gentle bubbling at approximately even rates across all enclosures. Bubbling provided some mixing energy and ensured that the enclosures did not stratify. A submerged pump on the vessel was connected to the incubators that were joined in 2 series of 3 to enable surface water to flow through the incubators at ~ 1-2 L min-1 to moderate the temperature in the enclosures.
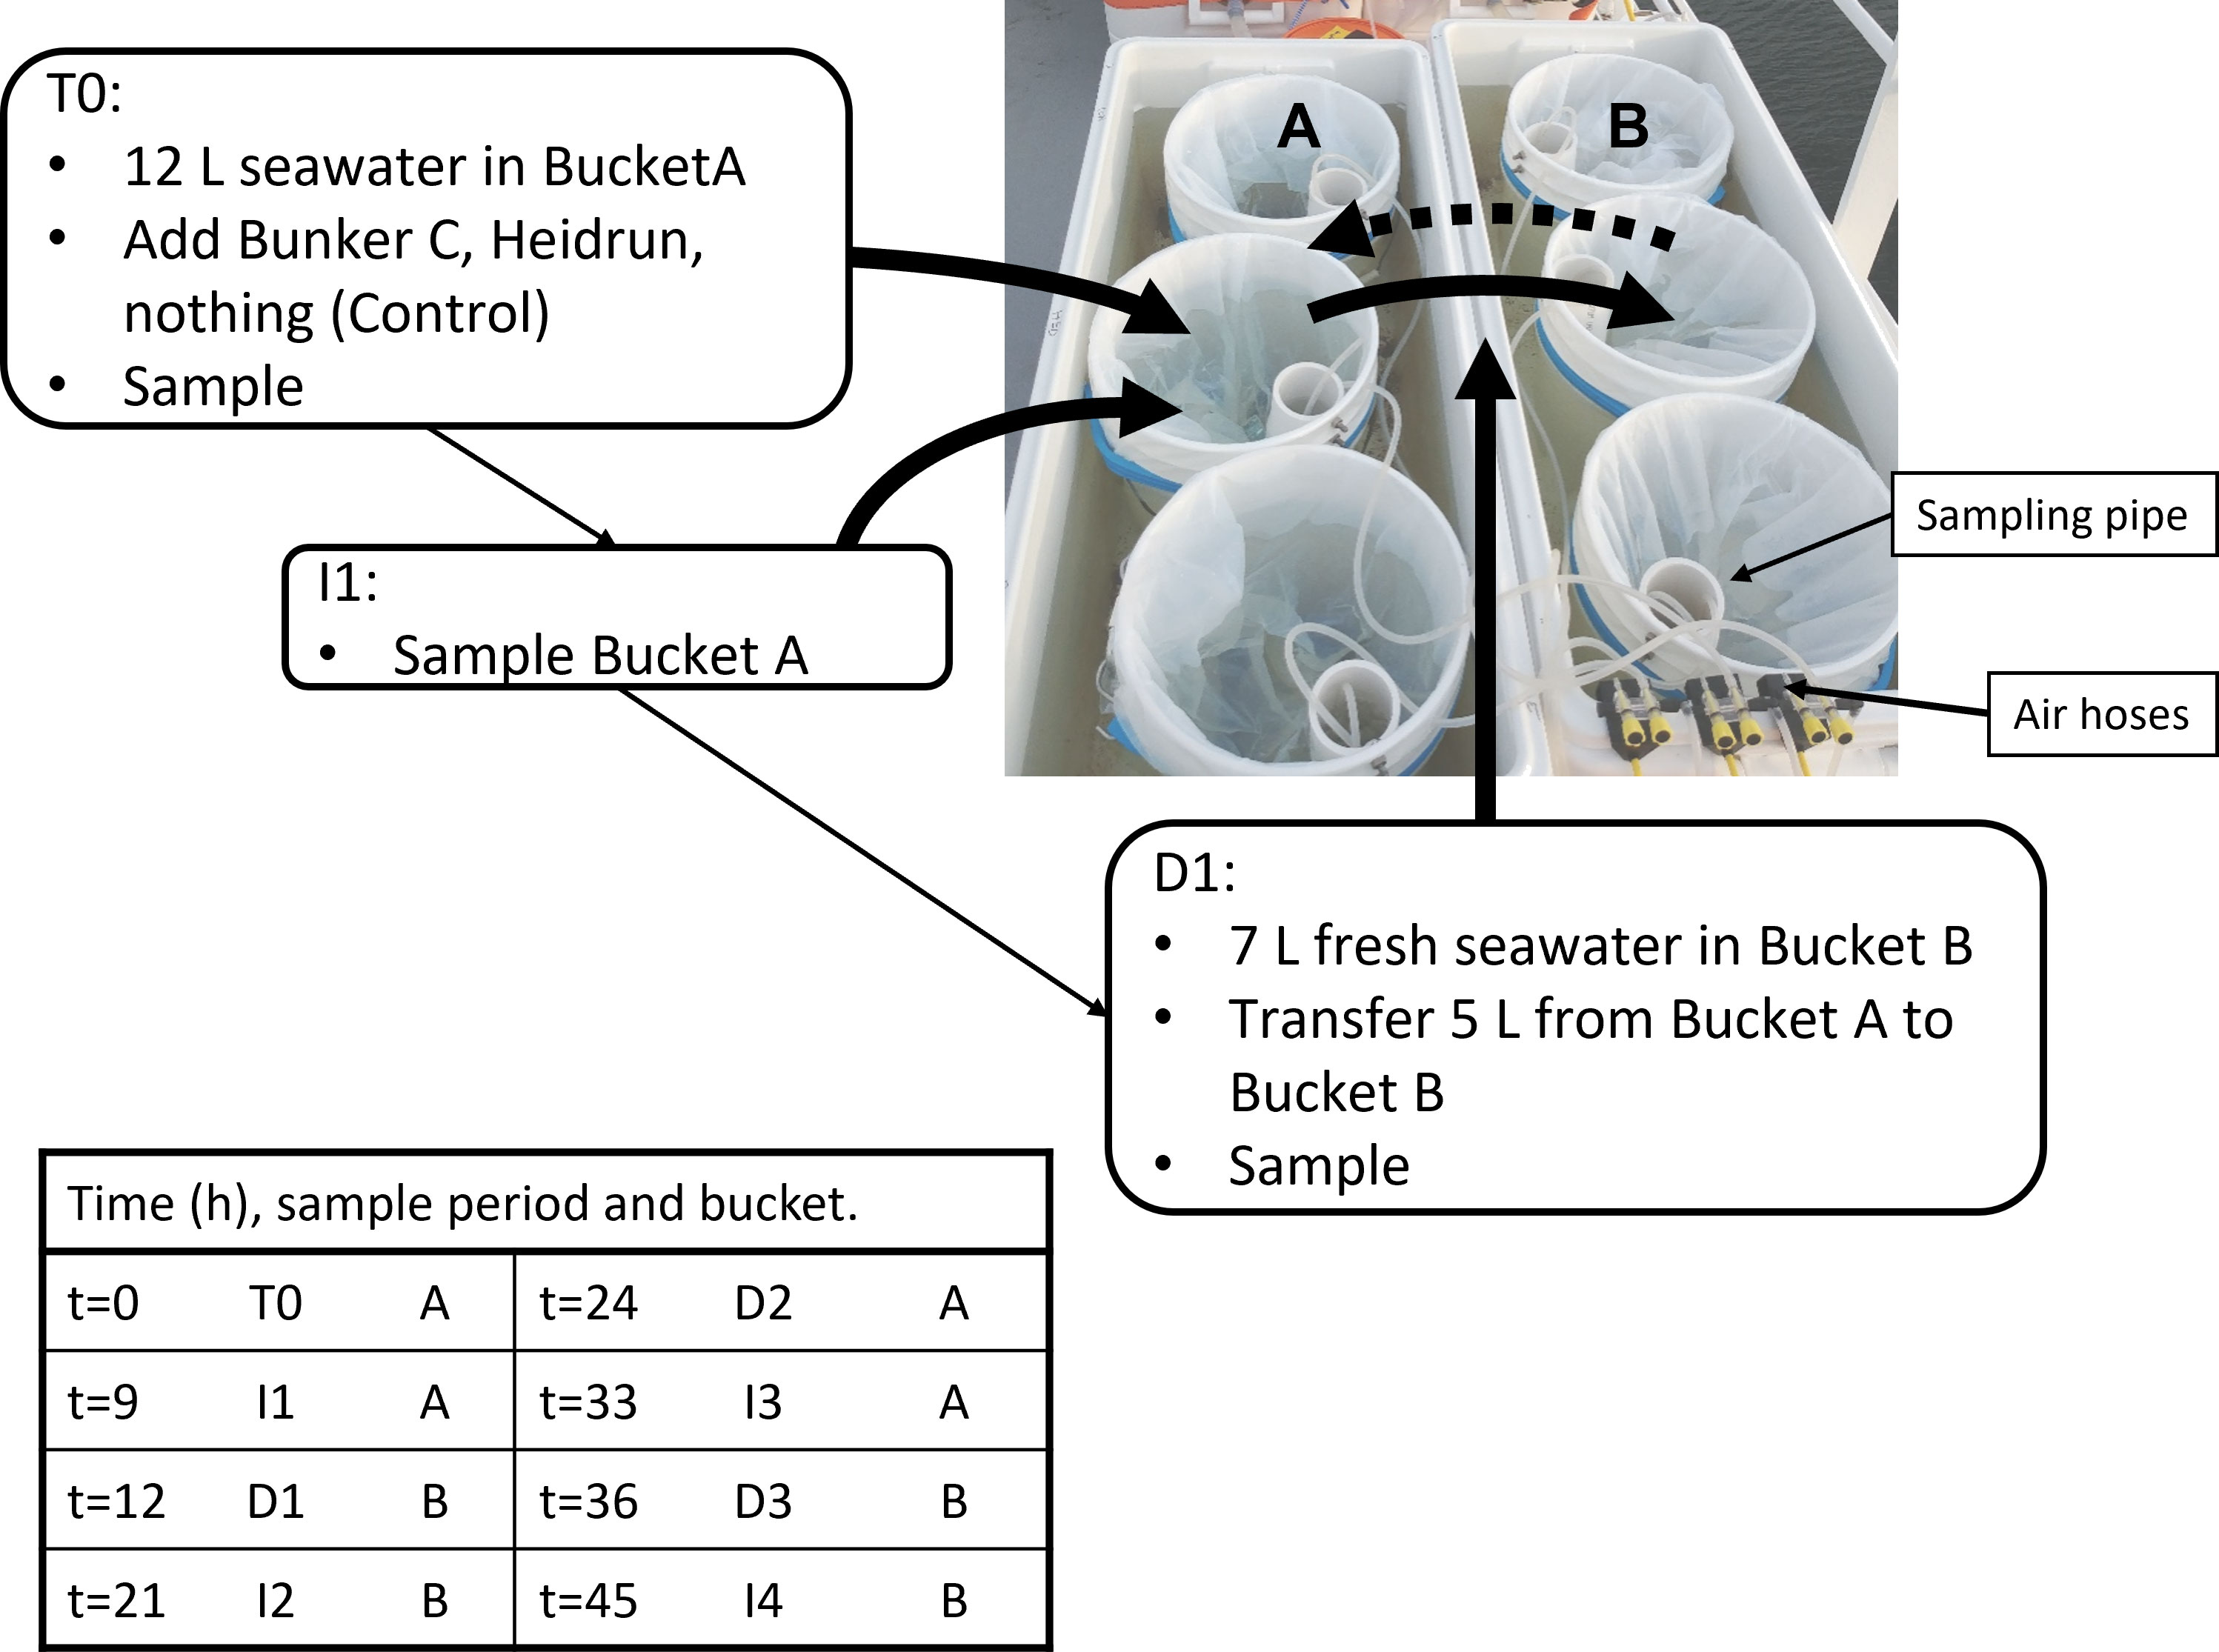
Figure 1 Example of a set of flow through incubators with 6 of the enclosures used for the experiments. Each pair of enclosures (A, B) was assigned one of the three treatments per incubator. The sampling pipe and air hoses are shown. Experiments began with the A-buckets (12 L water), which were sampled at T0, and at I1. At D1, water (5 L)was pumped from Bucket A Bucket B (7 L freshly collected water) (solid arrow) and then sampled. At I2, Bucket B was again sampled. Bucket A was cleaned with a new liner added before D2 transferred water (5 L) back to Bucket A which was filled with 7 L of freshly collected water (dashed arrow). This was repeated until the end of the experiment. The table indicates the hours after the beginning of the experiment that corresponds to the sampling period.
Each experiment was designed to include a series of incubation periods and dilutions over 45 h, with sampling occurring at 8 time points (Figure 1). For two experiments, samples were collected following known surface currents (Exp1 and Exp2) to mimic how a surface spill may be diluted (Supplementary Figure 1). The third experiment aimed to follow the Orphan Bank Gyre, but likely sampled against the main flow of the Gaspe Current (Exp3). For each experiment and dilution, 120 L of surface water (2 m) was collected using a CTD-rosette system. In situ temperature, salinity and chlorophyll a (chl a) concentrations estimated from fluorescence were recorded for each sampling. Water from multiple 12 L Niskin bottles were pooled and distributed into 9 enclosures. At the beginning of the experiment (T0), one of three treatments was randomly assigned to each enclosure, with each treatment occurring once per incubator. For the oil treatments, either Bunker C or Heidrun was added to the surface of the seawater and the enclosure sampled immediately following the addition. Bunker C has been a commonly used fuel for decades, while restrictions on sulfur content in exhaust are driving a shift from bunker fuels to alternative, many vessels still use this fuel. Heidrun is a medium crude oil that represents the types of crude oils that are imported to Canada for refining. Both could be released from vessels transiting the Gulf of St. Lawrence. The control enclosures received no additions. Sampling was carried out from enclosure 1 to 9 each time. To facilitate addition of oil, small vials of Bunker C and Heidrun were warmed to 50°C and poured into each enclosure. Heating decreased the viscosity of the oil, but may increase volatilization when the vial was opened and the oil poured. To determine the amount of oil added, each vial was weighed before and after addition of the oil.
Samples were collected by placing a silicone tube through the sampling pipe and pumping water into sample vessels with a peristaltic pump from below the surface. The sampling pipe enabled the tubing to be lowered to the bottom of the enclosure without passing through any surface slick. After the initial addition of oil and the first sampling, the enclosures were incubated for 9 h before being sampled again (Incubation period 1 = I1, Figure 1). At 12 h, a second CTD cast collected surface water from a location down current from the first site (Supplementary Figure 1) and water was distributed into the second set of 9 enclosures. Using the peristaltic pump at a flow rate of 1.9 L min-1, 5 L of water from the first enclosure was pumped into an enclosure containing 7 L of freshly collected surface water, resulting in a 2.4-fold dilution of the original incubation. The diluted enclosure was immediately sampled (Dilution 1 = D1) and then the remaining incubations were diluted and sampled in order. The new incubations were sampled after an additional 9 h (21 h post oiling = I2) and then diluted 3 h later (24 h post oiling = D2). This was repeated at 33 h post oiling (I3), 36 h (D3) with a final sample collected at 45 h post oiling (I4). The final sample (45 h) was not collected for Exp2 due to rough weather and rolling of the ship that caused waves to wash over the enclosures.
At each time point, several different types of samples were collected, with <2.5 L collected at each sampling time. To analyze monocyclic aromatic compounds [benzene, toluene, ethylbenzene and xylenes (BTEX)], 40 mL of sample were collected into purge and trap vials containing 40 µL of HCl and stored at 4°C prior to analysis. Samples for total petroleum hydrocarbons (TPH) and quantification of specific polycyclic aromatic hydrocarbons (PAHs) were collected separately by pumping approximately 800 mL of water into two 1 L amber bottles. Dichloromethane (DCM) was added and each bottle was shaken well before being stored and transported to the Bedford Institute of Oceanography (BIO), Dartmouth, Nova Scotia, at 4°C. Approximately 450 mL of water was then collected in sterilized media bottles and subsampled in the wet lab on the vessel.
2.2 Subsampling
To determine the abundances of prokaryotes, duplicate 980 µL subsamples were pipetted into 2 mL cryovials containing 25 µL of 25% EM-grade glutaraldehyde (Cobanli et al., 2022). Duplicate 3955 µL subsamples were pipetted into 5 mL cryovials containing 40 µL of 25% EM-grade glutaraldehyde and 4 µL of 10% Pluronic F68 to determine the abundance of small phytoplankton (Marie et al., 2014). After 10 min on ice, the vials were flash frozen in liquid nitrogen and stored at -80°C. To measure chl a concentrations, water was filtered through a 25 mm GF/f filter (nominal pore size ~ 0.7 µm). The volume was recorded to calculate the sample concentrations. Each filter was placed in a glass scintillation vial and stored at -80°C. Approximately 30 mL of sample was poured into acid-cleaned Nalgene bottles for analysis of total inorganic (TIC) and organic carbon (TOC). Bottles were stored at -20°. Duplicate subsamples were poured into 10 mL vials and frozen at -20° to measure the concentrations of inorganic nutrients. To characterize the microbial diversity using amplicon sequencing, 100 mL were filtered through a 47 mm, 0.22 µm Millipore Durapore® PVDF filter. The filter was placed in a sterile 50 mL polycarbonate tube and frozen at -80°C. A final subsample of water was collected and analyzed using the Microtox® M500 system (Modern Water, New Castle, DE) on the vessel. All frozen samples were transported on dry ice to the BIO for processing.
2.3 Sample processing
2.3.1 Potential toxicity
The 100% Acute Toxicity Test protocol for the Microtox® system was used to determine the biological availability of hydrocarbons (Chang et al., 1981). The Basic Test protocol using zinc sulfate was used to ensure the quality of the test organism, Aliivibrio fischeri. Experimental samples were analyzed within 1 h of collection. For each sample, a dilution series was generated using 0.1 µm filtered seawater collected at the initial sample site. The reagent containing A. fischeri was added and allowed to incubate for 15 min, after which photoluminescence was measured on the M500 analyzer. Percent light was recorded for each dilution of the sample. To determine if light inhibition was significant, linear regressions were calculated for each sample and a t-test was used to determine if the slope was significantly different from zero (Ortmann et al., 2020). Where the slope was significantly different from zero and negative, the percent inhibition for the test solution was calculated: [light of 0% control solution] – [light of 100% sample solution].
2.3.2 Hydrocarbon analysis
BTEX was analyzed using a modified purge and trap method within 14 d of collection (Ortmann et al., 2020). Individual compounds were quantified based on standards and blanks and summed, with the limit of detection 0.5 ng mL-1. To extract samples for TPH analysis, bottles were placed on a roller system for 18 h before the DCM layer was collected, weighed and evaporated (Ortmann et al., 2020). Samples were diluted and stored at -20°C until they were reconcentrated and analyzed on an Agilent 7890B gas chromatograph (GC) connected to a flame ionizing detector. Concentrations were calculated using a standard curve. Analysis of specific PAHs was done using GC-mass spectrometry (MS) after samples had been processed using liquid-liquid extraction and purified using a modified solid-phase extraction method (King et al., 2015; Ortmann et al., 2020). Standard curves were used to quantify individual parent PAHs and specific alkylated PAHs with a reporting limit of 25 ng mL-1 extract, representing an average limit of 32.92 ng L-1 of sample.
Subsamples of the Bunker C and Heidrun oils were analyzed prior to the start of the experiments. Density and viscosity were measured at 25°C using a SVM 3000 Stabinger Viscometer (Anton Paar Canada Inc., Montreal, QC). Oils were diluted with DCM and analyzed as described above to determine the concentrations of BTEX and PAHs. n-alkanes (C10-C35) were analyzed along with the PAHs.
2.3.3 Microbial abundances
Quantification of prokaryotes and small phytoplankton (<5 µm), was carried out using a BD FACSLyric flow cytometer (BD Biosciences, Franklin Lakes, NJ), equipped with 488 nm and 632 nm lasers (Cobanli et al., 2022). Samples were diluted and stained with SYBR Green for analysis of prokaryotes or undiluted and unstained for analysis of small phytoplankton. The time of the run was used, along with the calibrated flow rate to calculate abundances mL-1 (Brussaard et al., 2010). FSC files were analyzed in FlowJo v10 (BD Biosciences). A single gate was identified for prokaryotes based on the plot of green fluorescence vs side-scatter. Using just the channels associated with the 488 nm laser, 8 individual populations of small phytoplankton were identified. One was clearly associated with Synechoccocus-like phycoerythrin containing cyanobacteria. The other 7 populations varied in the intensity of their chl a and phycoerythrin signals and likely represent chlorophytes, cryptophytes and diatoms. No populations were identified with channels from the 632 nm laser.
Total chl a concentrations were determined after the filters were extracted in 90% acetone at -20°C for 24 h. Extracts were measured using the Turner Trilogy fluorometer (Turner Designs, Inc., San Jose, CA) with the snap-in chl a acidification module. Fluorescence was measured before and after acidification with HCl and a standard curve was used to calculate the µg L-1 of chl a after correcting for the extract and sample volumes (Holm-Hansen et al., 1965).
2.3.4 Inorganic nutrient and carbon analysis
TIC and TOC were determined using a VARIO Select TOC analyzer (Elementar Americas Inc., Ronkonkoma, NY). The combustion column temperature was set to 650°C and ultra pure air was used as the carrier gas. Standard curves for TIC and total carbon were used to calculate the sample concentrations in mg L-1 and the difference between total carbon and TIC was determined to be TOC. Inorganic nutrients, NO3-, NH4+, PO4-3 and silicate, were measured on a SEAL Analytical AS3 continuous segmented flow autoanalyzer (SEAL Analytical Inc., Mequon, WI) using standard methods (Becker et al., 2020). NO3- was calculated as the difference between (NO2- + NO3-) - NO2-. All values are reported in µM.
2.3.5 Amplicon sequencing
Samples for amplicon analysis were shipped on dry ice to the National Research Council in Montreal, QC, Canada. The DNA was extracted using a modified hexadecyltrimethylammonium bromide method (Tremblay et al., 2017) and the V4-V5 region of the 16S rRNA gene (prokaryotes) and the V4 region of the 18S rRNA gene (microeukaryotes) were amplified for each sample using the 515F-Y/925R (Parada et al., 2016) and 565F/948R (Stoeck et al., 2010) primer sets, respectively. Amplicons were sequenced on an Illumina MiSeq platform (Illumina Inc., San Diego, CA). Reads were processed following the Amplicon Tagger pipeline to identify and classify operational taxonomic units (OTUs) using the SILVA database (release 138) (Quast et al., 2013; Tremblay and Yergeau, 2019). Raw OTU tables were filtered to remove chloroplasts and mitochondria from the 16S rRNA table and metazoans from the 18S rRNA table (Cobanli et al., 2022). To calculate richness, based on the Chao1 metric, and Shannon diversity for each sample, OTU tables were rarefied to 20,000 reads for 16S rRNA amplicons and 15,000 reads for 18S rRNA amplicons using AmpVis2 2.7.34 (Andersen et al., 2018). All sequence data is available from NCBI under BioProject PRJNA973930.
2.4 Data analysis
Measured parameters were analyzed to identify if there were significant treatment effects using generalized additive mixed models (GAMM) in the mgcv 1.9.0 package (Wood, 2004; Wood, 2011; Wood et al., 2017) in R Statistical Software (v4.3.0; R CoreTeam, 2023). TPH, ΣPAHs and Σalkylated PAHs were log transformed prior to analysis after adding the reporting limit (TPH + 0.05, ΣPAHs/Σalkylated PAHs + 32.92) to compensate for the zero values. As the main question focused on the effects of oil addition and not on the specific patterns within each experiment, the data was pooled, with 27 mesocosms (9 from each experiment) over 3 experiments (ntotal samples=207). The gam function was used with mesocosm nested in experiment and fit as random factors. Four separate models (Supplementary Table 1) were fit for each parameter using Restricted Maximum Likelihood and the models compared using ΔAIC (AICmodel-AICmin). The simplest model with a ΔAIC <2 was selected. All models included the random terms as well as a smooth term for time as a continuous variable. Additional models included a smooth term for time depending on treatment (control, Bunker C or Heidrun), treatment as a fixed parametric term or both treatment terms (Alguero-Muniz et al., 2017; Calderó-Pascual et al., 2021). The reference treatment was control. Models for the abundance of prokaryotes and the three phytoplankton populations as well as the concentration of chl a were analyzed using a Gamma distribution with log as the link function. The other models used the default Gaussian distribution with identity as the link function. Pearson correlations between parameters were calculated using the Rcmdr v2.8.0 package (Fox et al., 2023) with the Holm’s p-value correction using only data from the Heidrun and Bunker C enclosures.
Changes in prokaryote and microeukaryote community structure due to treatment were detected using Permutational Multivariate Analysis of Variance (PERMANOVA). The avgdist function in vegan (Oksanen et al., 2022) was run with 100 interactions to resample 20,000 or 15,000 reads from the 16S and 18S rRNA amplicon tables, respectively. The Bray-Curtis distance was calculated for each iteration and final distance matrices were calculated based on the average distances. Prior to PERMANOVA, the betadisper function was used to compare the communities at T0 for the three experiments. While distances between the centroids within an experiment were low, larger values between experiments suggested that the different T0 locations resulted in different initial communities. To increase the likelihood of detecting treatment effects, PERMANOVA was conducted separately for each experiment. The average distance matrices were passed to the adonis2 function where fixed factors included treatment, time and the interaction term and permutations were restricted based on the mesocosm (Simpson, 2022). To visualize how community structure varied with time and experiment, the 10 most abundant OTUs from each experiment were identified for both prokaryotes and microeukaryote communities. The average relative abundances at the end of each incubation period were plotted over time for each treatment and experiment. Overlap in abundant OTUs from the three experiments meant that there were 17 and 20 unique OTUs visualized for prokaryotes and microeukaryotes, respectively.
3 Results and discussion
3.1 Oil characteristics
Two different oils were used in these experiments (Table 1). Bunker C represents a heavy fuel oil compared to Heidrun, which is a medium crude oil from Norway. Both products have low percentages of BTEX (<0.5% of total content). n-alkanes were over 2-fold higher in Heidrun compared to Bunker C, which had higher amounts of parent and alkylated PAHs on a per g basis. Most PAHs in Bunker C were ≥4-ring, while Heidrun contained mostly 2-ring PAHs. Densities of both oils indicate they should float on seawater. Heating of oils facilitated pouring into enclosures. This approach allowed effective addition of Heidrun in all experiments (4.23 ± 0.05 g, n=9), with more variability in the amount of the more viscous Bunker C added (3.52 ± 0.91 g, n=9).

Table 1 Chemical composition and physical characteristics of the two oils used in the experiments.
3.2 Physicochemical characteristics of experiments
The experiments were all carried out using surface water collected from the southern Gulf of St. Lawrence, but the in situ conditions at the different sample locations varied (for details see the Supplementary Materials). Exp1 was influenced by the Resitgouche River flowing into Chaleur Bay, while Exp2 and Exp3 were collected from the open Gulf (Supplementary Figure 1). This had impacts on the salinities and chl a concentrations in these samples (Supplementary Figure 2), although the total salinity range was small. Chl a was generally highest at the beginning of Exp1. Temperature in the mesocosms was slightly higher than measured in situ and varied across the samples (Supplementary Figure 3). There was no significant impact of treatment on temperature or light for any of the experiments (Supplementary Table 2). Experiments were started in the evening, with I2 and I4 occurring during the day (Supplementary Figure 3B).
Location of sampling also had an impact on the concentrations of NH4+, silicate, PO4-3, TOC or TIC. Dilution appeared to have a larger impact on concentrations compared to addition of oil (Supplementary Table 2, Supplementary Figure 4). Concentrations of NO3- were found to differ significantly due to treatment (Model 2, Supplementary Table 2), with overall concentrations in Heidrun enclosures higher compared to the control or Bunker C enclosures, although this was not as obvious in Exp1 as in Exp2 and Exp3 (Supplementary Figure 5). In all experiments and treatments, NO3- concentrations were low, with NH4+ dominating the nitrogen pool. Nutrients were not limiting during the experiments.
3.3 Hydrocarbon concentrations
Only 7 samples (n=206) had BTEX concentrations above the detection limit. None of these samples were from Exp2, and only 1 (Bunker C, 9 h) was from Exp3. From Exp1, samples with detectable BTEX included the three enclosures in 1 incubator at 9 and 12 h, suggesting possible contamination of the enclosures or the samples. Because of the few samples with detectable BTEX, no further analysis could be carried out, but low concentrations likely reflect the low initial concentrations of BTEX in the oil and potential volatilization following heating.
Water column hydrocarbons increased in the Bunker C and Heidrun enclosures, with no corresponding increase in the control enclosures (Supplementary Materials). TPH, ΣPAHs and Σalkylated PAHs showed similar patterns in all three experiments (Figures 2A–C). The concentrations increased during I1, decreased with dilution and then decreased further during I2. GAMM analyses indicated that the patterns in TPH, ΣPAHs and Σalkylated PAHs over time and absolute concentrations were affected by treatment (Model 4, Supplementary Table 2). TPH was highest in Heidrun treatments initially before becoming similar to Bunker C after I2. The higher TPH measured for Heidrun samples compared to Bunker C reflects the higher contribution of n-alkanes in the fresh Heidrun. There were only minor differences in the patterns of ΣPAHs between the two oils over time, with Heidrun slightly higher at the beginning of the experiments compared to Bunker C. While there was no difference between Heidrun and control concentrations after D2, ΣPAHs with Bunker C remained elevated relative to control enclosures up to I3. Similar patterns were observed for Σalkylated PAHs.
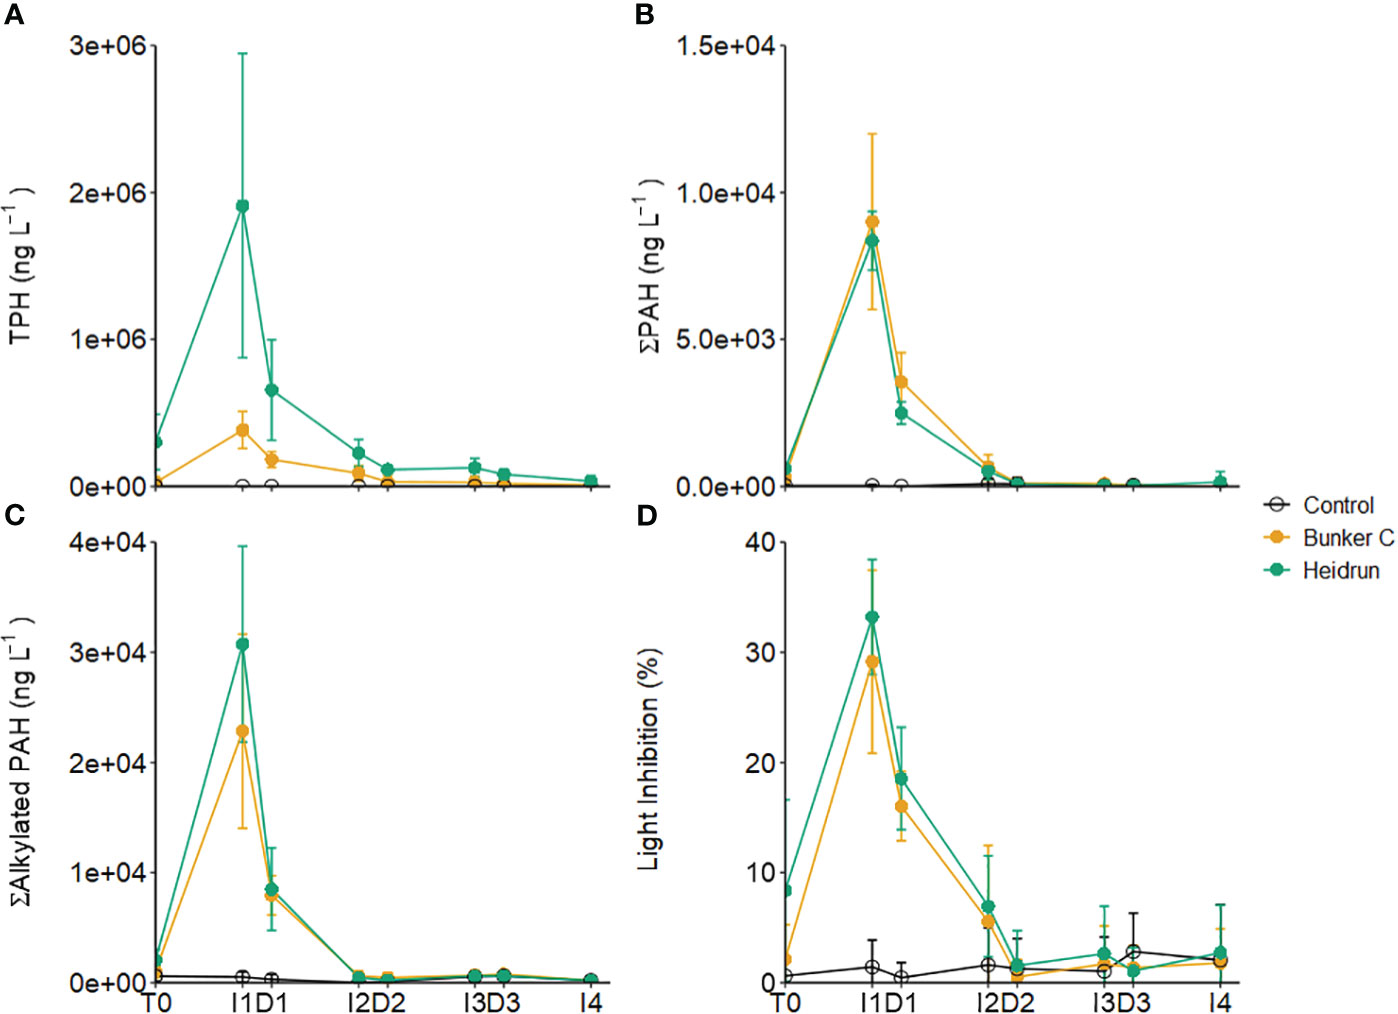
Figure 2 The concentrations of TPH (A), sum of parent PAHs (B) and sum of alkylated PAHs (C) averaged across all three experiments. The average percent light inhibition measured in the Microtox® assay is also shown (D). Error bars are standard deviations based on n=9 for each treatment. x-axis labels indicate the sampling period as described in Figure 1.
Both ΣPAHs and Σalkylated PAHs were dominated by 2-ring PAHs at I1 and D2 when concentrations were the highest (Supplementary Table 3). The ≥4-ring PAHs that make up most of the PAHs of the Bunker C (Table 1) have reduced solubility in water (Abdel-Shafy and Mansour, 2016), resulting in most of the PAHs detected in the Bunker C enclosures being naphthalene and its alkylated homologs and similar concentration between the two oils. Thus, while the overall concentrations of PAHs in oil can be useful in predicting water column concentrations after a spill, the composition of the PAHs and their solubility in the water column is an important consideration (Stoyanovich et al., 2022).
Although the concentration of hydrocarbons peaked at the end of I1, it is likely that more dissolution and dispersion would have occurred if the incubation period was longer. Following D1, no surface hydrocarbon slick was observed in any of the enclosures and no additional hydrocarbons could enter the water. During previous spills, concentrations of hydrocarbons in the water column have been observed to decrease over time. Concentrations of PAHs in the water column under the oil spilled from the Exxon Valdez reached 12 µg L-1 7 days after the spill, but most measurements outside of boomed areas averaged 0.06 ± 0.4 µg L-1 throughout the following month (Boehm et al., 2007). Elevated concentrations were observed under oil slicks, indicating continual inputs from surface oil. In the month following the sinking of the Prestige (December 2022), hydrocarbon concentrations were determined to range from 0.19 to 28.8 µg L-1 of oil equivalents (González et al., 2006). By February 2003 concentrations had decreased to <0.15 to 17.4 µg L-1 of oil equivalents. Unfortunately, during a spill samples are rarely collected during the initial hours or days, so the dilution rates and peak hydrocarbon concentrations are unknown. Two controlled experimental spills conducted in the North Sea determined that maximum concentrations of hydrocarbons in the water below the slick occurred between 10 and 24 h, with decreasing concentrations in the surface layer after this time (Brussaard et al., 2016).
3.4 Potential toxicity
Light inhibition measured with the Microtox® method, represents the potential toxicity or bioavailability of hydrocarbons to prokaryotes. Values were similar in Heidrun and Bunker C enclosures (Figure 2D). GAMM analysis determined that the best model included treatment as a factor affecting the absolute amount of light inhibition and its pattern over time (Model 4, Supplementary Table 2). From the GAMM analysis, inhibition in Bunker C was lower than in Heidrun over the first part of the experiments, but the overall difference between the oils likely had a minimal ecological effect. Both oils had higher potential toxicity than controls until the end of I2. Significant correlations were identified between light inhibition and Σalkylated PAHs (ρ = 0.88, p<0.0001, n=207) and ΣPAHs (ρ = 0.90, p<0.0001, n=207), with a weaker correlation with TPH (ρ = 0.71, p<0.0001, n=207).
Increasing potential toxicity with increasing PAH concentration has previously been observed in other oil exposure experiments (Mueller et al., 2003; Brussaard et al., 2016; Ortmann et al., 2020), with the specific PAHs being important in determining potential toxic effects (Di Toro et al., 2007; Ball and Truskewycz, 2013). The strong correlation between light inhibition and PAHs is driven by the dominance of 2-ring PAHs in the water column (Supplementary Table 3), which are known to have higher toxicity than PAHs with more rings (Di Toro et al., 2007). While the maximum light inhibitions measured in these experiments were too low to estimate an EC50, total PAH concentrations at I1 averaged 39.1 ± 9.5 µg L-1 in Heidrun enclosures and 31.8 ± 11.7 µg L-1 with Bunker C, exceeding concentrations expected to have non-lethal impacts on a range of organisms (Almeda et al., 2013; Barron et al., 2018). However, with high rates of dilution, exposure times to these high concentrations would be relatively short, likely limiting impacts. As each dilution represented a 2.4-fold dilution, the original seawater was diluted 13.8 times after D3. Based on the potential toxicity measured at D3 (Control = 2.82 ± 3.49%, Bunker C = 1.35 ± 2.05%, Heidrun = 1.06 ± 2.12%, light inhibition, n=9 per treatment), the conditions in the oil treatments reflected background conditions within the Gulf. The average concentration of all measured PAHs was similar in the oil treatments compared to the control treatments (Bunker C = 0.81 ± 0.24 µg L-1, Heidrun = 0.64 ± 0.34 µg L-1, Control = 0.65 ± 0.38 µg L-1), below concentrations that would be expected to be toxic.
3.5 Prokaryotic communities
Abundances of prokaryotes were not affected by treatment (Figure 3; Supplementary Table 2). Generally, prokaryote abundances increased during I1, I3 and I4, but decreased through I2 and with most dilutions. The short time frame of the incubation period may have prevented the abundance of prokaryotes with oil from increasing relative to the controls. In many oil exposure experiments, a lag between the peak hydrocarbon concentrations and the increase in prokaryotes has been observed (Gutierrez et al., 2013; Chronopoulou et al., 2015; Ryther et al., 2022). During this lag, hydrocarbon degrading organisms increase, eventually outcompeting the non-hydrocarbon degraders present in the initial community. Previous studies have identified delays in the response of prokaryote communities to hydrocarbons, with lag times of 1 – 4 days (Jung et al., 2010; Lekunberri et al., 2010; Ortmann et al., 2012; Ryther et al., 2022), compared to the 9 h incubations in this study.
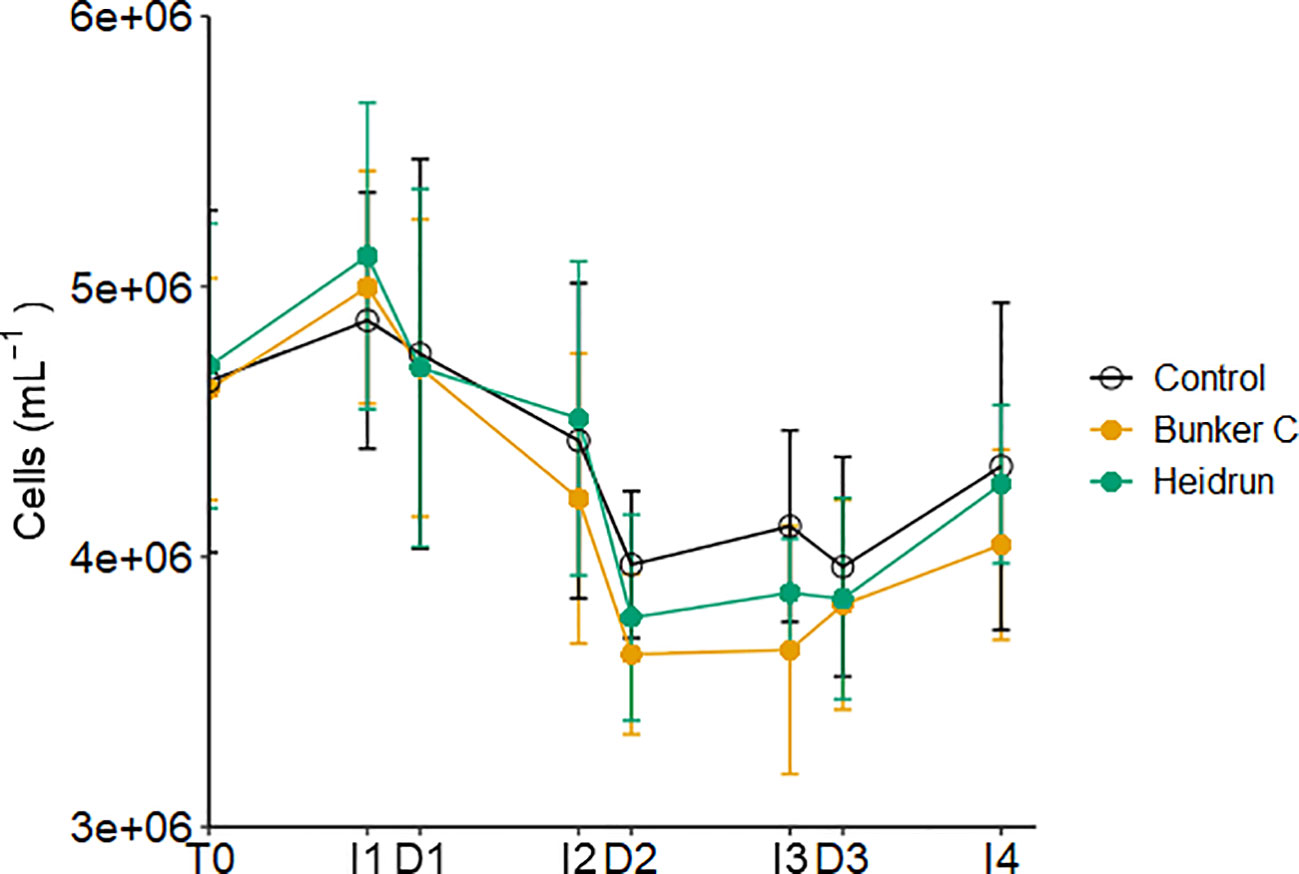
Figure 3 Average abundance of prokaryotes in each treatment over time pooled across all three experiments. Error bars are standard deviations n=9 based on n=9 for each treatment. x-axis labels indicate the sampling period as described in Figure 1.
Prokaryote community diversity was monitored using 16S rRNA gene amplicons, representing both Archaea and Bacteria, although the communities were dominated by Bacteria. Richness, measured using the Chao1 estimate, did not show any significant treatment effect, with the average Chao1 richness being 311.55 ± 45.13 (n=206) (Supplementary Table 2; Figure 4A); however, there was a significant effect of treatment on the pattern of the Shannon diversity for the prokaryote community over time (Model 3, Supplementary Table 2; Figure 4C). Diversity of prokaryotes in Heidrun enclosures tended to be lower than that of the controls initially (HeidrunT0-I2 = 3.59 ± 0.13, ControlT0-I2 = 3.61 ± 0.15), and higher than controls after D2 (HeidrunD2-I4 = 3.57 ± 0.11, ControlD2-I4 = 3.49 ± 0.12), although the effect was small. Richness and diversity tended to increase or decrease after each dilution due to differences between the communities in the incubations and those in the seawater in situ.
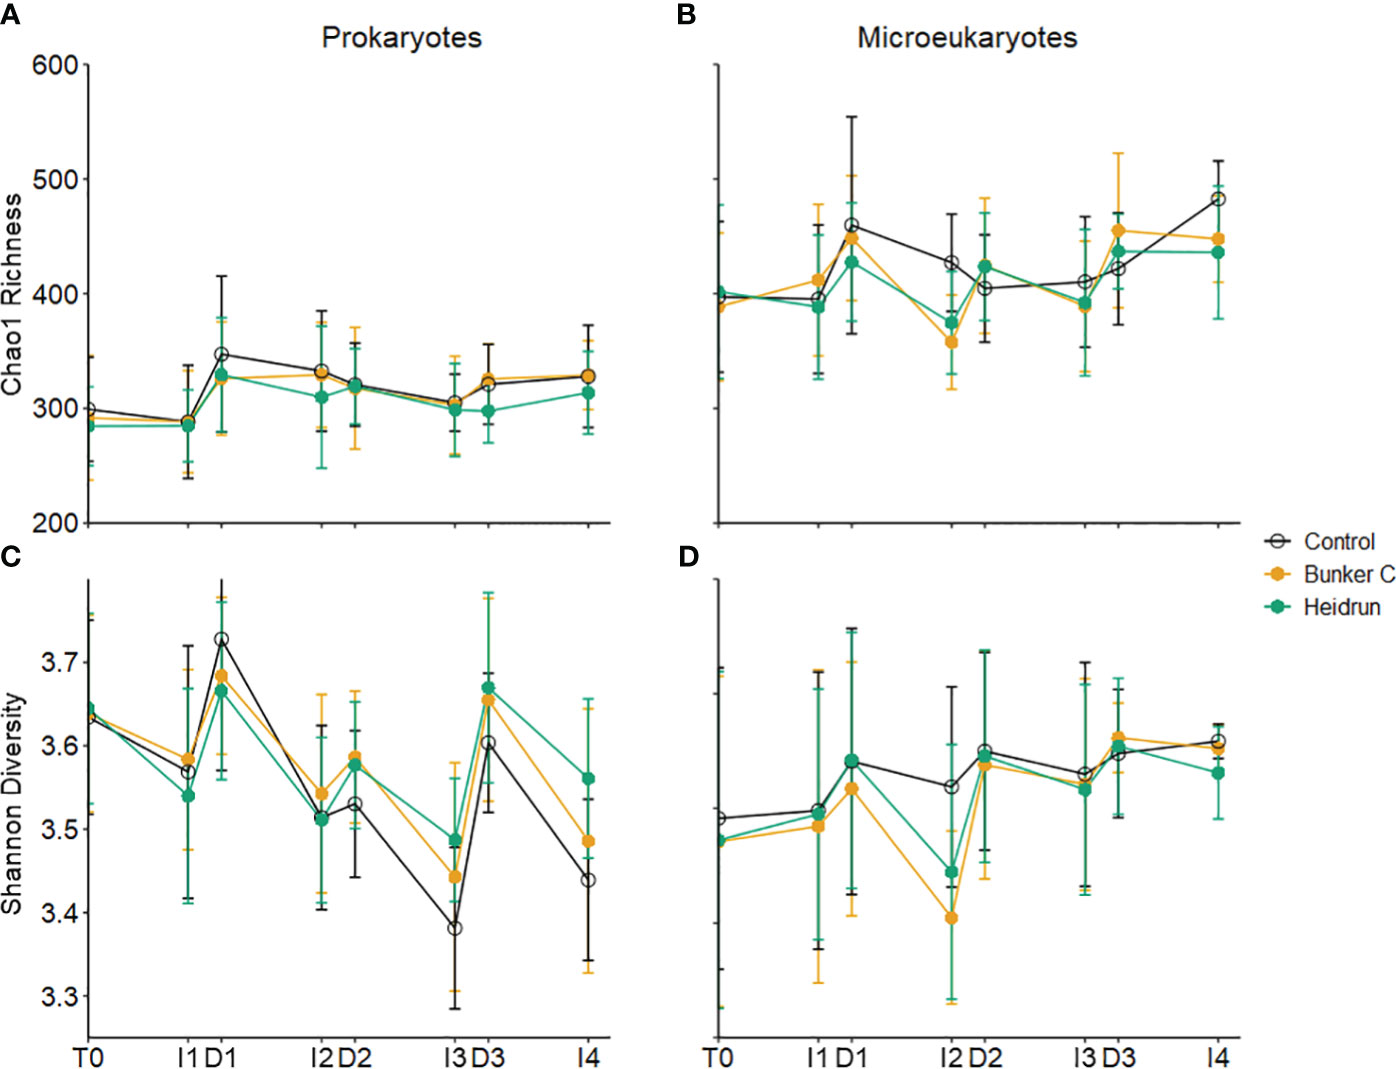
Figure 4 Average Chao1 richness (A, B) and Shannon diversity (C, D) for prokaryotes (left) and microeukaryotes (right). Error bars represent the standard deviation of n=9 per treatment. x-axis labels indicate the sampling period as described in Figure 1.
The initial prokaryote community structures in the three experiments were determined to be quite different from each other, with Exp2 and Exp 3 being more similar to each other than to Exp1 (Supplementary Table 4). As differences between experiments were higher than within experiments, each experiment was analyzed separately to identify treatment effects. There were significant effects of both treatment and time on the structure of the prokaryote communities based on PERMANOVA analysis, but the interaction term was not significant for any of the analyses (Supplementary Table 5). Time had the largest impact on the community structure, with 24 – 52% of the variation attributed to time and <7% of the variation due to treatment.
An examination of the most abundant OTUs across all three experiments, highlights the similarities in the communities across the Gulf and among treatments, even with differences in the overall community structures. Several of the abundant genera include known or putative hydrocarbon degraders. The prokaryote communities were always dominated by SAR11 Clade 1a (OTU-0), with Synechococcus (OTU-01), Planktomarina (OTU-02) and Actinomarina (OTU-03), occurring within the 5 most abundant OTUs in all experiments and treatments (Figure 5). Planktomarina has been shown to have genes associated with hydrocarbon degradation, although degradation activity has not been experimentally shown (Voget et al., 2015; Peeb et al., 2022). Several abundant OTUs were identified as members of the Flavobacteriaceae (OTU-04, OTU-07, OTU-14 and OTU-18). Overall, the relative abundances of these OTUs were constant across treatments. Several members of the Flavobacteriaceae have been shown to degrade hydrocarbons, with many associated with degradation of high molecular weight organic matter (Vila et al., 2010). Three Alteromondaceae OTUs were observed in the experiments, with one increasing in abundance in all three treatments, especially in Exp3 (OTU-05), another identified as Alteromonas (OTU-15), reaching higher average relative abundances with Heidrun and Bunker C and Glaciecola (OTU-12) increasing in all treatments, with the highest average relative abundances with Bunker C. Alteromonas, along with other members of the Alteromonadaceae, are known to be important degraders of PAHs (Jin et al., 2012; Martinez-Varela et al., 2022). While Glaciecola is frequently observed to increase in oil exposed seawater, its role in hydrocarbon degradation has not been confirmed (Sauret et al., 2014; Martinez-Varela et al., 2022; Peeb et al., 2022). An OTU identified as Marinomonas (OTU-30) also increased in all treatments over time in Exp1, but reached higher average relative abundances with oil and may represent a facultative PAH degrading organism (Melcher et al., 2002). Although many of the OTUs that showed increases in relative abundances with oil addition can degrade hydrocarbons, none are known to be obligate hydrocarbon degraders.
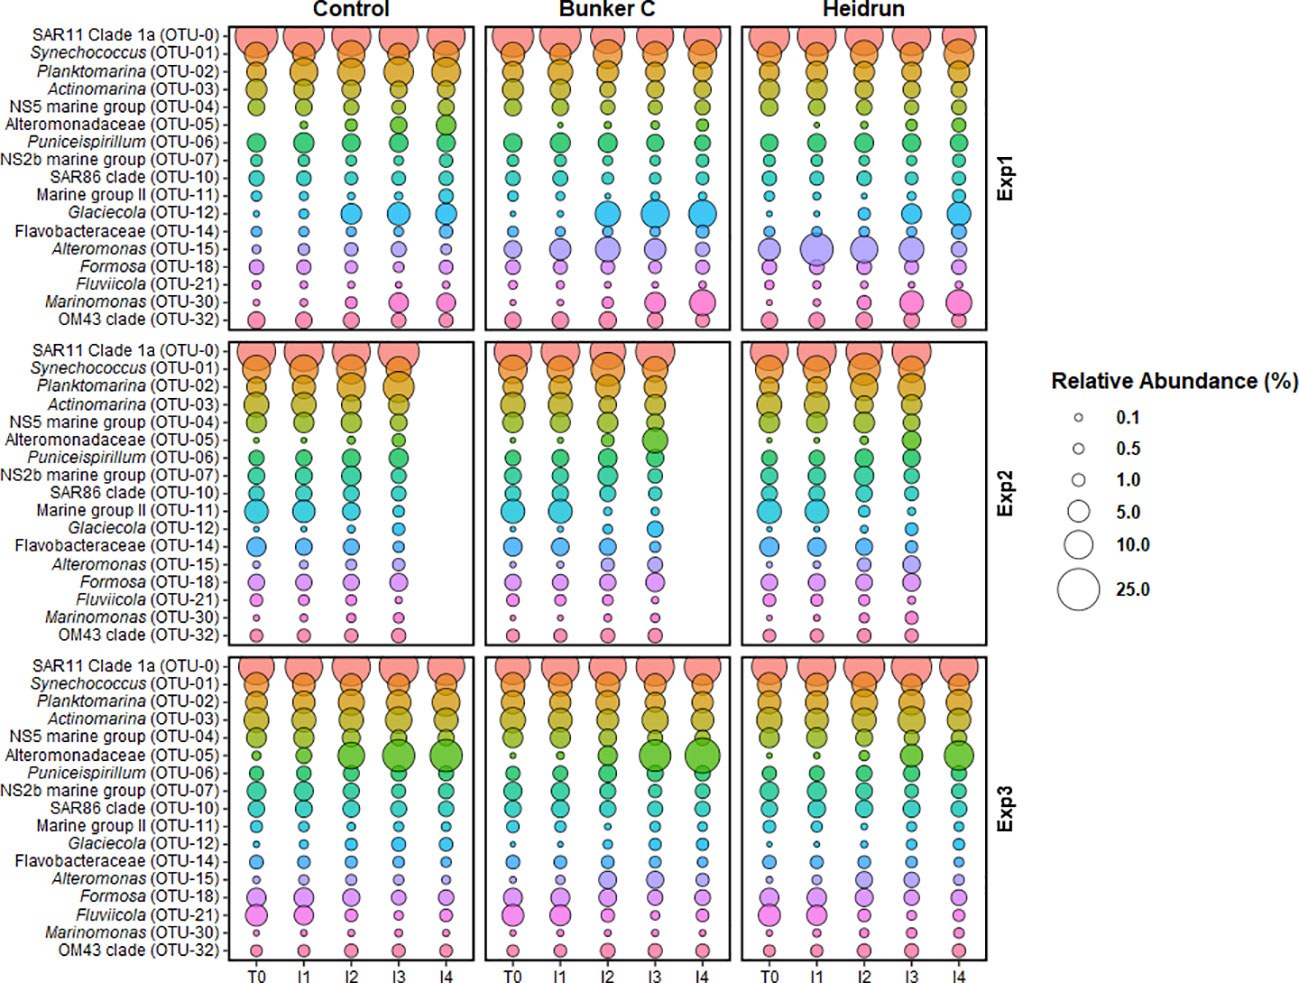
Figure 5 The average relative abundance of the abundant prokaryote OTUs at the end of each incubation period from all experiments. Because several OTUs were abundant in multiple experiments, 17 unique OTUs were identified within the 10 most abundant from each experiment. Bubble size is the average (n=3) of all enclosures for each treatment. OTUs are colored to facilitate visual comparisons across the figure, but have no experimental meaning.
Several of the other, poorly described clades (e.g., SAR86, SAR116 and OM43) may also have the potential to degrade hydrocarbons, but are unlikely to be obligate hydrocarbon degraders (Doyle et al., 2018; Sieradzki et al., 2021; Vigneron et al., 2023). The small amount of variability within the communities attributed to treatment may be a result of an initial community that already contains facultative hydrocarbon degraders, thus no wide spread change in the community structure was observed. In the absence of a radical change in the prokaryote community, decreases in hydrocarbons during I2 could be due to biodegradation being carried out by organisms already at high abundances.
3.6 Microeukaryote communities
Oil addition had a significant impact on some populations of phytoplankton based on GAMM analyses (Supplementary Table 2). The temporal trends in the chl a concentrations were influenced by treatment (Model 3, Supplementary Table 2), but the absolute concentrations were not (Figure 6A). While chl a concentrations decreased with oil compared to controls during I1, I2 saw a larger decrease, with the biggest decrease in Bunker C. After D2, abundances increased in oil treatments, eventually reaching the same concentrations as control enclosures by the end of the experiments. Eight different populations could be differentiated by flow cytometry, which were combined into three groups for analysis (Supplementary Figure 6). Five populations dominated by chl a were combined (eukaryote phytoplankton) and showed similar patterns to the chl a concentrations with the temporal patterns affected by treatment (Model 3, Supplementary Table 2; Figure 6B). This suggests that many of the small eukaryotic phytoplankton were well represented in the total chl a estimate, which is supported by the strong correlations between the abundance of the eukaryote phytoplankton and chl a concentrations (ρ = 0.8025, p<0.0001, n = 205). Phytoplankton enumerated by flow cytometry were dominated by Synechococcus-type cyanobacteria, which were likely not captured by the chl a analysis (ρ = -0.05, p = 0.47, n = 205) (Figure 6C). The abundance of Synechococcus varied over time, but there was no significant effect of treatment on abundances (Supplementary Table 2). The patterns observed here differ from those observed during 2 controlled spill experiments, where natural dilution occurred (Brussaard et al., 2016). In those spills, no decrease in to phytoplankton abundances were observed; however, decreases in chl a were detected under the slick 1 day after the spill compared to samples collected from outside the slick.
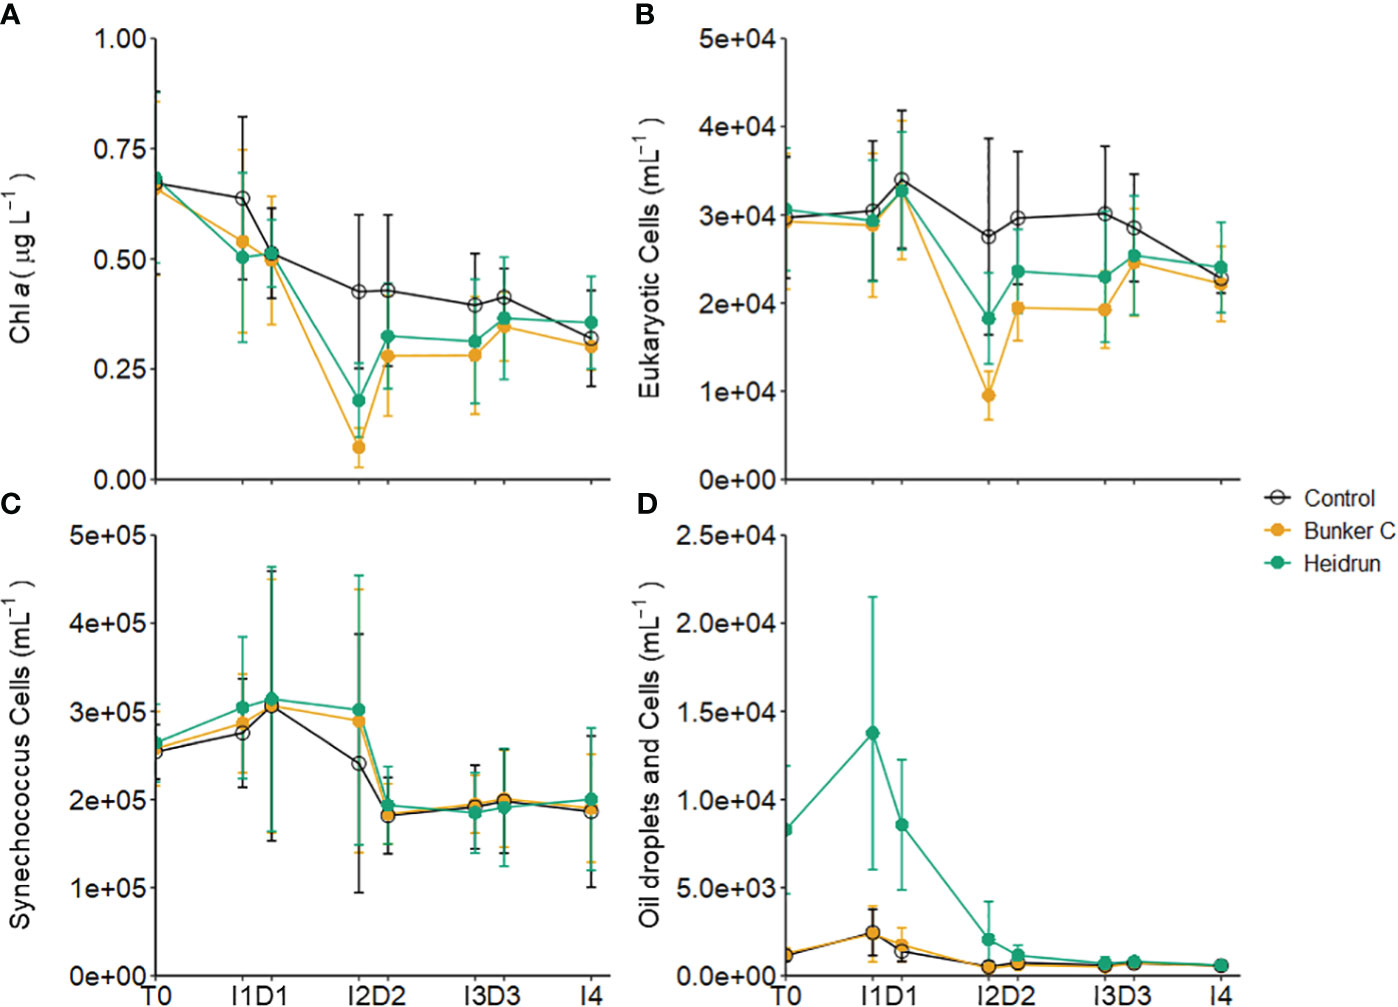
Figure 6 Average concentration of chl a (A), abundances of 5 populations of small eukaryotic phytoplankton (B) and Synechococcus-like cells (C) in the three experiments separated by treatment. Average abundances of the two populations with oil droplets and phytoplankton are also shown (D). Error bars are standard deviations of n=9 for each treatment. x-axis labels indicate the sampling period as described in Figure 1. See Supplementary Figure 6 for details on the populations identified.
Two of the phytoplankton populations were impacted by nanodroplets (~ 1 – 5 µm) of oil, especially in the Heidrun treatments (Supplementary Figure 6). These populations, when pooled, were strongly correlated with TPH (ρ = 0.7980, <0.0001, n = 205), Σalkylated PAHs (ρ = 0.6570, <0.0001, n = 205) and ΣPAHs (ρ = 0.5271, <0.0001, n = 205), and showed similar patterns to the hydrocarbon concentrations (Figures 2, 6D). A weak correlation between these populations and chl a (ρ = 0.3363, p<0.0001) indicates that some of these particles are phytoplankton cells; however, cells could not be differentiated from the microdroplets. As for the hydrocarbon concentrations, there was a significant effect of treatment on the trends in abundance of these populations over time (Model 3, Supplementary Table 2), with significantly higher abundances in Heidrun from the beginning of the experiment through to D2, after which abundances were lower than those observed in control and Bunker C enclosures. The mechanism, fate and impacts of these oil nanodroplets remains to be determined. They are smaller than the droplets implicated in marine snow formation (Passow, 2016), but could coalesce over time, increasing their diameter and either surfacing or contributing to marine snow.
A decrease in richness and diversity in oil treatments at I2 can be observed for the microeukaryote community, but this was not significantly different from the patterns observed in the control enclosures (Supplementary Table 2; Figures 4B, D). This was likely due to the relatively large variation across replicates. PERMANOVA identified significant differences in microeukaryote community structure for all three experiments, with main effects but no interactions (Supplementary Table 5). As for the prokaryotes (24 – 52%), variation attributed to time was high (19 – 46%) with <3% of the variation attributed to treatment for the microeukaryote community.
The largest impact of oil on the abundance, richness and diversity of the microeukaryote community was at I2. Photooxidation may have contributed to the decrease in hydrocarbons during I2 (Figure 2) and may have produced toxic byproducts that reduced the abundances of phytoplankton and the diversity of the microeukaryotes in oil treatments (Maki et al., 2001; Prince et al., 2003; Aeppli et al., 2012). The experiments were started in the evening, with I1 occurring during the night. In the dark, with high hydrocarbon concentrations, there was little impact on the abundance or diversity of the microeukaryote community. I2 occurred under full sunlight. While not as dramatic as the decrease observed for chl a and small eukaryotic phytoplankton, there was a small decrease in the abundance of prokaryotes (Figure 3) over this period, which could have been due to an increase in toxic photoproducts.
Treatment had a low overall impact on the relative abundances of the most abundant microeukaryotic OTUs (Figure 7), with the largest differences in the relative abundances of some taxa at I2 with oil compared to within the control enclosures. The largest differences were observed for Bunker C. The most abundant sequence across all experiments was a dinoflagellate (OTU-01), with the exception of the I2 oil samples from Exp1 when Chaetoceros (OTU-11) became most abundant in both Heidrun and Bunker C enclosures. Bathycoccus (OTU-03), a green algae, was abundant, with relatively consistent abundances across time and treatment in all experiments. In the North Sea experimental spills, Chlorophyceae were detected 2 h after the spill at 1.5 m, but were not detected after 24 h when PAH concentrations peaked (Brussaard et al., 2016). Concentrations were higher in the study during I1 compared to the North Sea spills and it is possible that Bathycoccus (OTU-03) is adapted to higher PAHs and may contribute to PAH degradation in conjunction with co-occurring bacteria (Borde et al., 2003). Another group that was shown to be highly sensitive to oil in the North Sea experiments were the Cryptophyceae (Brussaard et al., 2016). In this study, Teleaulax (OTU-10), affiliated with the Cryptophyceae, decreased in all oil treatments at I2, further supporting the sensitivity of this phyla to oil spills.
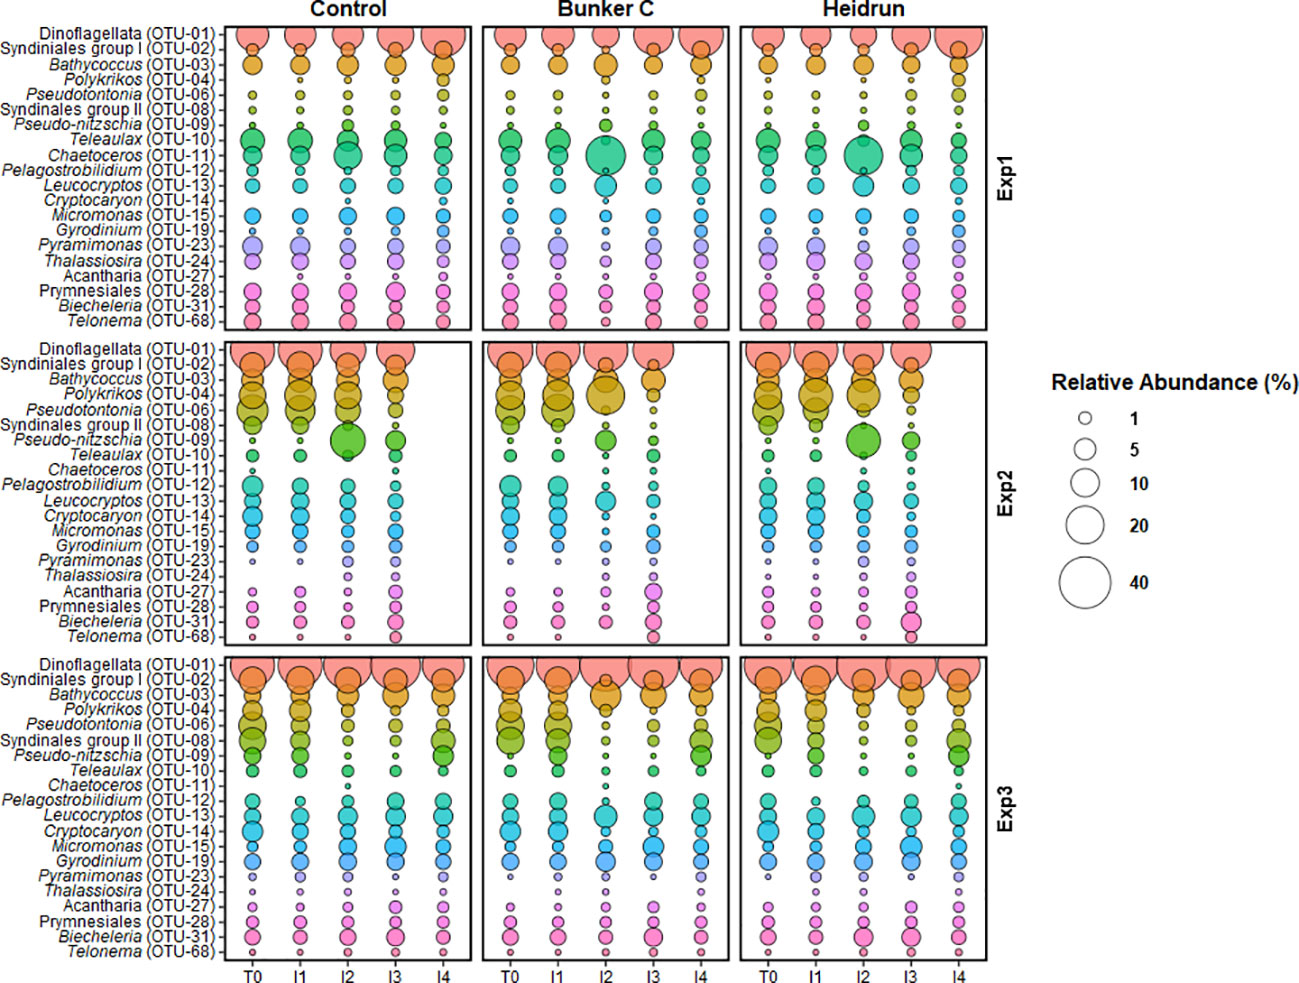
Figure 7 The average relative abundance of the abundant microeukaryote OTUs at the end of each incubation period from each experiment. Overlap between the 10 most abundant OTUs from the three experiments resulted in 20 unique OTUs being identified. Bubble size is the average (n=3) of all enclosures for each treatment. OTUs are colored to facilitate visual comparisons across the figure, but have no experimental meaning.
There were two abundant OTUs affiliated with the parasitic Syndiniales groups. One, affiliated with group 1 (OTU-02), decreased at I2 with Bunker C relative to controls in all experiments, with smaller decreases in response to Heidrun. The other OTU, affiliated with group II (OTU-08), was more abundant in Exp2 and Exp3 compared to Exp1, but decreased in all experiments in the enclosures with oil. Decreases in the abundance of parasitic could reflect decreases in their hosts in response to hydrocarbons or high susceptibility of their zoospores to oil.
Few abundant OTUs were observed to increase in abundance with oil. Leucocryptos (OTU-13) was elevated in the oiled enclosures in all experiments at I2 compared to the control enclosures, although its relative abundance only reached ~10% of the total population. This organism is a phagotrophic flagellate that was also observed to increase in response to diluted bitumen exposure (Cobanli et al., 2022). This organism may be responsible for grazing on the prokaryote community, potentially preventing an increase in the abundance of prokaryotes in response to oil. This increase in a heterotrophic flagellate is in contrast to that observed in the North Sea experimental spills, where both nanoflagellates and ciliates decreased significantly in response to oil (Brussaard et al., 2016). Ciliates can also contribute to high grazing rates on both prokaryotes and phytoplankton. In this study, Pseduotontonia (OTU-06) showed different responses to oil across the experiments. While abundances remained relatively constant in Exp1, they decreased in Exp2 and Exp3, with slightly larger decreases with oil. Cryptocaron (OTU-14) showed similar patterns, except for Exp1 where relative abundances were often below detection. The reduction in ciliates, would suggest that any grazing that may have limited the abundances of prokaryotes or phytoplankton was likely due to flagellates or dinoflagellates. Three dinoflagellate OTUs were abundant throughout these experiments, including the most abundant OTU, which has the potential to exert significant grazing pressure on the microbial communities. Polykrikos (OTU-04) also increased with Bunker C in Exp2 and may have contributed to the observed decrease in phytoplankton through grazing (Matsuyama et al., 1999; Lee et al., 2015). Biecheleria (OTU-31), the third dinoflagellate, was relatively constant over the experiments, with a slight decrease at I2, but as a mixotroph, may also have exerted grazing pressure on the prokaryote and phytoplankton communities (You et al., 2023); however, Biecheleria is also known prey item for Polykrikos (Yoo et al, 2013), highlighting the complexity of interactions in the marine microbial communities.
In Exp1, Chaetoceros, a diatom, had higher relative abundances in both the Bunker C and the Heidrun enclosures at I2 compared to the control enclosures. Chaetoceros was rarely detected in Exp2 and Exp3 and may have been restricted in abundance outside of Chaleur Bay. While the diatom Pseudo-nitzschia (OTU-09) increased in the control and Heidrun incubations in Exp2 at I2. Chaetoceros and Pseudo-nitzschia are both diatoms and grew well in some of the oil enclosures as has previously been observed (Ozhan and Bargu, 2014; Melliti Ben Garali et al., 2021). It has been suggested that diatoms may be somewhat resistant to oiling (Quigg et al., 2021), although Pseudo-nitzschia appeared to be inhibited by Bunker C during Exp2 and Thalassiosira (OTU-24) grew poorly with Bunker C in Exp1. These patterns may be a result of competition between diatom species for resources. Bacteria associated with the phycosphere of some diatoms have been shown to be capable of degrading PAHs, which could contribute to their success in oiled conditions (Gutierrez et al., 2014), while more susceptible diatoms may lack hydrocarbon degraders (Severin and Erdner, 2019). Diatoms did not appear to be well supported by the environmental conditions in Exp3, highlighting that variations in environmental conditions can select for different organisms in response to oil spills.
4 Conclusions
Dilution rapidly decreases the concentrations of hydrocarbons in surface seawater following a spill with a corresponding decrease in toxicity and minimal changes in the microbial communities. This suggests that for single, point source inputs of oil, the impacts of spills limited in space and time. As impacts are a function of both the concentration of the hydrocarbons and the time frame of the exposure, dilution effectively decreases the likelihood of widespread impacts on the planktonic microbial community (Varela et al., 2006; Brussaard et al., 2016). While dilution may be able to effectively minimize impacts of smaller, point source spills, larger and/or longer spills will likely overcome the effects of dilution, as has previously been observed [e.g. Deepwater Horizon (Hazen et al., 2010) and the Persian Gulf (Hassanshahian et al., 2020)]. The coastal prokaryote community in these experiments was dominated by organisms with the potential to degrade hydrocarbon. This means that there was no need for a large shift to a community dominated by obligate hydrocarbon degrading species. The dominance of dinoflagellates in these studies may have contributed to the lack of a bacterial bloom in response to hydrocarbons due to high grazing rates. Grazing may also have played some role in the patterns observed for the microeuarkyote community. Surprisingly, even at low hydrocarbon concentrations, large negative effects were observed on the abundance of phytoplankton and the diversity of the microeukaryote communities. The impacts occurred under sunlight suggesting photooxidation of hydrocarbons were responsible. Further investigation of transformation products due to photooxidation and/or biodegradation, especially impacts on microeukaryotes, is necessary to understand the full impacts of oil spills on microbial communities.
Data availability statement
The datasets presented in this study can be found in online repositories. The names of the repository/repositories and accession number(s) can be found below: https://www.ncbi.nlm.nih.gov/, PRJNA973930.
Ethics statement
The manuscript presents research on animals that do not require ethical approval for their study.
Author contributions
AO: Conceptualization, Formal analysis, Investigation, Project administration, Writing – original draft. HP: Writing – review & editing. MJ: Formal analysis, Writing – review & editing. SC: Conceptualization, Investigation, Writing – review & editing. GW: Conceptualization, Investigation, Writing – review & editing. CG: Formal analysis, Supervision, Writing – review & editing. BR: Formal analysis, Writing – review & editing, Investigation. TK: Conceptualization, Project administration, Writing – review & editing.
Funding
The author(s) declare financial support was received for the research, authorship, and/or publication of this article. This work was supported through the Government of Canada’s Ocean’s Protection Plan funding to the Centre for Offshore Oil, Gas and Energy Research group at Fisheries and Oceans Canada.
Acknowledgments
The authors would like to thank the crew of the RV Coriolis II for assistance in sampling and carrying out the experiments. We would also like to thank J. Mason, M. Faulkner, C. Ryther and C. Leherbauer for help in collecting and processing samples and J. Wasserscheid and M. Elias for processing amplicon samples.
Conflict of interest
The authors declare that the research was conducted in the absence of any commercial or financial relationships that could be construed as a potential conflict of interest.
Publisher’s note
All claims expressed in this article are solely those of the authors and do not necessarily represent those of their affiliated organizations, or those of the publisher, the editors and the reviewers. Any product that may be evaluated in this article, or claim that may be made by its manufacturer, is not guaranteed or endorsed by the publisher.
Supplementary material
The Supplementary Material for this article can be found online at: https://www.frontiersin.org/articles/10.3389/fmars.2024.1354063/full#supplementary-material
References
Abdel-Shafy H. I., Mansour M. S. M. (2016). A review on polycyclic aromatic hydrocarbons: Source, environmental impact, effect on human health and remediation. Egypt J. Pet 25, 107–123. doi: 10.1016/j.ejpe.2015.03.011
Aeppli C., Carmichael C. A., Nelson R. K., Lemkau K. L., Graham W. M., Redmond M. C., et al. (2012). Oil weathering after the Deepwater Horizon disaster led to the formation of oxygenated residues. Environ. Sci. Technol. 46, 8799–8807. doi: 10.1021/es3015138
Alguero-Muniz M., Alvarez-Fernandez S., Thor P., Bach L. T., Esposito M., Horn H. G., et al. (2017). Ocean acidification effects on mesozooplankton community development: Results from a long-term mesocosm experiment. PloS One 12, e0175851. doi: 10.1371/journal.pone.0175851
Almeda R., Wambaugh Z., Chai C., Wang Z., Liu Z., Buskey E. J. (2013). Effects of crude oil exposure on bioaccumulation of polycyclic aromatic hydrocarbons and survival of adult and larval stages of gelatinous zooplankton. PloS One 8, e74476. doi: 10.1371/journal.pone.0074476
Andersen K. S., Kirkegaard R. H., Karst S. M., Albertsen M. (2018). ampvis2: an R package to analyse and visualise 16S rRNA amplicon data, bioRxiv. Cold Spring Harbour Lab. doi: 10.1101/299537
Bacosa H. P., Erdner D. L., Liu Z. (2015). Differentiating the roles of photooxidation and biodegradation in the weathering of Light Louisiana Sweet crude oil in surface water from the Deepwater Horizon site. Mar. pollut. Bull. 95, 265–272. doi: 10.1016/j.marpolbul.2015.04.005
Ball A., Truskewycz A. (2013). Polyaromatic hydrocarbon exposure: an ecological impact ambiguity. Environ. Sci. pollut. Res. Int. 20, 4311–4326. doi: 10.1007/s11356-013-1620-2
Barron M. G., Conmy R. N., Holder E. L., Meyer P., Wilson G. J., Principe V. E., et al. (2018). Toxicity of Cold Lake Blend and Western Canadian Select dilbits to standard aquatic test species. Chemosphere 191, 1–6. doi: 10.1016/j.chemosphere.2017.10.014
Becker S., Aoyama M., Woodward E. M. S., Bakker K., Coverly S., Mahaffey C., et al. (2020). GO-SHIP Repeat Hydrography Nutrient Manual: The precise and accurate determination of dissolved inorganic nutrients in seawater, using continuous flow analysis methods. Front. Mar. Sci. 7. doi: 10.3389/fmars.2020.581790
Bertrand J. C., Rambeloarisoa E., Rontani J. F., Giusti G., Mattei G. (1983). Microbial degradation of crude oil in sea water in continuous culture. Biotechnol. Lett. 5, 567–572. doi: 10.1007/BF01184950
Boehm P. D., Neff J. M., Page D. S. (2007). Assessment of polycyclic aromatic hydrocarbon exposure in the waters of Prince William Sound after the Exxon Valdez oil spill: 1989-2005. Mar. pollut. Bull. 54, 339–356. doi: 10.1016/j.marpolbul.2006.11.025
Borde X., Guieysse B. T., Delgado O., Muñoz R., Hatti-Kaul R., Nugier-Chauvin C., et al. (2003). Synergistic relationships in algal–bacterial microcosms for the treatment of aromatic pollutants. Bioresour Technol. 86, 293–300. doi: 10.1016/S0960-8524(02)00074-3
Brussaard C. P. D., Payet J. P., Winter C., Weinbauer M. G. (2010). “Quantification of aquatic viruses by flow cytometry,” in Manual of Aquatic Viral Ecology. Eds. Wilhelm S. W., Weinbauer M. G., Suttle C. A. (Waco, TX: American Society of Limnology and Oceanography), 102–109. doi: 10.4319/mave.2010.978-0-9845591-0-7.102
Brussaard C. P., Peperzak L., Beggah S., Wick L. Y., Wuerz B., Weber J., et al. (2016). Immediate ecotoxicological effects of short-lived oil spills on marine biota. Nat. Commun. 7, 11206. doi: 10.1038/ncomms11206
Calderó-Pascual M., Yıldız D., Yalçın G., Metin M., Yetim S., Fiorentin C., et al. (2021). The importance of allochthonous organic matter quality when investigating pulse disturbance events in freshwater lakes: a mesocosm experiment. Hydrobiologia 849, 3905–3929. doi: 10.1007/s10750-021-04757-w
Cappello S., Denaro R., Genovese M., Giuliano L., Yakimov M. M. (2007). Predominant growth of Alcanivorax during experiments on “oil spill bioremediation” in mesocosms. Microbiol. Res. 162, 185–190. doi: 10.1016/j.micres.2006.05.010
Chang J. C., Taylor P. B., Leach F. R. (1981). Use of the Microtox® assay system for environmental samples. B Environ. Contam Tox 26. doi: 10.3389/fmicb.2012.00357
Chronopoulou P. M., Sanni G. O., Silas-Olu D. I., van der Meer J. R., Timmis K. N., Brussaard C. P., et al. (2015). Generalist hydrocarbon-degrading bacterial communities in the oil-polluted water column of the North Sea. Microb. Biotechnol. 8, 434–447. doi: 10.1111/1751-7915.12176
Cobanli S. E., Wohlgeschaffen G., Ryther C., Macdonald J., Gladwell A., Watts T., et al. (2022). Microbial community response to simulated diluted bitumen spills in coastal seawater and implications for oil spill response. FEMS Microbiol. Ecol. 98, fiac033. doi: 10.1093/femsec/fiac033
Di Toro D. M., Mcgrath J. A., Stubblefield W. A. (2007). Predicting the toxicity of neat and weathered crude oil: toxic potential and the toxicity of saturated mixtures. Environ. Toxicol. Chem. 26, 24–36. doi: 10.1897/06174r.1
Doyle S. M., Whitaker E. A., De Pascuale V., Wade T. L., Knap A. H., Santschi P. H., et al. (2018). Rapid formation of microbe-oil aggregates and changes in community composition in coastal surface water following exposure to oil and the dispersant Corexit. Front. Microbiol. 9. doi: 10.3389/fmicb.2018.00689
Fox J., Marquez M. M., Bouchet-Valat M. (2023). Rcmdr: R Commander. (R package version 2.9-1). Available at: https://socialsciences.mcmaster.ca/jfox/Misc/Rcmdr/.
Gertler C., Näther D. J., Gerdts G., Malpass M. C., Golyshin P. N. (2010). A mesocosm study of the changes in marine flagellate and ciliate communities in a crude oil bioremediation trial. Microb. Ecol. 60, 180–191. doi: 10.1007/s00248-010-9660-3
González J. J., Vinas L., Franco M. A., Fumega J., Soriano J. A., Grueiro G., et al. (2006). Spatial and temporal distribution of dissolved/dispersed aromatic hydrocarbons in seawater in the area affected by the Prestige oil spill. Mar. pollut. Bull. 53, 250–259. doi: 10.1016/j.marpolbul.2005.09.039
Gutierrez T., Rhodes G., Mishamandani S., Berry D., Whitman W. B., Nichols P. D., et al. (2014). Polycyclic aromatic hydrocarbon degradation of phytoplankton-associated Arenibacter spp. and description of Arenibacter algicola sp. nov., an aromatic hydrocarbon-degrading bacterium. Appl. Environ. Microbiol. 80, 618–628. doi: 10.1128/AEM.03104-13
Gutierrez T., Singleton D. R., Berry D., Yang T., Aitken M. D., Teske A. (2013). Hydrocarbon-degrading bacteria enriched by the Deepwater Horizon oil spill identified by cultivation and DNA-SIP. ISME J. 7, 2091–2104. doi: 10.1038/ismej.2013.98
Hassanshahian M., Amirinejad N., Askarinejad Behzadi M. (2020). Crude oil pollution and biodegradation at the Persian Gulf: A comprehensive and review study. J. Environ. Health Sci. Eng. 18, 1415–1435. doi: 10.1007/s40201-020-00557-x
Hazen T. C., Dubinsky E. A., Desantis T. Z., Andersen G. L., Piceno Y. M., Singh N., et al. (2010). Deep-sea oil plume enriches indigenous oil-degrading bacteria. Science 330, 204. doi: 10.1126/science.1195979
Holm-Hansen O., Lorenzen C. J., Holmes R. W., Strickland J. (1965). Fluorometric determination of chlorophyll. ICES J. Mar. Sci. 30, 3–15. doi: 10.1093/icesjms/30.1.3
Horowitz A., Atlas R. M. (1977). Continuous open flow-through system as a model for oil degradation in the Arctic Ocean. Appl. Environ. Microbiol. 33, 647–653. doi: 10.1128/aem.33.3.647-653.1977
Jin H. M., Kim J. M., Lee H. J., Madsen E. L., Jeon C. O. (2012). Alteromonas as a key agent of polycyclic aromatic hydrocarbon biodegradation in crude oil-contaminated coastal sediment. Environ. Sci. Technol. 46, 7731–7740. doi: 10.1021/es3018545
Jung S. W., Park J. S., Kown O. Y., Kang J.-N., Shim W. J., Kim Y.-O. (2010). Effects of crude oil on marine microbial communities in short term outdoor microcosms. J. Microbiol. 48, 594–600. doi: 10.1007/s12275-010-0199-2
King T., Robinson B., Ryan S., Lu Y., Zhou Q., Ju L., et al. (2015). Fate of Chinese and Canadian oils treated with dispersant in a wave tank. Proceedings of the 38th AMOP Technical Seminar (Vancouver, BC), Environment and Climate Change Canada. 798–811. doi: 10.13140/RG.2.1.3019.0248
Laurentian Pilotage Authority. (2022). Annual Report 2022. Available at: www.pilotagestlaurent.gc.ca/files/pdf/Rapport_Annuel/LPA_Annual_Report_2022_Web.pdf (Accessed October 16, 2023).
Lee M. J., Jeong H. J., Lee K. H., Jang S. H., Kim J. H., Kim K. Y. (2015). Mixotrophy in the nematocyst–taeniocyst complex-bearing phototrophic dinoflagellate Polykrikos hartmannii. Harmful Algae 49, 124–134. doi: 10.1016/j.hal.2015.08.006
Lee K., Nedwed T., Prince R. C., Palandro D. (2013). Lab tests on the biodegradation of chemically dispersed oil should consider the rapid dilution that occurs at sea. Mar. pollut. Bull. 73, 314–318. doi: 10.1016/j.marpolbul.2013.06.005
Lekunberri I., Calvo-Díaz A., Teira E., Morán X. A. G., Peters F., Nieto-Cid M., et al. (2010). Changes in bacterial activity and community composition caused by exposure to a simulated oil spill in microcosm and mesocosm experiments. Aquat Microb. Ecol. 59, 169–183. doi: 10.3354/ame01380
Maki H., Sasaki T., Harayama S. (2001). Photo-oxidation of biodegraded crude oil and toxicity of the photo-oxidized products. Chemosphere 44, 1145–1151. doi: 10.1016/s0045-6535(00)00292-7
Marie D., Rigaut-Jalabert F., Vaulot D. (2014). An improved protocol for flow cytometry analysis of phytoplankton cultures and natural samples. Cytometry A 85, 962–968. doi: 10.1002/cyto.a.22517
Martinez-Varela A., Casas G., Berrojalbiz N., Piña B., Dachs J., Vila-Costa M. (2022). Polycyclic aromatic hydrocarbon degradation in the sea-surface microlayer at coastal Antarctica. Front. Microbiol. 13. doi: 10.3389/fmicb.2022.907265
Matsuyama Y., Miyamoto M., Kotani Y. (1999). Grazing impacts of the heterotrophic dinoflagellate Polykrikos kofoidii on a bloom of Gymnodinium catenatum. Aquat. Microbial Ecol. 17, 91:98. doi: 10.3354/ame017091
Melcher R. J., Apitz S. E., Hemmingsen B. B. (2002). Impact of irradiation and polycyclic aromatic hydrocarbon spiking on microbial populations in marine sediment for future aging and biodegradability studies. Appl. Environ. Microbiol. 68, 2858–2868. doi: 10.1128/AEM.68.6.2858-2868.2002
Melliti Ben Garali S., Sahraoui I., Ben Othman H., Kouki A., de la Iglesia P., Diogène J., et al. (2021). Capacity of the potentially toxic diatoms Pseudo-nitzschia mannii and Pseudo-nitzschia hasleana to tolerate polycyclic aromatic hydrocarbons. Ecotoxicol Environ. Saf. 214, 112082. doi: 10.1016/j.ecoenv.2021.112082
Mueller D. C., Bonner J. S., Mcdonald S. J., Autenrieth R. L., Donnelly K. C., Lee K., et al. (2003). The use of toxicity bioassays to monitor the recovery of oiled wetland sediments. Environ. Toxicol. Chem. 22, 1945–1955. doi: 10.1897/02-325
National Academies of Sciences, Engineering, and Medicine (2022). Oil in the Sea IV (Washington, DC: The National Academies Press). doi: 10.17226/26410
Oksanen J., Blanchet F. G., Friendly M., Kindt R., Legendre P., McGlinn D., et al. (2022). vegan: Community Ecology Package (R package version 2.6-4). Available at: https://CRAN.R-project.org/package=vegan.
Ortmann A. C., Anders J., Shelton N., Gong L., Moss A. G., Condon R. H. (2012). Dispersed oil disrupts microbial pathways in pelagic food webs. PloS One 7, e42548. doi: 10.1371/journal.pone.0042548
Ortmann A. C., Cobanli S. E., Wohlgeschaffen G., Macdonald J., Gladwell A., Davis A., et al. (2020). Measuring the fate of different diluted bitumen products in coastal surface waters. Mar. pollut. Bull. 153, 111003. doi: 10.1016/j.marpolbul.2020.111003
Ozhan K., Bargu S. (2014). Distinct responses of Gulf of Mexico phytoplankton communities to crude oil and the dispersant corexit((R)) Ec9500A under different nutrient regimes. Ecotoxicology 23, 370–384. doi: 10.1007/s10646-014-1195-9
Ozhan K., Parsons M. L., Bargu S. (2014). How were phytoplankton affected by the deepwater horizon oil spill? BioScience 64, 829–836. doi: 10.1093/biosci/biu117
Parada A. E., Needham D. M., Fuhrman J. A. (2016). Every base matters: assessing small subunit rRNA primers for marine microbiomes with mock communities, time series and global field samples. Environ. Microbiol. 18, 1403–1414. doi: 10.1111/1462-2920.13023
Parsons M. L., Morrison W., Rabalais N. N., Turner R. E., Tyre K. N. (2015). Phytoplankton and the Macondo oil spill: A comparison of the 2010 phytoplankton assemblage to baseline conditions on the Louisiana shelf. Environ. pollut. 207, 152–160. doi: 10.1016/j.envpol.2015.09.019
Passow U. (2016). Formation of rapidly-sinking, oil-associated marine snow. Deep Sea Res. Part II 129, 232–240. doi: 10.1016/j.dsr2.2014.10.001
Peeb A., Dang N. P., Truu M., Nolvak H., Petrich C., Truu J. (2022). Assessment of hydrocarbon degradation potential in microbial communities in arctic sea ice. Microorganisms 10, 328. doi: 10.3390/microorganisms10020328
Prince R. C., Garrett R. M., Bare R. E., Grossman M. J., Townsend T., Suflita J. M., et al. (2003). The roles of photooxidation and biodegradation in long-term weathering of crude and heavy fuel oils. Spill Sci. Technol. B 8, 145–156. doi: 10.1016/s1353-2561(03)00017-3
Quast C., Pruesse E., Yilmaz P., Gerken J., Schweer T., Yarza P., et al. (2013). The SILVA ribosomal RNA gene database project: improved data processing and web-based tools. Nucleic Acids Res. 41, D590–D596. doi: 10.1016/s1353-2561(03)00017-3
Quigg A., Parsons M., Bargu S., Ozhan K., Daly K. L., Chakraborty S., et al. (2021). Marine phytoplankton responses to oil and dispersant exposures: Knowledge gained since the Deepwater Horizon oil spill. Mar. pollut. Bull. 164, 112074. doi: 10.1016/j.marpolbul.2021.112074
R Core Team. (2023). R: A Language and Environment for Statistical Computing (Vienna, Austria). Available at: https://www.R-project.org.
Redmond M. C., Valentine D. L. (2012). Natural gas and temperature structured a microbial community response to the Deepwater Horizon oil spill. Proc. Nat. Acad. Sci. U.S.A. 109, 20292–20297. doi: 10.1073/pnas.1108756108
Ryther C. M., Ortmann A. C., Wohlgeschaffen G., Robinson B. J. (2022). Temperate coastal microbial communities rapidly respond to low concentrations of partially weathered diesel. Microb. Ecol. 84, 1122–1132. doi: 10.1007/s00248-021-01939-w
Sauret C., Severin T., Vetion G., Guigue C., Goutx M., Pujo-Pay M., et al. (2014). ‘Rare biosphere’ bacteria as key phenanthrene degraders in coastal seawaters. Environ. pollut. 194, 246–253. doi: 10.1016/j.envpol.2014.07.024
Severin T., Erdner D. L. (2019). The ohytoplankton taxon-sependent oil response and its microbiome: Correlation but not causation. Front. Microbiol. 10. doi: 10.3389/fmicb.2019.00385
Sieradzki E. T., Morando M., Fuhrman J. A. (2021). Metagenomics and quantitative stable isotope probing offer insights into metabolism of polycyclic aromatic hydrocarbon degraders in chronically polluted seawater. mSystems 6. doi: 10.1128/mSystems.00245-21
Simard Y., Roy N., Giard S., Aulanier F. (2019). North Atlantic right whale shift to the Gulf of St. Lawrence in 2015, revealed by long-term passive acoustics. Endanger Species Res. 40, 271–284. doi: 10.3354/esr01005
Simpson G. L. (2022). permute: Functions for Generating Restricted Permutations of Data (R package version 0.9-7). Available at: https://CRAN.R-project.org/package=permute.
Stoeck T., Bass D., Nebel M., Christen R., Jones M. D. M., Breiner H. W., et al. (2010). Multiple marker parallel tag environmental DNA sequencing reveals a highly complex eukaryotic community in marine anoxic water. Mol. Ecol. 19, 21–31. doi: 10.1111/j.1365-294X.2009.04480.x
Stoyanovich S., Yang Z., Hanson M., Hollebone B. P., Orihel D. M., Palace V., et al. (2022). Fate of polycyclic aromatic compounds from diluted bitumen spilled into freshwater limnocorrals. Sci. Total Environ. 819, 151993. doi: 10.1016/j.scitotenv.2021.151993
Tremblay J., Yergeau E. (2019). Systematic processing of ribosomal RNA gene amplicon sequencing data. Gigascience 8, giz146. doi: 10.1093/gigascience/giz146
Tremblay J., Yergeau E., Fortin N., Cobanli S., Elias M., King T. L., et al. (2017). Chemical dispersants enhance the activity of oil- and gas condensate-degrading marine bacteria. ISME J. 11, 2793–2808. doi: 10.1038/ismej.2017.129
Varela M., Bode A., Lorenzo J., Álvarez-Ossorio M. T., Miranda A., Patrocinio T., et al. (2006). The effect of the “Prestige” oil spill on the plankton of the N-NW Spanish coast. Mar. pollut. Bull. 53, 272–286. doi: 10.1016/j.marpolbul.2005.10.005
Vergeynst L., Greer C. W., Mosbech A., Gustavson K., Meire L., Poulsen K. G., et al. (2019). Biodegradation, photo-oxidation, and dissolution of petroleum compounds in an arctic fjord during summer. Environ. Sci. Technol. 53, 12197–12206. doi: 10.1021/acs.est.9b03336
Vigneron A., Cruaud P., Lovejoy C., Vincent W. F. (2023). Genomic insights into cryptic cycles of microbial hydrocarbon production and degradation in contiguous freshwater and marine microbiomes. Microbiome 11, 104. doi: 10.1186/s40168-023-01537-7
Vila J., Maria Nieto J., Mertens J., Springael D., Grifoll M. (2010). Microbial community structure of a heavy fuel oil-degrading marine consortium: linking microbial dynamics with polycyclic aromatic hydrocarbon utilization. FEMS Microbiol. Ecol. 73, 349–362. doi: 10.1111/j.1574-6941.2010.00902.x
Voget S., Wemheuer B., Brinkhoff T., Vollmers J., Dietrich S., Giebel H. A., et al. (2015). Adaptation of an abundant Roseobacter RCA organism to pelagic systems revealed by genomic and transcriptomic analyses. ISME J. 9, 371–384. doi: 10.1038/ismej.2014.134
Williams A. K., Bacosa H. P., Quigg A. (2017). The impact of dissolved inorganic nitrogen and phosphorous on responses of microbial plankton to the Texas City “Y” oil spill in Galveston Bay, Texas (USA). Mar. Pollut. Bull 121, 32–44. doi: 10.1016/j.marpolbul.2017.05.033
Wood S. N. (2004). Stable and efficient multiple smoothing parameter estimation for generalized additive models. J. Am. Stat. Assoc. 99, 673–686. doi: 10.1198/016214504000000980
Wood S. N. (2011). Fast stable restricted maximum likelihood and marginal likelihood estimation of semiparametric generalized linear models. J. R Stat. Soc. B 73, 3–36. doi: 10.1111/j.1467-9868.2010.00749.x
Wood S. N., Pya N., Säfken B. (2017). Smoothing parameter and model selection for general smooth models. J. Am. Stat. Assoc. 111, 1548–1563. doi: 10.1080/01621459.2016.1180986
Yoo Y. D., Yoon E. Y., Lee K. H., Kang N. S., Jeong H. J. (2013). Growth and ingestion rates of heterotrophic dinoflagellates and a ciliate on the mixotrophic dinoflagellate Biecheleria cincta. Algae 28, 343–354. doi: 10.4490/algae.2013.28.4.343
You J. H., Jeong H. J., Ok J. H., Kang H. C., Park S. A., Eom S. H., et al. (2023). Effects of temperature on the autotrophic and mixotrophic growth rates of the dinoflagellate Biecheleria cincta and its spatiotemporal distributions under current temperature and global warming conditions. Mar. Biol. 170, 15. doi: 10.1007/s00227-022-04167-z
Keywords: oil spill, dilution, natural attenuation, degradation, microbial diversity
Citation: Ortmann AC, Poon HY, Ji M, Cobanli SE, Wohlgeschaffen G, Greer CW, Robinson B and King TL (2024) Rapid dilution effectively decreases hydrocarbons following small oil spills, but impacts on microeukaryote communities are still observed. Front. Mar. Sci. 11:1354063. doi: 10.3389/fmars.2024.1354063
Received: 11 December 2023; Accepted: 23 January 2024;
Published: 12 February 2024.
Edited by:
Dongliang Wang, Hubei Polytechnic University, ChinaReviewed by:
Qian Zhu, Hubei Normal University, ChinaLisa Voskuhl, University of Duisburg-Essen, Germany
Copyright © 2024 Ortmann, Poon, Ji, Cobanli, Wohlgeschaffen, Greer, Robinson and King. This is an open-access article distributed under the terms of the Creative Commons Attribution License (CC BY). The use, distribution or reproduction in other forums is permitted, provided the original author(s) and the copyright owner(s) are credited and that the original publication in this journal is cited, in accordance with accepted academic practice. No use, distribution or reproduction is permitted which does not comply with these terms.
*Correspondence: Alice C. Ortmann, QWxpY2UuT3J0bWFubkBkZm8tbXBvLmdjLmNh