 Naoto Matsubara
 Yoshinori Aoki
 Hidetada Kiyofuji
- Fisheries Resources Institute, Japan Fisheries Research and Education Agency, Yokohama, Kanagawa, Japan
Introduction: Evaluating the thermal tolerance of commercially valuable tuna species and their behavioral responses to the limits of this tolerance is essential for evaluating the effects of changes in water temperature driven by global climate change on their distribution and fisheries. We aimed to identify the lower thermal tolerance (Tmin) of juvenile albacore tuna (ALB) and evaluate their behavioral response to Tmin by focusing on wild behavior in the northern distributional limit. Additionally, we investigated how vertical behavior is linked to the vulnerability of ALB to Japanese longline (LL) and pole-and-line (PL) fisheries.
Methods: We explored the swimming depths and water temperatures of four previously reported tagged individuals migrating from subtropical to temperate areas and identified Tmin and its depths in the water column as unfavorable depths (DTmin). To investigate the spatial patterns of ALB fishery grounds for LL and PL fisheries, we analyzed hotspots specific to each type of gear using the historical Japanese fishery logbook for both fisheries.
Results: Comparisons of the fishery grounds between the two fisheries revealed that PL hotspots appeared in the northern areas, while LL hotspots were in the southern regions. We also discovered that the vertical distribution of ALB became shallow in high-latitude areas, which were strongly affected by DTmin shallowing at high latitudes.
Discussion: These results provide evidence of a behavioral response among juvenile ALB that avoids Tmin by remaining at the surface. We discuss the implications of the results for latitudinal changes in the vulnerability of ALB to fisheries in terms of the overlapping depth between ALB vertical habitats and the gear-setting depth for each fishery.
1 Introduction
Understanding the impact of climate change on the geographical distribution of commercially valuable tuna species is crucial for the sustainable management of their stocks (Arrizabalaga et al., 2015; Lehodey et al., 2015; Muhling et al., 2015; Ijima and Jusup, 2023). Evaluating thermal tolerance of target species and their behavioral responses is essential to predict the effect temperature changes on their distribution and consequently on fisheries (Sunday et al., 2012) because temperature is a pivotal abiotic factor in tuna physiology (Block et al., 1997; Kitagawa et al., 2001; Boyce et al., 2008; Bernal et al., 2017). Thermal preferences have been used to explain tuna fishery grounds from the perspective of the sea surface environment (e.g., Zainuddin et al., 2004; Arrizabalaga et al., 2015; Ducharme-Barth et al., 2022). More importantly, the unique physiological features that have enabled tuna to expand their niche into deep and cold environments should be addressed in terms of the importance of the vertical environment and its impact on fisheries availability (Williams et al., 2015; Bernal et al., 2017). However, few studies have adopted a vertical perspective in their statistical modeling approach (Arrizabalaga et al., 2015; Mondal et al., 2022) and mechanistic approach (Lehodey et al., 2015; Senina et al., 2020) via lower thermal tolerance (Tmin) to explain the tuna fishery grounds in the context of ecological links between the vertical distribution of the fishery target species and their vulnerability to human fishing activity.
Albacore tuna (ALB, Thunnus alalunga) is a highly migratory species distributed in areas ranging from tropical to temperate regions and consists of the northern and southern stock in the Pacific Ocean (Nikolic et al., 2017). In the northern Pacific Ocean, migration depends on the life stage (Ijima et al., 2023). Adult ALB, which matures at 90 cm and 5 years of age (Nikolic et al., 2017), is mainly distributed in tropical to subtropical areas, whereas juveniles migrate toward temperate areas at the boundary of their habitat and exhibit east- and west-ward migration (Ichinokawa et al., 2008; Ijima et al., 2023). Pacific-scale migration concerning life stages brings a stable catch for countries accessible to this resource (ISC, 2023). The annual catch averaged over the stock assessment period (1994–2021) in the northern Pacific Ocean was 77,101 t, and 66% of the total catch for the last 5 years has been harvested by Japanese fleets, mostly by pole-and-line (PL) and longline (LL) fisheries (ISC, 2023). Most Japanese catch is occupied by juveniles and small individuals by surface fisheries of PL in high-latitude areas, whereas LL tends to capture adults in low-latitude areas (ISC, 2023).
The latitudinal change in the gear vulnerability of ALB in each fishery is explained by variations in the vertical habitats of ALB regarding prey utilization (Williams et al., 2015). The vertical habitat reflects prey environments (Childers et al., 2011; Williams et al., 2015), facilitating the vertical aggregation of ALB at favorable depths for feeding. In addition, the vertical distribution of ALB is substantially affected by thermal preferences, not only with diet reflecting their preferences, but also the vertical distribution of prey species (Domokos et al., 2007; Childers et al., 2011; Williams et al., 2015), which are dictated by the thermal structure (Williams et al., 2015). These observations capture the positive response to seek a better depth within their acceptable vertical range; however, the behavior of ALB at physiologically unacceptable depths (DTmin) where Tmin exists in the thermal profiles remains unclear, particularly as juveniles are mainly distributed along their northern boundaries and experience Tmin vertically and horizontally; Tmin in juvenile ALB needs to be estimated, as the currently available Tmin estimation exists only for the adult stage (Boyce et al., 2008).
The Kuroshio–Oyashio extension area off Japan, renowned as a tuna fishery ground (Zainuddin et al., 2004), is a thermo-physiological northern distribution limit for juvenile tuna (Nikolic et al., 2017; Fujioka et al., 2018; Kiyofuji et al., 2019) because of the cold Oyashio current (Kawai, 1972; Yasuda, 2003), making this area suitable for investigating Tmin. The Tmin of juvenile skipjack tuna (Katsuwonus pelamis) obtained from wild-tagged individuals in this area (Kiyofuji et al., 2019) agrees well with the minimum daily average temperature (18°C) observed in laboratory experiments (Barkley et al., 1978; Dizon and Yuen, 1978). The agreement between the field data and laboratory experiments strengthens the validity of the Tmin estimation based on wild-tagged individuals at the boundary of their habitats. The tagged ALB in this area, as previously described by Hokimoto and Kiyofuji (2014), exhibited consecutive migrations from subtropical to temperate areas. The dataset, including the ambient water temperature and swimming depths recorded by these tags, enabled us to estimate Tmin and its effect on vertical habitats.
The purpose of this study is to identify Tmin and behavioral responses to Tmin by comparing their vertical distributions with DTmin within the thermal profiles. Our analysis extracted new knowledge on juvenile ALB ecology from a previously reported dataset of water temperature and swimming depth during their migration toward the boundaries of their habitats. We further discuss how their behavior is linked to changes in the vulnerability of LL and PL fisheries.
2 Materials and methods
2.1 Data for LL and PL fishery
We analyzed the Japanese LL logbook for 1996–2021 and the Japanese PL logbook for 1972–2020. These logbooks provide the most informative and comprehensive information regarding fishing operations because data submission is mandatory for vessels licensed by the Japanese government. They provide daily information on fishing operations, including dates, locations at noon (the resolution of the fishery location is 1 arc degree), sea surface temperature (SST, available since 2013 for PL), and catch weight. Other gear-specific information included the number of fish caught, hooks for LL, and poles for PL. ALB is a target species for both fisheries; however, these fisheries switch targets to other species depending on the availability of ALB (season and area). To focus on the ALB in subtropical and temperate areas in the northwestern and central Pacific Ocean (20°N<latitude<50°N, 130°E<longitude<210°E), we extracted records that had an ALB catch greater than 0. Unrealistic logbook records, such as those with extremely high catches and a low number of hooks (hooks<1,000) and poles (poles<3), were removed as outliers.
To compare the spatial patterns of fishery grounds and ALB hotspots between the LL and PL fisheries off Japan, we spatially calculated the catch per unit effort (CPUE) by dividing the catch by effort in a 1°×1° grid for each fishery. The efforts of LL and PL were defined as the number of hooks/1000 and poles, respectively. CPUEs were normalized by dividing by the largest value for each fishery, resulting in a normalized nominal CPUE to make a visual comparison between fisheries easier.
2.2 Tagging procedure
A series of tagging studies were conducted for ALB in three locations (around the coastal region: 26° to 30°N and 135° to 148°E, and off Japan: 30° to 34°N and 133° to 137°E, 40° to 42°N, and 154° to 155°E) from 2000 to 2004 with two types of archival tags. The tags used were LTD2310 (Lotek Wireless Inc., USA) and NMT v1.1 (NWT series version 1.1, Lotek Wireless Inc., USA), capable of measuring external and internal temperature, light intensity and pressure, which were set to record every 512 s.
Archival tags were surgically implanted into the peritoneal cavity of the captured ALB, and conventional tags (Hallprint Inc., Australia) with contact information were attached to the base of the dorsal fin. In total, 83 tagged ALB (fork length: 50–87 cm) were released, and 4 were recaptured (recapture rate: 4.8%, Table 1). Because migration paths have already been estimated using the Unscented Kalman filter-based geolocation method incorporating sea-surface temperature (Hokimoto and Kiyofuji, 2014), we referred to this published article for the estimated paths.
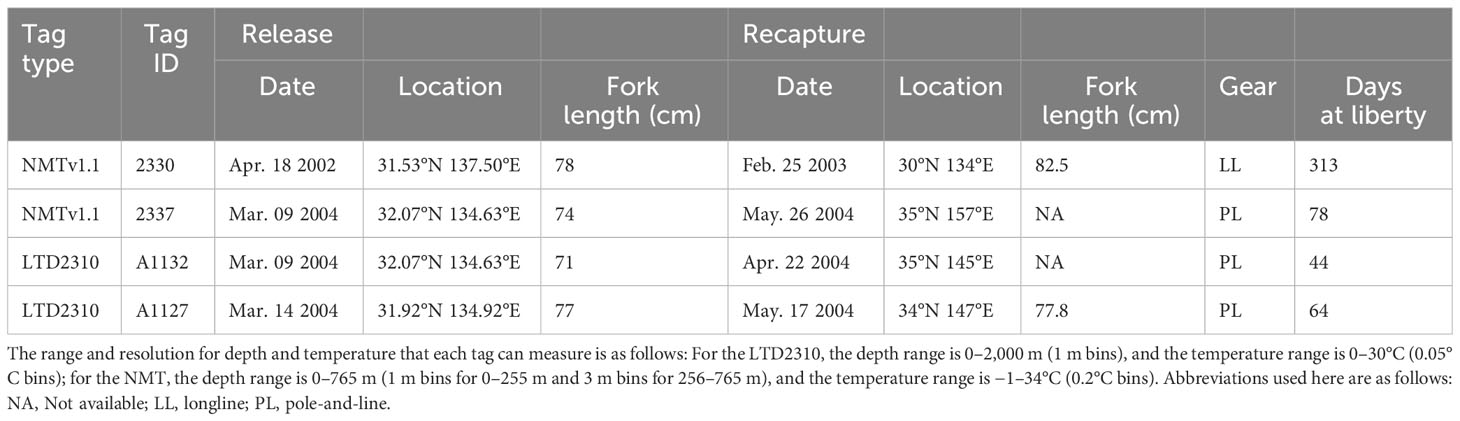
Table 1 Release and recapture information on tagged albacore tuna.
2.3 Identification of Tmin for juvenile albacore
Our study aims to understand how the Tmin limits the vertical behavior of ALB and their susceptibility to fishing operations on a daily scale, Tmin is considered the temperature at which ALB can survive after being exposed for at least daytime. Minimum temperature based Tmin estimates derived from tagged individuals typically occur when tuna dive beyond the thermocline. However, since they rapidly return to the warmer surface waters to thermoregulate (Holland et al., 1992; Kitagawa et al., 2001, 2004), such momental minimum records do not necessarily indicate the Tmin that ALB can survive through a day. To address this issue, we calculated the daily averaged water temperature from four tagged ALB and used the lowest daily average temperature as the Tmin from tagging data. Recognizing that a limited sample size (N=4) could overestimate Tmin and we also analyzed comparing the temperature recorded on the fishery logbooks for PL and LL which provide a broader spatial and longer periods of the data coverage (See detail in Chapter 2.1) compared to tagging data. Although the temperature from the logbook is not completely comparable to the daily average temperature from tagging data as the temperature from the logbook is only available as a form of SST, it would be representative of the Tmin when considering the surface vertical distribution of ALB. Consequently, we established the lower Tmin using both datasets.
2.4 Habitat classification
Vertical thermal profiles are representative of the ocean habitats utilized by tuna during their migration (Williams et al., 2015; Aoki et al., 2017). Temperature profiles collected with the electronic tags are used in a clustering analysis to characterize the ALB thermal habitat. Tagging data enabled us to directly reproduce the thermal profiles based on the wild behavior of tagged individuals. Here, a few steps were introduced to generate daily thermal profiles from the tagging data. The first step was to group the ambient temperature data for a day (24 hours) into 10 m depth bins from 0 to 200 m using corresponding depth data. Subsequently, the average temperature within each 10 m depth bin was calculated, which enabled us to provide a thermal profile from 0 to 200 m for a day. This calculation was applied to whole data periods from release to recapture. This step provided an entire dataset of the thermal profile for a specific day under the condition of the ALB, exploring a range of 0–200 m evenly. For datasets that did not sufficiently represent the vertical thermal profile for a day, the second step was applied. The second step was to deal with these missing values at each 10 m depth bin by interpolating them from adjacent days. This was achieved using the zoo package (ver 1.8.9) in R. Interpolation could have a negative impact on the clustering of the generated thermal profile; thus, we visually checked its effect by comparing the interpolated profile with the original profiles. The entire dataset was then used for clustering analysis.
Ideally, an entire dataset of thermal profiles from tag records detailing water temperature and swimming depth should be prepared. However, data at deeper depths (<50 m) tended to be scarce in the northern areas owing to the ALB behavior (Figures 1B, C; Supplementary Figure S1C). To address this gap, we interpolated the depth temperature of missing data from adjacent days, which provided a complete profile; Since the interpolated data, representing 60% of the final dataset, could impact the clustering analysis, we checked the effect of interpolation by comparing each thermal profile with the original one. In all cases, both original and interpolated profiles visually agreed well with each other (see supporting results), confirming that the interpolated data accurately reflects the habitat characteristics pertinent to our clustering analysis.
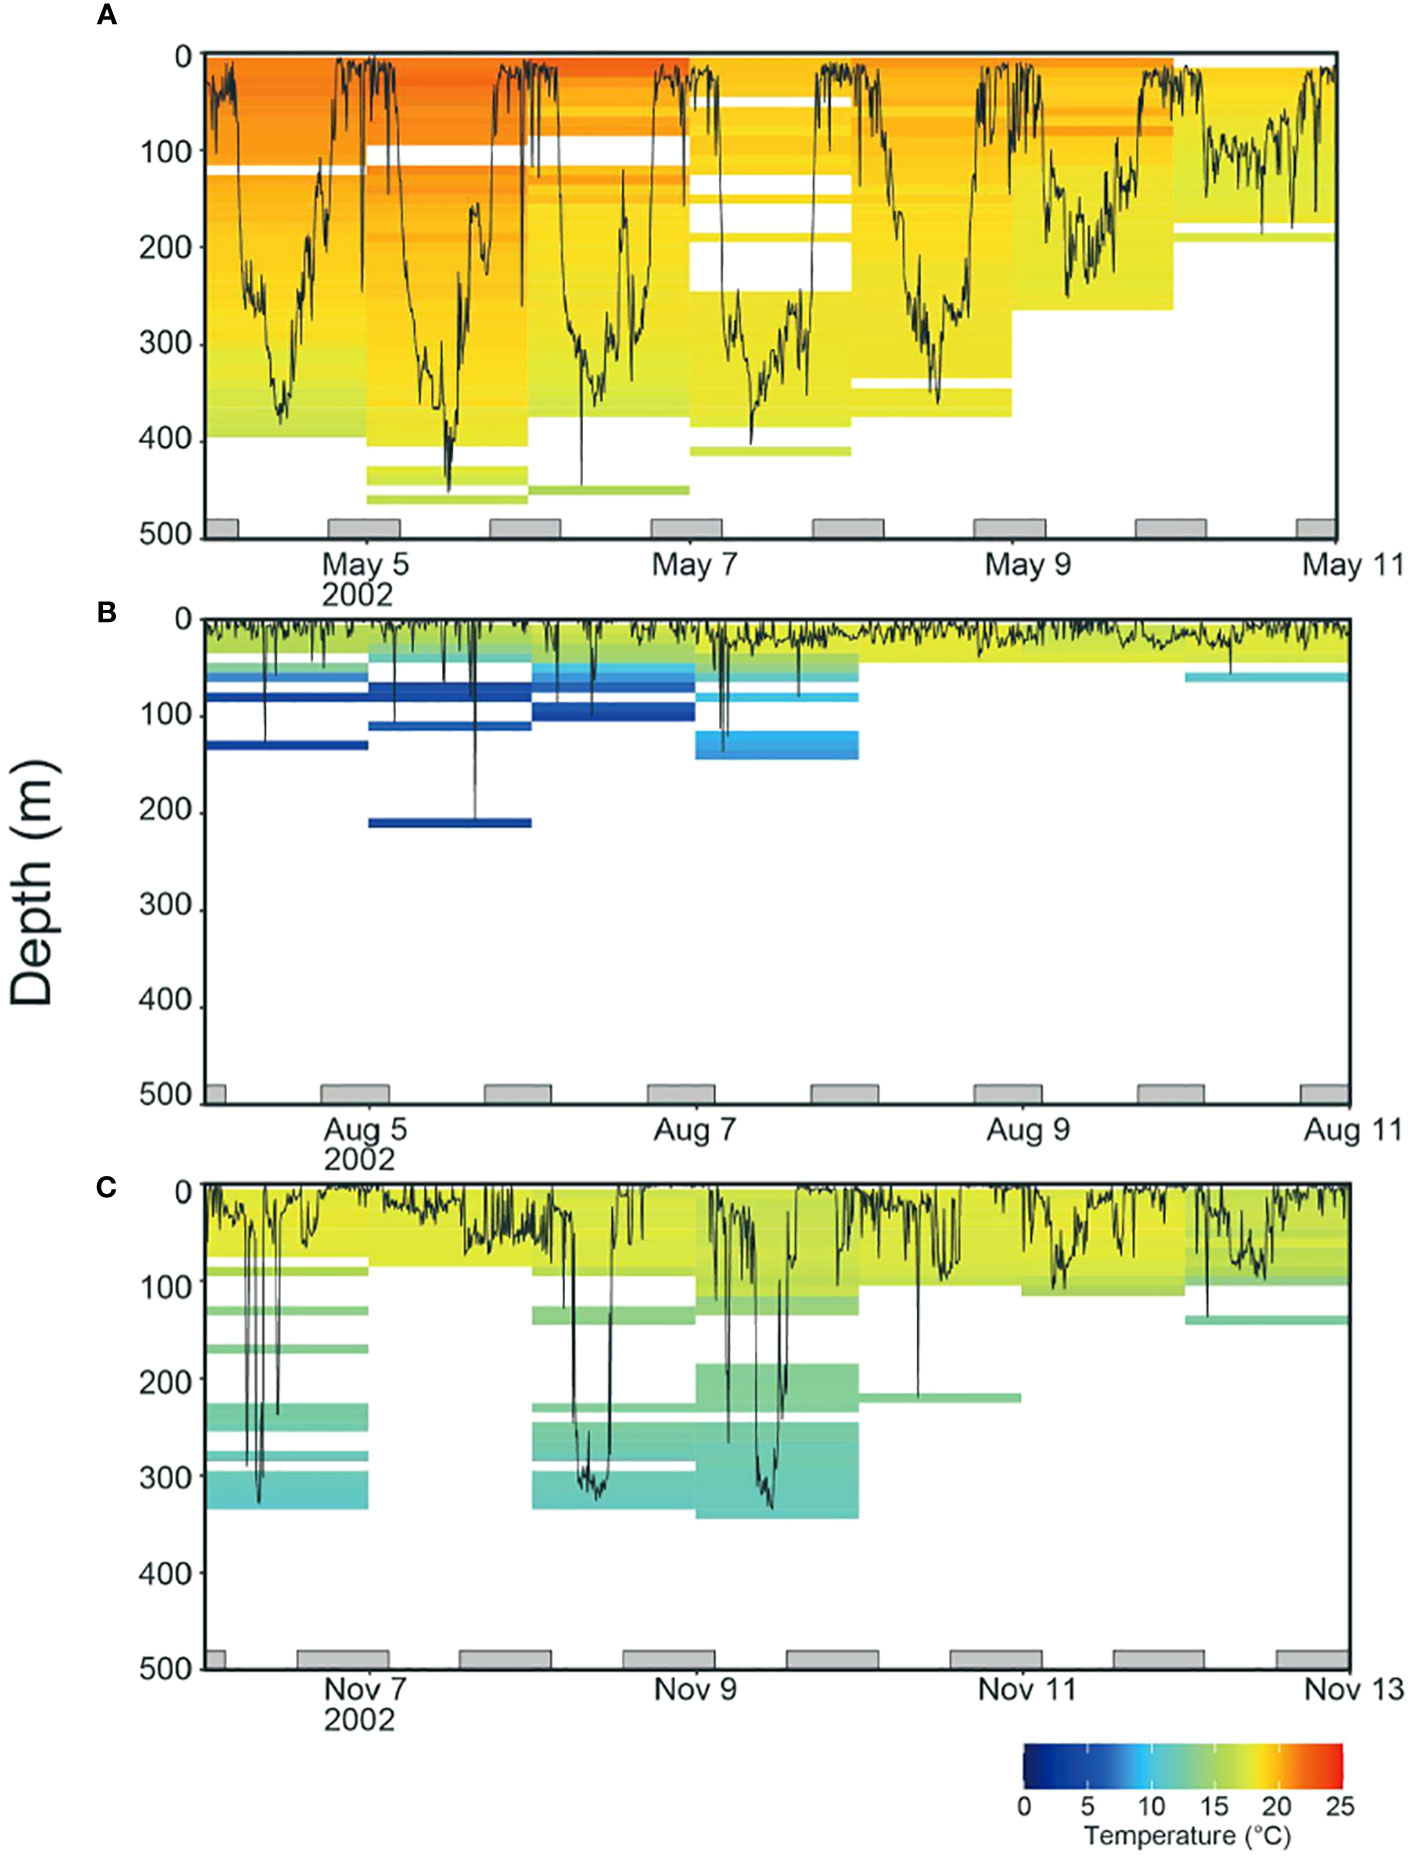
Figure 1 Examples of weekly time series (Tag ID. 2330) showing vertical movements and daily ambient temperature profiles in (A) May, (B) August, and (C) November. The profiles were calculated from the time series for swimming depth and ambient temperature collected in 512 s each. The bottom gray bars represent the night periods.
We classified the daily thermal profiles into several clusters based on a common thermal habitat using the flexmix package in R (version 4.1.1) for model-based cluster analysis as a Gaussian mixture model (Leisch, 2004). This package also enabled us to assign the response and explanatory variables to the model. We used daily thermal profiles as multivariate response variables, assuming a Gaussian distribution, and applied the null model with only an intercept value of 1 with no explanatory variables. The thermal profile in our study area changes depending on spatial and temporal changes in the mixture of ocean currents (Kawai, 1972; Yasuda, 2003), implying potential explanatory variables of dates and locations (year, month, day, latitude, and longitude). However, a simple classification based solely on the thermal profile still has explanatory power for tuna ecology (Bestley et al., 2009; Aoki et al., 2017). Therefore, we kept the model simple rather than adding several explanatory variables. The decision on the number of clusters relied on Bayesian Information Criteria (BIC). We varied the potential number of clusters from 1 to 10, and the final number was determined from the number with the minimum BIC among the potential numbers.
3 Results
3.1 Fishery grounds for ALB in LL and PL fisheries
A spatial comparison of CPUE between LL and PL fisheries revealed the geographical features of each fishery (Figure 2). Overall, the LL fishery occurred in the southern areas (<40°N) over a wide range of longitudes (western and central Pacific). In contrast, the PL fishery operated in the northern areas (25–45°N) of the western Pacific. They share fishery grounds, although their hotspots differed (Figure 2). Hotspots of LL were mainly found in subtropical to temperate areas (25–37°N) in the central Pacific (170–150°W) off Japan at approximately 30°N and those of PL were identified in northern areas (>42°N) in the western Pacific.
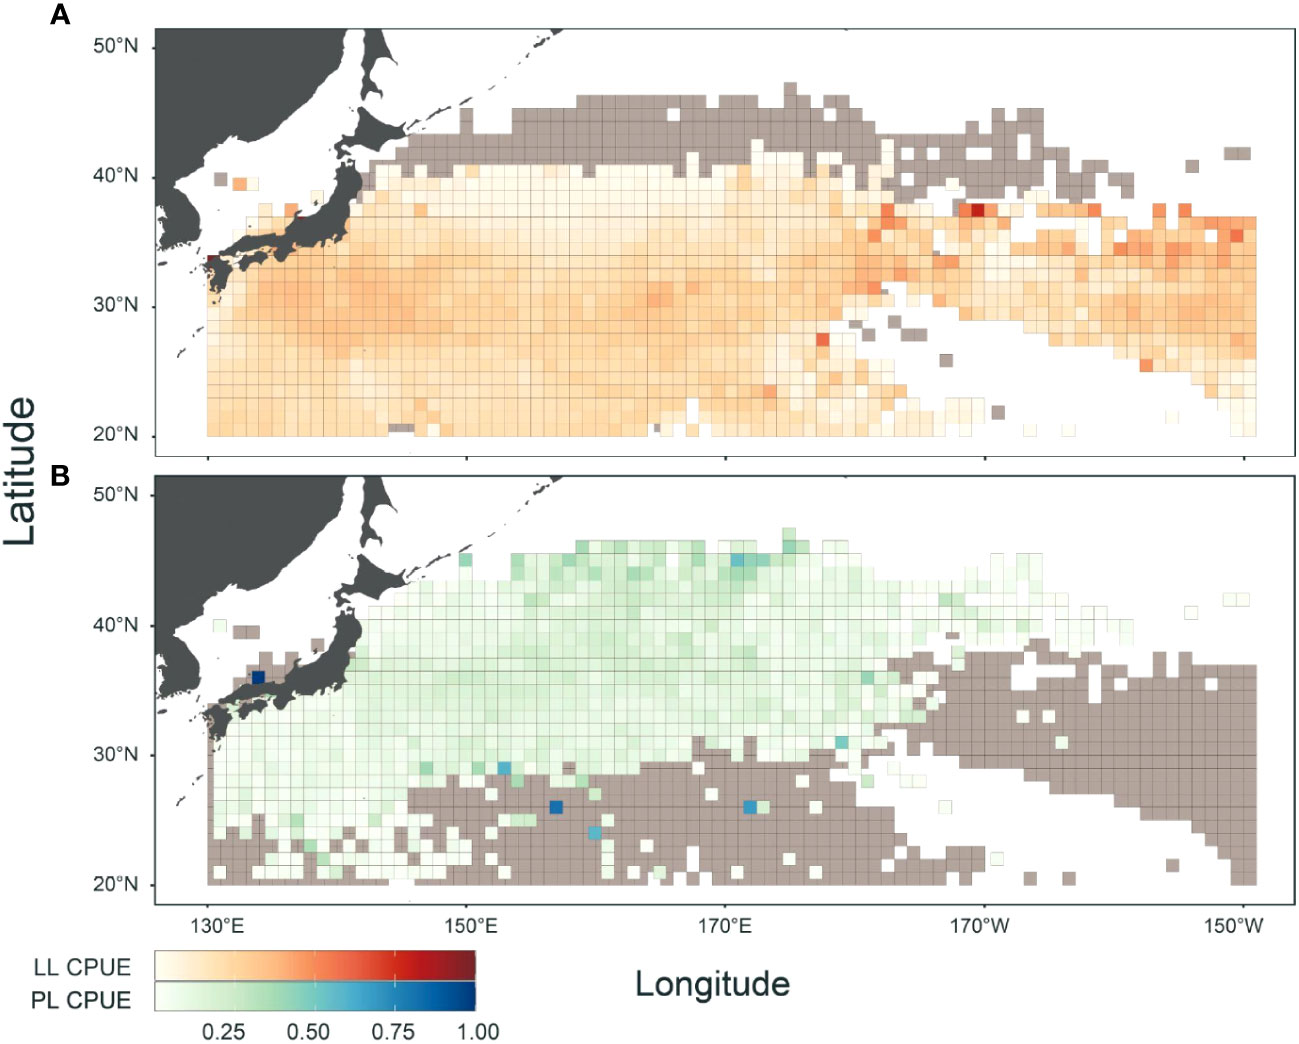
Figure 2 Geographical features in catch per unit effort (CPUE) for albacore (ALB) fishery by (A) Japanese longline (LL) and (B) pole-and-line (PL). LL (PL) CPUE was calculated by the number (weight) of ALB catch divided by 1000 hooks (number of poles), and both CPUEs were normalized to have a maximum value of 1. Gray represents overlapping areas between LL and PL fisheries. Data periods in LL and PL logbooks were from 1972 to 2022 and 1996 to 2022, respectively.
3.2 Horizontal and vertical movements
All four recaptured tagged ALB displayed an eastward movement after release (Figure 3A; Table 1). One of these (Tag ID. 2330) covered a wide range of longitudes with eastward movements from off-Japan areas to the sea area around 40°N and 155°E before returning to Japan, covering more than 25,000 km in 313 days. The remaining three individuals (Tag ID. 2337, A1132, A1127) were recaptured relatively shortly (44–78 days at liberty) but still showed migratory paths similar to those found in Tag ID. 2330.
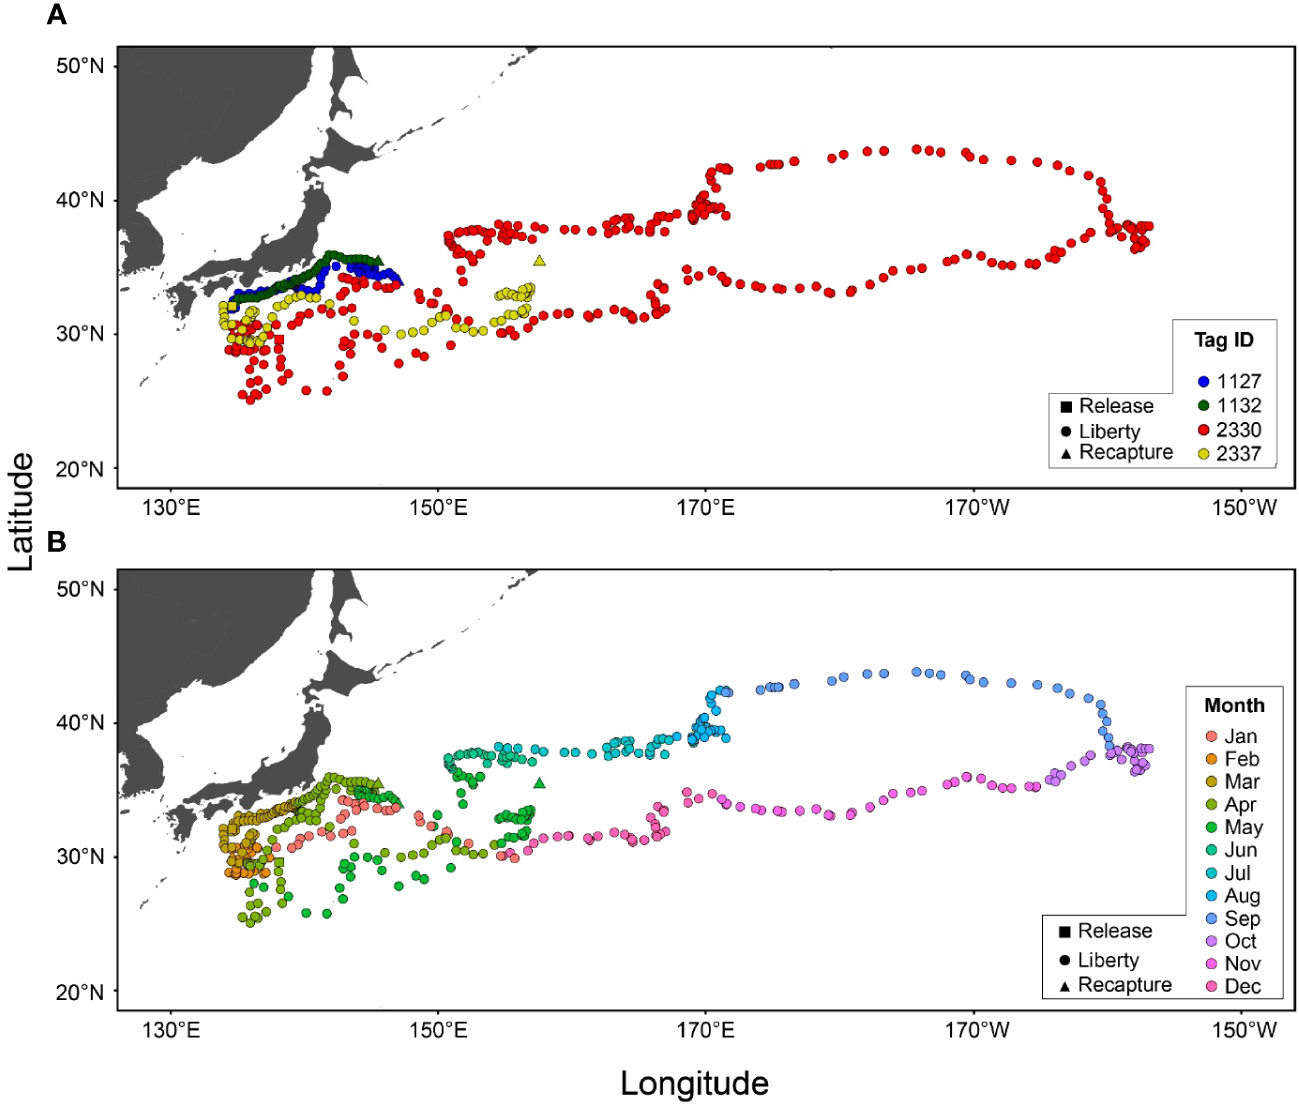
Figure 3 Horizontal distributions of albacore tuna were estimated from archival tags (N=4) for each individual (A) and month (B). Locations at release, liberty, and recapture points are shown as square, circle, and triangle marks, respectively.
Monthly distributions of tagged ALB showed that individuals were consistently staying around off Japan in spring (February to April) and departing the areas in May (Figure 3B). The ALB experienced a well-mixed layer in this area and showed strong diurnal movements distributing at 300–400 m in daytime and at 0–100 m at night (Figure 1A). From the one that spent 313 days before its recapture, it was shown that in summer (July to September), the ALB moved further eastward with a slight latitudinal movement to the north in certain areas (155°E and 170°E). During the eastward migration, the horizontal distribution of ALB was in the northernmost region (42°N), where a strong thermocline developed (Figures 3B, 1B). The ALB was mainly distributed in the surface layer (0–30 m), with occasional dives below the thermocline (Figure 1B). From fall to winter (October to January), the ALB returned to Japan through a route in the southern areas from the path through their early migration towards the east (Figure 3). During the westward migration, the ALB was distributed at 0–100 m with dives exceeding 300 m (Figure 1C).
3.3 Identification of Tmin
We identified Tmin using sea surface temperature data from historical fishery records (Figure 4A) and daily water temperature through tagged ALB migration, including the northern limit of their surface habitat (Figure 4B). The lowest water temperature between the two datasets was extracted from tagging data (fishery data: 16.0°C and tagging data: 13.0°C). This comparison of the SST with daily water temperature from tagging data revealed that SST from logbook data is not sufficient to capture the Tmin even using the large data set, as ALB distributes below the surface (Figure 1). Thus, the Tmin was set to be 13°C from tagging data. For the fishery dataset in LL (N=529,394) and PL (N=19,796), SST showed similar peaks (LL: 22.0°C, PL: 21.4°C) for both fisheries (Figure 4A), while SST in LL recorded warmer temperatures than those in PL reflecting its operation in southern areas (Figure 2A). Maximum SST for PL and LL are 28.6°C and 32.6°C, respectively. For the tagging data, the highest was 20.9°C with a high frequency observed at 18.6°C (N=494) mainly from the individuals staying in the off Japan areas (Figures 3A, 4), whereas longtail distribution for the lower temperature came from the individual (Tag ID. 2330) migrating to northernmost areas.
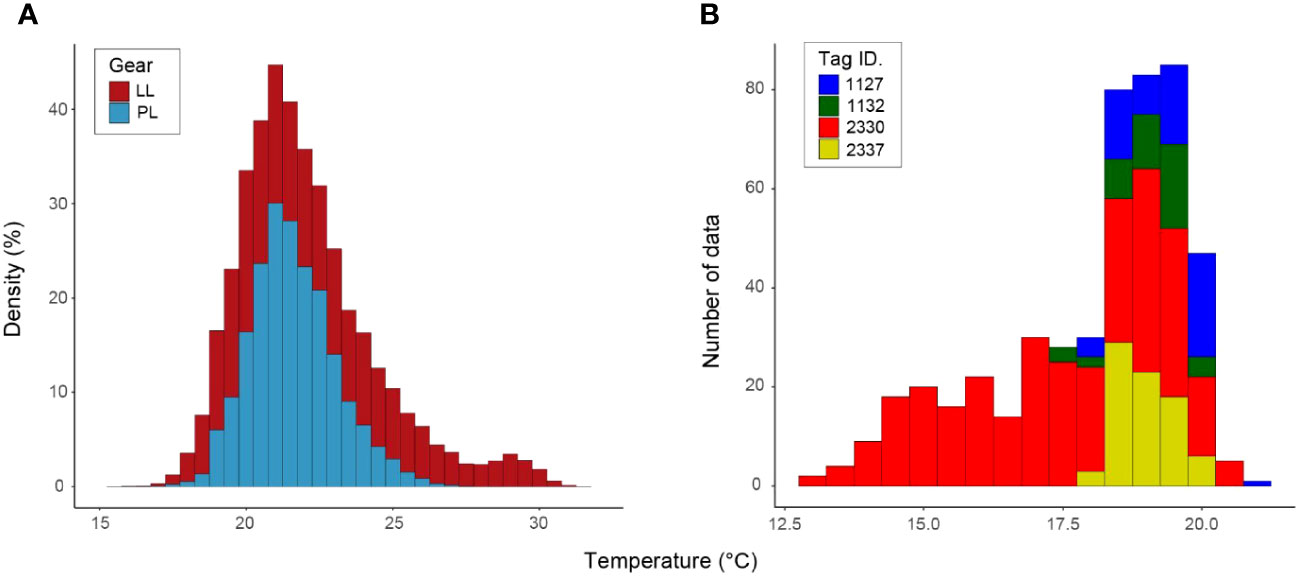
Figure 4 Histogram of water temperature obtained from logbook (A) and tagged individuals (B). Logbook records were extracted for sea surface temperature where ALB was caught by pole-and-line (PL) fisheries (N=19,796) from 2013 to 2020 and longline (LL) fisheries (N=529,394) from 1996 to 2021. Tagging records were obtained from the daily averaged water temperature from four tagged ALBs (N=494). Each color in (A, B) represents the gear and tag ID, respectively.
3.4 Characteristics of clustered habitat
One of the important steps in clustering is to determine the number of clusters objectively. The BIC was compared among candidates with grouping numbers 1 to 10. The models with one cluster have a BIC value of 26,503. The BIC did not change with two clusters, but a drastic decrease in BIC (16,031) was observed when three clusters were chosen, representing the lowest value among all the candidates. From clusters 4 to 10, the BIC values ranged from 20,371 to 38,405, with the second-lowest value occurring in cluster 8. Therefore, three clusters were used as the best grouping numbers in this analysis.
Analysis of the three clustered ocean habitats (HABs) revealed distinct horizontal separations and boundaries among them (Figure 5). These HABs were separated by latitude (Figure 5A). HAB1 (N = 185) was characterized by a thick surface mixed layer with a sea surface temperature of 19.2 ± 0.5°C (average ± standard deviation) and occupied areas off Japan from 25 to 35°N in January to May (Figures 5A, B), which is known as subtropical mode water (Yasuda, 2003; Oka et al., 2023). It is not surprising that the HAB1 had the warmest among HABs, as it is located in southern areas. Notably, the average temperature at a depth of 400 m corresponded to temperature of 16.3 ± 0.8°C, warmer than the Tmin (Figure 5B). Specifically, DTmin in HAB1 was below 400 m. Focusing on the vertical distribution of ALB, it was broadly distributed in the mixed layer from the surface to 400 m in HAB1, and 90% of its cumulative distribution was above 239 m (Figure 5A). The broad distribution was also confirmed from the individual behavior (Figure 1A) with changing distribution depth on a daily scale, as shown in Figure 1A (e.g., the approximate daily depths on May 5, 8, 9, and 10 were 400, 300, 200, and 100 m, respectively). HABs 2 (N= 102) and 3 (N= 101), in contrast to HAB1, showed moderate and strong thermoclines, respectively. Most HAB2 was located east of 150°E along a latitude of 35°N (between HABs 1 and 3). The others were patchily found west of 150°E (Figure 5A). This is mainly due to moderate thermoclines of boundary areas being classified into HAB2, as the large variance of thermal profiles indicates (the temperature at 0 and 100 m is 17.9 ± 1.5°C and 14.5 ± 2.9°C, respectively; Figure 5C). DTmin, which corresponds to the depth at which the average temperature matches Tmin, was 140 m. The vertical distribution in HAB2 was more concentrated at depths above 100 m, and cumulative distribution counts up to 90% were 109 m deep (Figures 1C and 5C). HAB3, characterized by the strongest thermocline among the HABs, occurred in the northernmost region (Figure 5A). Thermal gradient from the surface (16.3 ± 1.4°C) to a depth of 40 m (15.5 ± 1.8°C) was weak. Still, the gradient got stronger from the depth of 40 m to 100 m (7.9 ± 1.7°C) (Figure 5D). Ninety percent of the cumulative distribution (33 m) in HAB3 was above the thermocline of 40 m (Figures 1B and 5D), with DTmin occurring at 53 m.
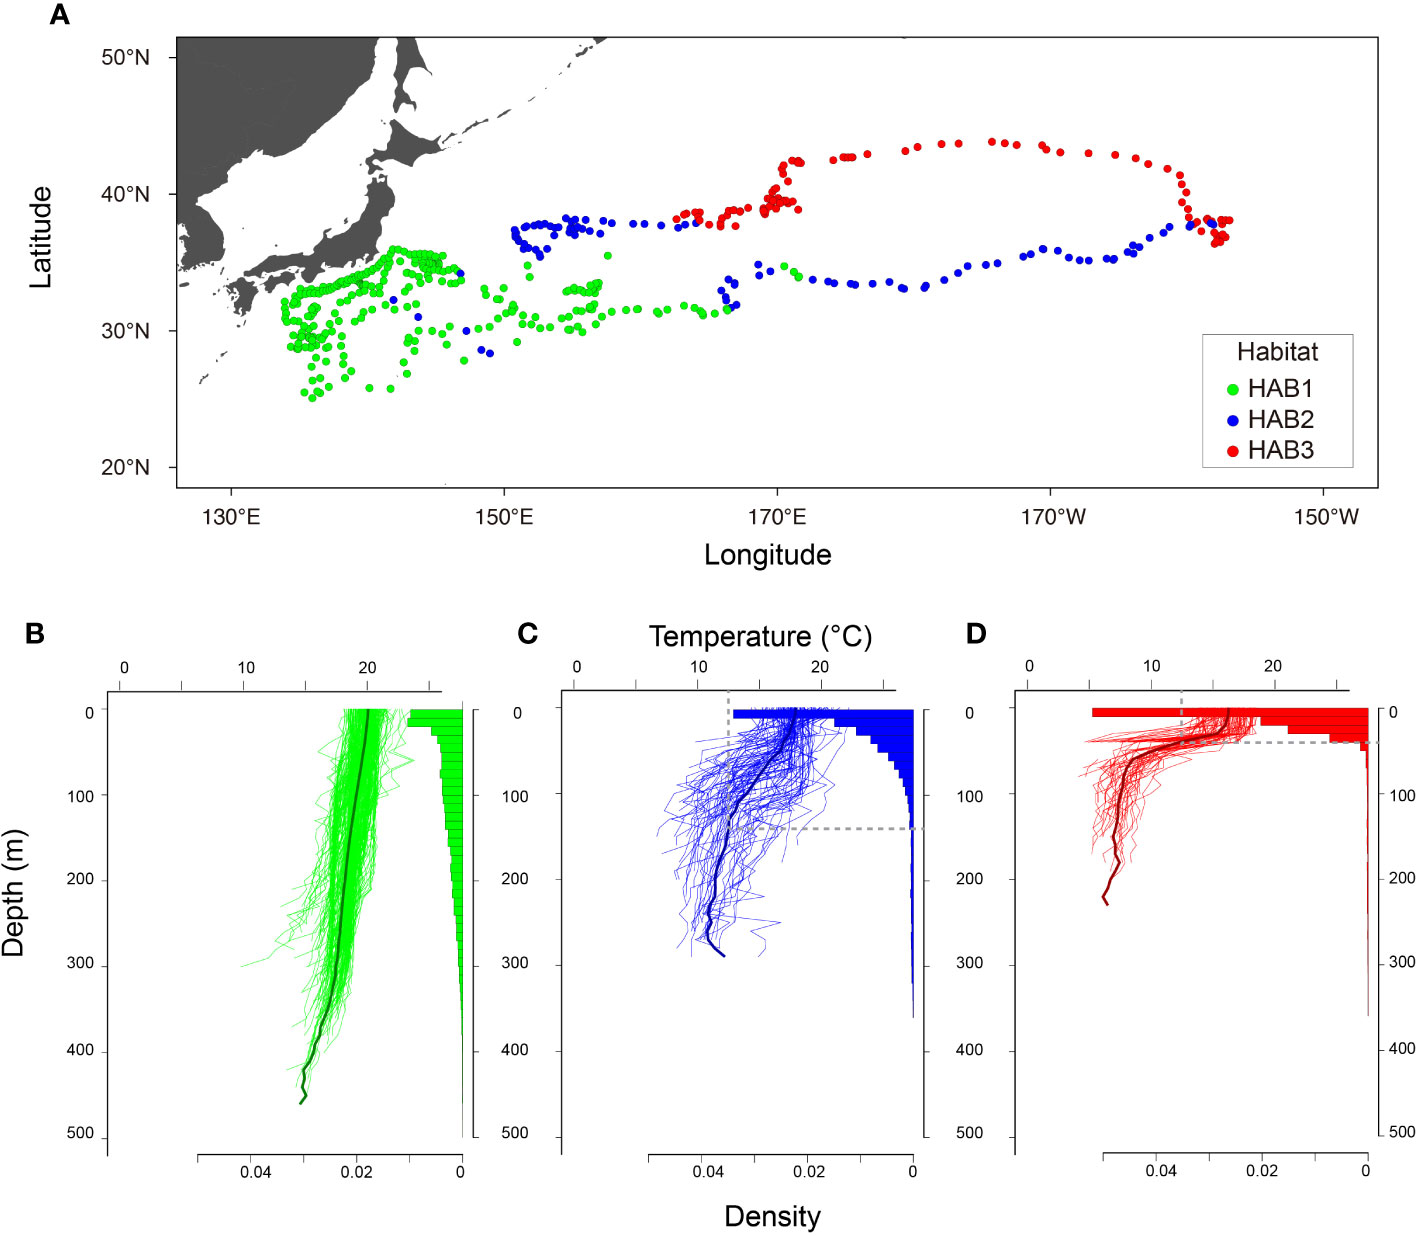
Figure 5 Characteristics of three classified habitats. (A) Daily locations. (B–D) thermal profiles with vertical distributions of 3 classified habitats, HAB1, HAB2, and HAB3, respectively. Original daily thermal profiles with vertical distribution recorded every 512 s are shown in (B–D). Black lines in (B–D) indicate average profiles in each HAB. Gray vertical and horizontal lines in (C, D) indicate Tmin and DTmin. Note that the habitat classification was conducted with profiles upper 200 m with interpolation. These figures were drawn with original data according to the classification.
4 Discussion
Better knowledge of tuna ecophysiology is essential to interpret the distribution of these valuable exploited species and associated fishing activities, and therefore to improve their management (Lehodey et al., 2015; Muhling et al., 2015; Ijima and Jusup, 2023). This study has identified Tmin for juvenile ALB in the wild and evaluated their behavioral response to Tmin by focusing on wild behavior in the northern distributional limit. These findings are novel in explaining the change in the vertical utilization of juvenile ALB among habitats via their physiological tolerance and explaining why certain fisheries have different operational strategies, which resulted in more efficient operation of the PL (LL) fishery in northern (southern) areas than in southern (northern) areas. We achieved this by classifying the complicated thermal profiles that juvenile ALB experienced during migration, including the Kuroshio–Oyashio extension area, into three habitats and comparing the vertical distribution with DTmin, where Tmin exists in each habitat. Analysis of the thermal profiles allowed us not only to specify the physiologically unfavorable depths (DTmin) within habitats but also to represent prey environments, as reported previously (Williams et al., 2015), making the habitat index more comprehensive. Hotspots of the ALB fishery have been explained in terms of suitable feeding habitats at the surface (Zainuddin et al., 2004; Mondal and Lee, 2023); however, our study focused more on the subsurface, which deepened our understanding of the latitudinal cline in ALB vertical habitats. Based on these findings, we introduce a new schematic figure describing the links between physiological thermal tolerance, ocean habitats, vertical behavior, and fishing gear (Figure 6). First, we introduce (1) the limitations and assumptions of the data and analysis in this study. Subsequently, we discuss each part of Figure 6, focusing on (2) the validity of Tmin, (3) its effect on vertical habitats, and (4) how vertical behavior is linked to the vulnerability of ALB to LL and PL fisheries.
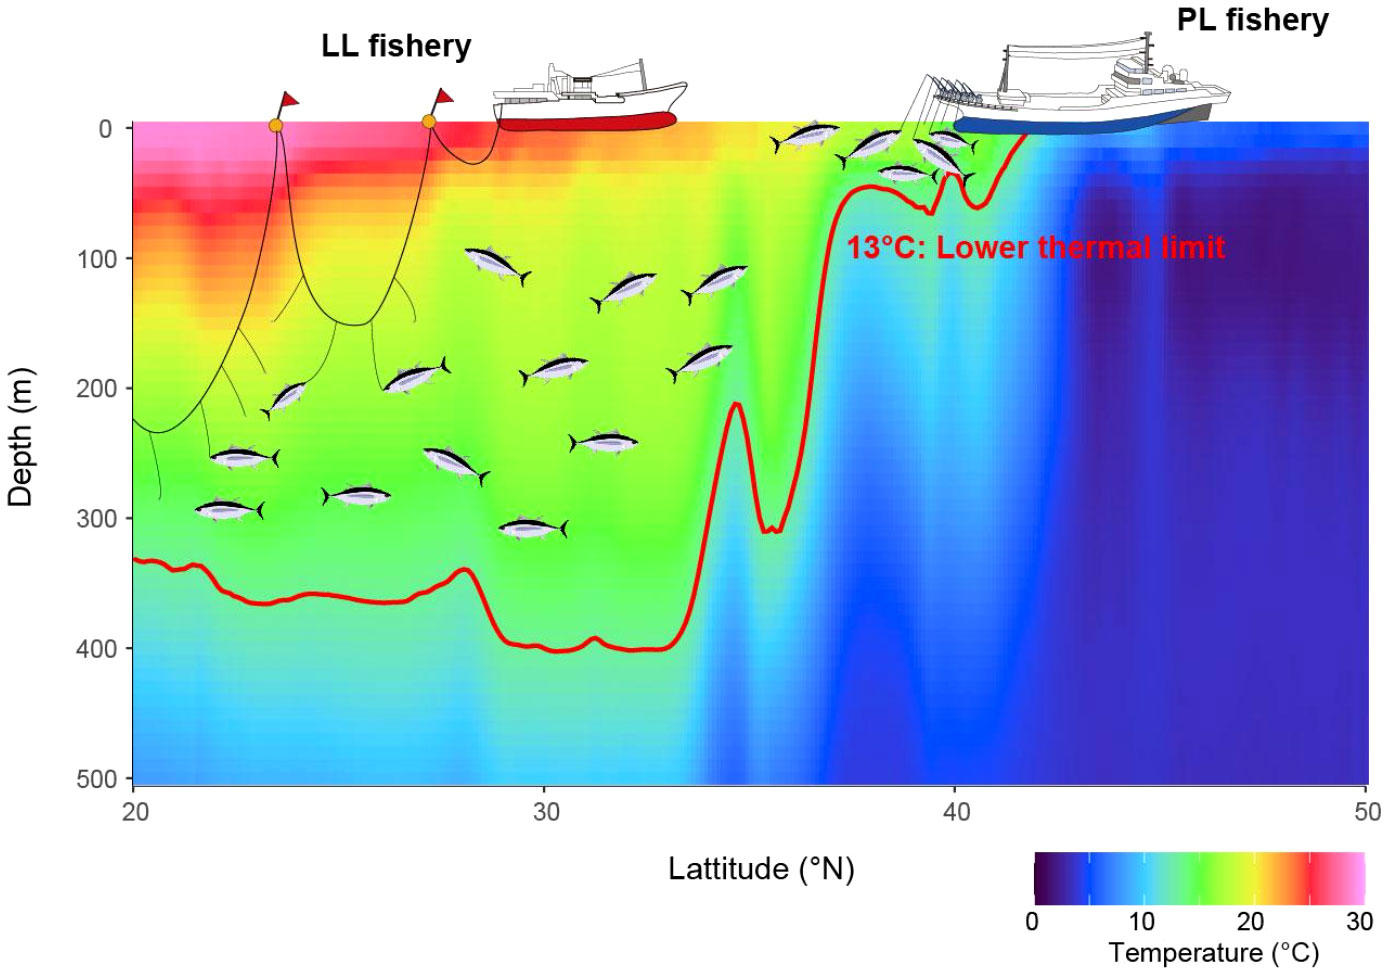
Figure 6 A schematic vertical distribution change with latitudinal change in juvenile ALB and its impacts on fisheries. The lower thermal limit physiologically restricts the vertical distributions of juvenile ALB and hence results in the change in fishing efficiency for longline and pole-and-line fisheries with latitude. A red line shows an isoline of 13°C as the lower thermal limit of juvenile ALB estimated in this study.
4.1 Limitations and assumptions of this study
Given the small number of tagged individuals (four) and the fragmentary nature of the dataset (2002 and 2004), it is difficult to assume that these migration routes are representative of the horizontal migration of ALB. However, discussing the universal physiological and ecological responses of species to water temperature relies on the data quality rather than the quantity of data successfully obtained from wild individuals (Holland et al., 1992; Block et al., 1997; Nakamura et al., 2020). Data quality in this study was secured, as the observed vertical distributions had a general trend of diurnal vertical migration commonly found in ALB (Childers et al., 2011; Cosgrove et al., 2014). This suggests that the effect of tag attachment on behavior was negligible. Considering the nature of our data (poor amount but secured quality), we decided not to discuss horizontal behaviors as our limitation. Instead, we focused on the universal response of species to unfavorable thermal environments.
In addition, the high-latitude areas of HAB2 and HAB3 were heavily dependent on information obtained from one individual (Tag No. 2330) for which long-term data were provided. The nature of the data obtained from one individual in a certain year should be carefully noted, although the vertical distribution obtained from this individual showed a similar trend to that reported in the Southern and Eastern Pacific Oceans (Childers et al., 2011; Williams et al., 2015), where the distribution becomes shallower at higher latitudes. It is theoretically possible that the behavior observed in this individual reflects the ecology of ALB as a species rather than a characteristic unique to the individual. Promising future research direction to overcome the limitation of tagging studies (i.e., data quantity issue) involves using otolith trace element analysis (Macdonald et al., 2013) and Iso-logging (Matsubayashi et al., 2022), to estimate the track of movement simply by collecting substantial biological tissues. Unlike tagging research, these methods are not affected by the recapture rates and therefore could be a useful approach (Macdonald et al., 2013; Matsubayashi et al., 2022) to evaluate the migration in a more quantitative manner.
4.2 Validity of the lower thermal tolerance in juvenile ALB
Our result of minimum daily average temperature (13°C) would be regarded as the Tmin of juvenile ALB. Thermal tolerance is the temperature at which a predefined ratio of individuals survives after being exposed for a certain period in a controlled laboratory environment (Sunday et al., 2011). The same definition cannot be applied because tagged individuals always survive in the wild. However, the extent of wild distributions within their thermal tolerance (Sunday et al., 2012) and the good agreement in thermal tolerance between laboratory and field studies for marine ectotherms (Payne et al., 2016) suggest that the field-based assumed minimum temperature in the northern distributional limit can be close to Tmin. The Tmin of skipjack tuna estimated in a laboratory study (Dizon and Yuen, 1978) was consistent with the lower average daily temperature obtained from tagged individuals in the northern distributional limit (Barkley et al., 1978; Kiyofuji et al., 2019), supporting the validity of the extraction of Tmin from the daily average temperature in the distributional limit. Although other tagging studies do not apply the same definition of daily mean temperature as in our study, it is interesting to compare the minimum mean temperatures. This highlights the importance of the effect of size or age on the estimate of Tmin; 14.9 ± 1.2°C (65–90 cm FL, Childers et al., 2011);15.4 ± 0.8°C (78 cm FL, Cosgrove et al., 2014) in juvenile, and 11.3°C in adult ALB (age>5 years, Boyce et al., 2008). The thermal tolerance of ALB may be associated with growth, and our data obtained in the northern limit of the habitat led to relatively low Tmin compared to other studies. We therefore regarded the 13°C as the Tmin for juvenile ALB in this study (Figure 6).
4.3 Effect of lower thermal tolerance on vertical habitats
The shallower vertical distribution at higher latitudes could be a behavioral response to DTmin, which shallows at high latitudes (Figure 6). Prolonged exposure to an environment below Tmin leads to a decrease in cardiac output due to bradycardia (Landeira-Fernandez et al., 2004; Shiels et al., 2015), making it difficult for ALBs to maintain cardiac function. Spending most of the daily time at the surface in high latitudes, such as HAB3, would result in avoiding DTmin. However, deep DTmin in HAB1 enabled ALB to access a broad vertical range within the water column (Figure 6). As tuna descend to or below the depths of DTmin, especially at high latitudes, a quick ascent is required to recover the cardiac function and temperature of other parts of the body (Shiels et al., 2015). This behavior is also known as behavioral thermoregulation and is found in several species (e.g, Holland et al., 1992; Kitagawa et al., 2001, 2004). Shortening the dive duration reduces heat loss from the body (Kitagawa et al., 2004). Access beyond the DTmin in ALB has been observed in other areas (Childers et al., 2011; Muhling et al., 2022), but body temperature drops are relatively rare owing to the short dive duration (Muhling et al., 2022). The data obtained in this study also support the behavioral response to deep cold water. In addition, the change in vertical habitat with latitude (Figure 6) was also supported by the gut ALB contents; pelagic species of the Japanese anchovy (Engraulis japonicus) and midwater species of crustaceans and amphipods were dominant in HAB1 and HAB3, respectively (Kawasaki and Asano, 1962; Watanabe et al., 2004).
4.4 How the vertical behavior links to the vulnerability of ALB to fishing gear
Latitudinal differences in the vulnerability of ALB to certain fisheries would be introduced by overlapping depths between ALB vertical habitats and fishery-specific gear setting depth (Figure 6). Japanese LL fisheries tend to set their hooks deep (25–300 m or more) (Ward and Hindmarsh, 2007). In the equatorial central Pacific, the ALB catch rate increases with depth within 80–280 m (Nakano et al., 1997). The vertical distribution of ALB in HAB1, ranging from 200 to 400 m, is consistent with the hook depths of the Japanese LL, suggesting that the fishing hotspots found in the southern area coincide with ALB deeper habitat, thus requiring deeper setting of LL hooks. In HAB3 however, ALBs are more vulnerable to shallow fishing gear because their thermal habitat is contracted towards the surface (Figure 6). More efficient surface capturability in this region is also well known to fishermen who constantly observe the sea surface with long-range binoculars, looking for schools of tuna (Okamoto et al., 2013; Matsubara et al., 2022). Furthermore, the short dive duration of ALB in this area may further improve the fishing efficiency of the surface fishery, as there are fewer chances of losing target fish schools owing to ALB dives. Therefore, PL hotspots appeared in northern areas near the northern habitat limit (Figure 6), where strong thermoclines develop.
The strong thermoclines in HAB3, working as a thermal barrier for ALB, would also retain other tuna at the surface regarding their vertical distribution, resulting in the HAB3 area being one of the best tuna fishing grounds. Juvenile skipjack, as one of the warm tuna group members (Bernal et al., 2017), having a Tmin of 18°C tends to stay at the surface in this area (Kiyofuji et al., 2019), and a similar surfacing pattern is also found in bluefin tuna of the cold tuna group which has the Tmin of 14°C (Kitagawa et al., 2001; Fujioka et al., 2018). For both warm and cold tuna groups (Bernal et al., 2017), the thermocline that developed in the area around 40°N was strong enough to restrict their vertical distribution on the surface (Figure 6). High productivity in the Kuroshio–Oyashio extension area (Yasuda, 2003; Sassa et al., 2007) has the potential to meet the high energy demand for tuna (Kitagawa et al., 2007; Aoki et al., 2017, 2020; Muhling et al., 2022) and aggregate them in this area (Aoki et al., 2017) though however, the vertical utilization of the habitat in the area is limited. Higher productivity on these fishery grounds has been interpreted as the effect of the mixing of the warm Kuroshio and cold Oyashio currents (Yasuda, 2003; Zainuddin et al., 2004). In addition, our results underscore the importance of species-specific physiological thermal tolerance in the formation of rich fishery grounds.
This study introduces a novel aspect to understanding the relationship between the vertical distribution of juvenile ALB and their vulnerability to fisheries by examining the response of this species to its Tmin, in the wild. It elucidates how the vulnerability of ALB to fisheries and catch variability are closely related to their physiological tolerance, vertical habitats, and DTmin (Figure 6). Integrating the responses of ALB to thermal profiles with fishery information such as CPUE (Williams et al., 2015; Mondal et al., 2022) will enhance future stock assessments, especially in boundary areas characterized by DTmin within the species’ vertical habitat. Furthermore, analyzing these biological and behavioral responses will serve as a crucial reference for projecting the effects of climate change scenarios (Sunday et al., 2012) to assess its impact on fisheries and stocks (Lehodey et al., 2015), thereby reducing uncertainty in future stock management to maintain sustainable fisheries.
Data availability statement
The raw data supporting the conclusions of this article will be made available by the authors, without undue reservation.
Ethics statement
The animal study was approved by ANIMAL EXPERIMENTS AT FISHERIES RESOURCES INSTITUTE, JAPAN FISHERIES RESEARCH AND EDUCATION AGENCY. The study was conducted in accordance with the local legislation and institutional requirements.
Author contributions
NM: Conceptualization, Data curation, Formal analysis, Methodology, Visualization, Writing – original draft, Writing – review & editing, Validation. YA: Conceptualization, Formal analysis, Methodology, Visualization, Writing – original draft, Writing – review & editing, Validation. AA: Conceptualization, Writing – review & editing, Formal analysis, Methodology, Validation, Writing – original draft. HK: Conceptualization, Investigation, Project administration, Supervision, Writing – review & editing.
Funding
The author(s) declare financial support was received for the research, authorship, and/or publication of this article. Funding for this research project was provided by the Fisheries Agency of Japan.
Acknowledgments
The authors would like to thank Yuich Tsuda of Fisheries Resources Institute, Japan Fisheries Research and Education Agency, for insightful discussion. We are grateful Editage https://www.editage.jp) for English language editing.
Conflict of interest
The authors declare that the research was conducted in the absence of any commercial or financial relationships that could be construed as a potential conflict of interest.
Publisher’s note
All claims expressed in this article are solely those of the authors and do not necessarily represent those of their affiliated organizations, or those of the publisher, the editors and the reviewers. Any product that may be evaluated in this article, or claim that may be made by its manufacturer, is not guaranteed or endorsed by the publisher.
Supplementary material
The Supplementary Material for this article can be found online at: https://www.frontiersin.org/articles/10.3389/fmars.2024.1353918/full#supplementary-material
References
Aoki Y., Jusup M., Nieblas A. E., Bonhommeau S., Kiyofuji H., Kitagawa T. (2020). Early-life ontogenetic developments drive tuna ecology and evolution. J. Mar. Syst. 206, 103307. doi: 10.1016/j.jmarsys.2020.103307
Aoki Y., Kitagawa T., Kiyofuji H., Okamoto S., Kawamura T. (2017). Changes in energy intake and cost of transport by skipjack tuna (Katsuwonus pelamis) during northward migration in the northwestern Pacific Ocean. Deep Sea Res. II 140, 83–93. doi: 10.1016/j.dsr2.2016.05.012
Arrizabalaga H., Dufour F., Kell L., Merino G., Ibaibarriaga L., Chust G., et al. (2015). Global habitat preferences of commercially valuable tuna. Deep Sea Res. II 113, 102–112. doi: 10.1016/j.dsr2.2014.07.001
Barkley R. A., Neil W. H., Gooding R. M. (1978). Skipjack tuna, Katsuwonus pelamis, habitat based on temperature and oxygen requirements. Fish. Bull. 76, 653–662.
Bernal D., Brill R. W., Dickson K. A., Shiels H. A. (2017). Sharing the water column: physiological mechanisms underlying species-specific habitat use in tunas. Rev. Fish Biol. Fisheries 27, 843–880. doi: 10.1007/s11160-017-9497-7
Bestley S., Gunn J. S., Hindell M. A. (2009). Plasticity in vertical behaviour of migrating juvenile southern bluefin tuna (Thunnus maccoyii) in relation to oceanography of the south Indian Ocean. Fish. Oceanogr. 18, 237–254. doi: 10.1111/j.1365-2419.2009.00509.x
Block B. A., Keen J. E., Castillo B., Dewar H., Freund E. V., Marcinek D. J., et al. (1997). Environmental preferences of yellowfin tuna (Thunnus albacares) at the northern extent of its range. Mar. Biol. 130, 119–132. doi: 10.1007/s002270050231
Boyce D. G., Tittensor D. P., Worm B. (2008). Effects of temperature on global patterns of tuna and billfish richness. Mar. Ecol. Prog. Ser. 355, 267–276. doi: 10.3354/meps07237
Childers J., Snyder S., Kohin S. (2011). Migration and behavior of juvenile North Pacific albacore (Thunnus alalunga). Fish. Oceanogr. 20, 157–173. doi: 10.1111/fog.2011.20.issue-3
Cosgrove R., Arregui I., Arrizabalaga H., Goni N., Sheridan M. (2014). New insights to behaviour of North Atlantic albacore tuna (Thunnus alalunga) observed with pop-up satellite archival tags. Fish. Res. 150, 89–99. doi: 10.1016/j.fishres.2013.10.013
Dizon A. E., Yuen H. S. H. (1978). “Correlations between environment, physiology, and activity and the effects on thermoregulation in skipjack tuna,” in The Physiological Ecology of Tunas. Eds. Sharp G. D., Dizon A. E. (Academic Press, San Diego), 233–259.
Domokos R., Seki M. P., Polovina J. J., Hawn D. R. (2007). Oceanographic investigation of the American Samoa albacore (Thunnus alalunga) habitat and longline fishing grounds. Fish. Oceanogr. 16, 555–572. doi: 10.1111/j.1365-2419.2007.00451.x
Ducharme-Barth N. D., Grüss A., Vincent M. T., Kiyofuji H., Aoki Y., Pilling G., et al. (2022). Impacts of fisheries-dependent spatial sampling patterns on catch-per-unit-effort standardization: a simulation study and fishery application. Fish. Res. 246, 106169. doi: 10.1016/j.fishres.2021.106169
Fujioka K., Fukuda H., Tei Y., Okamoto S., Kiyofuji H., Furukawa S., et al. (2018). Spatial and temporal variability in the trans-Pacific migration of Pacific bluefin tuna (Thunnus orientalis) revealed by archival tags. Prog. Oceanogr. 162, 52–65. doi: 10.1016/j.pocean.2018.02.010
Hokimoto T., Kiyofuji H. (2014). Effect of regime switching on behavior of albacore under the influence of phytoplankton concentration. Stoch. Environ. Res. Risk Assess. 28, 1099–1124. doi: 10.1007/s00477-013-0816-9
Holland K. N., Brill R. W., Chang R. K., Sibert J. R., Fournier D. A. (1992). Physiological and behavioural thermoregulation in bigeye tuna (Thunnus obesus). Nature 358, 410–412. doi: 10.1038/358410a0
Ichinokawa M., Coan A. L., Takeuchi Y. (2008). Transoceanic migration rates of young North Pacific albacore, Thunnus alalunga, from conventional tagging data. Can. J. Fish. Aquat. Sci. 65, 1681–1691. doi: 10.1139/F08-095
Ijima H., Jusup M. (2023). Tuna and billfish larval distributions in a warming ocean. Available at: https://arxiv.org/abs/2304.09442.
Ijima H., Minte-Vera C., Chang Y. J., Ochi D., Tsuda Y., Jusup M. (2023). Inferring the ecology of north-Pacific albacore tuna from catch-and-effort data. Sci. Rep. 13, 8742. doi: 10.1038/s41598-023-35672-w. Stock Assessment of Albacore Tuna in the North Pacific Ocean in 2023. Retried from. https://isc.fra.go.jp/pdf/ISC23/ISC23_ANNEX08-Stock_Assessment_Report_for_Albacore_Tuna_in_the_North_Pacific_Ocean_Updated_FINAL.pdf [Accessed October 23, 2023].
ISC. (2023). Stock Assessment of Albacore Tuna in the North Pacific Ocean in 2023. Available at: https://isc.fra.go.jp/pdf/ISC23/ISC23_ANNEX08-Stock_Assessment_Report_for_Albacore_Tuna_in_the_North_Pacific_Ocean_Updated_FINAL.pdf.
Kawai H. (1972). “Hydrography of the Kuroshio extension,” in Kuroshio, Its Physical Aspects. Eds. Stommel H., Yoshida K. (The University of Tokyo Press, Tokyo), 235–352.
Kawasaki T., Asano M. (1962). Biological comparison between the Pacific tunas. Part III. Bull. Tohoku reg. Fish. Res. La.B. 20, 45–50.
Kitagawa T., Kimura S., Nakata H., Yamada H. (2004). Diving behavior of immature, feeding Pacific bluefin tuna (Thunnus thynnus orientalis) in relation to season and area: the East China Sea and the Kuroshio–Oyashio transition region. Fish. Oceanogr. 13, 161–180. doi: 10.1111/j.1365-2419.2004.00282.x
Kitagawa T., Kimura S., Nakata H., Yamada H. (2007). Why do young Pacific bluefin tuna repeatedly dive to depths through the thermocline? Fisheries Sci. 73, 98–106. doi: 10.1111/j.1444-2906.2007.01307.x
Kitagawa T., Nakata H., Kimura S., Tsuji S. (2001). Thermoconservation mechanisms inferred from peritoneal cavity temperature in free-swimming Pacific bluefin tuna Thunnus thynnus orientalis. Mar. Ecol. Prog. Ser. 220, 253–263. doi: 10.3354/meps220253
Kiyofuji H., Aoki Y., Kinoshita J., Okamoto S., Masujima M., Matsumoto T., et al. (2019). Northward migration dynamics of skipjack tuna (Katsuwonus pelamis) associated with the lower thermal limit in the western Pacific Ocean. Prog. Oceanogr. 175, 55–67. doi: 10.1016/j.pocean.2019.03.006
Landeira-Fernandez A. M., Morrissette J. M., Blank J. M., Block B. A. (2004). Temperature dependence of the Ca2+-ATPase (SERCA2) in the ventricles of tuna and mackerel. Am. J. Physiol. Regul. Integr. Comp. Physiol. 286, R398–R404. doi: 10.1152/ajpregu.00392.2003
Lehodey P., Senina I., Nicol S., Hampton J. (2015). Modelling the impact of climate change on South Pacific albacore tuna. Deep Sea Res. II 113, , 246–, 259. doi: 10.1016/j.dsr2.2014.10.028
Leisch F. (2004). FlexMix: a general framework for finite mixture models and latent class regression in R. J. Stat. Software 11, 1–18. doi: 10.18637/jss.v011.i08
Macdonald J. I., Farley J. H., Clear N. P., Williams A. J., Carter T. I., Davies C. R., et al. (2013). Insights into mixing and movement of South Pacific albacore Thunnus alalunga derived from trace elements in otoliths. Fish. Res. 148, 56–63. doi: 10.1016/j.fishres.2013.08.004
Matsubara N., Aoki Y., Tsuda Y. (2022). “Historical developments of fishing devices in Japanese pole-and-line fishery,” in Online Meeting: the Commission for the Conservation and Management of Highly Migratory Fish Stocks in the Western and Central Pacific Ocean, Scientific Committee, EighteenthRegular Session (WCPFC). WCPFC-SC18–2022/SA-IP-16.
Matsubayashi J., Kimura K., Ohkouchi N., Ogawa N. O., Ishikawa N. F., Chikaraishi Y., et al. (2022). Using geostatistical analysis for simultaneous estimation of isoscapes and ontogenetic shifts in isotope ratios of highly migratory marine fish. Front. Mar. Sci. 9. doi: 10.3389/fmars.2022.1049056
Mondal S., Lee M. A. (2023). Habiitat modeling of mature albacore (Thunnus alalunga) tuna in the Indian Ocean. Front. Mar. Sci. 10, 1258535. doi: 10.3389/fmars.2023.1258535
Mondal S., Wang Y. C., Lee M. A., Weng J. S., Mondal B. K. (2022). Ensemble three-dimensional habitat modeling of Indian ocean immature albacore tuna (Thunnus alalunga) using remote sensing data. Remote Sens. 14, 5278. doi: 10.3390/rs14205278
Muhling B. A., Liu Y., Lee S. K., Lamkin J. T., Roffer M. A., Muller-Karger F., et al. (2015). Potential impact of climate change on the Intra-Americas Sea: Part 2. Implications for Atlantic bluefin tuna and skipjack tuna adult and larval habitats. J. Mar. Syst. 148, 1–13. doi: 10.1016/j.jmarsys.2015.01.010
Muhling B. A., Snyder S., Hazen E. L., Whitlock R. E., Dewar H., Park J. Y., et al. (2022). Risk and reward in foraging migrations of North Pacific albacore determined from estimates of energy intake and movement costs. Front. Mar. Sci. 9. doi: 10.3389/fmars.2022.730428
Nakamura I., Matsumoto R., Sato K. (2020). Body temperature stability in the whale shark, the world’s largest fish. J. Exp. Biol. 223, jeb210286. doi: 10.1242/jeb.210286
Nakano H., Okazaki M., Okamoto H. (1997). Analysis of catch depth by species for tuna longline fishery based on catch by branch lines. Boll. Natl. Res. Inst. Far Seas Fish. 34, 43–62.
Nikolic N., Morandeau G., Hoarau L., West W., Arrizabalaga H., Hoyle S., et al. (2017). Review of albacore tuna, Thunnus alalunga, biology, fisheries and management. Rev. Fish Biol. Fisheries 27, 775–810. doi: 10.1007/s11160-016-9453-y
Oka E., Sugimoto S., Kobashi F., Nishikawa H., Kanada S., Nasuno T., et al. (2023). Subtropical Mode Water south of Japan impacts typhoon intensity. Sci. Adv. 9, eadi2793. doi: 10.1126/sciadv.adi2793
Okamoto S., Kiyofuji H., Takei M., Fukuda H., Ishikawa Y., Igarashi H., et al. (2013). Vertical swimming behavior and habitat of age-0 skipjack tuna, Katsuwonus pelamis, based on archival tag data in the subtropical north Pacific during winter. Boll Jpn Soc. Fish Oneanogr. 77, 155–163.
Payne N. L., Smith J. A., van der Meulen D. E., Taylor M. D., Watanabe Y. Y., Takahashi A., et al. (2016). Temperature dependence of fish performance in the wild: links with species biogeography and physiological thermal tolerance. Funct. Ecol. 30, 903–912. doi: 10.1111/1365-2435.12618
Sassa C., Kawaguchi K., Taki K. (2007). Larval mesopelagic fish assemblages in the Kuroshio–Oyashio transition region of the western North Pacific. Mar. Biol. 150, 1403–1415. doi: 10.1007/s00227-006-0434-x
Senina I., Lehodey P., Hampton J., Sibert J. (2020). Quantitative modeling of the spatial dynamics of South Pacific and Atlantic albacore tuna populations. Deep Sea Res. 175, 104667. doi: 10.1016/j.dsr2.2019.104667
Shiels H. A., Galli G. L. J., Block B. A. (2015). Cardiac function in an endothermic fish: cellular mechanisms for overcoming acute thermal challenges during diving. Proc. Biol. Sci. 282, 20141989. doi: 10.1098/rspb.2014.1989
Sunday J. M., Bates A. E., Dulvy N. K. (2011). Global analysis of thermal tolerance and latitude in ectotherms. Proc. Biol. Sci. 278, 1823–1830. doi: 10.1098/rspb.2010.1295
Sunday J. M., Bates A. E., Dulvy N. K. (2012). Thermal tolerance and the global redistribution of animals. Nat. Clim. Change 2, 686–690. doi: 10.1038/nclimate1539
Ward P., Hindmarsh S. (2007). An overview of historical changes in the fishing gear and practices of pelagic longliners, with particular reference to Japan’s Pacific fleet. Rev. Fish Biol. Fisheries 17, 501–516. doi: 10.1007/s11160-007-9051-0
Watanabe H., Kubodera T., Masuda S., Kawahara S. (2004). Feeding habits of albacore Thunnus alalunga in the transition region of the central North Pacific. Fisheries Sci. 70, 573–579. doi: 10.1111/j.1444-2906.2004.00843.x
Williams A. J., Allain V., Nicol S. J., Evans K. J., Hoyle S. D., Dupoux C., et al. (2015). Vertical behavior and diet of albacore tuna (Thunnus alalunga) vary with latitude in the South Pacific Ocean. Deep Sea Res. II 113, 154–169. doi: 10.1016/j.dsr2.2014.03.010
Yasuda I. (2003). Hydrographic structure and variability in the Kuroshio-Oyashio transition area. J. Oceanogr. 59, 389–402. doi: 10.1023/A:1025580313836
Keywords: albacore tuna, vertical distribution, biologging, lower thermal tolerance, pole-and-line fishery, longline fishery
Citation: Matsubara N, Aoki Y, Aoki A and Kiyofuji H (2024) Lower thermal tolerance restricts vertical distributions for juvenile albacore tuna (Thunnus alalunga) in the northern limit of their habitats. Front. Mar. Sci. 11:1353918. doi: 10.3389/fmars.2024.1353918
Received: 24 December 2023; Accepted: 02 April 2024;
Published: 07 May 2024.
Edited by:
Sm Sharifuzzaman, University of Chittagong, BangladeshReviewed by:
Ming-An Lee, National Taiwan Ocean University, TaiwanPatrick Lehodey, Mercator Ocean, France
Takaaki Abe, The University of Tokyo, Japan
Joe Scutt Phillips, Pacific Community (SPC), New Caledonia
Copyright © 2024 Matsubara, Aoki, Aoki and Kiyofuji. This is an open-access article distributed under the terms of the Creative Commons Attribution License (CC BY). The use, distribution or reproduction in other forums is permitted, provided the original author(s) and the copyright owner(s) are credited and that the original publication in this journal is cited, in accordance with accepted academic practice. No use, distribution or reproduction is permitted which does not comply with these terms.
*Correspondence: Naoto Matsubara, bmFvdG9tYXRzdWJhcmFmOTFAZ21haWwuY29t