 Massimo Perna1
 Carlo Brandini1,2*
 Michele Bendoni3
 Chiara Lapucci1,2
 Francois Galgani4
 Simone Panigada5
 Ana Cañadas6
 Cristina Panti7,8
 Maria Cristina Fossi7
- 1Consorzio Laboratorio di Monitoraggio e Modellistica Ambientale per lo sviluppo sostenibile c/o Consiglio Nazionale delle Ricerche - Istituto di BioEconomia (LaMMA, c/o CNR-IBE) Area della Ricerca di Firenze, Sesto Fiorentino, Italy
- 2Consiglio Nazionale delle Ricerche - Istituto di Scienze del Mare (CNR-ISMAR) Area della Ricerca di Firenze, Sesto Fiorentino, Italy
- 3Consiglio Nazionale delle Ricerche - Istituto di Scienze del Mare (CNR-ISMAR) Sede secondaria di Lerici, Forte Santa Teresa, Lerici, SP, Italy
- 4Institut français de recherche pour l'exploitation de la mer (IFREMER), Unité Ressources Marines en Polynésie (PDG-RBE-RMPF), Centre Océanologique du Pacifique, Taravao, French Polynesia
- 5Tethys Research Institute, Milano, Italy
- 6Marine Geospatial Ecology Lab, Nicholas School of Environment, Duke University, Durham, NC, United States
- 7Department of Physical, Earth and Environmental Sciences, University of Siena, Siena, Italy
- 8National Biodiversity Future Center (NBFC), National Biodiversity Future Center, Palermo, Italy
A number of marine species in the Mediterranean are threatened by the presence of several pressure factors, which include climate change, collisions with vessels, entanglement and ingestion of marine litter, especially plastic. Risk reduction policies can only be conceived starting from an accurate analysis of the exposure to such pressure factors. To estimate spatial abundance of both marine species and plastic litter and to assess the exposure risk, a two-stage analysis approach was applied, using aerial survey data from the ACCOBAMS Survey Initiative (ASI), in synergy with the Plastic Busters MPAs (PB MPAs) project. First, a detection function was fitted to observation data to obtain detection probabilities for individuals, then a Generalized Additive Model (GAM) was employed to estimate the spatial distribution of relative abundance, based on survey observations. A bivariate Local Indicator of Spatial Association (LISA) was then applied to the maps of relative abundance to derive risk maps of exposure of marine species to marine litter. The maps, obtained with a spatial resolution of about 10 km, allow us to identify areas with the highest neighboring abundance of taxa and marine litter, in particular for the MPAs studied by the PB MPAs project, which include the North-Western Mediterranean (Pelagos Sanctuary and Tuscan Archipelago), the Ionian and Aegean Sea (Zakynthos), and the Strait of Sicily (Cabrera Archipelago).
1 Introduction
The Mediterranean Sea hosts over 17,000 marine species, with approximately 20-30% of them being endemic, resulting in the highest rate of endemism globally (UNEP/MAP and Plan Bleu, 2020). That means that the Mediterranean Sea stands out as a globally significant hotspot and that, relative to its size or geographic extent, it contains a significant number of species that are found exclusively within its waters. This diverse ecosystem faces constant threats due to significant human activities (Micheli et al., 2013; Halpern et al., 2015), particularly in the northern basin where human population growth has stabilized since 1980, contrasting with a more than twofold increase in the south and east during the same period (UN DESA, 2019). Various marine species in the Mediterranean Sea are under threat from human-induced pressures such as fishing, climate change, vessel collisions, and plastic ingestion (Notarbartolo di Sciara, 2016; Panigada et al., 2006; Coll et al., 2012; Fossi et al., 2012, 2017, 2018). Coastal regions and enclosed basins, like the Mediterranean, suffer significantly from marine plastic pollution, posing a growing threat to marine biodiversity (Deudero and Alomar, 2015; Alomar et al., 2020; Darmon et al., 2017; Fossi et al., 2017; Consoli et al., 2019; Fossi et al., 2020). Lambert et al. (2020) provided quantitative assessments of plastic debris in the Mediterranean Sea using aerial survey data, including the ASI dataset. The variable spatial and temporal distribution of marine litter (ML) is influenced by several physical factors, indeed the transport primarily occurs via passive mechanisms, where marine currents, wind, wave dynamics, and Stokes drift exert simultaneous effects. Turbulent momentum transport mechanisms, particularly at mesoscale and submesoscale levels, predominantly drive dispersion (van Sebille et al., 2020). Plastic pieces larger than 30 cm typically exhibit floating behavior and are highly susceptible to atmospheric agents, thereby highlighting the relevance of wind transport effects. Furthermore, the Mediterranean region’s significant meteorological and hydrodynamic variability results in diverse regional and seasonal plastic distribution patterns (Robinson et al., 2001; Demirov and Pinardi, 2002; Lolis et al., 2008). Various approaches have been utilized to estimate marine litter exposure based on litter sources, species distributions, and spatial-temporal data. Darmon et al. (2017) assessed sea turtle exposure to marine plastic risks using aerial surveys, while Schuyler et al. (2016) correlated turtle habitat maps with plastic distribution from ocean drifter data. Additionally, initiatives like the Plastic Busters MPAs and the ACCOBAMS Survey Initiative aim to monitor and mitigate the impact of plastic pollution on marine biodiversity, especially in Marine Protected Areas (MPAs) like the Pelagos Sanctuary for Marine Mammals. Data collected by ASI in 2018, shared with Plastic Busters MPAs in 2019, facilitated collaborative efforts to evaluate plastic litter exposure risks to Mediterranean marine biodiversity. Spatial density abundance predictions were derived using Generalized Additive Models (GAM) fitted to ASI data, aiding risk assessments of taxa exposure to marine litter. Models featuring continuous representation of physical and ecosystem variability can effectively address these scale-related aspects (Guerrini et al., 2019), but they entail inherent uncertainties associated with both physical and biological process modeling, such as the distribution of feeding habitats (Druon et al., 2012).
The aim of this work was to present a method to obtain risk maps of exposure of marine species to ML in the Mediterranean Sea, and to identify potential hotspots, by combining hazard maps of plastic ML distribution with vulnerability maps of different taxa distribution, determined via a Density Surface Modeling (DSM) approach (Hedley and Buckland, 2004; Miller et al., 2013). We used the Agreement Conservation of Cetaceans of the Black Sea, Mediterranean Sea and Contiguous Atlantic Area (ACCOBAMS) Survey Initiative data, which was performed to obtain robust data on the conservation status of cetacean populations in the Mediterranean ecosystem, in synergy with the Plastic Busters MPAs (PB MPAs) project.
2 The plastic buster MPA project and the ACCOBAMS Survey Initiative (ASI)
Plastic Busters MPAs was a 4-year-long InterregMed-project with the goal of helping to sustain biodiversity and conserve natural ecosystems in pelagic and coastal marine protected areas (MPAs), by defining and implementing a harmonized approach against marine litter. The project entailed actions that addressed the whole management cycle of marine litter, from monitoring and assessment to prevention and mitigation, as well as actions to strengthen networking between and among pelagic and coastal MPAs. This involved evaluating ML presence in both coastal and offshore environments and cross mapping the distribution of litter with the distribution of selected species, mainly top predators. The deployed ML monitoring protocols were identified and elaborated within the study phase of the Plastic Busters MPAs project, and they were tested in those areas where the identification of potential ML distribution patterns was also supported by a lagrangian model implemented in a previous work by LaMMA Consortium (Laboratory of Monitoring and Environmental Modelling for the sustainable development, a joint consortium between Tuscany region and Italian National Counsil of Research - CNR) (Fossi et al., 2017).
We focus on three types of protected areas studied within the Plastic Buster MPA project:
a) Large pelagic MPAs (SPAMI - Specially Protected Areas of Mediterranean Importance, EBSA - Ecologically or Biologically Significant Marine Areas): Pelagos Sanctuary SPAMI;
b) Medium scale MPAs: Tuscan Archipelago National Park (PNAT);
c) Small scale MPAs: Cabrera Archipelago Marine-terrestrial National Park, National Marine Park of Zakynthos.
The ACCOBAMS Survey Initiative (ASI) aimed to establish an integrated, collaborative, and coordinated monitoring system across the entire ACCOBAMS area to assess the status of cetaceans and other species of conservation concern, providing robust capacity building, training, and ultimately enhancing conservation efforts and governance throughout the region (ACCOBAMS, 2021). The ASI was conducted from June to August 2018 over most of the Mediterranean Sea. Three types of aircraft were used (Britten-Norman-II, Partenavia, and Cessna 337 G Skymaster), all equipped with bubble windows so that observers could scan the sea surface and sub-surface right below the aircraft on the transect line. Observers were trained to search for all visible species, and mega-debris larger than 30 cm in size present in a 200 m strip on either side of the aircraft, following strip-transect methodology (Buckland et al., 2015). Positions were regularly rotated between data recording, right and left observation. The aircraft flew at a constant speed of 90 knots at a height of 600 feet above sea level. Observation conditions (e.g. sea state, turbidity, cloud cover, glare severity, glare orientation) and a subjective estimation of small cetacean detectability (subjective conditions) were systematically recorded during active survey effort. Flight data and sightings were recorded using VOR v8.6 software during SAMM survey (Suivi Aérien de la Mégafaune Marine en France métropolitaine - winter 2011/12 and summer 2012) and SAMMOA v1.1.2 software during ASI survey (http://www.observatoire-pelagis.cnrs.fr/publications/les-outils/article/logiciel-sammoa). The ASI survey design involved delineating various areas (blocks and sub-blocks), with transects following a systematic zig-zag pattern detailed in Panigada et al. (2023) and Cañadas et al. (2023). In this study, data obtained from the ASI survey, which intersects with areas covered by the PB MPAs project, has been used to determine the risk assessment associated with the abundance of taxa and ML.
3 Materials and methods
The data employed were collected in 2018 by the ASI (Panigada et al., 2023), and shared, in 2019, through an agreement with the Plastic Busters MPAs, with the aim of capitalizing the efforts of the two projects in a synergistic way, to evaluate the risk of exposure to plastic litter of the Mediterranean marine biodiversity. To derive a spatial density abundance prediction in each sector, detection functions were fitted to the data (different for each sector and each target). Afterwards, the spatial modeling was accomplished through a Generalized Additive Model technique (GAM), followed by the analysis of the model output and the inference phase. Such a procedure, performed via the dsm R-package (Miller et al., 2022), resembles the DSM workflow reported by Miller et al. (2013) and is similar to the one adopted for other analyses of the ACCOBAMS data, as reported in technical reports (i.e. ACCOBAMS, 2021). The risk assessment procedure was carried out by evaluating the exposure of the analyzed taxa to ML. Despite the distinct characteristics driving the movements of analyzed taxa and ML in water, we simplified the analysis by adopting the same approach for both targets, employing respective detectability models. Since observations are not repeated over time across the study areas, the relative abundance distribution of targets obtained can be considered as originating from a series of “snapshots” captured during individual transect surveys. However, given the trade-off between aforementioned simplification, the demanding nature of this observation campaign, and the importance of having concurrent information about marine species and plastic litter presence, resulting maps serve as valuable indicators of their spatial distribution, in the context of risk assessment procedure design.
3.1 The dataset
The analysis considered 15 distinct ASI survey blocks: (04-08a-08b-09-10-11-12-13-20-21-21b-22a-22b-22c-22d) (Panigada et al., 2023). Additionally, since the dataset wasn’t contiguous, it was divided into three parts and analyzed separately: North-West Mediterranean (NWM – 439,300 km2), Strait of Sicily (SOS – 156,600 km2), and Ionian/Aegean Seas (IAS – 268,700 km2) (see Figure 1).
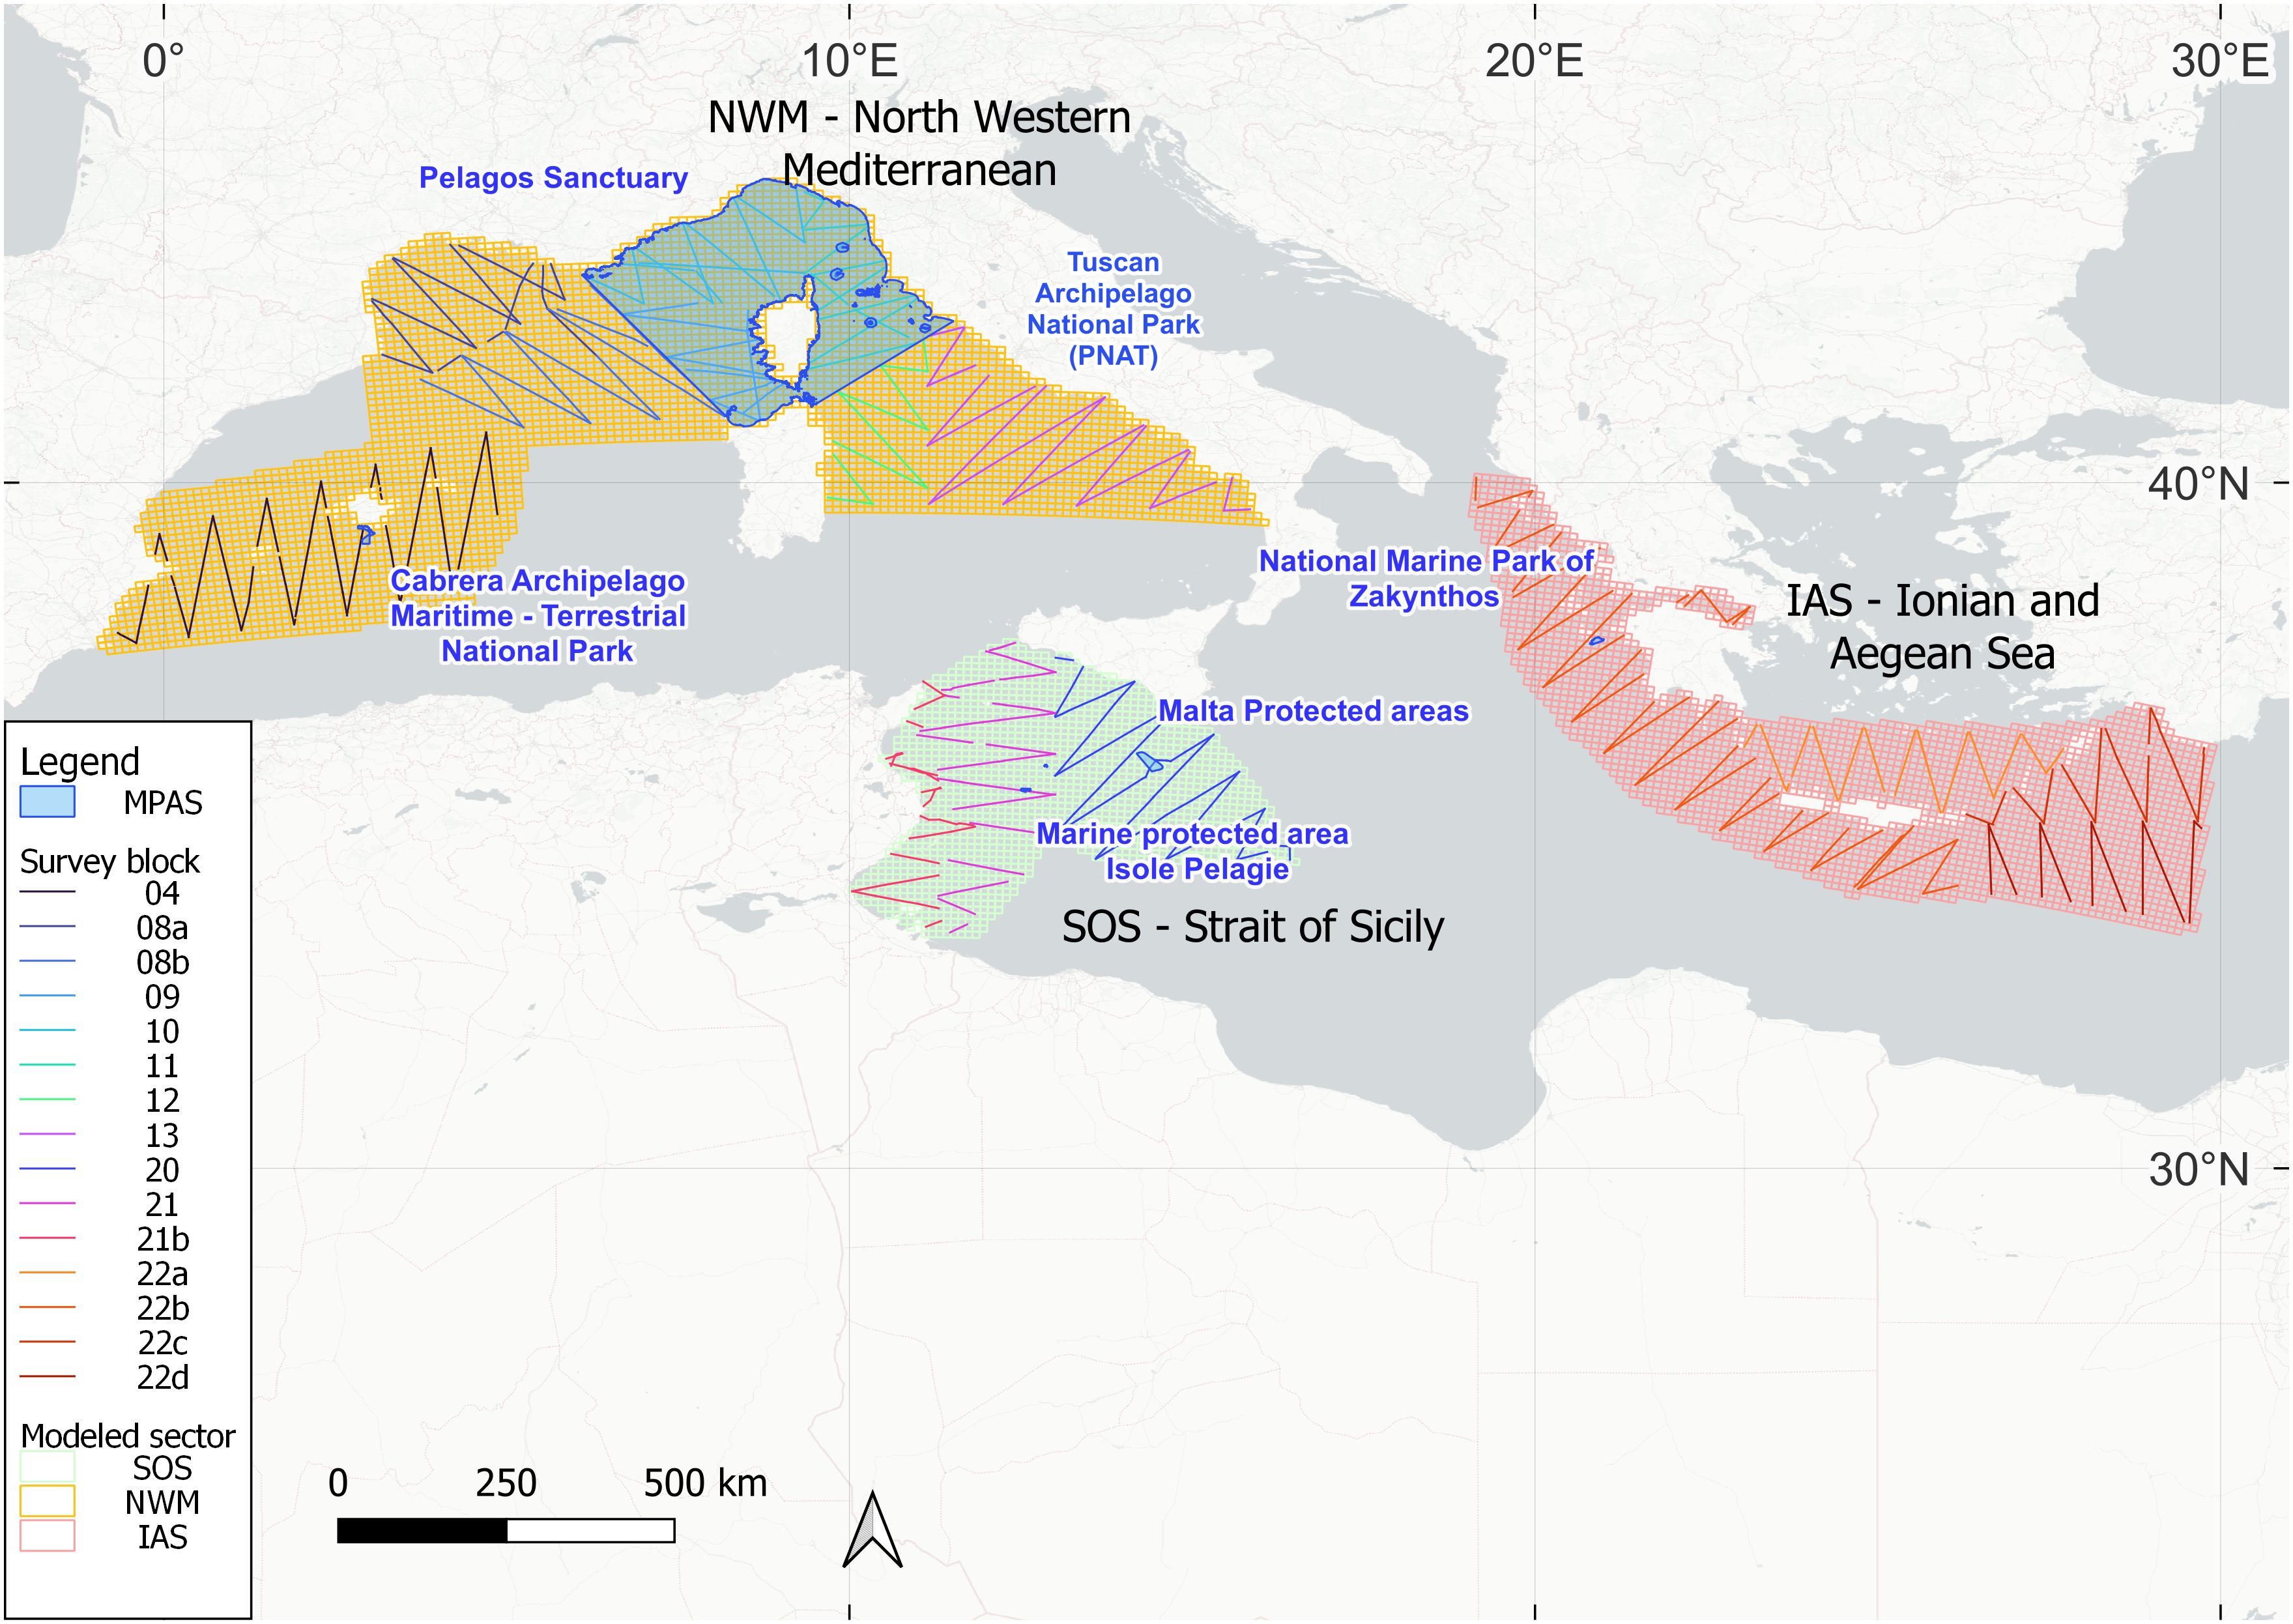
Figure 1 View of the transects followed during the ASI aerial surveys (different colors for each survey block as in legend), and also monitored in the PB MPAs project and subdivision in three sectors to conduct the analysis. Each color indicates a differently modeled sector, i.e. orange: North-West Mediterranean (NWM) including part of the Tyrrenian sea, green: Strait of Sicily (SOS) and red: Ionian/Aegean Seas (IAS). Blue polygons are the main protected areas analyzed in Plastic Buster MPAs Project.
Several steps were identified for the data processing according to the strategy previously proposed by Darmon et al. (2017):
1) to define square unit (5-10 nautical miles) for the whole target area;
2) to calculate the amount of each variable (ML/cetaceans/sea turtles/fish, etc.) in each square;
3) to define the sampling effort in each square (hours of flight/square Km, probability of sampling effort): “maximum” corresponds to the maximum effort or number of hours of flight (1), “zero” is no effort;
4) to relate the amounts of each variable/sampling effort in each square (probability of presence): “maximum” (1) corresponds to the maximum amount of each variable (litter/species), “zero” is absence;
5) to map the distributions (standardized by sampling effort): each square as 0 to 1 value;
6) to cross-map data of litter and of each variable (cetaceans/sea turtles/fish, etc.). This may be obtained multiplying the indicators from points 3 and 4;
7) to analyze the distribution of cross probability (6) through various algorithms such as kernel, kriging, minimum distance, etc.
In ASI surveys, litter observations are marked by a predominance of plastic and various non-plastic items such as wood, oil, fishing debris, and unidentified refuse. For the purpose of ensuring consistency, only data specifically described as “plastic litter” (PL) have been taken into account in this analysis to examine a standardized dataset. Taxonomic groups including several marine species with similar detectability have been modelled. Each taxonomic group mentioned here corresponds to the criteria outlined in the ACCOBAMS protocols (ACCOBAMS, 2021). The work focused on top predators, including whales, dolphins, “small” and “large” fish. For fish, the discrimination was made by size and not by species, because data were retrieved through aerial surveys, and more specific details are seldom present in the available observed dataset.
The selected groups include:
1) large Dolphins (LD), including bottlenose and Risso’s dolphins, long-finned pilot whales.
2) large Fish (LF), including swordfish (Xiphias gladius) and tuna species.
3) small Fish (SF), small and unidentified fish categories.
4) whales (W), fin whales and unidentified species, excluding minke whales but including sperm whales.
For statistical significance, only areas with a minimum density of 1 * 10-5 per Km2 observations have been analyzed. In particular, the whales group has been analyzed only in the NWM area (Table 1).
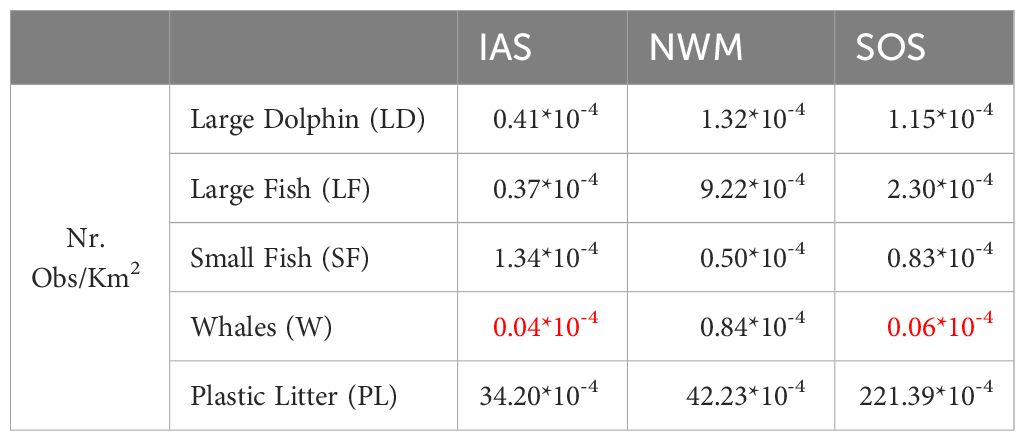
Table 1 Number of observations per Km2 (averaged values) in the 3 analyzed sectors for all the surveyed species (pooling as in ACCOBAMS, 2021); red values corresponds to a number of observations below the threshold assumed to be statistically significative (10-5 Obs/Km2); so distributions of W in those areas haven’t been modelled.
Most of the observations occurred in the NWM sector, which is the largest one and also includes the SPAMI Pelagos Sanctuary. Plastic items observed in the SOS sector are proportionally much higher than in the other sectors. Due to limitations in aerial survey detection, PL can only refer to observations of plastic material larger than 30 cm (ACCOBAMS, 2021). From now on, PL is only intended as this type of material.
Data spans from 06/06/2018 to 20/08/2018 in IAS, from 12/06/2018 to 29/07/2018 in NWM and from 21/06/2018 to 14/07/2018 in SOS. Hence, the representativeness of derived distributions is limited to the summer period, as the winter conditions are notably much different.
3.2 Fitting the detection function
The distance sampling technique for line transects is a commonly employed method for estimating the spatial density of a biological population (Hedley and Buckland, 2004; Barlow and Forney, 2007; Bilgmann et al., 2019; Di Matteo et al., 2022). The detection function, denoted as p(x), provides an estimation of the ability to detect items as a function of the orthogonal distance x from the surveyed line transect. This approach allows us to relax the assumption that all objects within the analyzed area are detected, thereby estimating the number of missed objects and, consequently, the total number present. Specifically, the probability of detection P is given by:
where w represents the truncation distance, defined as the maximum perpendicular distance from the line transect within which collected observations are considered in the model. Observations of targets that are too distant from the transects hold less significance when fitting the detection function. Furthermore, sparse observations at greater distances, characterized by increased uncertainty and lower frequency, may affect the results, resulting in greater variability in estimates.
In line with other ACCOBAMS reports (e.g., ACCOBAMS, 2021), specific detection functions were derived for each analyzed group and sector. Two distinct functional forms, namely hazard rate (hr) and half normal (hn), were tested as fundamental functions for both PL and taxa groups.
Each detection function, customized for specific sectors and taxonomic groups, was chosen based on rigorous model fitting diagnostics conducted by ACCOBAMS. These diagnostics encompassed evaluations of the Akaike Information Criterion (AIC), goodness-of-fit tests employing Cramer-von Mises statistics, analysis of quantile-quantile plots (Q-Q plots), and examination of fitted function plots (Figure 2).
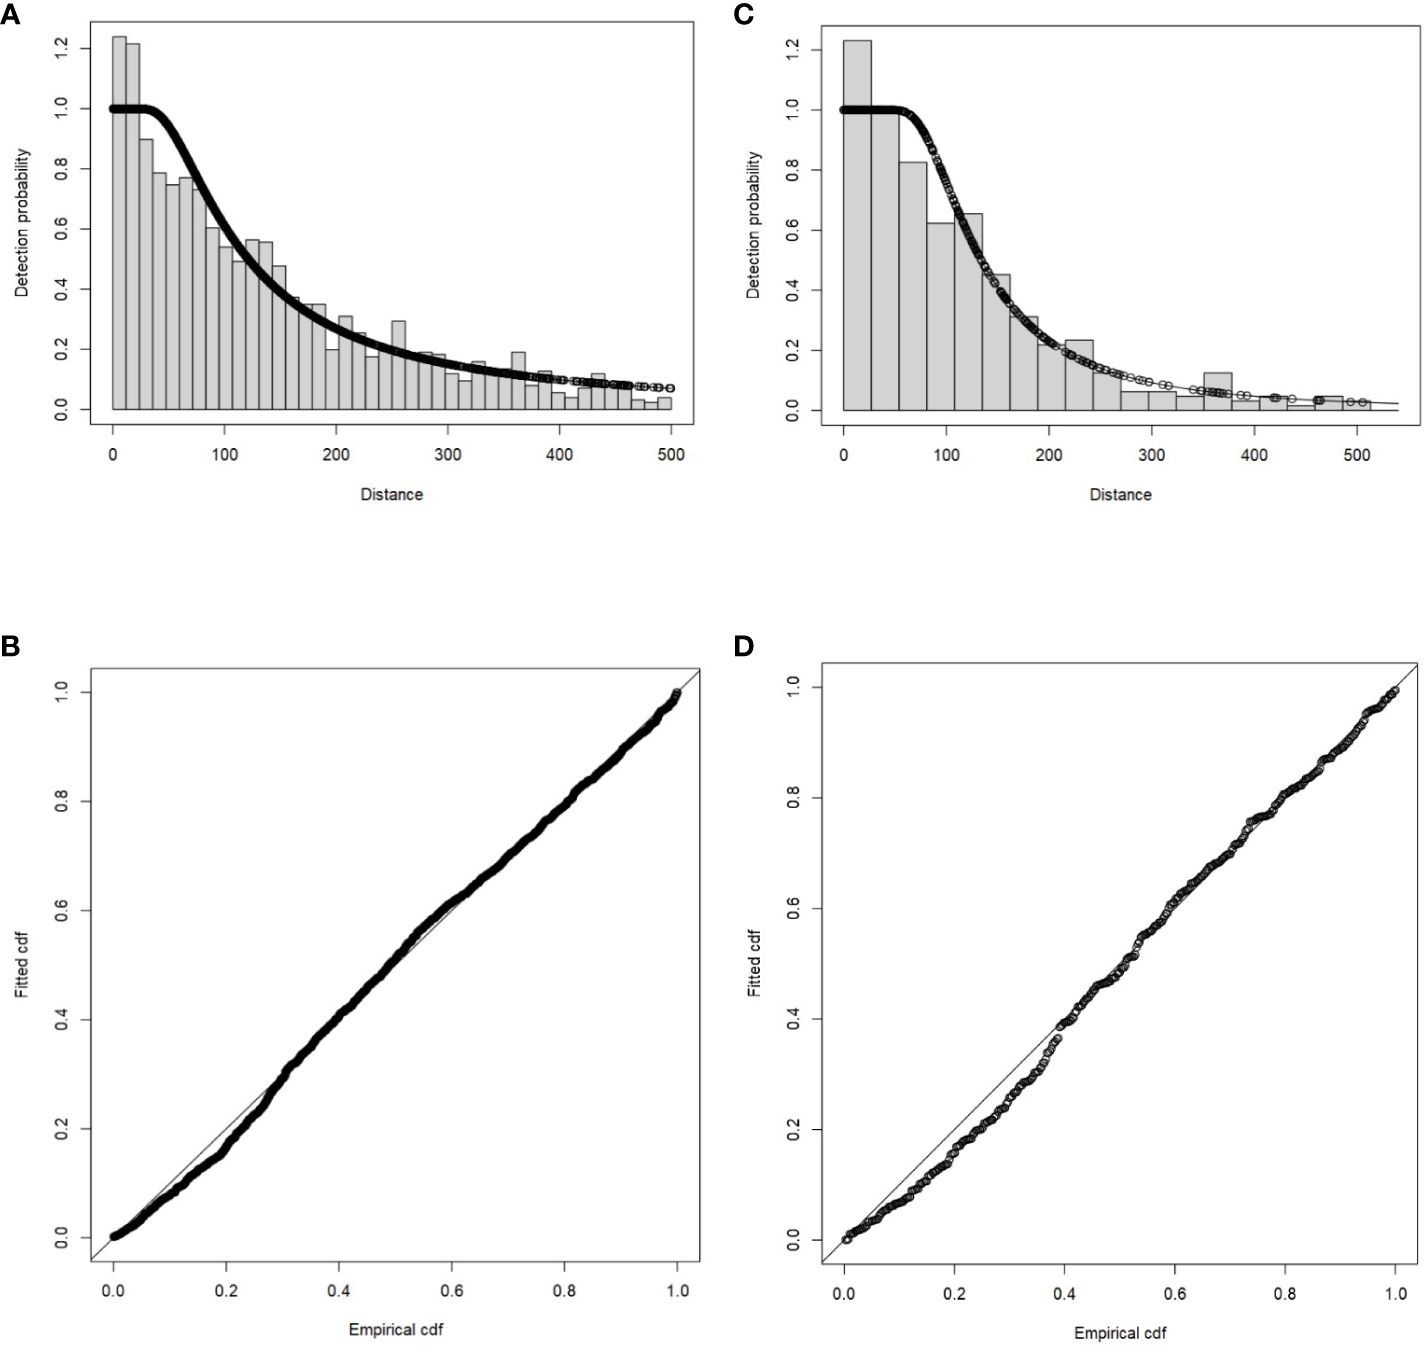
Figure 2 Examples of relative frequency distribution and fitted detection, and q-q plot for LF in sector 2 (A, B), and PL in sector 3 (C, D), respectively.
ACCOBAMS prescribed truncation distances, representing the maximum perpendicular distances allowed for targets, were applied for each analyzed group.
For PL in the North-Western Mediterranean (NWM), three models were tested (refer to Supplementary Information), given that the p-value of the von-Mises test for both hr and hn (with cosine adjustment) fell significantly below 5%. Despite employing a polynomial adjustment to achieve the best fit, it resulted in a higher AIC.
3.3 Fitting the DSM and risk assessment procedure
Density surface models were produced by modeling species abundance as a function of spatial distribution of targets. Spatial GAM has been used to estimate the relative abundance of targets (Miller et al., 2013). As this is a well-known procedure also used by ACCOBAMS (2021), we adopted the same method, but to keep the approach as simple as possible, a bivariate smooth of coordinates was used without additional covariates.
Abundance was predicted on a 10x10 kilometers grid. For each cell of the grid, the count (n) of groupsi in each i segment of each cell, was used as the response variable. The general structure of the model is:
Where:
- represents the count on each segment in each cell.
- is the intercept and are residuals (i.e., differences between model and observation).
- is the area of each segment, and is the detectability (probability of detection) in the segment.
- is the bivariate smooth of coordinates (longitude and latitude).
The GAM algorithm facilitates the selection of different response distribution types. Here, the negative binomial distribution was chosen to account for overdispersion (Miller et al., 2013; Roberts et al., 2016; Sigourney et al., 2020). A “soap film” smoother algorithm was also employed to account for the complex geometry of the study areas (Wood et al., 2008), particularly for the presence of large islands and narrow channels in sectors 1 and 2, aiding in explaining deviance to a higher degree than other approaches.
The spatial GAM allows predictions over the grid to calculate relative abundance, i.e., the count of targets per square kilometer, normalized in a range between 0 and 1. This facilitates comparison of spatial distributions of examined taxa with plastic trash distribution. Relative abundance maps were checked for autocorrelation to ensure no autocorrelation pattern is present in the residuals. Autocorrelation can lead to misleadingly narrow confidence intervals due to pseudo-replication, where clustered measurements, if not independent, artificially increase sample size without contributing useful information (Hurlbert, 1984).
The risk assessment employed a LISA (Local Indicators of Spatial Association) bivariate approach (Anselin, 1995; Anselin et al., 2002), considering relative spatial distribution between taxa and plastic litter on a 10x10 km grid. The method correlated, for each cell, the relative abundance of a taxon with the PL relative abundance in the neighboring cells. A threshold was set at the 95th percentile confidence interval for clustering significant values. It must be clear that detected patterns do not give any help in explaining the spatial processes which generated them. Patterns may be due to specific, period-related covariates (not used in this analysis), as well as to not optimal settings of the modeling of the observations under investigation. Moreover, correlation does not imply any actual causation among the phenomena under study.
4 Results
4.1 DSM, relative abundance and uncertainty analysis
The results of the DSM are depicted in Figure 3 for both the taxa and the three sectors: NWM, SOS, and IAS. Generally, while the relative abundance of taxa displays a uniform pattern, the distribution of PL exhibits a patchier aspect. This difference may be due to the fact that, at the analyzed spatial scales, currents tend to cluster passive plastic material (Meacham and Berloff, 2023) following the spatial and temporal variability of winds and surface flow field. Consequently, evolving concentration patterns may emerge, which might be hardly detected through a single survey.
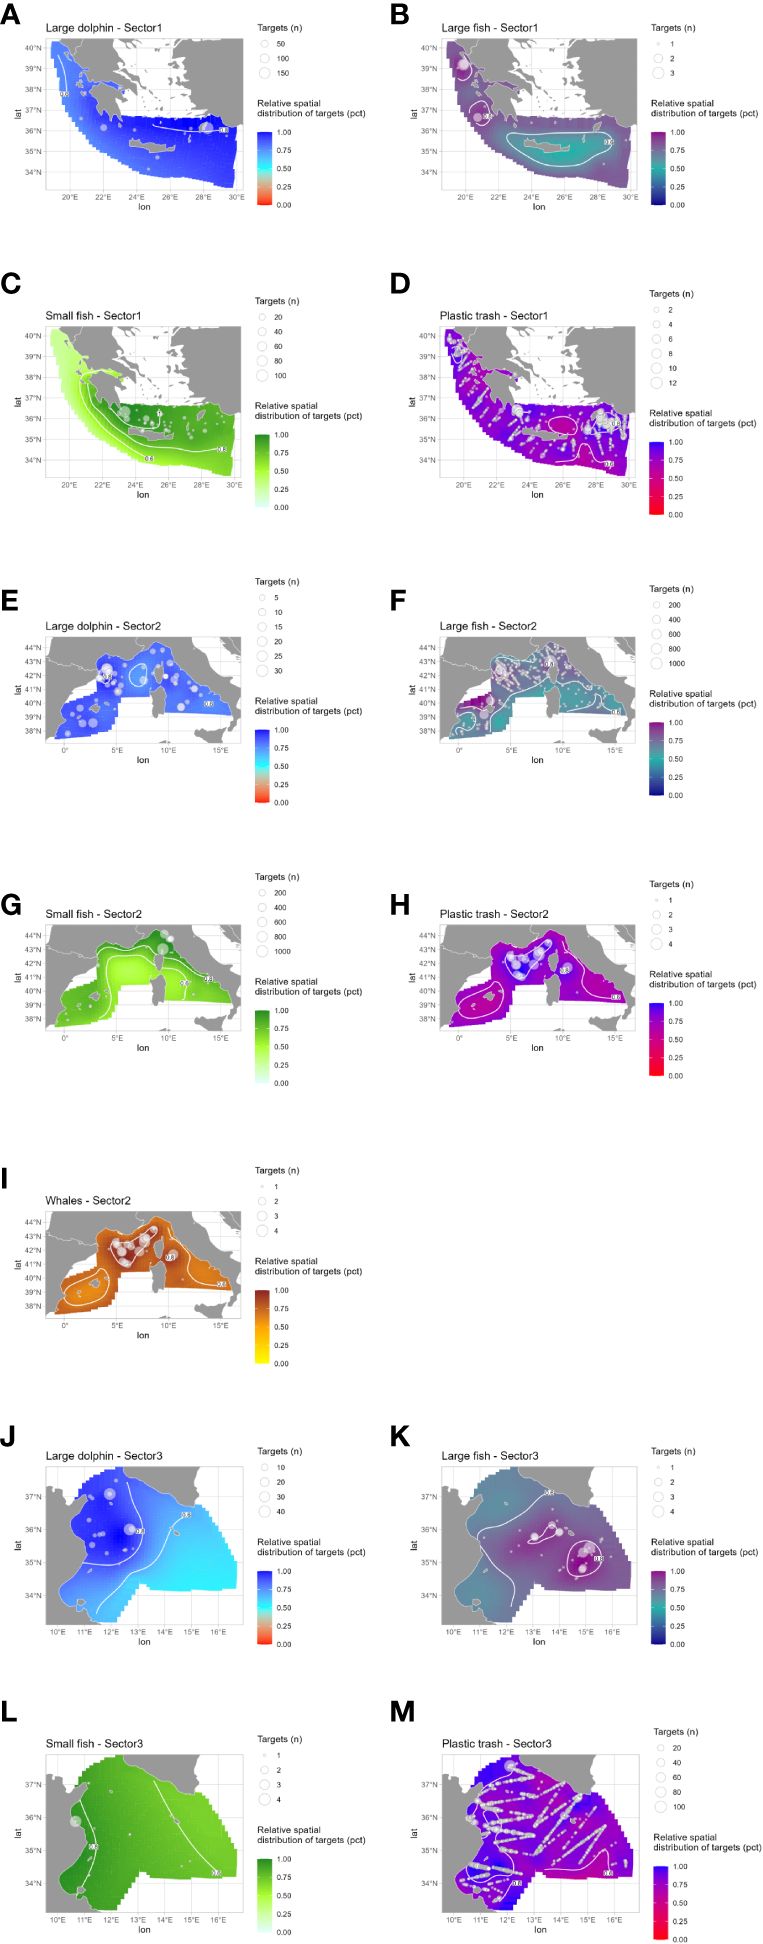
Figure 3 Spatial distribution of relative abundance of target taxa and PL for the 3 analyzed sectors. (A–D) = LD, LF, SF and PL in IAS. (E–I) = LD, LF, SF, PL and W in NWM. (J–M) = LD, LF, SF and PL in SOS. For each type of target, a different color has been adopted. Dots represent n. of targets in the spot where the observation occurred.
In the NWM, the largest area under study encompassing the Pelagos Sanctuary, it is noteworthy to confirm the substantial presence of the considered cetacean species (fin whales, sperm whales) during the survey period (Figure 3I). Large fish also exhibit high abundance in this area during the same period (Figure 3F), while the presence of dolphins and small fish appears more evenly distributed in the Western Mediterranean (Figures 3E, G).
Regarding the concentration of PL, areas with higher concentrations are notably more evident in the Tyrrhenian than in the Ligurian-Algerian basin (Figure 3H). This behavior, regarding macroplastic concentrations, is not unexpected, as in the summer period, the mixing of waters between the Tyrrhenian and Ligurian basins is interrupted due to thermohaline circulation. Additionally, water transport from the Tyrrhenian to the Ligurian basin, typically directed northwards in winter, is interrupted or even reversed during the summer period.
Uncertainty in the DSM procedure arises from both distance sampling and the determination of the detection function, as well as from the GAM employed. To assess this degree of uncertainty on the estimation of the relative abundance of both taxa and plastic litter across different sectors, the following quantities are determined: the Coefficient of Variation (CV) for the chosen detection function and GAM, and the total coefficient of variation (average sector values reported in Table 2). Furthermore, the algorithm enables calculation of a “per-cell” CV by splitting the data into cells of a grid in each sector. In this case, the obtained CV can be mapped to identify areas with the largest variance. Generally, larger CV values are situated at the borders of the modeled domain and within areas characterized by a low density of data (an example of these plots in Figure 4).
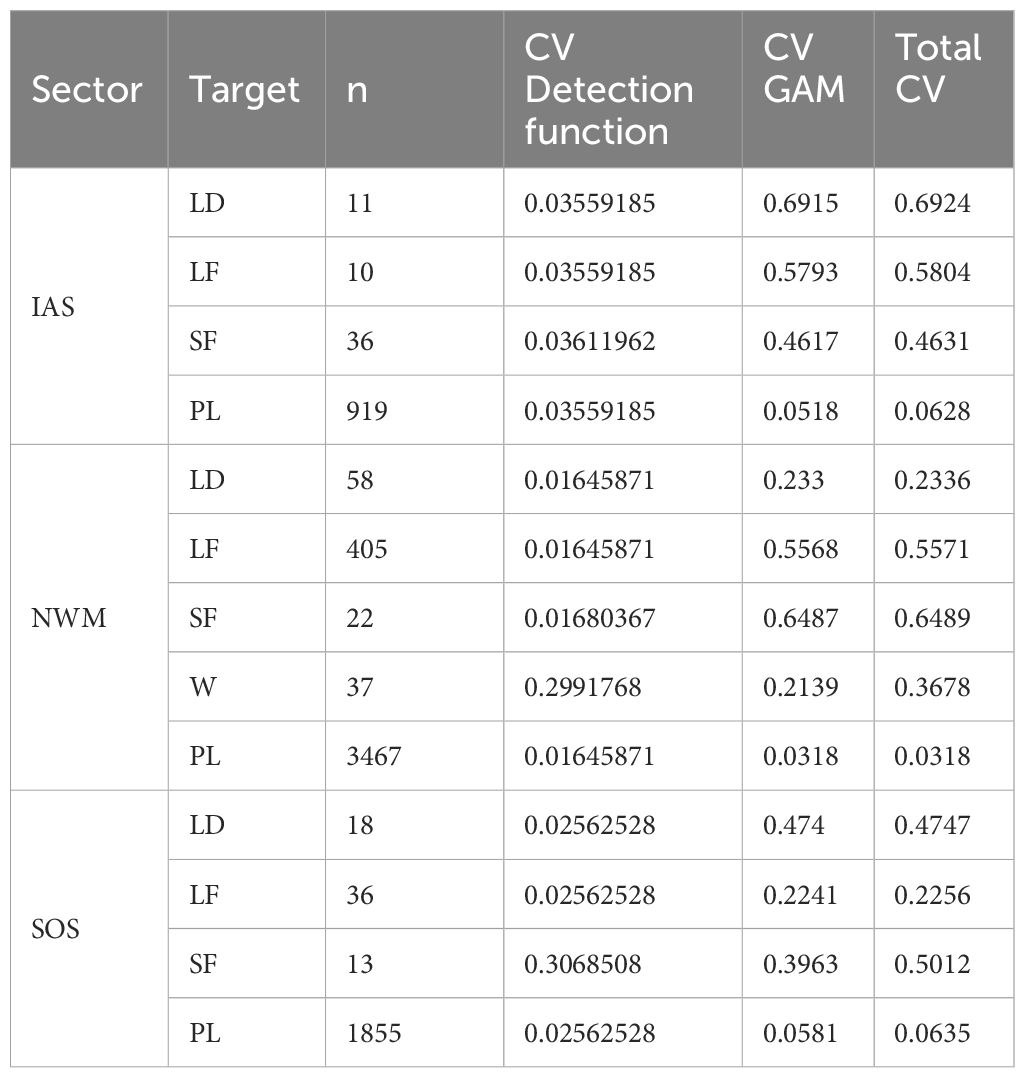
Table 2 Summary of uncertainty in a density surface model calculated analytically for GAM, with delta method.
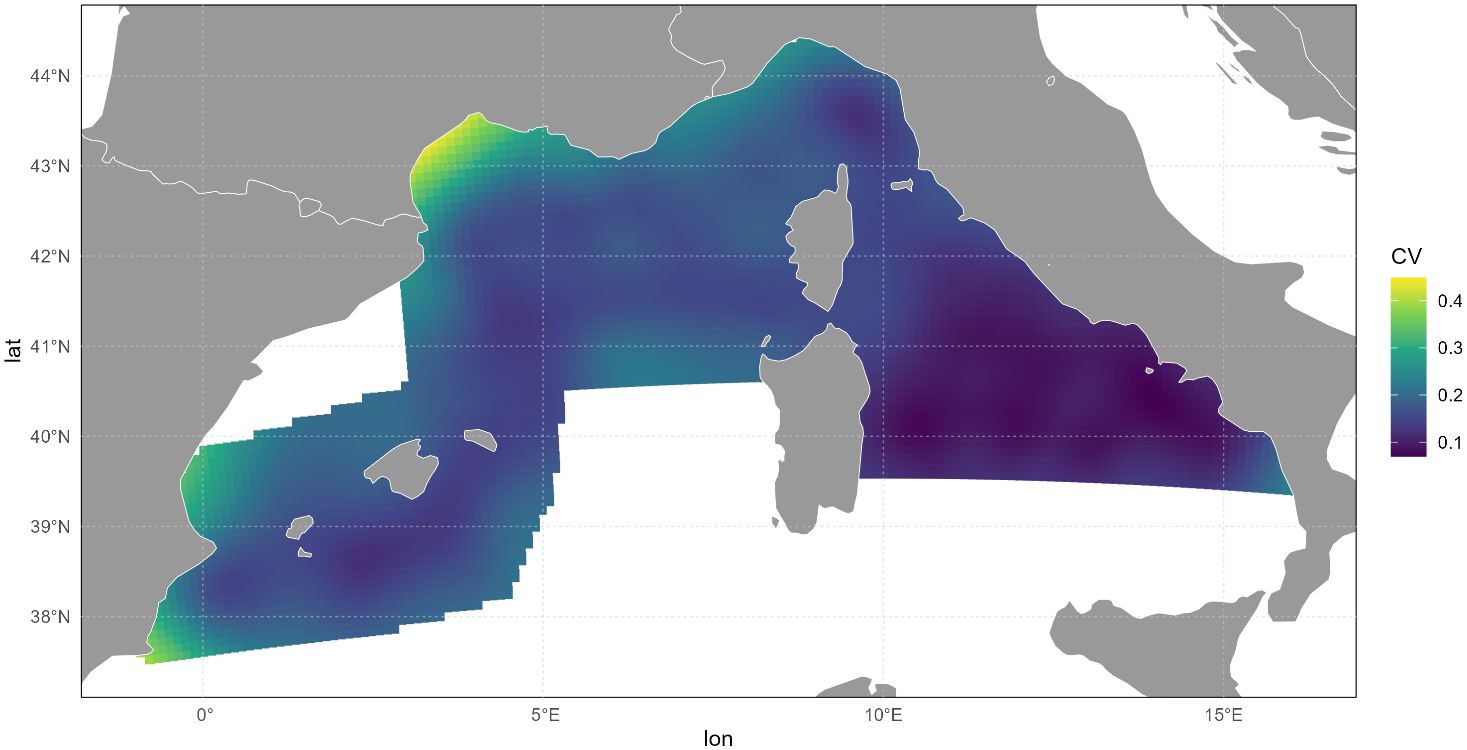
Figure 4 Example of CV “per-cell” map of PL GAM in NWM.
4.2 Exposure to PL
The risk assessment regarding the potential exposure of marine fauna to PL was estimated by integrating information from the relative abundance of PL and specific taxa using the LISA bivariate approach (Anselin et al., 2002).
This approach involves evaluating, for each cell of the grid, the correlation between taxa and PL abundance in the neighboring cells. In essence, each variable (e.g., taxa) is compared with the spatial distribution of the environmental pressure variable (e.g., PL) in the surrounding cells.
Exposure maps are presented for those taxa with at least 10 targets in each sector. These maps allow us to visualize the potential areas where marine fauna may be at risk of exposure to plastic litter, based on the spatial distribution and abundance of both PL and specific taxa.
To quantify the exposure, we assigned different colors to the analyzed areas, based on the following classes:
• light grey areas: clusters of not significant correlation of group of taxa or PL;
• green areas: clusters of low (about< 1.5 sd) relative abundance of taxa targets in a low relative environment of PL;
• yellow areas: clusters of relatively low relative abundance of taxa targets in high (about > 1.5 sd) relative environment of PL;
• orange areas: clusters of high relative abundance of taxa in areas of low relative environment of PL;
• red areas: clusters of high relative abundance of group targets in high relative environment of PL.
The exposure maps for the different taxa and sectors are reported in Figure 5.
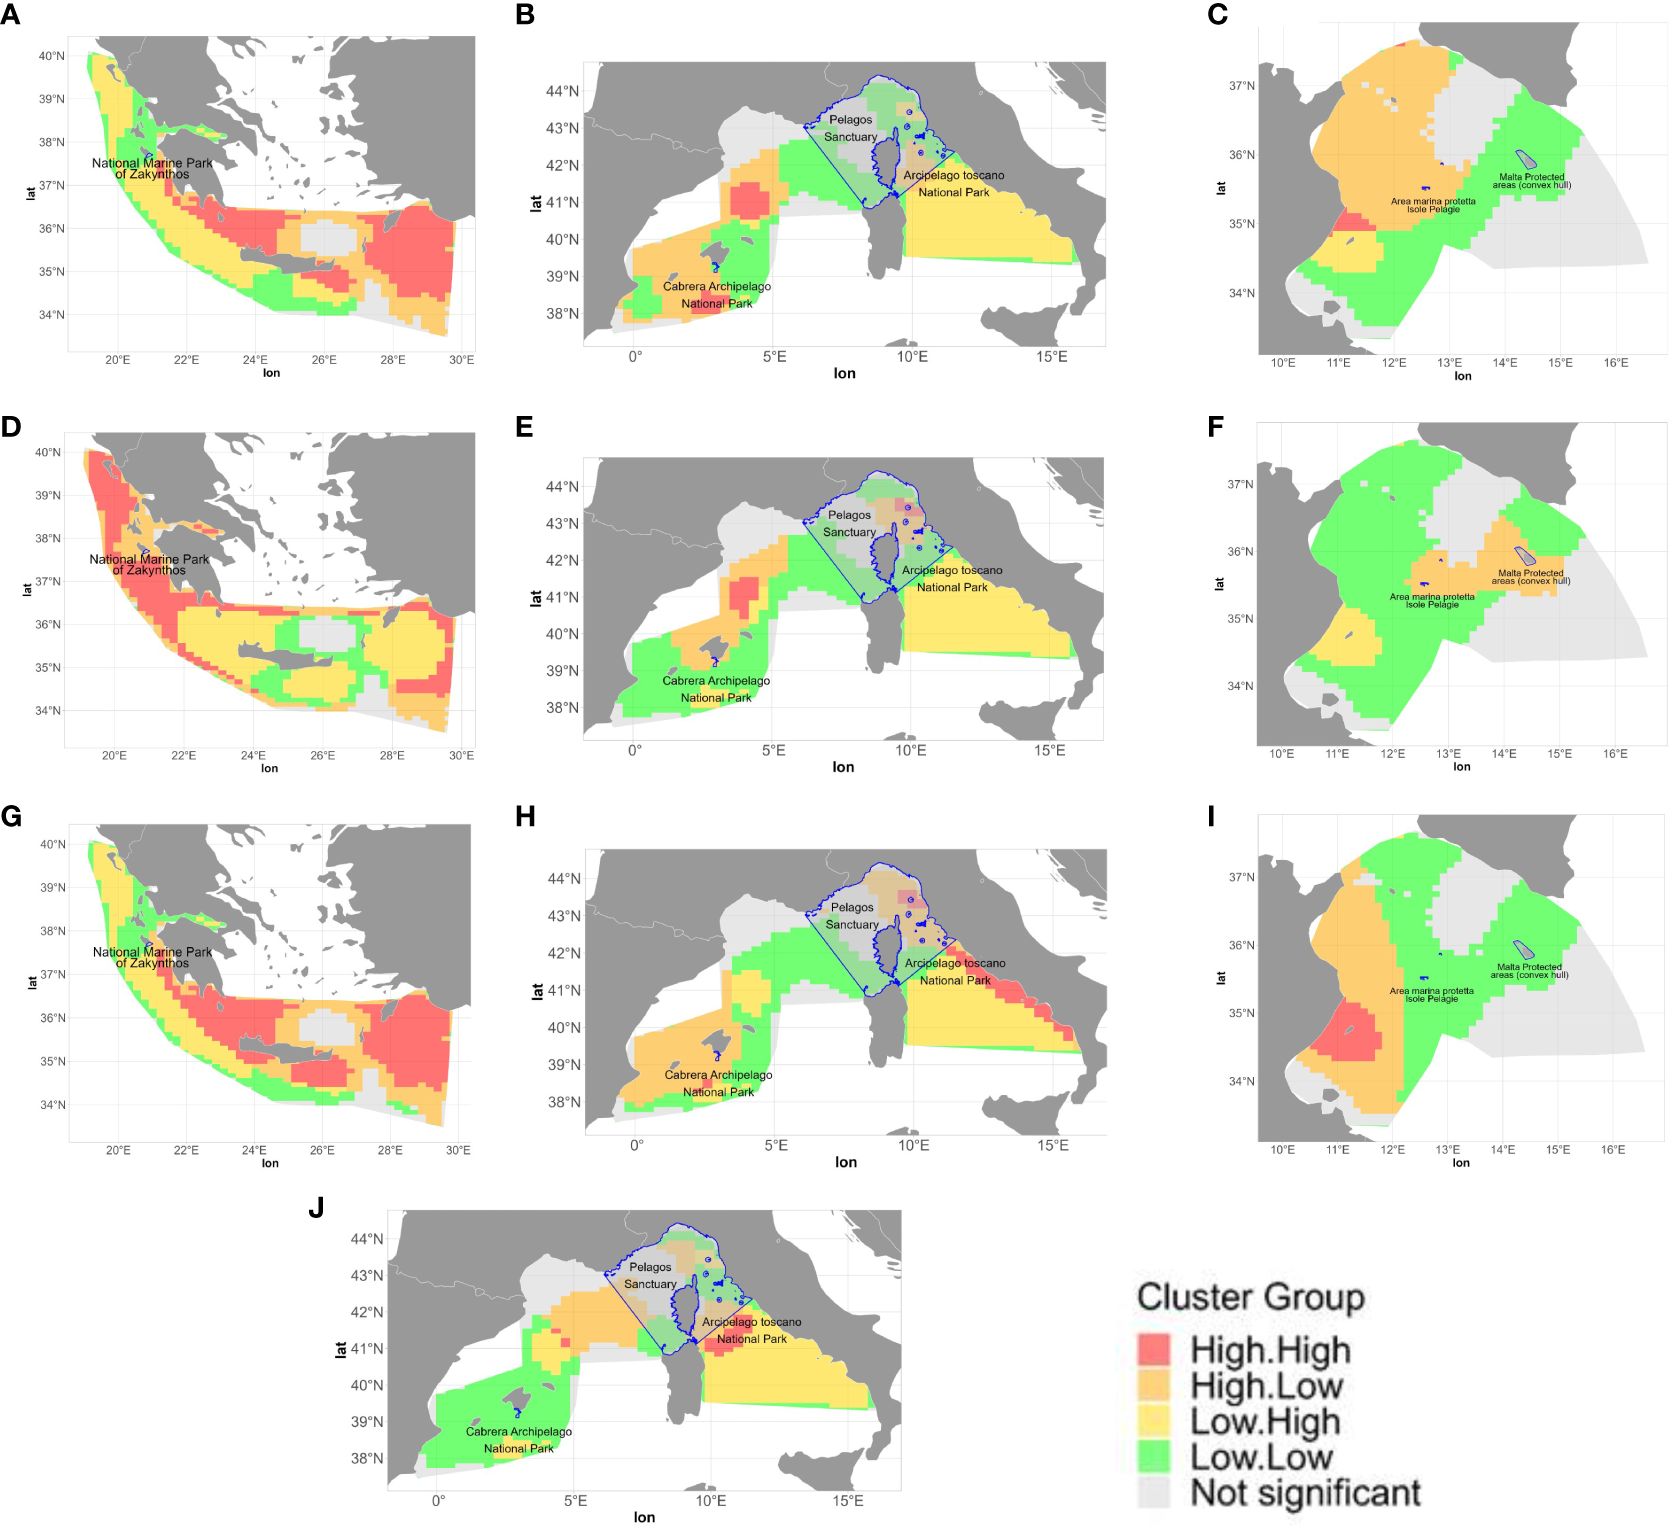
Figure 5 Clusters of relative distributions of LD (Large Dolphins) vs PL (Plastic Litter) (Part 1, A–C), LF (Large Fish) vs PL (Part 2, D–F) and SF (Small Fish) vs. PL (Part 3, G–I). In (J) panel the W (Whales) group for NWM area. In the legend, the first indication of the cluster name is referred to the taxa examined and the other to the PL.
5 Discussion
The exposure maps depicted in Figure 5, while constrained by the limitations inherent in the representativeness of the data, as previously discussed, allow us to clarify specific aspects of each of the investigated areas:
1. Within the IAS sector, the assessment reveals that the National Marine Park of Zakynthos MPA exhibits a low risk for most taxa except for Large Fishes (LF), which face relatively higher risks due to their presence in areas characterized by low plastic litter (PL) but elevated LF presence. Notably, the central-eastern areas of this sector pose the highest risk for large dolphins (LD) and small fish (SF), with a pronounced overlap between PL and taxa observed, particularly in the eastern area owing to high PL density.
2. In the NWM sector, characterized by large spatial heterogeneity, the Pelagos Sanctuary emerges as the most significant area of interest. Here, the higher PL presence in the southeastern part poses a notable threat mainly to SF, but the impacts on whales in the northwestern part can also be significant. Additionally, high PL presence is observed in the east-southern area and localized spots around the Balearic Islands and the Gulf of Genoa.
3. Within the SOS sector, PL predominantly accumulates along the eastern side of Tunisian coasts and the west-southern coast of Sicily. The primary threat in this sector pertains to LD and SF, with the “Isole Pelagie” MPA exhibiting higher PL exposure compared to MPAs around Malta. LD and SF concentrate in the western area, where PL is clustered, while LF shows greater clustering in the eastern area, seemingly less impacted by PL.
In the context of the Northwest Mediterranean (NWM), and particularly within the Pelagos Sanctuary area, other studies in the literature have highlighted the significant risk posed to the biodiversity present in this region. For instance, Guerrini et al. (2019), in their decadal assessment of plastic ingestion risk by fin whales within the Pelagos MPA, identified a potential hotspot for fin whales in the Liguro-Provençal basin during the summer feeding season, based on simulations of plastic debris dispersal and ecological modeling. Similarly, Darmon et al. (2017) in their analysis of aerial surveys, highlighted elevated pollution levels, especially in this Mediterranean area, with potential detrimental effects on biodiversity, notably on sea turtles. Darmon et al. (2017) emphasizes the importance of integrating empirical data with simulation models to understand spatiotemporal variability in sensitive areas and assess factors influencing interactions between species and debris, highlighting the limitations of single-time observations in determining impacts on marine fauna. However, it is noteworthy that the peculiar summer circulation patterns between the Tyrrhenian and Ligurian seas, with limited exchange between the two basins in this period, mitigate the risk of whales’ exposure to macroplastics in the Pelagos Sanctuary during the summer season.
One of the main issues in the current analysis is the sample size used in the spatial model, especially for the IAS area and for LD and LS groups, but also for the SF group in NWM (see Table 1). This is quite evident in the exposure maps where non-significant correlations areas are commonly low density target areas (both taxa and ML).
As already stated, it is important to remark that the determined patterns of ML ad taxa distributions are related to the moment in which surveys occurred. Only repeated surveys during the same period of the year might help to map distributions more affordably. Also, in this preliminary study on ASI data, we did not include any covariate in the spatial model (i.e. depth, distance from the coast, SST) which could affect the results, at least for specific groups. Results of spatial distribution hold significance in establishing conservation priorities and are becoming increasingly crucial in decision-making for cost-effective approaches to safeguard biodiversity. Hotspots may exhibit dynamism and fleeting nature, yet this does not detract from their ecological significance.
Regarding the PL hotspots, various authors, utilizing both direct measurements of transport at sea like Lagrangian drifters (Zambianchi et al., 2017) and numerical models of transport and dispersion (e.g., Fossi et al., 2017), have demonstrated the critical contribution of surface currents in determining the surface distribution of plastic litter, even in confined environments such as the Mediterranean basin. In contrast, animal movement ecology operates at a significantly higher level of complexity, encompassing habitat associations, the extent and utilization of geographical ranges, migratory pathways, phenology, and interactions between animals and their environment.
6 Conclusions
The present investigation was aimed at evaluating the risk posed to marine biodiversity in specific Mediterranean areas by exposure to plastic litter (PL), aligning with the objectives of the ASI and Plastic Busters MPAs joint effort. The analysis revealed variability in estimates, particularly in areas with limited data and in coastal and boundary regions, consistent with findings in existing literature.
Furthermore, ecosystem variability, notably in large pelagic marine mammals, exhibits a seasonal behavior influenced by physical and trophic conditions, posing challenges for accurate modeling. Despite limitations in data representativeness, our risk analysis based only on observational data provides a robust foundation for discussing the relative distributions between species and PL.
The study highlights the benefits of cross-mapping the distribution of PL and marine species using observational data for management purposes. Such an approach, although tested at a limited scale due to resource constraints, provides a large-scale assessment to delineate areas at risk and prioritize mitigation measures. The ASI dataset offers a valuable resource, providing a comprehensive dataset of both fauna and PL (macroplastics) acquired simultaneously during monitoring campaigns. It is also important to point out, for the purposes of the conclusions of this analysis, that aerial surveys are effective in identifying larger debris (>30 cm), while smaller debris, including microplastics, are also present and pose risks to marine life (Lambert et al., 2020). Detecting and assessing these smaller debris particles require additional methods and technologies, and needs even greater synergy between different initiatives.
Preservation efforts should focus on continuous monitoring of high-risk areas, such as the Pelagos Sanctuary, to safeguard fragile habitats and species. Systematic surveys over time, coupled with integrated and harmonized monitoring tools, are crucial for estimating variations in population abundance and PL trends, enhancing our understanding of spatial risk exposure, and facilitating measures to protect vulnerable marine species.
In conclusion, our research emphasizes the critical importance of conducting thorough evaluations of marine debris and its repercussions on biodiversity in the Mediterranean. This has profound implications for devising conservation and management strategies. It is imperative to prioritize further research and monitoring endeavors to tackle the challenges presented by marine debris and to ensure the effective protection of marine ecosystems.
Data availability statement
The datasets presented in this study can be found in online repositories. The names of the repository/repositories and accession number(s) can be found here: https://accobams.org/asi-dataaccess-request/.
Ethics statement
Ethical approval was not required for the study involving animals in accordance with the local legislation and institutional requirements because this study used observations of animals previously conducted under other research efforts.
Author contributions
MP: Conceptualization, Data curation, Formal analysis, Investigation, Methodology, Validation, Visualization, Writing – original draft, Writing – review & editing, Software. CB: Conceptualization, Funding acquisition, Investigation, Methodology, Supervision, Validation, Writing – review & editing. MB: Data curation, Methodology, Validation, Writing – original draft, Writing – review & editing. CL: Validation, Writing – review & editing. FG: Conceptualization, Funding acquisition, Supervision, Writing – review & editing. SP: Conceptualization, Resources, Supervision, Validation, Writing – review & editing. AC: Validation, Writing – review & editing. CP: Validation, Writing – review & editing. MF: Funding acquisition, Supervision, Writing – review & editing.
Funding
The author(s) declare financial support was received for the research, authorship, and/or publication of this article. This study was partly funded by the Interreg MED project “Plastic Busters MPAs: preserving biodiversity from plastics in Mediterranean Marine Protected Areas,” co-funded by the European Regional Development Fund (grant agreement No 4MED17_3.2_M123_027). The ACCOBAMS Survey Initiative was supported by all riparian countries and has received substantial financial support from the MAVA Foundation, the Prince Albert II of Monaco Foundation, the International Fund for Animal Welfare, the Ministry of Agriculture and Fisheries, Food and Environment of Spain, the French Agency for Biodiversity, the Italian Ministry of the Environment and Protection of Land and Sea, the Government of the Principality of Monaco and from the operational program for the implementation of the European Maritime and Fisheries Fund in the Republic of Slovenia.
Acknowledgments
Special thanks to the members of the ASI Contact Group, the ASI Steering Committee, observers and team leaders, the ACCOBAMS Secretariat and the ACCOBAMS Scientific Committee for their continuous support to the development of the ACCOBAMS Survey Initiative project since its inception. Thanks to the government organizations that provided logistical support in the field and/or the necessary authorizations, to the captains and crews of the survey vessels, and to the aircraft companies and their pilots, without whom the ACCOBAMS Survey Initiative would not have been possible.
Conflict of interest
The authors declare that the research was conducted in the absence of any commercial or financial relationships that could be construed as a potential conflict of interest.
Publisher’s note
All claims expressed in this article are solely those of the authors and do not necessarily represent those of their affiliated organizations, or those of the publisher, the editors and the reviewers. Any product that may be evaluated in this article, or claim that may be made by its manufacturer, is not guaranteed or endorsed by the publisher.
Supplementary material
The Supplementary Material for this article can be found online at: https://www.frontiersin.org/articles/10.3389/fmars.2024.1352059/full#supplementary-material
References
ACCOBAMS (2021). Estimates of abundance and distribution of cetaceans, marine mega-fauna and marine litter in the Mediterranean Sea from 2018-2019 surveys. Eds. Panigada S., Boisseau O., Cañadas A., Lambert C., Laran S., McLanaghan R., Moscrop A. (Monaco: ACCOBAMS - ACCOBAMS Survey Initiative Project), 177. pp.
Alomar C., Deudero S., Compa M., Guijarro B. (2020). Exploring the relation between plastic ingestion in species and its presence in seafloor bottoms. Mar. Pol. Bull. 160, 111641.
Anselin L. (1995). Local indicators of spatial association LISA. Geographical Anal. 27, 93–115. doi: 10.1111/j.1538-4632.1995.tb00338.x
Anselin L., Syabri I., Smirnov O. (2002). “Visualizing multivariate spatial correlation with dynamically linked windows,” in Proceedings, CSISS Workshop on New Tools for Spatial Data Analysis, Santa Barbara, CA: Citeseer.
Barlow J., Forney K. (2007). “Abundance and population density of cetaceans in the California Current ecosystem,” in Fishery Bulletin- National Oceanic and Atmospheric Administration. (Seattle: National Marine Fishery Service) 105, 509–526.
Bilgmann K., Parra G. J., Holmes L., Peters K. J., Jonsen I. D., Möller L. M. (2019). Abundance estimates and habitat preferences of bottlenose dolphins reveal the importance of two gulfs in South Australia. Sci. Rep. 9, 8044. doi: 10.1038/s41598-019-44310-3
Buckland S. T., Rexstad E. A., Marques T. A., Oedekoven C. S. (2015). Distance sampling: methods and applications Vol. 431 (New York: Springer). doi: 10.1007/978-3-319-19219-2
Cañadas A., Pierantonio N., Araújo H., David L., Di-Méglio N., Ghislain D., et al. (2023). Distribution patterns of marine megafauna density in the Mediterranean Sea assessed through the ACCOBAMS Survey Initiative. Front. Mar. Sci. Sec. Mar. Megafauna 10. doi: 10.3389/fmars.2023.1270917
Coll M., Piroddi C., Albouy C., Ben Rais Lasram F., Cheung W. W., Christensen V., et al. (2012). The Mediterranean Sea under siege: spatial overlap between marine biodiversity, cumulative threats and marine reserves. Global Ecol. Biogeography 21, 465–480. doi: 10.1111/j.1466-8238.2011.00697.x
Consoli P., Romeo T., Angiolillo M., Canese S., Esposito V., Salvati E., et al. (2019). Marine litter from fishery activities in the Western Mediterranean Sea: The impact of entanglement on marine animal forests. Environ. pollut. 249, 472–481. doi: 10.1016/j.envpol.2019.03.072
Darmon G., Miaud C., Claro F., Doremus G., Galgani F. (2017). Risk assessment reveals high exposure of sea turtles to marine debris in French Mediterranean and metropolitan Atlantic waters. Deep Sea Res. Part II: Topical Stud. Oceanography 141, 319–328. doi: 10.1016/j.dsr2.2016.07.005
Demirov E., Pinardi N. (2002). Simulation of the Mediterranean Sea circulation from 1979 to 1993: part I. The interannual variability. J. Mar. Syst. 33–34, 23–50.
Deudero S., Alomar C. (2015). Mediterranean marine biodiversity under threat: Reviewing influence of marine litter on species. Mar. pollut. Bull. 98, 58–68. doi: 10.1016/j.marpolbul.2015.07.012
Di Matteo A., Cañadas A., Roberts J., Sparks L., Panigada S., Boisseau O., et al. (2022). Basin-wide estimates of loggerhead turtle abundance in the Mediterranean Sea derived from line transect surveys. Front. Mar. Sci. 9. doi: 10.3389/fmars.2022.930412
Druon J. N., Panigada S., David L., Gannier A., Mayol P., Arcangeli A., et al. (2012). Potential feeding habitat of fin whales in the western Mediterranean Sea: an environmental niche model. Mar. Ecol. Prog. Ser. 464, 289–306. doi: 10.3354/meps09810
Fossi M. C., Panti C., Baini M., Lavers J. L. (2018). A review of plastic-associated pressures: cetaceans of the Mediterranean sea and eastern Australian shearwaters as case studies. Front. Mar. Sci. 5. doi: 10.3389/fmars.2018.00173
Fossi M. C., Panti C., Guerranti C., Coppola D., Giannetti M., Marsili L., et al. (2012). Are baleen whales exposed to the threat of microplastics? A case study of the Mediterranean fin whale (Balaenoptera physalus). Mar. pollut. Bull. 64, 2374–2379. doi: 10.1016/j.marpolbul.2012.08.013
Fossi M. C., Romeo T., Baini M., Panti C., Marsili L., Campani T., et al. (2017). Plastic debris occurrence, convergence areas and fin whales feeding ground in the Mediterranean marine protected area Pelagos sanctuary: A modeling approach. Front. Mar. Sci. 4, 167. doi: 10.3389/fmars.2017.00167
Fossi M. C., Vlachogianni T., Galgani F., Degli Innocenti F., Zampetti G., Leone G. (2020). Assessing and mitigating the harmful effects of plastic pollution: the collective multi-stakeholder driven Euro-Mediterranean response. Ocean Coast. Manage. 184, 105005. doi: 10.1016/j.ocecoaman.2019.105005
Guerrini F., Mari L., Casagrandi R. (2019). Modeling plastics exposure for the marine biota: risk maps for fin whales in the Pelagos Sanctuary (North-Western Mediterranean). Front. Mar. Sci. 6, 299. doi: 10.3389/fmars.2019.00299
Halpern B. S., Frazier M., Potapenko J., Casey K. S., Koenig K., Longo C., et al. (2015). Spatial and temporal changes in cumulative human impacts on the world’s ocean. Nat. Commun. 6, 1–7. doi: 10.1038/ncomms8615
Hedley S. L., Buckland S. T. (2004). Spatial models for line transect sampling. J. Agricultural Biological Environ. Stat 9, 181–199. doi: 10.1198/1085711043578
Hurlbert S. H. (1984). Pseudoreplication and the design of ecological field experiments. Ecol. Monogr. 54, 187–211. doi: 10.2307/1942661
Lambert C., Authier M., Dorémus G., Laran S., Panigada S., Spitz J., et al. (2020). Setting the scene for Mediterranean litterscape management: The first basin-scale quantification and mapping of floating marine debris. Environ. pollut. 263, 114430. doi: 10.1016/j.envpol.2020.114430
Lolis C. J., Metaxas D. A., Bartzokas A. (2008). On the intra-annual variability of atmospheric circulation in the Mediterranean region. Int. J. Climatology: A J. R. Meteorological Soc. 28, 1339–1355. doi: 10.1002/joc.1634
Meacham J., Berloff P. (2023). On clustering of floating tracers in random velocity fields. J. Adv. Modeling Earth Syst. 15, e2022MS003484. doi: 10.1029/2022MS003484
Micheli F., Levin N., Giakoumi S., Katsanevakis S., Abdulla A., Coll M., et al. (2013). Setting priorities for regional conservation planning in the Mediterranean Sea. PLoS One 8, e59038. doi: 10.1371/journal.pone.0059038
Miller D. L., Burt M. L., Rexstad E. A., Thomas L. (2013). Spatial models for distance sampling data: recent developments and future directions. Methods Ecol. Evol. 4, 1001–1010. doi: 10.1111/2041-210X.12105
Miller D. L., Rexstad E., Burt L., Bravington M. V., Hedley S., Ferguson M., et al. (2022) dsm: _Density Surface Modelling of Distance Sampling Data_. R package version 2.3.3. Available online at: https://CRAN.R-project.org/package=dsm.
Notarbartolo di Sciara G. (2016). Marine mammals in the Mediterranean Sea: An overview. Adv. Mar. Biol. 75, 1–36. doi: 10.1016/bs.amb.2016.08.005
Panigada S., Pesante G., Zanardelli M., Capoulade F., Gannier A., Weinrich M. T. (2006). Mediterranean fin whales at risk from fatal ship strikes. Mar. pollut. Bull. 52, 1287–1298. doi: 10.1016/j.marpolbul.2006.03.014
Panigada S., Pierantonio N., Araújo H., David L., Di Meglio N., Dorémus G., et al. (2023). The ACCOBAMS Survey Initiative: the first synoptic assessment of cetacean abundance in the Mediterranean Sea through aerial surveys. Front. Mar. Sci.Sec. Mar. Megafauna 10. doi: 10.3389/fmars.2023.1270513
Roberts J. J., Best B. D., Mannocci L., Fujioka E., Halpin P. N., Palka D. L., et al. (2016). Habitat-based cetacean density models for the U.S. Atlantic and Gulf of Mexico. Sci. Rep. 6, 22615. doi: 10.1038/srep22615
Robinson A. R., Leslie W. G., Theocharis A., Lascaratos A. (2001). Mediterranean sea circulation. Ocean currents 1 (19), 4–6.
Schuyler Q. A., Wilcox C., Townsend K. A., Wedemeyer-Strombel K. R., Balazs G., van Sebille E., et al. (2016). Risk analysis reveals global hotspots for marine debris ingestion by sea turtles. Global Change Biol. 22, 567–576. doi: 10.1111/gcb.13078
Sigourney D. B., Chavez-Rosales S., Conn P. B., Garrison L., Josephson E., Palka D. (2020). Developing and assessing a density surface model in a Bayesian hierarchical framework with a focus on uncertainty: insights from simulations and an application to fin whales (Balaenoptera physalus). PeerJ 8, e8226. doi: 10.7717/peerj.8226
United Nations, Department of Economic and Social Affairs, Population Division (2019) World Population Prospects 2019. Available online at: https://population.un.org/wpp/Download/Standard/Population/.
United Nations, Environment Programme/Mediterranean Action Plan and Plan Bleu (2020). State of the Environment and Development in the Mediterranean. Nairobi (Marseille: Plan Bleu Regional Activity Centre).
van Sebille E., Aliani S., Law K. L., Maximenko N., Alsina J., Bagaev A., et al. (2020). The physical oceanography of the transport of floating marine debris. Environ. Res. Lett. 15, 023003. doi: 10.1088/1748-9326/ab6d7d
Wood S. N., Bravington M. V., Hedley S. L. (2008). Soap film smoothing. J. R. Stat. Society Ser. B Stat. Method. 70, 931–955. doi: 10.1111/j.1467-9868.2008.00665.x
Keywords: marine litter exposure, risk assessment, density surface modelling, marine species distributions, marine protected areas
Citation: Perna M, Brandini C, Bendoni M, Lapucci C, Galgani F, Panigada S, Cañadas A, Panti C and Fossi MC (2024) Evaluation of the exposure of the Mediterranean biodiversity to marine litter: the ASI – plastic busters MPAs projects connection. Front. Mar. Sci. 11:1352059. doi: 10.3389/fmars.2024.1352059
Received: 07 December 2023; Accepted: 08 April 2024;
Published: 25 April 2024.
Edited by:
Guillermo Luna-Jorquera, Universidad Católica del Norte, ChileReviewed by:
Lucia Rizzo, Department of Biology, Agriculture and Food Sciences, National Research Council (CNR), ItalyMatthew Savoca, Stanford University, United States
Copyright © 2024 Perna, Brandini, Bendoni, Lapucci, Galgani, Panigada, Cañadas, Panti and Fossi. This is an open-access article distributed under the terms of the Creative Commons Attribution License (CC BY). The use, distribution or reproduction in other forums is permitted, provided the original author(s) and the copyright owner(s) are credited and that the original publication in this journal is cited, in accordance with accepted academic practice. No use, distribution or reproduction is permitted which does not comply with these terms.
*Correspondence: Carlo Brandini, Y2FybG8uYnJhbmRpbmlAY25yLml0