
94% of researchers rate our articles as excellent or good
Learn more about the work of our research integrity team to safeguard the quality of each article we publish.
Find out more
ORIGINAL RESEARCH article
Front. Mar. Sci., 15 February 2024
Sec. Ocean Observation
Volume 11 - 2024 | https://doi.org/10.3389/fmars.2024.1348161
This article is part of the Research TopicTime-Series Observations of Ocean Acidification: a Key Tool for Documenting Impacts on a Changing PlanetView all 18 articles
 C. Frangoulis1*
 N. Stamataki1,2
 M. Pettas1S. Michelinakis1
 A. L. King3
 L. Giannoudi4
 K. Tsiaras4
 S. Christodoulaki1
 J. Seppälä5
 M. Thyssen6
 A.V. Borges7
 E. Krasakopoulou8
The rate of ocean uptake of anthropogenic CO2 has declined over the past decade, so a critical question for science and policy is whether the ocean will continue to act as a sink. Large areas of the ocean remain without observations for carbonate system variables, and oceanic CO2 observations have declined since 2017. The Mediterranean Sea is one such an area, especially its eastern part, where there is a paucity of carbonate system data, with large areas not sampled or only sampled by ship-based discrete measurements as opposed to high frequency, sensor-equipped time-series fixed stations. The aim of this study was to analyze a multi-year time-series of high-frequency (hourly) partial pressure CO2 (pCO2) and pH measurements in the Eastern Mediterranean, along with low-frequency (monthly) measurements of total dissolved inorganic carbon and total alkalinity. The pCO2 time-series was the first obtained in the Eastern Mediterranean. The study was conducted at a fixed platform of the POSEIDON system (Heraklion Coastal Buoy) located near Crete Island. Temperature was the dominant factor controlling the temporal variability of pCO2 and pH, while the remaining non-thermal variability appeared to be related to evaporation, water mixing, and biological remineralization-production. The air-sea CO2 fluxes indicated a transition from a winter-spring sink period to a summer-autumn source period. The annual air-sea CO2 flux was too low (-0.16 ± 0.02 mol m-2 yr-1) and variable to conclusively characterize the area as a net source or sink of CO2, highlighting the need for additional high frequency observation sites. Algorithms were developed using temperature, chlorophyll and salinity data to estimate pCO2 and total alkalinity, in an effort to provide tools for estimates in poorly observed areas/periods from remotely sensed products. The applicability of the algorithms was tested using Surface Ocean CO2 Atlas (SOCAT) data from the Eastern Mediterranean Sea (1999 to 2020) which showed that the algorithm pCO2 estimates were generally within ±20 μatm of the pCO2 values reported by SOCAT. Finally, the integration and analysis of the data provided directions on how to optimize the observing strategy, by readapting sensor location and using estimation algorithms with remote sensing data.
Although the ocean has absorbed 25 ± 2% of the total anthropogenic CO2 emissions from the early 1960s to the late 2010s (Gruber et al., 2023), a critical question for climate science and climate policy is whether the ocean will continue to act as a sink for this human-induced CO2 burden (Aricò et al., 2021), as the rate of ocean uptake of anthropogenic CO2 has declined over the past decade (Friedlingstein et al., 2022). The answer to this question is becoming more difficult, as the number of oceanic CO2 observations has almost halved between 2017 and 2023 as shown in the Surface Ocean CO2 Atlas (SOCAT) data portal version 2023 (Bakker et al., 2023) increasing the uncertainty in estimates of the oceans’ role in the carbon pump. This uncertainty is further increased by the sparseness of partial pressure CO2 (pCO2) measurements with limited spatiotemporal coverage, while large areas of the ocean are completely void of observations for carbonate system variables (SOCAT portal, Bakker et al., 2016).
This global situation is further exacerbated at the scale of the Mediterranean Sea. Although the Mediterranean Sea has been identified as an important anthropogenic carbon storage area because the column inventory is much higher than in the Atlantic or Pacific Oceans (Schneider et al., 2010; Lee et al., 2011), there is a general paucity and sparseness in time and space of reliable measurements of the carbonate system variables both in the surface and in the water column (Hassoun et al., 2022; Álvarez et al., 2023).
The Mediterranean Sea carbonate system is unique in several ways: overall high total alkalinity (AT) (especially in the eastern basin), pH values higher than the waters of the North Atlantic and the Pacific Oceans, and dissolved inorganic carbon (CT) values comparable only to the North Pacific Ocean, although induced by different processes (Álvarez et al., 2023). The Mediterranean Sea, with warm, high alkalinity surface waters, a low Revelle factor (close to 10), and corresponding to a high buffering capacity, can contribute to atmospheric CO2 uptake and transport to the deep and abyssal layers through the active overturning circulation (Schneider et al., 2010). Some locations in the Mediterranean Sea (e.g. Aegean Sea, Gulf of Lions) with intermediate and deep-water mass formation events (Durrieu de Madron et al., 2005) have an increased potential to transfer anthropogenic CO2 to deep layers (Touratier et al., 2016; Krasakopoulou et al., 2017). The significant contribution of the Mediterranean Sea outflowing waters to the North Atlantic anthropogenic carbon inventories has already been identified (Carracedo et al., 2018 and references therein). Due to the anti-estuarine circulation at the strait of Gibraltar, the Mediterranean Sea receives natural and anthropogenic carbon from the Atlantic in the surface layer and exports carbon in the deeper layer (Flecha et al., 2019 and references therein). This deep outflow transfers carbon to the intermediate water layers in the Atlantic, where it remains isolated from the atmosphere for several centuries, contributing to CO2 sequestration (Bethoux et al., 2005).
The study of the CO2 cycle in the Mediterranean may prove significant beyond regional questions, as this sea acts as a miniature world ocean, experiencing faster changes of its oceanographic and biogeochemical conditions in response to natural and anthropogenic pressures (Álvarez et al., 2023). In fact, specific processes that also occur in the world ocean can be studied in the Mediterranean Sea at shorter timescales. These include the impact of climate on various hydrodynamic circulation features (e.g. Robinson and Golnaraghi, 1994; Bergamasco and Malanotte-Rizzoli, 2010), assessing the functioning of ecosystems with contrasting trophic status (Malanotte-Rizzoli and Eremeev, 1999), and understanding the functioning of low nutrient-low chlorophyll regions with respect to CO2 fluxes (Sisma-Ventura et al., 2017).
The Mediterranean Sea, especially the eastern part, has been undersampled and efforts to observe the carbonate system have mainly been carried out with research vessel (R/V) cruises (Álvarez et al., 2023 and references therein; Hassoun et al., 2022 and references therein), making it difficult to establish an annual budget as a source or sink of atmospheric CO2. The paucity of high-frequency time-series does not allow a full understanding of the drivers of carbonate system temporal variability. High frequency time-series are key for understanding the biological component of carbonate system variability providing information how plankton production and respiration contribute to carbon flux (Fassbender et al., 2016; Xue et al., 2016; Parard et al., 2010). The value of these time-series observations is not only local, as they can be used for deriving relationships between physical and biochemical sea-surface data and the measurable carbonate variables. These relationships can lead to regional remote sensing algorithms which are particularly important for estimating carbonate variables in poorly covered areas. It has been hypothesized that surface temperature, remotely sensed from space, can be used as a tool for extrapolation of CO2 dynamics over larger spatial scales in the Eastern Mediterranean Sea (D’Ortenzio et al., 2008; Sisma-Ventura et al., 2017).
Over the last few years, POSEIDON (www.poseidon.hcmr.gr), the Eastern Mediterranean ocean observatory dedicated to multiple in-situ observations, has been progressively integrating pH and pCO2 sensors in the Cretan Sea which is the most platform-dense (supersite) subsystem of POSEIDON with two fixed platforms (Figure 1) and moving ones like gliders, Argos and a Ferrybox (Petihakis et al., 2018; Frangoulis et al., 2019). These carbonate system observations contribute to the JERICO-coastal research infrastructure, aiming to close the gaps in the coastal ocean monitoring efforts, both in terms of spatio-temporal range of observations and of variables included (Farcy et al., 2019). Based on observations supported by this infrastructure, the aim of the present paper is to analyze the first high-frequency, multi-year time-series of pCO2 measurements in the Eastern Mediterranean (Adriatic Sea excluded), in parallel with high-frequency measurements of pH and low-frequency (monthly) discrete measurements of other carbonate system variables such as CT and AT. These analyses will be used to understand the main drivers of the temporal variability of the carbonate system and to evaluate the area as a source or sink of atmospheric CO2. These in-situ data will be used to develop and evaluate algorithms to estimate sea surface carbonate variables (pCO2 and AT) using sea surface data (in-situ or satellite).
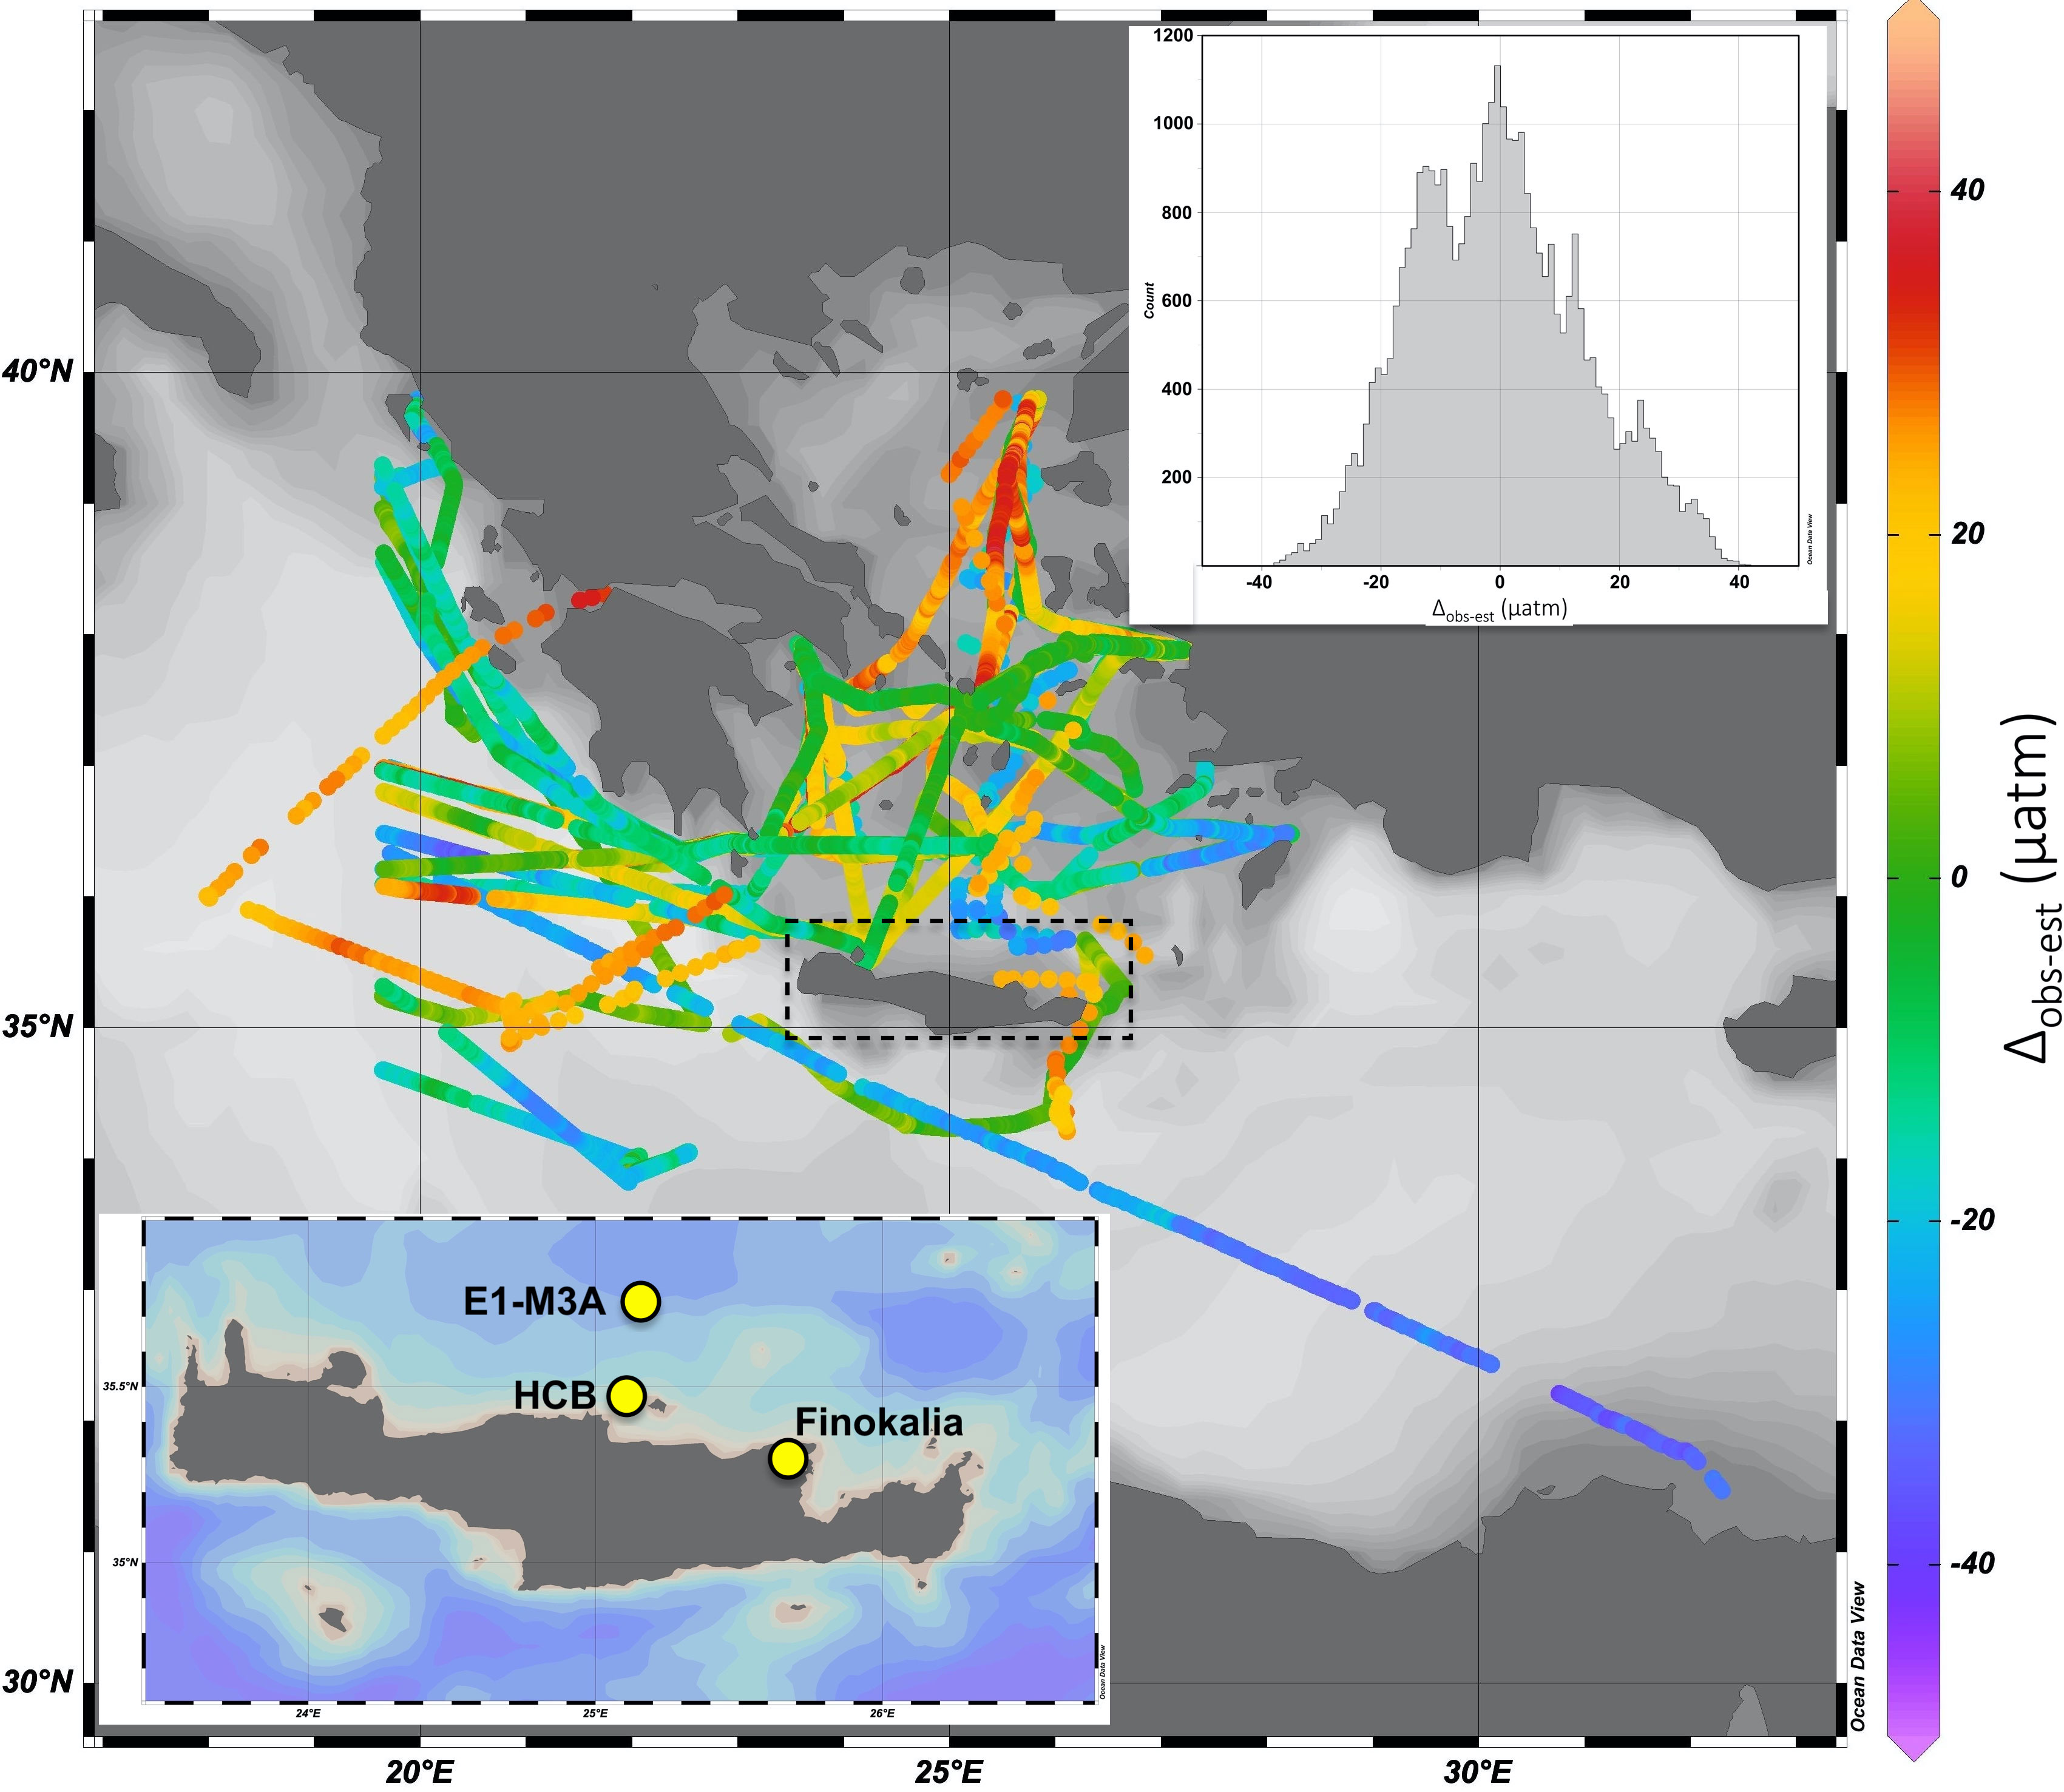
Figure 1 Map of the Eastern Mediterranean Sea with location of Heraklion Coastal Buoy (HCB), E1-M3A buoy and FINOKALIA atmospheric station (bottom left inset). Color tracks (z axis) indicated difference between observed and estimated sea surface pCO2 (Δobs-est), using Equation 8 with in-situ temperature and pCO2 measurements (from SOCAT dataset). Top right inset shows frequency of observations vs Δobs-est. In-situ data excluded values above latitude 39.8°N and data from the present study.
Data were collected from sensors placed on one of the POSEIDON fixed platforms, the Heraklion Coastal Buoy (HCB), as well as regular (monthly frequency) R/V missions at the same location (35.43°N, 25.07°E, depth 180 m) (Figure 1). The buoy used during the study period was an Oceanor Wavescan buoy. Details on the buoy configuration can be found in Petihakis et al. (2018). Although the nearest coast to HCB is 4 km away and the nearest urban area 11 km away, due to the site depth and the lack of important rivers (Poulos et al., 2009), the site receives little coastal influence, except during extreme rain events.
A spectrophotometric pH sensor using non-purified m-cresol purple dye, SP200-SM (Sensorlab), was deployed at subsurface (inlet at 1.5 m), on HCB providing pH data (at total scale) every 3 hours in near real time to the POSEIDON database. A description of the sensor and its principle of operation can be found in González-Dávila et al. (2016). The sensor was tested in the laboratory with TRIS (2-amino-2-hydroxymethyl-1,3-propanediol)-buffer standards prior and after each deployment. The repeated analyses for each of those tests (n = 6) presented accuracy that was within ±0.002 pH units (close to the ones described by González-Dávila et al., 2016). Discrete samples for pH analysis were also taken during its deployment (see section 2.2.1 discrete carbonate data).
A pCO2 sensor, CO2-Pro Atmosphere (ProOceanus) based on non-dispersive infrared spectrometry, was also deployed on HCB next to the pH sensor, providing air (inlet at 2 m above the surface layer) and seawater (inlet at 1.5 m) CO2 data every 6 hours in delayed mode. Description of the sensor and its principle of operation can be found in Jiang et al. (2014). The sensor was removed from April to August 2021 in order to participate in the Integrated Carbon Observation System (ICOS) pCO2 instrument inter-comparison workshop. Periods of non-operation in 2022 were for servicing. Three standard gases (351, 420, 493 μatm) were connected to the sensor prior and after each deployment. In addition, during deployment, one standard gas (420 μatm) was connected regularly (6 times over the total deployment period). Based on these laboratory and field data a 3.6 to 4.9 μatm (depending on the gas reference) drift per year was observed. Correction was not applied for this drift as the value obtained was below the uncertainty of the sensor when operating on a mooring, including uncertainties of references (8.7 ± 14 μatm; Jiang et al., 2014).
Quality control was applied to pH and pCO2 sensor data by taking into consideration minimum and maximum ranges, spikes and stuck values.
The HCB buoy is equipped with sub-surface (at 1 m) sensors for currents, temperature (SST) and salinity (conductivity) (SSS) monitoring, as well as wave (height and direction) and aerial meteorological sensors at 3 m above the surface layer (wind speed and direction, air temperature, atmospheric pressure, humidity). Temperature and salinity (conductivity) data used in the present study were measured by a SBE 37-SIP or SBE 37. Details about other seawater sensors specifications and variables measured can be found in Petihakis et al. (2018).
During regular (monthly frequency) R/V visits at HCB, water samples were taken near to the CO2 and pH sensors (at 2 m depth and at 2.5 m horizontal distance from both sensors inlet) and within ±15 min of sensor measurements. Three samples were taken from different Niskin bottles for pH analysis as well three samples for CT and AT analysis according to the collection and storage recommendations of Dickson et al. (2007). The pH samples were analyzed thermostatted at 25°C within 6 hours from sampling using a spectrophotometric lab pH instrument with purified m-cresol purple dye (AFT-pH, Sunburst Sensors) which was regularly checked against the TRIS buffer. The measurements of CT and AT were carried out thermostatted at 25°C using a VINDTA 3C checked with CRMs. TRIS buffers and CRMs were from Dr. Andrew Dickson, Marine Physical Laboratory, Scripps Institution of Oceanography. Based on the TRIS buffers and CRMs the accuracy was estimated to be ± 2.0 μmol kg-1 for AT, ± 3.0 μmol kg-1 for CT, and ±0.004 units for pH. Based on triplicate samples from different Niskin bottles, the precision was estimated to be ~1 μmol kg-1 for AT, ~3 μmol kg-1 for CT, and ~0.004 units for pH. During the second year, several major technical issues with the VINDTA 3C analyser prevented access to good quality data.
During regular (monthly frequency) R/V visits at HCB, CTD (Conductivity, Temperature, Depth) casts (with SBE19+) were made from surface to close to the bottom, at a distance varying from 20 m to 200 m from HCB. Water samples were also taken at various depths (2, 10, 20, 50, 75, 100, 120 m) for nutrients and chlorophyll a (Chla) determination and stored at -20°C until their analysis. For nutrients, the concentration of orthophosphate was measured according to Rimmelin and Moutin (2005), the concentration of nitrate, nitrite and silicate according to Strickland and Parsons (1972) and the concentration of dissolved ammonium according to Ivančič and Degobbis (1984). The detection limits for phosphate (PO4), nitrate+nitrite (NO3+NO2), silicate (SiO4) and ammonium (NH4) were 0.8 nM, 0.017, 0.10 and 0.019 μM, respectively. Chla was measured fluorometrically (Holm-Hansen et al., 1965) as described in Lagaria et al. (2017).
Derived seawater carbonate system parameters, using pairs of measured carbonate variables were estimated using the software program CO2SYS (version 3.0, Pierrot et al., 2021) considering temperature, salinity and nutrient concentrations (silicate and phosphate) and with the output from CO2SYS at in-situ temperature conditions. The pH data from the pH sensor collected at in-situ temperature were converted to pH at 25°C using the CO2SYS program and AT estimated from salinity (see below).
Carbonate variables were estimated using pairwise combination of carbonate variables (using CO2SYS, version 3.0, Pierrot et al., 2021). For estimations of AT, CT and pH (using pH&CT, pH&AT, and AT&CT, respectively), we followed the recommendation by Álvarez et al. (2014) based upon a large Mediterranean pH&AT&CT dataset: carbonic acid dissociation constants K1 and K2 from Mehrbach et al. (1973) as refitted by Dickson and Millero (1987) and the dissociation constant for HSO4- from Dickson (1990). The Root Mean Square Deviation (RMSD) between observed and estimated values of AT, CT and pH were 19.5 μmol kg-1, 17.6 μmol kg-1 and 0.033 pH units, respectively. For estimations of pCO2 (using AT&CT, pH&AT, pH&CT), various CO2SYS program options were tested (as pCO2 measurements were not performed by Álvarez et al., 2014) to identify the K1, K2 option that gave the lowest ΔpCO2 obs-est. Although the present study is the first in the Mediterranean Sea measuring four variables: AT, CT, pH (bottle data) and CO2 (sensor data), and thus could in principle be used to examine internal consistency, this was attempted but abandoned due to several reasons explained in Supplementary Material. Therefore, the same K1, K2 option for estimating CO2 (using AT&CT, pH&AT) as above (Álvarez et al., 2014) was deemed more appropriate and internally consistent. Using this option the comparison of seawater pCO2 from the sensor with calculated pCO2 had RMSD ~29 and 9 μatm when calculated from AT&CT and pH&AT, respectively.
The method proposed by Takahashi et al. (2002), with terminology as adapted by González-Dávila et al. (2016), was used in order to estimate the variability of pCO2 recorded by the buoy sensor resulting from the contribution of the thermal (pCO2TH) and non-thermal (pCO2NT) control using the Equations 1 and 2:
where pCO2 and SST are the values obtained from HCB seawater sensors and pCO2mean (410 μatm) and SSTmean (20.58°C) their respective annual mean values.
The air-sea interface CO2 exchange flux FCO2, (mmol m-2 d-1) calculation was made according to Equation 3 from Wanninkhof (2014)
where K0 (moles L-1 atm-1) is the solubility of CO2 in seawater (Weiss, 1974), and pCO2SW and pCO2ATM are the surface seawater and atmospheric partial pressure of CO2 (μatm) and k (cm h-1 by convention Equation 4) is the gas transfer coefficient expressed as
where U10 is the wind speed (m s-1), Sc is the CO2 Schmidt number (dimensionless) normalized to 660 (the Sc for CO2 in seawater at 20°C and salinity 35) and the coefficient 0.251 has units of (cm h-1) (m s-1)-2.
A positive flux indicates a release of CO2 from the ocean toward the atmosphere.
Fluxes of CO2 were computed using pCO2SW from HCB, pCO2ATM data from nearest (54 km distance) land-based coastal atmosphere observation station of FINOKALIA and wind data from HCB (measured every 3 h). Description of FINOKALIA station (https://www.icos-cp.eu/observations/national-networks/icos-greece) and its air CO2 time-series can be found in Gialesakis et al. (2023). Wind data from the nearest (34 km distance) sea-based meteorological station of E1-M3A were used to complete meteorological data gaps of HCB (air pressure, wind). Description of E1-M3A can be found in Petihakis et al. (2018). Wind speed measurements obtained at 3 m were adjusted to 10 m above sea surface (U10) based on Hsu et al. (1994). Due to a gap of wind data from 07/06/2021 to 12/09/21 (in both HCB and E1-M3A), a constant value of wind speed (5.50 m s-1) was used during that period, obtained by the average of summer values from the E1-M3A time-series data (ten years).
Subsurface temperature and salinity have been measured at the POSEIDON HCB mooring site since 2016. Between November 2020 and May 2023, the mooring captured seasonal variability in temperature and salinity over the ~2.5 year observation period (Figure 2). There were some minor gaps in the salinity data (mostly <3 day periods), while a larger gap occurred from mid-July to November 2022. Over the ~2.5 year observation period, the SST ranged from 15.3°C in winter to 28.3°C in summer. According to the entire temperature and salinity data record of HCB station (available at https://poseidon.hcmr.gr) the hydrological situation over the studied period showed no extreme climatic events. The drop in salinity observed in May 2022 could be due to the intrusion of a different water mass (see Discussion). The SST satellite product (daily values) showed a consistent relationship with the in-situ data during the entire period (Figure 2). The SSS satellite product (weekly values) difference with in-situ data varied generally between ~0.2 and ~0.4 units.
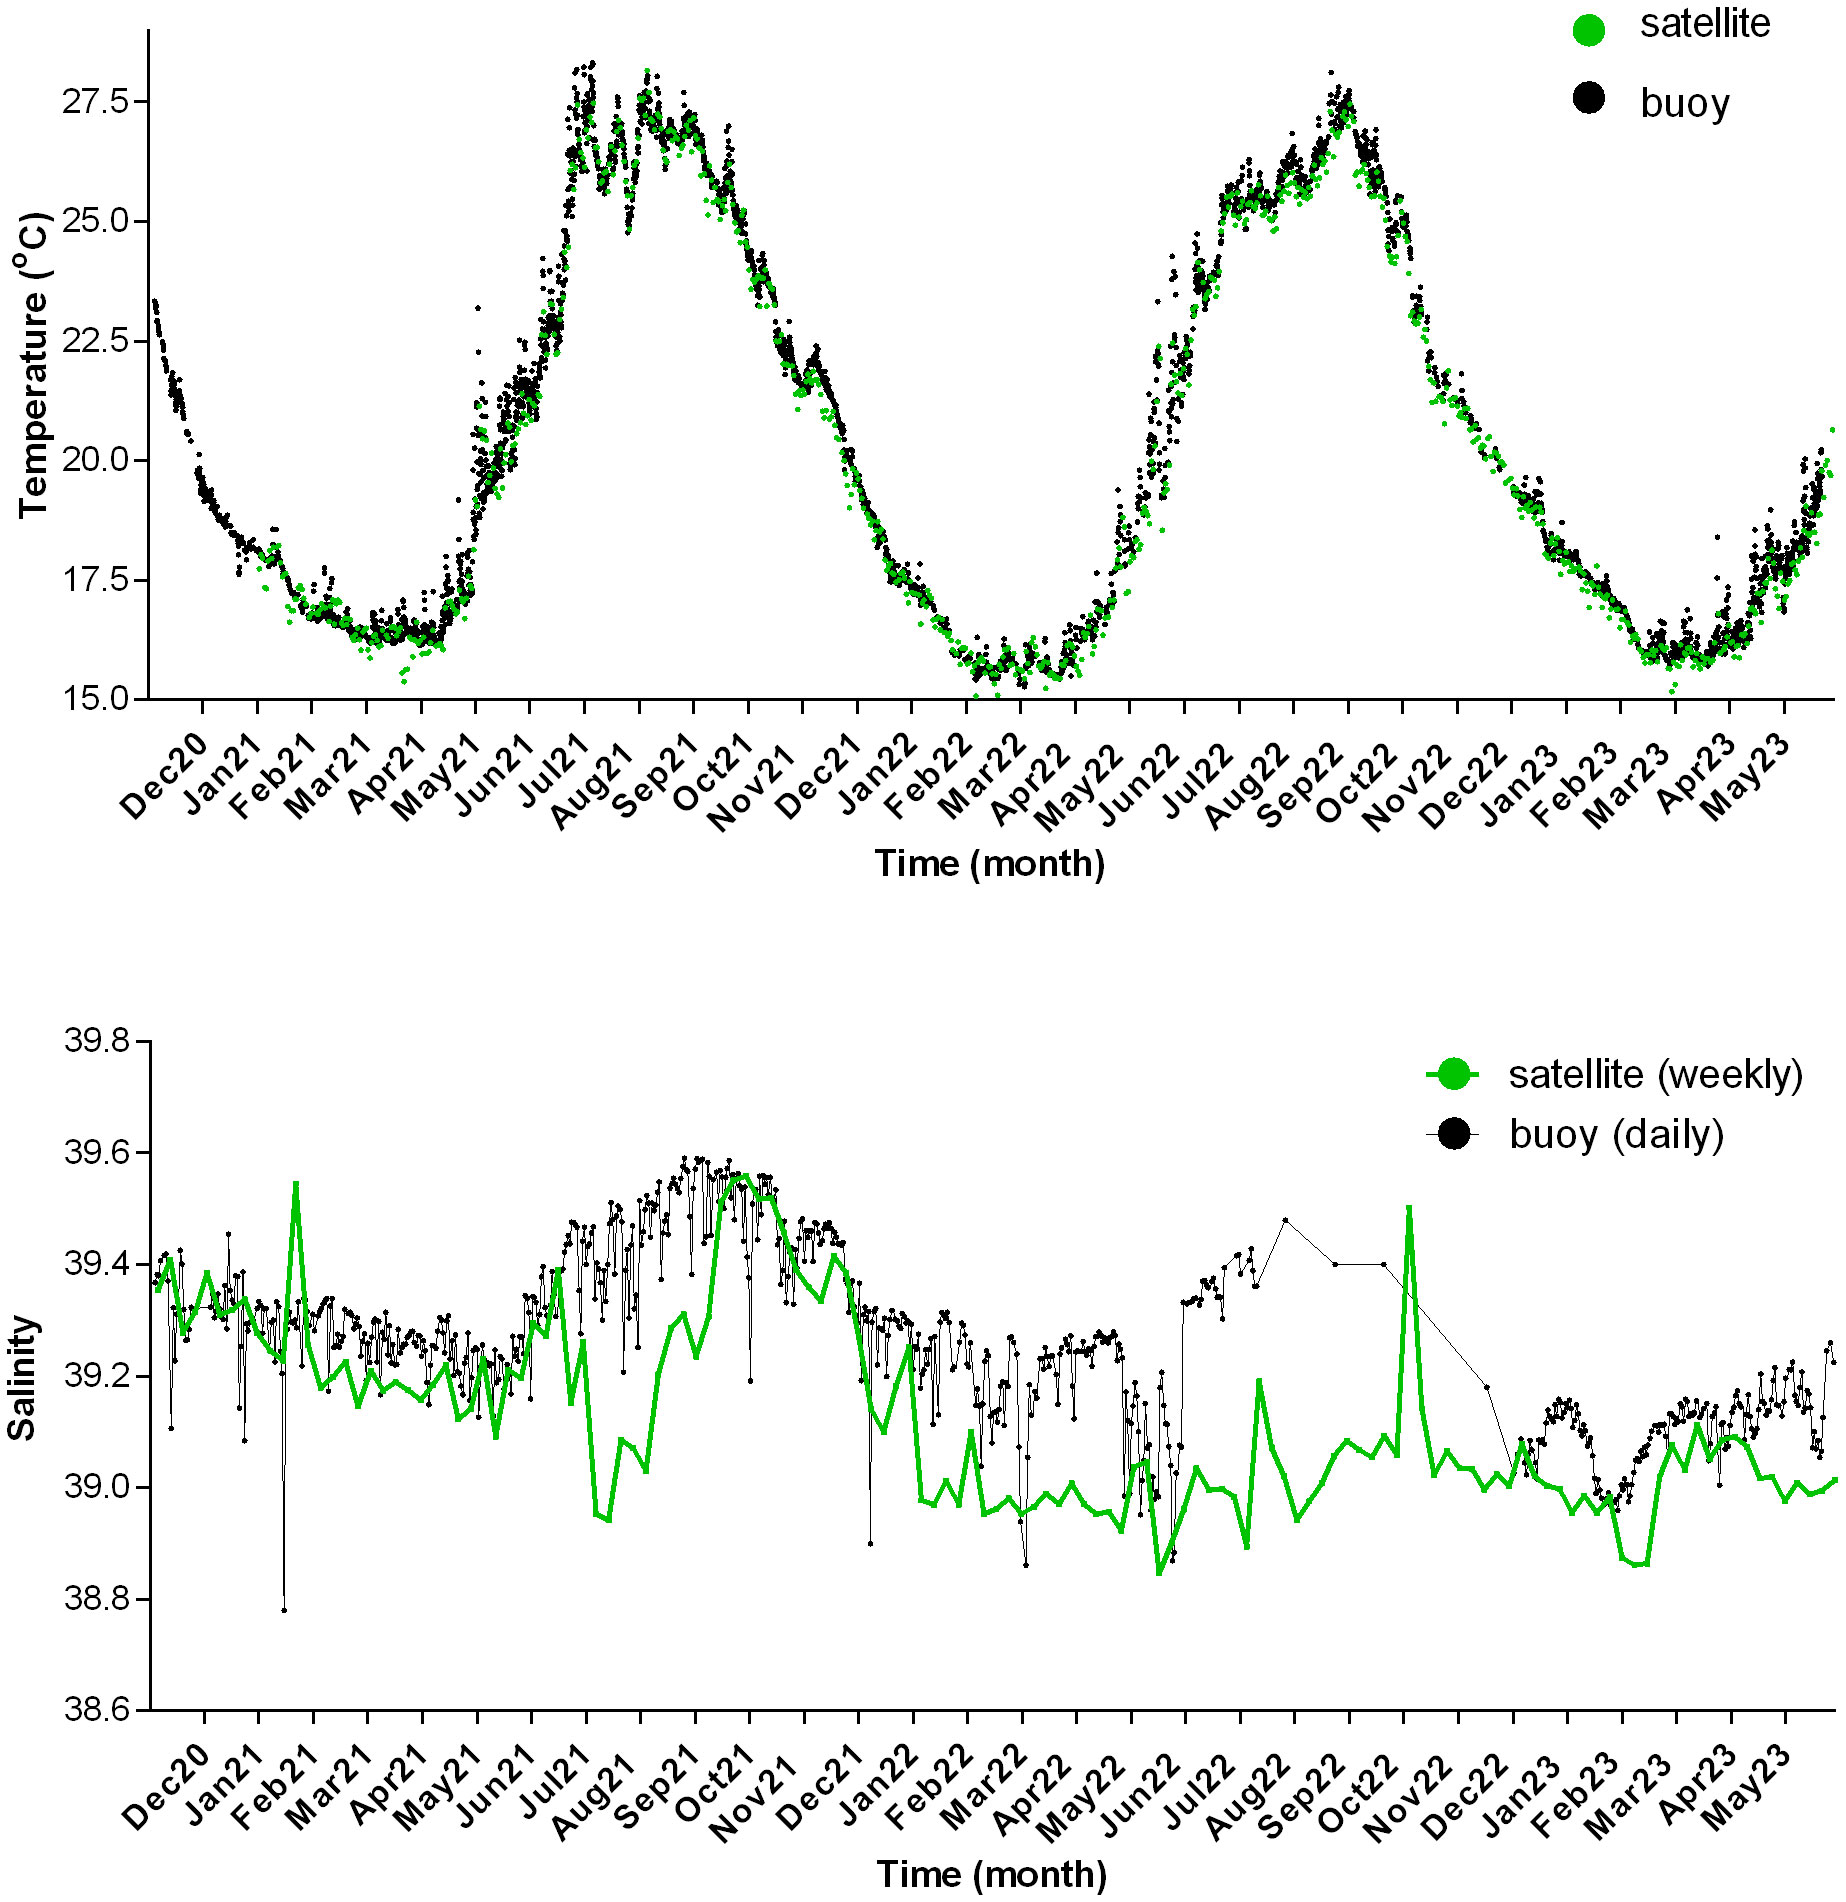
Figure 2 Time series of temperature (°C) (top panel) and salinity (lower panel) at HCB buoy from sensors on buoy (black dots) and from satellite data (green dots).
The variations in Chla concentration over the studied period displayed smooth seasonal patterns (especially 0-120 m mean depth-integrated values), with somewhat higher values in winter-spring (December to May) and lower in summer-autumn (June to November). The highest concentrations were observed during spring 2022 which was the only time during the study period when Chla exceeded ~0.2 µg L-1 (Figure 3). Mean depth-integrated Chla values during the summer-autumn period were generally greater than surface Chla values, reflecting the deepening of the Chla maximum. The Chla satellite product was generally higher than in-situ surface data with the difference being generally less that ~0.05 µg L-1.
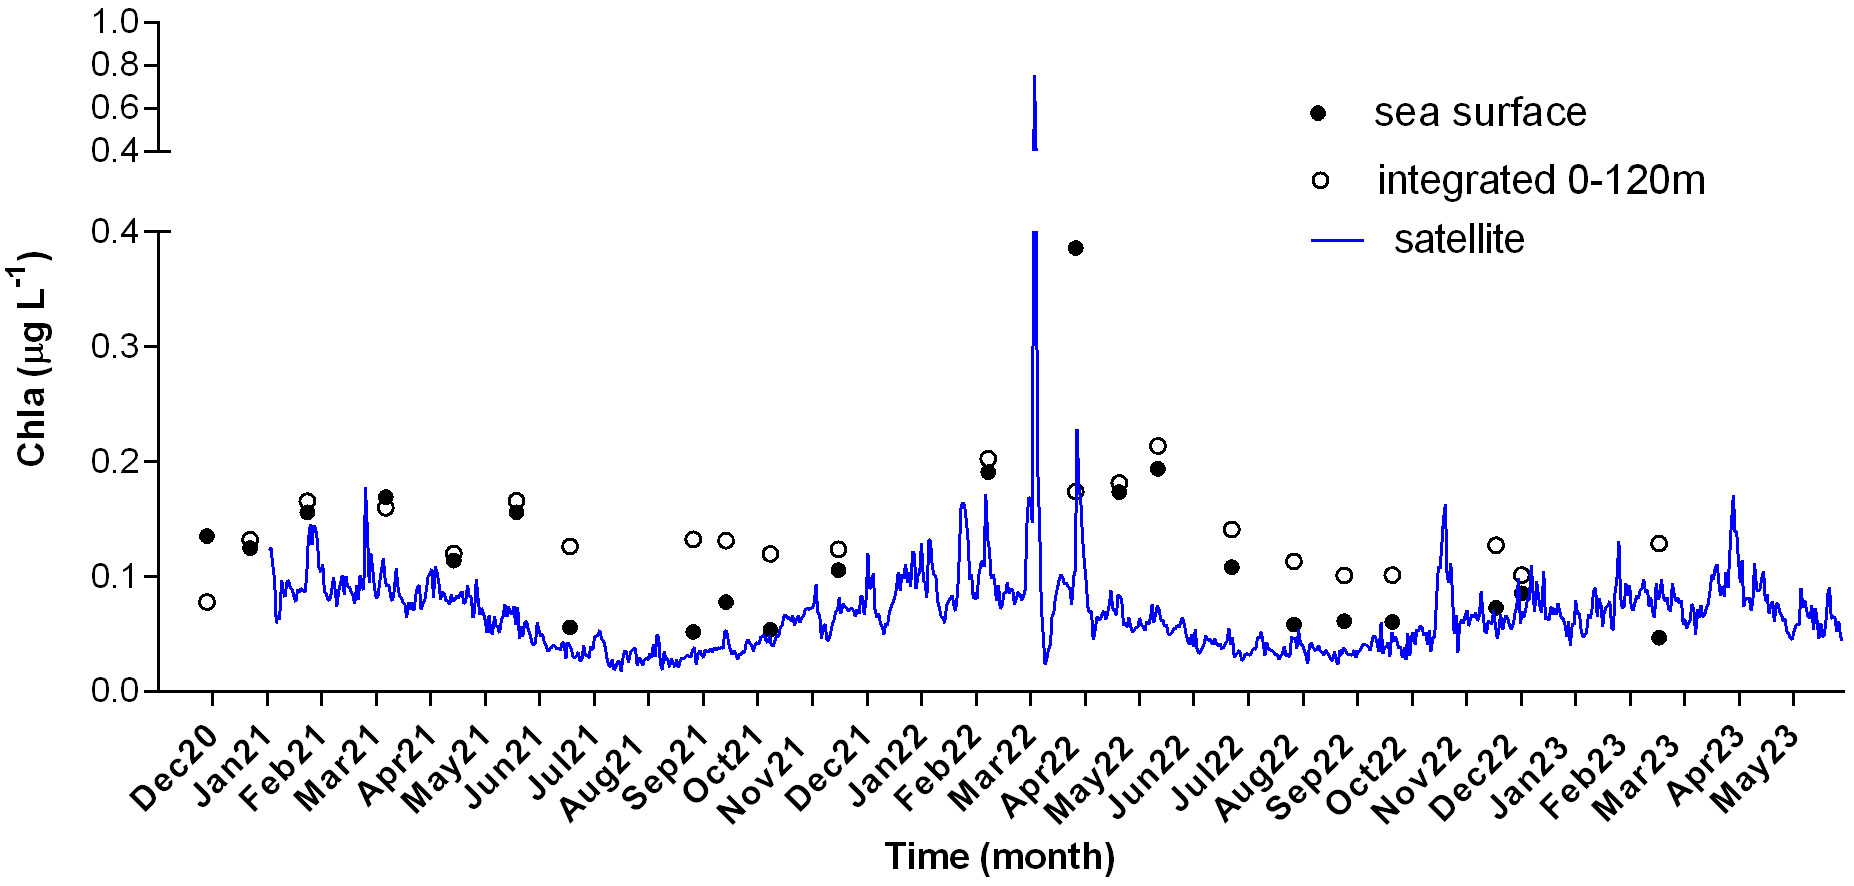
Figure 3 Time series of chlorophyll a (Chla in μg L-1) at HCB Station from bottle data (black dots), from bottle data integrated over 120 m (white dots) and from satellite data (blue dots-line).
The variations in inorganic nutrients surface concentrations over the studied period (Supplementary Material Figure 1) were overall low (<0.92 μM for NO3+NO2, <0.02 μM for PO4, <0.88 μM for NH4, <1.50 μM for SiO4) without any distinct seasonal pattern.
Figure 4 shows the time-series variations of the measured sea surface carbonate system variables. For pH, twenty months of continuous records were obtained from the in-situ sensor at a frequency of 3 hours. The pH at in-situ temperature ranged from 7.97 (July) to 8.13 (February-March). During the last seven months (January-July 2022), pH measurements were less precise (the spread of data increased) which was mostly due to issues with the sensor’s operation, which was consequently removed for servicing in July 2022. Bottle pH data were collected periodically during the entire period of sensor deployment and also for the period between July 2022-March 2023 when the sensor was not deployed. Bottle pH and sensor pH data had a RMSD = 0.006 pH units. Part of the difference observed between the two methods (-0.001 ± 0.006 pH units) could be due to the pH lab analysis using purified m-cresol purple (Liu et al., 2011 for calculations) versus the sensor using non-purified m-cresol purple (Clayton and Byrne, 1993 for calculations). In fact, non-purified m-cresol purple can result in differences of -0.001 to ~-0.02 depending on which m-cresol purple brand/batch is used and at what pH range (Douglas and Byrne, 2017).
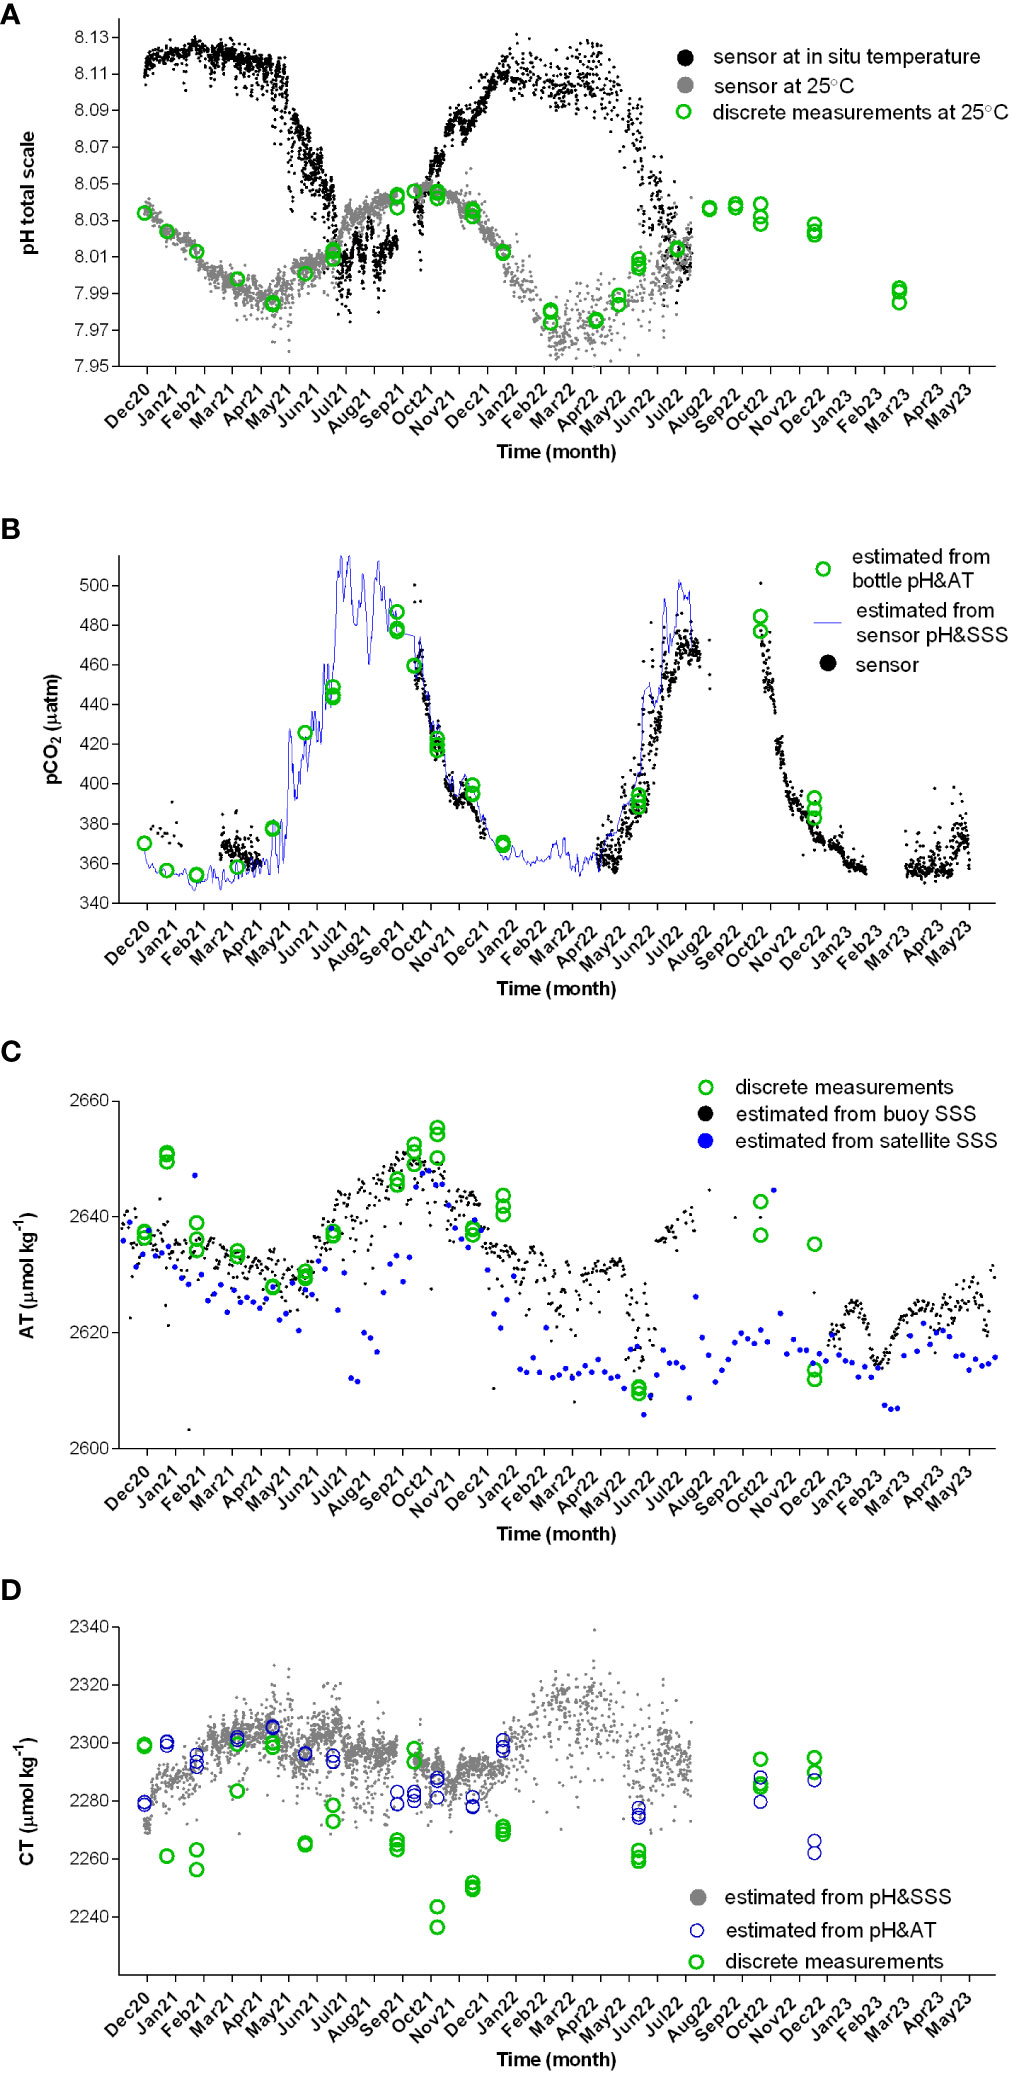
Figure 4 Time series of carbonate variables at the HCB buoy at subsurface (2 m). (A) pH data from sensor on buoy at in-situ temperature (black dots) and at 25°C (grey dots) together with pH from bottle data at 25°C (green dots). (B) pCO2 data from sensor on buoy (black dots), estimated pCO2 from bottle pH and AT data (green dots), estimated pCO2 from pH and sea surface salinity (SSS) data from buoy sensors (blue line), (C) AT from discrete measurements (green dots), AT data estimated from SSS data from buoy sensor (black dots) and AT estimated from SSS satellite data (blue dots). (D) CT from bottle data (green dots), CT data estimated from discrete measurements of pH and AT (blue dots) and CT estimated from pH&SSS (grey dots).
For pCO2, nineteen months of data were obtained (with 17 months at high frequency i.e. 6 hours) within a total period of 31 months. The densest period of data recording was 11 months within the period from April 2022 to May 2023. Periods of interruption were due to participation in an ICOS workshop (2021) and for servicing and maintenance. pCO2 data was acquired during all months except August, September and mid-January to mid-February. The seawater pCO2 values over the period of measurements ranged from ~350 μatm (March and April) to ~500 μatm (September). Concurrently, CO2 and pH were measured over a total period of 12 months.
AT and CT bottle data were obtained mainly during the first year (during the second year several major technical issues with the VINDTA 3C analyzer impacted the amount of high-quality data). During the first year AT varied between 2628 and 2654 μmol kg-1, decreasing from December to March, then increasing from April to October.
When excluding one seasonal deviation (December 2020), AT was linearly related to SSS (r2 = 0.7, p< 0.0001, n=39, Supplementary Material Figure 3) according to:
with ΔATobs-est having a RMSD ~6.3 μmol kg-1.
Bottle CT data varied between 2236 and 2300 μmol kg-1 without a clear seasonal pattern. CT was also estimated from other variables, as described in the next section.
The relationship found between AT and SSS (see previous section) was used to estimate AT from SSS from buoy sensor (buoySSS) and satellite SSS (satSSS) data (Figure 4) downloaded from COPERNICUS (see data availability for the exact reference). These derived ATbuoysss data were used in combination with the pH in-situ data (from sensor) to calculate CT (CTbuoySSS&pH) and pCO2 (pCO2buoySSS&pH) using CO2SYS with the above-mentioned options. The obtained estimate CTbuoySSS&pH data giving indication of the seasonal variability of CT (Figure 4) should be considered with caution as it is based on the AT relationship to salinity (previous section). The obtained estimate of pCO2buoySSS&pH data when compared to CO2 sensor data showed a RMSD= 17 μatm.
Algorithms were developed to calculate sea surface pCO2 with exclusive use of satellite SST and Chla data downloaded from COPERNICUS (see data availability for the exact reference). A linear regression model (cftool, MATLAB) was applied that used a quadratic polynomial, univariate for the SST algorithm and bivariate for SST and Chla algorithm. The regression model used a linear square differences method to fit the in-situ pCO2 data. The satellite data fused to the regression model were first normalized to their mean and standard deviation value. Coefficients of the regression model/algorithms were calculated with 95% confidence bounds and the goodness of fit was evaluated through R-squared and RMSE.
The first algorithm (Equation 6) was based on a single variable, satellite SST (satSST):
The second algorithm (Equation 7) was based on two variables, satellite SST and Chla (satChla):
Estimated pCO2 from SST (Figure 5) compared to sensor data displayed a RMSD= 13 μatm, while using the estimate from SST&Chla (Figure 5) the RMSD value was 14 μatm.
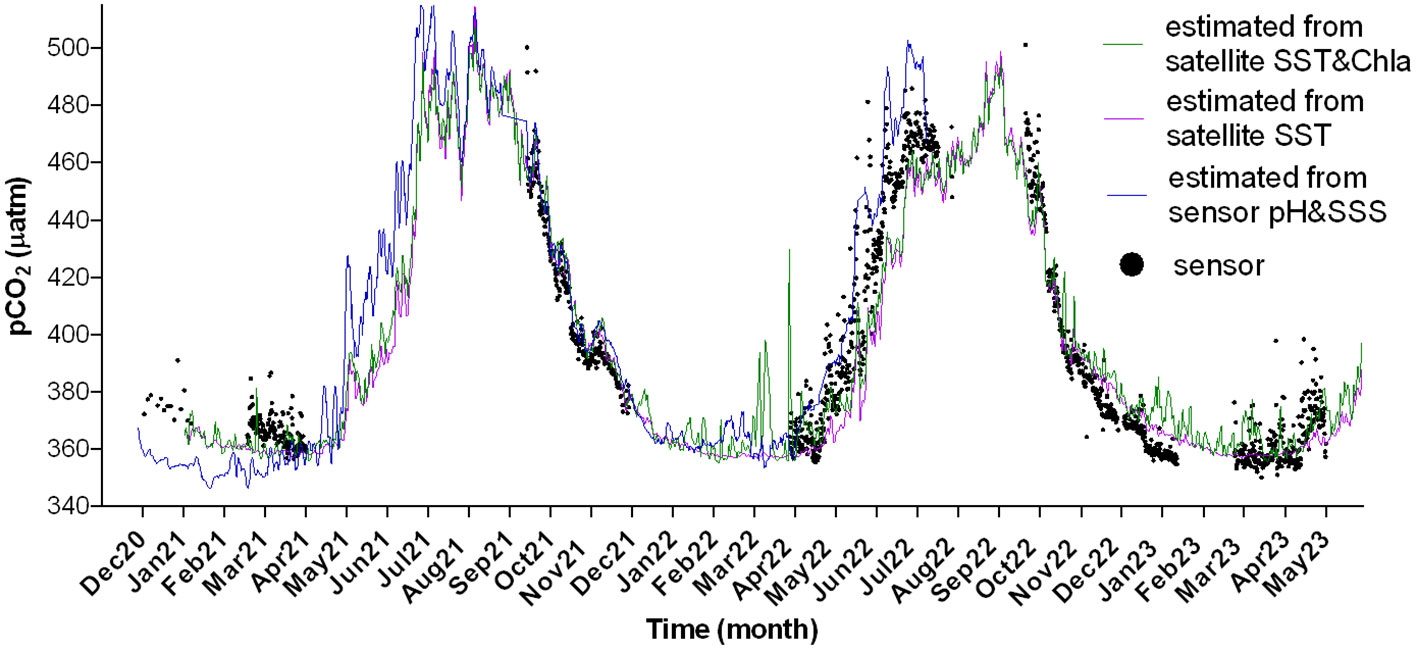
Figure 5 Measured pCO2 (black dots), and estimated pCO2 from pH and SSS data from buoy sensors (blue interrupted line), from SST satellite data (orange line) and from SST&Chla satellite data (green line).
To test the validity of the algorithm pCO2satSST over a wider spatiotemporal scale, available data of in-situ sea surface pCO2 with their respective temperature measurements from the Eastern Mediterranean Sea (selected area shown in Figure 1) were taken from SOCAT database with addition of one previously unpublished dataset (Krasakopoulou and Rapsomanikis, 2023), hereinafter together referred to as “SOCAT dataset”. Data were available in 1999, 2006, 2008, 2015, 2016, 2018 and 2020-2022. After excluding data from 2020-2022, which were the ones in the present study, the remaining dataset had 37372 values. After exclusion from this dataset the data collected at salinities below 35 PSU (i.e. above 39.8°N latitude, North Aegean and Dardanelles straits), a large part of which showed high Δobs-est, the remaining dataset (35179 values) was used to modify the Equation 6 to make it applicable at the period 1999 to 2019 and the area from 32.0°N to 39.0°N and from 19.5°E to 32.0°E (Equation 8):
where the last term accounts for the long-term increase of pCO2, with y being the year. Using this algorithm, the deltas obtained varied between -40 and +40 μatm (Figure 1) with 91% of values being between -20 and +20 μatm.
The contribution of the thermal and non-thermal control on the pCO2 variations recorded by the buoy sensor was examined in Figure 6 (CO2 sensor data gaps were completed by pCO2buoySSS&pH). The thermal/non-thermal ratio was lower than 1 (Supplementary Material Figure 1) for almost 6 months in winter-spring (mid-December to May, with minimum ratio ~0.7 at March-April), indicating that non-thermal drivers exerted a greater control than temperature during that period. The ratio was above 1; hence, thermal control was predominant in the remaining 6 months in summer-autumn (June to early December, maximum ratio ~1.5 in July-August) (Supplementary Material Figure 3). Although the periods during which thermal or non-thermal controls predominate were almost equal, when the magnitude of the change they produce is examined (Figure 6), it appears that the thermal term was more than twice as large as the non-thermal term.
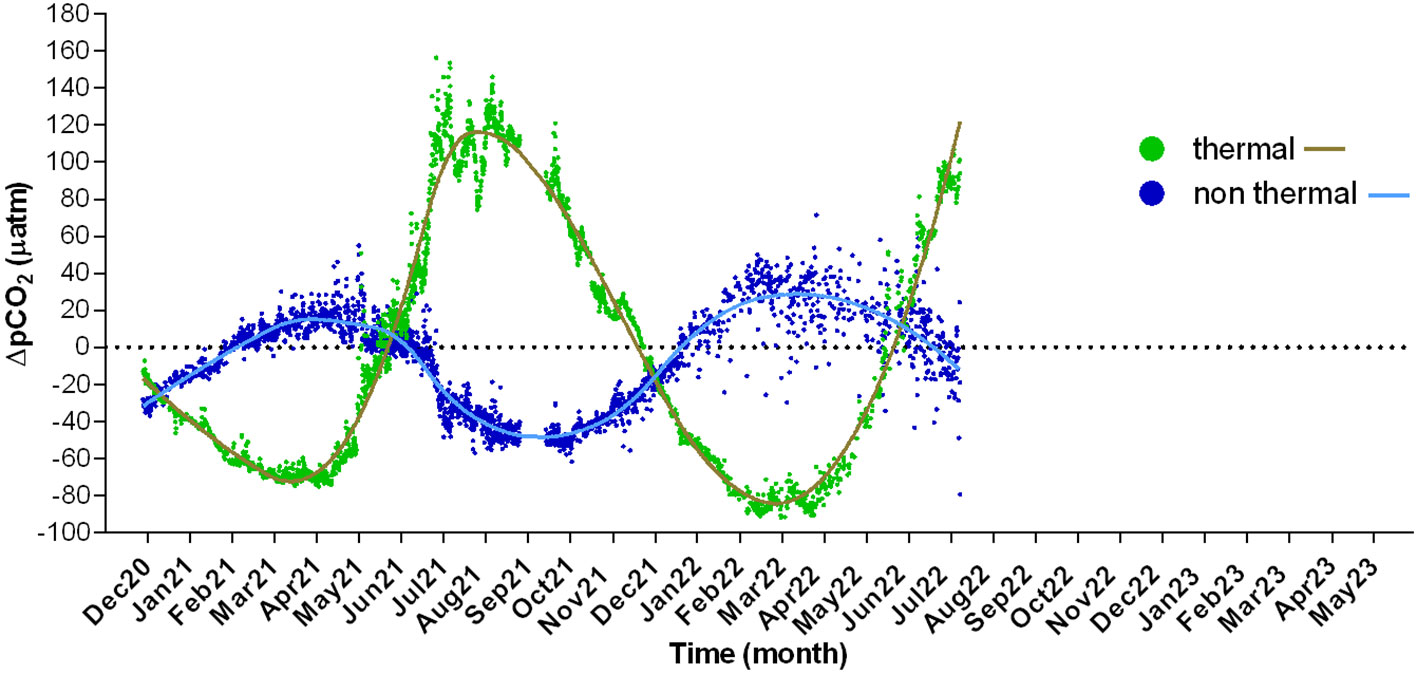
Figure 6 Thermal and non-thermal components of pCO2 (μatm, estimated from pH and SSS data, blue line in Figure 4) calculated respectively from Equations 1, 2 and expressed as difference from measured values (ΔpCO2). Smoothed curves were created from the data points shown using the least-squares spline approximation (spap2 function of Matlab R2018b*) with the spline of order 3.
The area acted as a sink of atmospheric CO2 during approximately 7.5 months in winter-spring, between mid-October and May, and as source during approximately 4.5 months in summer-autumn, between June and mid-October. In the winter-spring (sink) period, the highest negative flux was -18.0 mmol CO2 m-2 d-1, whereas the summer-autumn (source) period the highest positive flux was +13.1 mmol m-2 d-1. A strong variability was observed in both periods (+3.8 ± 2.3 and -3.5 ± 3.5 mmol m-2 d-1) with wind being the main driver of the flux variability (Figure 7). To estimate the net flux over the entire source/sink acting periods, sea surface pCO2 data-lacking periods were completed using pCO2buoySSS&pH, and the remaining gaps using pCO2satSST&Chla. Based on this composite pCO2 dataset, the total flux integrated over the sink period was between -834 and -662 mmol CO2 m-2 (over 219 and 234 days, during the first- and second-year period respectively), whereas the total flux integrated over the source period was between +607 and +563 mmol CO2 m-2 (over 154 and 144 days, during the first- and second-year period respectively). The estimated annual flux ranged between -0.23 ± 0.02 and -0.10 ± 0.01 mol CO2 m-2 y-1 (during the first- and second-year period respectively).
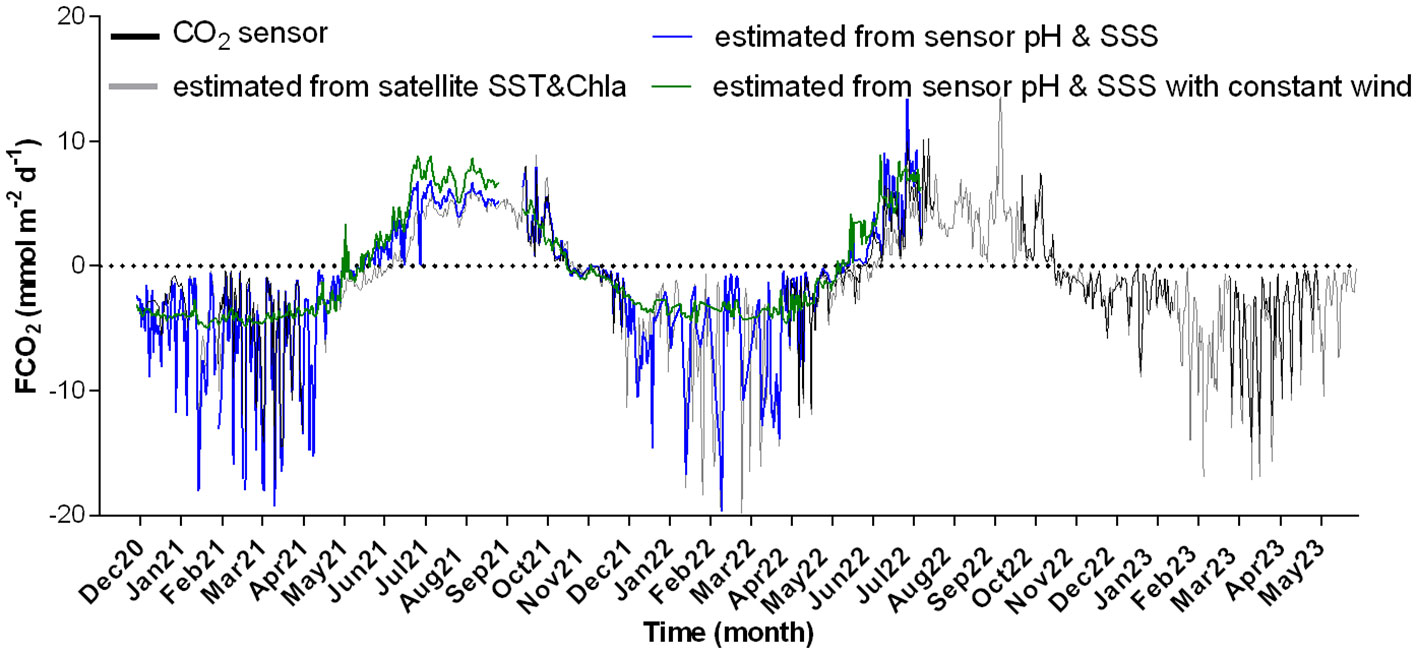
Figure 7 Daily average values of CO2 air-sea flux calculated using daily average values of in-situ wind measured at HCB and E1-M3A, temperature and salinity measured at HCB (salinity data gaps completed by annual average), air CO2 from FINOKALIA station and seawater pCO2 data: from pCO2 sensor at HCB (black line), estimated using AT derived from sensor SSS (Equation 5) and sensor pH (blue line), estimated using AT derived from buoy sensor SSS (Equation 5) and buoy sensor pH with constant wind (green line) and estimated using satellite SST and Chla (Equation 7) (grey line). A positive flux indicates a release of CO2 from the ocean toward the atmosphere. Due to a gap of wind data from 07/06/2021 to 12/09/21, a constant value of wind speed (5.50 m s-1) was used during that period, obtained by the average of summer values from the E1-M3A time-series data.
There are few time-series stations in the Mediterranean that monitor the carbonate system, with the vast majority being in the northwestern Mediterranean and the Northern Adriatic (Hassoun et al., 2022 and references therein; Champenois and Borges, 2021; Wimart-Rousseau et al., 2023). Among these, high-frequency (daily to hourly scale) published data in the Eastern Mediterranean are found sporadically in the Northern Adriatic (e.g. Turk et al., 2010, 2013) although initiatives are maintained (ICOS RI, 2022), and one year in the Saronikos Gulf (González-Dávila et al., 2016). The eutrophic Northern Adriatic is a particular case where the carbonate system in under strong riverine influence and strong benthic pelagic coupling due to its shallowness (Urbini et al., 2020 and references therein), thus not representative of the generally oligotrophic and deep system of the Eastern Mediterranean and therefore we will not include it in the following when mentioning “Eastern Mediterranean”. Time-series in the remaining Eastern Mediterranean are in the South-Eastern Levantine sub-basin (5- to 6-year cycles in Lebanese and Israeli coast, respectively Sisma-Ventura et al., 2017; Hassoun et al., 2019) and one in the Aegean Sea (one-year cycle in Saronikos Gulf; González-Dávila et al., 2016). Furthermore, a fourth one-year cycle in the North-Western Levantine (South of Crete) could be considered a reconstructed time-series out of three cruises and Argo floats casts (Wimart-Rousseau et al., 2021). In fact, the carbonate observing effort devoted to the Eastern Mediterranean, has been essentially with R/V cruises, mostly measuring CT, AT and pH (Wimart-Rousseau et al., 2021 and references therein; Álvarez et al., 2023 and references therein; Hassoun et al., 2022 and references therein). In addition, high frequency (hourly to daily scale) measurements are also scarce in the Mediterranean (Hassoun et al., 2022 and references therein), with the Eastern Mediterranean having before the present study only one annual high frequency cycle of pH (González-Dávila et al., 2016).
Observations at high frequency are important as they provide more information on changes in ocean chemistry essential for the assessment of the marine ecosystem’s responses to warming, eutrophication, and the oceanic CO2 uptake (Flecha et al., 2015), on how diel variations in plankton production and respiration contribute to the variability of the carbonate system (Honkanen et al., 2021), as well as on developing/validating algorithms and exploring drivers connected with sub-mesoscale phenomena. Measuring from moving platforms may compromise the results as biological diurnal oscillations may not be appropriately accounted for (Honkanen et al., 2021). The present study provides the first marine pCO2 time series in the Eastern Mediterranean measuring pCO2 directly and at high frequency (hourly scale) and the second pH time-series cycle also at high frequency (a previous annual cycle done in Saronikos Gulf in 2013; González-Dávila et al., 2016). This allowed for the examination of the drivers of surface pCO2 and pH temporal variability over a period of almost two years. In the area studied the strong seasonal variability and low values of net air-sea CO2 flux demonstrate the need of high frequency in-situ observations (including measurements of pCO2, temperature and wind speed) in order to reduce the uncertainty of the estimation.
Temperature plays a major role in driving seawater pCO2 and pH variability whereas changes induced by non-thermal processes are considered to be mainly due to biological activity, but could also include changes due to advection, vertical diffusion, and air-sea gas exchanges (Takahashi et al., 1993). The main drivers in determining pCO2 and pH on continental shelves include water temperature, water mixing, presence of organic matter in river plumes and biological control. At the low latitudes non-upwelling shelves, which are typically oligotrophic, the biological pump is less effective (review by Chen et al., 2013). Therefore, the importance of pCO2 seawater variability due to biological control is revisited in the Eastern Mediterranean (Wimart-Rousseau et al., 2021). Decomposing the drivers contributing to thermal control (pCO2TH) and non-thermal control (pCO2NT) (which in general cancel each other out) is important for understanding which drivers are more important (Ko et al., 2021). In our study area and period, we infer that pCO2TH was the main factor followed by pCO2NT due to evaporation, water mixing and biological remineralization-production, as explained below. Temperature is the dominant factor controlling the diel to seasonal variability of pCO2 (and pH), as previously described by other studies in the Eastern Mediterranean (González-Dávila et al., 2016; Wimart-Rousseau et al., 2020). The observed annual cycle of pCO2NT was similar to the one described in the North-Western Mediterranean (Merlivat et al., 2018; Wimart-Rousseau et al., 2023), however with biological control (remineralisation-production) and evaporation being the main non-thermal drivers, as suggested for the North-Western Levantine (Wimart-Rousseau et al., 2021). Starting from March, the pCO2NT decrease from March to May would be associated with photosynthetic uptake (decreasing CT and slightly increasing AT) as indicated by Chla higher values and progressively also associated with evaporation (mainly increasing AT). Then from June to September, the decrease of pCO2NT would be linked to the effect of AT increase related to evaporation (indicated by the salinity increase) as well as, but to a lesser extent, to autotrophic processes. The effect of remineralization would increase progressively from summer onwards. In fact though the biomass of heterotrophs is higher than autotrophs in this oligotrophic area during summer (Siokou-Frangou et al., 2002), the low amount of organic matter reduces the importance of remineralization in summer. It is only after accumulation of organic matter, with simultaneous decrease of autotrophic and evaporation processes that the increase of pCO2NT due to remineralization would appear in October (initiating the increase of CT). This increase of pCO2NT (and CT) would be supported by winter water mixing after December for a period lasting 1 to 3 months (Krasakopoulou et al., 2009; Tsiaras et al., this issue). Then pCO2NT increase would progressively be slowed down by autotrophs after February, closing the annual cycle. On the other hand, physical factors other than evaporation (i.e. land-based fluxes, precipitation, lateral advection) appear to play a minor role in the pCO2NT in the study area and period. In fact, land-based water fluxes are generally low as there are only small rivers in the area (Poulos et al., 2009) and as precipitation data (from land-based meteorological station data located in Heraklion city, Lagouvardos et al., 2017) showed no significant rain events during the period of pCO2 records (as confirmed by the absence of salinity decreases at HCB during rain events). Lateral advection appears to have negligible effect in pCO2NT at HCB. At this location, depending on the prevailing circulation pattern, local high salinity surface water shares occasionally the surface layers with less saline Modified Atlantic Water (MAW), karst waters (Georgopoulos et al., 2000) or Modified Black Sea Water (MBSW) (Velaoras et al., 2019; Kassis and Korres, 2021). A surface water mass of MAW or MBSW could explain the drop in salinity observed in May 2021 (but not karst waters since AT-SSS relation was not affected). This water mass intrusion did not affect pCO2.
Marginal seas are often an important sink for atmospheric CO2 and overall play a significant role in the global carbon cycle, as they transfer carbon to deeper layers, however, not all marginal seas are CO2 sinks and some function as CO2 sources (Borges, 2005; Chen et al., 2013; Dai et al., 2013). The current assessment of the whole Mediterranean as source or sink of CO2 lies mainly on modelling studies that describe it as close to equilibrium with the atmosphere, or at most functioning as a weak sink for atmospheric CO2 (D’Ortenzio et al., 2008; Palmiéri et al., 2015). In fact, the Mediterranean in-situ studies on pCO2 variability and air-sea fluxes are based upon a sparse time-series of pCO2 observations mainly located in the North-Western Mediterranean and the Adriatic Sea. There is lack of surface ocean pCO2 data with adequate spatial and/or temporal coverage in large areas of the Mediterranean, especially in the Eastern basin and the whole southern part of the basin (Hassoun et al., 2022; Álvarez et al., 2023). In the present study, the pCO2 time series measurements allowed for estimation of the air-sea fluxes, indicating a transition from a winter-spring CO2 sink (between mid-October and May) to a summer-autumn CO2 source (June to mid-October). These periods are in agreement with other field studies providing direct measurements of pCO2 or pCO2 calculated from AT-CT in the Aegean Sea in February and May (Krasakopoulou et al., 2006, 2009, respectively), estimates of pCO2 (by AT-pH) during an annual cycle in the Aegean (González-Dávila et al., 2016) and from reconstructed time-series out of seasonal cruises in the South-East (Sisma-Ventura et al., 2017) and the North-West Levantine Sea (Wimart-Rousseau et al., 2021). Among these studies, those that estimated annual air-sea CO2 fluxes (González-Dávila et al., 2016; Sisma-Ventura et al., 2017), suggest their area to be a weak CO2 source, which supports a previous hypothesis for the whole Eastern Mediterranean Sea (Durieu de Madron et al., 2009; Taillandier et al., 2012). The estimated annual flux obtained in the present study between -0.15 and -0.18 mol CO2 m-2 y-1 is close to the one obtained by modelling (Tsiaras et al., this issue) for the Levantine Basin (-0.25 mol CO2 m-2 y-1 for 2010-2022). However, it should be stressed that the area examined in the present study cannot be characterized as a CO2 sink due to a) the flux being low and b) the significant variability in the flux mostly related to wind speed. This is the case also for a general characterization of the Eastern Mediterranean as source or sink. The few field studies up to now, with direct CO2 measurements, suggest the flux being weak (either sink or source) while they are limited temporally to the present time-series and spatially to few cruises (Krasakopoulou et al., 2006; Krasakopoulou et al., 2009; Bakker et al., 2016) with most CO2 data being estimates from other carbonate system parameters (review by Álvarez et al., 2023). We hypothesize that most areas in the oligotrophic Eastern Mediterranean Sea currently act as either weak source or sink of CO2. This could be a transition period and with the rapid warming and increasing of atmospheric CO2, the balance may change to a strong sink as predicted by modelling studies (Cossarini et al., 2021; Tsiaras et al., this issue). Additional field studies, especially time series measuring CO2 (ideally at high frequency), are needed to support model and algorithm validation, to allow specifying the spatiotemporal extent as CO2 source or sink of this area.
Overall, the above described (section 4.2) dependencies of pCO2 mainly with temperature, evaporation (shown by salinity) and biological production (shown by Chla) support that remote sensing could be used to estimate pCO2, as discussed further below. In the Mediterranean Sea, only a few algorithms have been proposed for the estimation of pCO2 using temperature (or other non-carbonate variables) despite that temperature appears to be a dominant factor in determining surface pCO2 in the Mediterranean Sea. In the Eastern Mediterranean Sea, to our knowledge, only two studies have provided such relationships (González-Dávila et al., 2016; Sisma-Ventura et al., 2017). The present study provides the first pCO2 algorithm developed from in-situ CO2 measurements and remotely sensed SST data (Figure 5) confirming the potential for the prediction of pCO2 based on satellite data, as used in other marine regions (e.g. Eastern North Pacific, Hales et al., 2012). Moreover, it is suggested as a tool for extrapolation of CO2 dynamics over wider spatial scales in the Mediterranean Sea (Sisma-Ventura et al., 2017). Satellite Chla data were also accounted for, in the developed algorithm similarly to other studies (Ford et al., 2022 and references therein) together with the SST satellite data. However, the outcome showed no improvement of the agreement with the in-situ data. The weak role of biological non-thermal control of pCO2 was shown and discussed in the previous section. This could be explained by the generally low Chla concentration, both on average and in the amplitude of the seasonal variation, which is consistent with the oligotrophic character of the entire Cretan Sea, both in terms of Chla and primary production (Psarra et al., 2000). In addition, the fact that pCO2 measurements did not fully cover the late winter-spring bloom periods could weaken the correlation. It should be noted that extrapolation of in-situ observations of pCO2 using satellite observations like SST and Chla (Chen and Hu, 2019 and references therein; Ford et al., 2022 and references therein) should be done cautiously as application outside of the time–space domain in which it was developed is less reliable, essentially because of its empirical nature (D’Ortenzio et al., 2008). To examine the present algorithms’ spatiotemporal domain, we applied it (Equation 8) to a CO2 dataset from a wider area of the Eastern Mediterranean (Figure 1) spanning from 1999 to present. Data in the North Aegean with low salinities (<35) were excluded as the algorithm displayed high bias, which can be attributed to the carbonate system of this area being mostly related to Black Sea Water inflow and river runoff (Krasakopoulou et al., 2017). A linear term of +1.7 units per year accounted for long-term increase of pCO2 was included (related to atmospheric CO2 increase), as suggested by other studies (Chen and Hu, 2019). A +1.7 μatm pCO2 yr-1 (from 1983 to 2014), was also reported in the BATS and HOT stations (Bates et al., 2014), whereas in the Mediterranean Sea, reported values varied between +0.6 and +1.5 μatm pCO2 yr-1 (from 2010 to 2022, Tsiaras et al., this issue) and +3.5 µatm pCO2 yr-1 (from 2007 to 2015, Kapsenberg et al., 2017). Based upon the algorithm applicability analysis, it appeared that within the area and time window tested most (91%) of Δobs-est were between -20 and +20 μatm which is one order of magnitude below the amplitude of seasonal range (~150 μatm in the present study, ~200 μatm review by Álvarez et al., 2023). We thus consider that the algorithm could be useful when used, within the spatiotemporal window it was constructed, as an additional data quality control test, or to fill out data gaps of limited spatiotemporal extent. This analysis supports that the HCB station is indicative of a wider area of the Eastern Mediterranean Sea with respect to pCO2, as previously suggested for E1-M3A for temperature, Chla, primary production, pH, and oxygen (Henson et al., 2016).
Contrary to the few published relationships used to estimate pCO2 from temperature, many relationships used to estimate AT from salinity have been proposed for the different Mediterranean Sea sub-basins (Copin-Montégut, 1993; Schneider et al., 2007; Cossarini et al., 2015; Hassoun et al., 2015 and references therein; González-Dávila et al., 2016) and widely applied, for example, to reconstruct AT time-series (Wimart-Rousseau et al., 2021). Among these published AT-SSS relationships, the ones that performed better with the present study’s dataset were the ones of Hassoun et al. (2015) for Cretan Straits waters, followed by the one of González-Dávila et al. (2016). Despite the rather extended use of these AT-SSS relationships, satellite SSS data have been used only in preliminary estimates of AT in the Mediterranean (Sabia et al., 2020), probably as SSS satellite products have become mature only in recent years (Land et al., 2015). A comparison with latest satellite SSS products shows a difference of 0.3 salinity units demonstrating the upcoming potential to estimate AT from satellite SSS (Figures 2, 4).
The present study contributes to the recommendation to improve ocean acidification studies in the Mediterranean by increasing data coverage and availability, especially of time-series (Hassoun et al., 2022). There is a clear need to sustain the time-series in this area of scarce CO2 data affected by rapid warming (Sisma-Ventura et al., 2017). The provision of this new in-situ carbonate time series in a poorly covered area is also important internationally for databases such as SOCAT, and contributes to the United Nations Sustainable Development Goals (SDG) 13 Climate Action and SDG 14 Life Below Water [in particular 14.3.1 Average marine acidity (pH)]. In addition to providing data per se, the high frequency measurements of CO2 and pH allowed for a better understanding in the drivers of the temporal variability of the carbonate system, to develop new estimation algorithms, to support model validation, and to advance the current view of the Eastern Mediterranean air-sea flux. At this time, the net air-sea CO2 flux cannot be conclusively characterized as source or sink. Comparison of the fluxes from the 1980s and 2000s already showed a tendency for the Eastern Mediterranean to become a weaker CO2 source (Taillandier et al., 2012). The same trend was predicted by a study covering the period 1999-2019 (Cossarini et al., 2021). In the near future, the warmer Eastern Mediterranean is expected to become more stratified and oligotrophic (Reale et al., 2022). The present study emphasizes that in addition to future changes in temperature, atmospheric CO2 and biological productivity, it is crucial to consider future changes in the wind regime. One should consider not only whether the total wind stress will change, but also whether this change will occur mainly during the winter (sink) or summer (source) period. It is also important to consider the hypothesis that a transition is occurring in the Aegean Sea after 2020 with periods of deep water formation due to persistence of high salinity in upper and intermediate layers (Kassis and Korres, 2021; Potiris et al., 2023).
Another point that emerged was the benefit of a multi-platform approach (satellite, R/V cruises, buoy, atmospheric station) adopted in the present study, with a high sampling effort for 2.5 years. This can provide guidance for future observing activities with a cost-benefit approach, which is particularly important for countries with less available funds, such as those in the Eastern Mediterranean and the North African countries.
Indeed, the data obtained provided new carbonate estimation algorithms that can utilize remote sensing data (satellite SSS, SST and Chla) to fill data gaps of limited spatio-temporal extent. In addition to these algorithms, the results of the present study provide indications on how to optimize an in-situ observation strategy. Having in mind that direct measurements of the variable of interest (pH or pCO2) is the best, if a well-established local AT/SSS relationship exists (and its limitations known), then a pH (or pCO2) sensor could be used to estimate pCO2 (or pH) together with an in-situ SSS sensor. For example, in this case, since the estimation of pCO2 from pH (or pH from pCO2) together with SSS obtained from sensor at HCB is satisfactory, then the pH (or pCO2) sensor could be moved to the nearby (34 km) observing platform of the E1-M3A, thus increasing the spatial extent of observations without significant additional effort (instead of having both sensors at the same location).
The datasets presented in this study can be found in online repositories. The names of the repository/repositories and accession number(s) can be found below: The datasets generated and analyzed for this study can be found: a) POSEIDON buoy marine (physical and biogeochemical) and meteorological data, as well as physical and biogeochemical data collected during the R/V cruises at HCB and E1-M3A are available in the Mediterranean Sea in situ near-real-time observations product on the Copernicus Marine Environment Monitoring Service (https://data.marine.copernicus.eu/product/INSITU_MED_PHYBGCWAV_DISCRETE_MYNRT_013_035/description) (https://doi.org/10.48670/moi-00044), and in the POSEIDON system online repository (https://poseidon.hcmr.gr/services/ocean-data). b) the satellite data analyzed (SST, SSS, Chl-a) were found in the EU Copernicus Marine Service information respectively, https://doi.org/10.48670/moi-00051, https://doi.org/10.48670/moi-00051, https://doi.org/10.48670/moi-00300. c) Seawater and atmospheric CO2 data from the HCB can be found in the Surface Ocean CO2 Atlas (SOCAT) online repository, DOI:10.25921/1h9f-nb73 (Version 2022), DOI: 10.25921/r7xa-bt92 (Version 2023). d) the SOCAT data from the Eastern Mediterranean analyzed were obtained from https://socat.info/index.php/data-access/, DOI: 10.25921/r7xa-bt92 e) the atmospheric CO2 data from the atmospheric observation station of FINOKALIA analyzed can be found in the Integrated Carbon Observation System, ICOS online repository (https://www.icos-cp.eu/observations/national-networks/icos-greece), DOI: 10.18160/PEKQ-M4T1 f) the pH data from HCB and R/V cruises can be found in the SDG 14.3.1 Data Portal online repository (https://oa.iode.org/) with the title HCMR_HCB_Mooring, HCMR_HCB_Bottle). g) the AT and CT bottle data collected during the R/V cruises at HCB can be found in the European Marine Observation and Data Network (EMODnet), https://www.emodnet-ingestion.eu/submissions/) with the title Heraklion Coastal Buoy carbonate system parameters 2020-2022). Figure 1 was created using Ocean data view software (Schlitzer, 2021). Other figures were created using GraphPad Prism.
FC: Conceptualization, Formal analysis, Funding acquisition, Investigation, Methodology, Project administration, Resources, Supervision, Validation, Visualization, Writing – original draft, Writing – review & editing. NS: Conceptualization, Formal analysis, Investigation, Methodology, Resources, Software, Validation, Visualization, Writing – review & editing. PM: Investigation, Methodology, Resources, Writing – review & editing. MS: Investigation, Methodology, Resources, Writing – review & editing. KA: Conceptualization, Funding acquisition, Methodology, Writing – review & editing. GL: Investigation, Methodology, Writing – review & editing. TK: Writing – review & editing. CS: Project administration, Writing – review & editing. SJ: Conceptualization, Funding acquisition, Writing – review & editing. TM: Conceptualization, Funding acquisition, Writing – review & editing. BA: Writing – review & editing. KE: Writing – review & editing.
The author(s) declare financial support was received for the research, authorship, and/or publication of this article. This work was partially supported by the JERICO-S3 project. The JERICO-S3 project is funded by the European Commission’s H2020 Framework Programme under grant agreement No. 871153.
We would like to thank Dionysios Ballas and Paris Pagonis for technical assistance with the HCB and E1-M3A buoys, Maria Sotiropoulou for data management and processing in the POSEIDON system, Frangoulis Stamatis for help with manuscript editing, George Kouvarakis for guidance on comparisons with the Finokalia station. Special thanks also to Marta Álvarez, Melchor González-Dávila and Sabine Marty for best practices with the pH sensors. We would also like to thank Thanos Gritzalis for his helpful advice on CO2 data processing and submission to the SOCAT database. Special thanks to George Petihakis and Leonidas Perivoliotis for their support, guidance and recommendations for this research study. We wish to thank the captain and crew of the R/V AEGAEO for their assistance for maintenance of POSEIDON buoys and for sampling. We also thank Stella Psarra, Eleni Dafnomili and Snezana Zivanovic for nutrients and Chla samples analysis. BA is a research director at FNR.
The authors declare that the research was conducted in the absence of any commercial or financial relationships that could be construed as a potential conflict of interest.
The author(s) declared that they were an editorial board member of Frontiers, at the time of submission. This had no impact on the peer review process and the final decision.
All claims expressed in this article are solely those of the authors and do not necessarily represent those of their affiliated organizations, or those of the publisher, the editors and the reviewers. Any product that may be evaluated in this article, or claim that may be made by its manufacturer, is not guaranteed or endorsed by the publisher.
The Supplementary Material for this article can be found online at: https://www.frontiersin.org/articles/10.3389/fmars.2024.1348161/full#supplementary-material
Álvarez M., Catalá T. S., Civitarese G., Coppola L., Hassoun A. E. R., Ibello V., et al. (2023). “Mediterranean Sea general biogeochemistry,” in Oceanography of the Mediterranean Sea. Eds. Schroeder K., Chiggiato J. (Amsterdam: Elsevier), 387–451. doi: 10.1016/B978-0-12-823692-5.00004-2
Álvarez M., Sanleón-Bartolomé H., Tanhua T., Mintrop L., Luchetta A., Cantoni C., et al. (2014). The CO2 system in the Mediterranean Sea: A basin wide perspective. Ocean Sci. 10, 69–92. doi: 10.5194/os-10-69-2014
Aricò S., Arrieta J. M., Bakker D. C. E., Boyd P. W., Cotrim da Cunha L., Chai F., et al. (2021). Integrated Ocean Carbon Research: A Summary of Ocean Carbon Research, and Vision of Coordinated Ocean Carbon Research and Observations for the Next Decade. Eds. Wanninkhof R., Sabine C., Aricò S. (Paris: UNESCO), 46. IOC Technical Series, 158. doi: 10.25607/h0gj-pq41
Bakker D. C. E., Alin S. R., Bates N. R., Becker M., Feely R. A., Gritzalis T., et al. (2023). SOCAT version 2023 – An alarming decline in the ocean CO2 observing capacity. Available at: https://socat.info/wp-content/uploads/2023/06/2023_Poster_SOCATv2023_release.pdf (Accessed December 1, 2023).
Bakker D. C. E., Pfeil B., Landa C. S., Metzl N., O’Brien K. M., Olsen A., et al. (2016). A multi-decade record of high-quality fCO2 data in version 3 of the Surface Ocean CO2 Atlas (SOCAT). Earth Syst. Sci. Data 8, 383–413. doi: 10.5194/essd-8-383-2016
Bates N. R., Astor Y. M., Church M. J., Currie K., Dore J. E., González-Dávila M., et al. (2014). A time-series view of changing surface ocean chemistry due to ocean uptake of anthropogenic CO2 and ocean acidification. Oceanography 27, 126–141. doi: 10.5670/oceanog.2014.16
Bergamasco A., Malanotte-Rizzoli P. (2010). The circulation of the Mediterranean Sea: a historical review of experimental investigations. Adv. Oceanogr. Limnol. 1, 11–28. doi: 10.4081/aiol.2010.5293
Bethoux J. P., El Boukhary M. S., Ruiz-Pino D., Morin P., Copin-Montégut C. (2005). Nutrient, oxygen and carbon Ratios, CO2 sequestration and anthropogenic forcing in the Mediterranean Sea. Hdb Env. Chem. 5, 67–86. doi: 10.1007/b107144
Borges A. V. (2005). Do we have enough pieces of the jigsaw to integrate CO2 fluxes in the coastal ocean? Estuaries 28, 3–27. doi: 10.1007/BF02732750
Carracedo L. I., Pérez F. F., Gilcoto M., Velo A., Padín A., Rosón G. (2018). Role of the circulation on the anthropogenic CO2 inventory in the North-East Atlantic: A climatological analysis. Prog. Oceanogr. 161, 78–86. doi: 10.1016/j.pocean.2018.01.009
Champenois W., Borges A. V. (2021). Net community metabolism of a Posidonia oceanica meadow. Limnol. Oceanogr. 66, 2126–2140. doi: 10.1002/lno.11724
Chen S., Hu C. (2019). Environmental controls of surface water pCO2 in different coastal environments: observations from marine buoys. Cont. Shelf Res. 183, 73–86. doi: 10.1016/j.csr.2019.06.007
Chen C.-T., Huang T.-H., Chen Y.-C., Bai Y., He X., Kang Y. (2013). Air–sea exchanges of CO2 in the world’s coastal seas. Biogeosciences 10, 6509–6544. doi: 10.5194/bg-10-6509-2013
Clayton T. D., Byrne R. H. (1993). Spectrophotometric seawater pH measurements: total hydrogen ion concentration scale calibration of m-cresol purple and at-sea results. Deep Sea Res. Part I Oceanogr. Res. Pap. 40, 2115–2129. doi: 10.1016/0967-0637(93)90048-8
Copin-Montégut C. (1993). Alkalinity and carbon budgets in the Mediterranean Sea. Global Biogeochem. Cycles 7, 915–925. doi: 10.1029/93GB01826
Cossarini G., Feudale L., Teruzzi A., Bolzon G., Coidessa G., Solidoro C., et al. (2021). High-Resolution Reanalysis of the Mediterranean Sea Biogeochemistry (1999–2019). Front. Mar. Sci. 8, 2296–7745. doi: 10.3389/fmars.2021.741486
Cossarini G., Lazzari P., Solidoro C. (2015). Spatiotemporal variability of alkalinity in the Mediterranean Sea. Biogeosciences 12, 1647–1658. doi: 10.5194/bg-12-1647-2015
Dai M., Cao Z., Guo X., Zhai W., Liu Z., Yin Z., et al. (2013). Why are some marginal seas sources of atmospheric CO2? Geophys. Res. Lett. 40, 2154–2158. doi: 10.1002/grl.50390
Dickson A. G. (1990). Thermodynamics of the dissociation of boric acid in synthetic seawater from 273.15 to 318.15 K. Deep Sea Res. Part A. Oceanogr. Res. Pap. 37, 755–766. doi: 10.1016/0198-0149(90)90004-F
Dickson A. G., Millero F. J. (1987). A comparison of the equilibrium constants for the dissociation of carbonic acid in seawater media. Deep Sea Res. Part A. Oceanogr. Res. Pap. 34, 1733–1743. doi: 10.1016/0198-0149(87)90021-5
Dickson A. G., Sabine C. L., Christian J. R. (2007). Guide to best practices for Q26 ocean CO2 measurements. PICES Special Publication 3; IOCCP Report 8. (Sidney, British Columbia: North Pacific Marine Science Organization) 191. doi: 10.25607/OBP-1342
D’Ortenzio F., Antoine D., Marullo S. (2008). Satellite-driven modeling of the upper ocean mixed layer and air–sea CO2 flux in the Mediterranean Sea. Deep Sea Res. Part I Oceanogr. Res. Pap. 55, 405–434. doi: 10.1016/j.dsr.2007.12.008
Douglas N. K., Byrne R. H. (2017). Achieving accurate spectrophotometric pH measurements using unpurified meta-cresol purple. Mar. Chem. 190, 66–72. doi: 10.1016/j.marchem.2017.02.004
Durieu de Madron X., Ludwig W., Civitarese G., Gacic M., D’Alcalà M. R., Raimbault P., et al. (2009). “Shelf-slope nutrients and carbon fluxes in the Mediterranean Sea,” in Carbon and Nutrient Fluxes in Continental Margins, A Global Synthesis, Global Change. Eds. Liu K. K., Atkinson L., Quinones R., Talaue-McManus L. (Berlin Heidelberg: Springer-Verlag), 510.
Durrieu de Madron X., Zervakis V., Theocharis A., Georgopoulos D. (2005). Comments on “Cascades of dense water around the world ocean”. Prog. Oceanogr. 64, 83–90. doi: 10.1016/j.pocean.2004.08.004
Farcy P., Durand D., Charria G., Painting S. J., Tamminen T., Collingridge K., et al. (2019). Toward a European coastal observing network to provide better answers to science and to societal challenges; the JERICO research infrastructure. Front. Mar. Sci. 6. doi: 10.3389/fmars.2019.00529
Fassbender A. J., Sabine C. L., Cronin M. F. (2016). Net community production and calcification from 7 years of NOAA Station Papa Mooring measurements. Global Biogeochem. Cycles 30, 250–267. doi: 10.1002/2015GB005205
Flecha S., Pérez F. F., García-Lafuente J., Sammartino S., Ríos A. F., Huertas I. E. (2015). Trends of pH decrease in the Mediterranean Sea through high frequency observational data: indication of ocean acidification in the basin. Sci. Rep. 5, 16770. doi: 10.1038/srep16770
Flecha S., Pérez F. F., Murata A., Makaoui A., Huertas I. E. (2019). Decadal acidification in Atlantic and Mediterranean water masses exchanging at the Strait of Gibraltar. Sci. Rep. 9, 15533. doi: 10.1038/s41598-019-52084-x
Ford D. J., Tilstone G. H., Shutler J. D., Kitidis V. (2022). Derivation of seawater pCO2 from net community production identifies the South Atlantic Ocean as a CO2 source. Biogeosciences 19, 93–115. doi: 10.5194/bg-19-93-2022
Frangoulis C., Petihakis G., Perivoliotis L., Korres G., Ballas D., Pagonis P., et al. (2019). “The POSEIDON Supersite Observatory,” in A Technological Test-bed for the Eastern Mediterranean. in OCEANS 2019-Marseille (New York: IEE), 1–6. doi: 10.1109/OCEANSE.2019.8867105
Friedlingstein P., Jones M. W., O’Sullivan M., Andrew R. M., Bakker D. C. E., Hauck J., et al. (2022). Global carbon budget 2021. Earth Syst. Sci. Data 14, 1917–2005. doi: 10.5194/essd-14-1917-2022
Georgopoulos D., Chronis G., Zervakis V., Lykousis V., Poulos S., Iona A. (2000). Hydrology and circulation in the Southern Cretan Sea during the CINCS experiment (May 1994–September 1995). Prog. Oceanogr. 46, 89–112. doi: 10.1016/S0079-6611(00)00014-8
Gialesakis N., Kalivitis N., Kouvarakis G., Ramonet M., Lopez M., Kwok C. Y., et al. (2023). A twenty year record of greenhouse gases in the Eastern Mediterranean atmosphere. Sci. Total Environ. 864, 161003. doi: 10.1016/j.scitotenv.2022.161003
González-Dávila M., Santana-Casiano J. M., Petihakis G., Ntoumas M., Suárez de Tangil M., Krasakopoulou E. (2016). Seasonal pH variability in the Saronikos Gulf: A year-study using a new photometric pH sensor. J. Mar. Syst. 162, 37–46. doi: 10.1016/j.jmarsys.2016.03.007
Gruber N., Bakker D. C. E., DeVries T., Gregor L., Hauck J., Landschützer P., et al. (2023). Trends and variability in the ocean carbon sink. Nat. Rev. Earth Environ. 4, 119–134. doi: 10.1038/s43017-022-00381-x
Hales B., Strutton P. G., Saraceno M., Letelier R., Takahashi T., Feely R., et al. (2012). Satellite-based prediction of pCO2 in coastal waters of the eastern North Pacific. Prog. Oceanogr. 103, 1–15. doi: 10.1016/j.pocean.2012.03.001
Hassoun A. E. R., Bantelman A., Canu D., Comeau S., Galdies C., Gattuso J.-P., et al. (2022). Ocean acidification research in the Mediterranean Sea: Status, trends and next steps. Front. Mar. Sci. 9. doi: 10.3389/fmars.2022.892670
Hassoun A. E. R., Fakhri M., Abboud-Abi Saab M., Gemayel E., De Carlo E. H. (2019). The carbonate system of the Eastern-most Mediterranean Sea, Levantine Sub-basin: Variations and drivers. Deep Sea Res. Part II Top. Stud. Oceanogr. 164, 54–73. doi: 10.1016/j.dsr2.2019.03.008
Hassoun A. E. R., Gemayel E., Krasakopoulou E., Goyet C., Abboud-Abi Saab M., Ziveri P., et al. (2015). Modeling of the total alkalinity and the total inorganic carbon in the Mediterranean Sea. J. Water Resour. Ocean Sci. 4, 24–32. doi: 10.11648/j.wros.20150401.14
Henson S. A., Beaulieu C., Lampitt R. (2016). Observing climate change trends in ocean biogeochemistry: when and where. Glob. Change Biol. 22, 1561–1571. doi: 10.1111/gcb.13152
Holm-Hansen O., Lorenzen C. J., Holmes R. W., Strickland J. D. H. (1965). Fluorometric determination of chlorophyll. J. Cons. Int. Explor. Mer 30, 3–15. doi: 10.1093/icesjms/30.1.3
Honkanen M., Müller J. D., Seppälä J., Rehder G., Kielosto S., Ylöstalo P., et al. (2021). The diurnal cycle of pCO2 in the coastal region of the Baltic Sea. Ocean Sci. 17, 1657–1675. doi: 10.5194/os-17-1657-2021
Hsu S. A., Meindl E. A., Gilhousen D. B. (1994). Determining the power-law wind-profile exponent under near-neutral stability conditions at sea. J. Appl. Meteorol. Climatol. 33, 757–765. doi: 10.1175/1520-0450(1994)033<0757:DTPLWP>2.0.CO;2
ICOS RI (2022). ICOS Ocean Level 2 Data Release May-Dec 2021. ICOS Carbon Portal. doi: 10.18160/BCFM-GNVA
Ivančič I., Degobbis D. (1984). An optimal manual procedure for ammonia analysis in natural waters by the indophenol blue method. Water Res. 18, 1143–1147. doi: 10.1016/0043-1354(84)90230-6
Jiang Z., Hydes D. J., Hartman S. E., Hartman M. C., Campbell J. M., Johnson B. D., et al. (2014). Application and assessment of a membrane-based pCO2 sensor under field and laboratory conditions. Limnol. Oceanogr. Methods 12, 264–280. doi: 10.4319/lom.2014.12.264
Kapsenberg L., Alliouane S., Gazeau F., Mousseau L., Gattuso J.-P. (2017). Coastal ocean acidification and increasing total alkalinity in the northwestern Mediterranean Sea. Ocean Sci. 13, 411–426. doi: 10.5194/os-13-411-2017
Kassis D., Korres G. (2021). Recent hydrological status of the Aegean Sea derived from free drifting profilers. Mediterr. Mar. Sci. 22, 347–361. doi: 10.12681/mms.24833
Ko Y. H., Park G.-H., Kim D., Kim T.-W. (2021). Variations in seawater pCO2 associated with vertical mixing during tropical cyclone season in the northwestern subtropical pacific ocean. Front. Mar. Sci. 8. doi: 10.3389/fmars.2021.679314
Krasakopoulou E., Anagnostou C., Souvermezoglou E., Papathanassiou E., Rapsomanikis S. (2006). Distribution of dissolved inorganic carbon and related parameters in the Thermaikos Gulf (Eastern Mediterranean). Mediterr. Mar. Sci. 7, 63–78. doi: 10.12681/mms.178
Krasakopoulou E., Rapsomanikis S. (2023). Continuous underway measurements of atmospheric and dissolved CO2, SES_UNLUATA_GR1 cruise, Spring 2008 (Plouzane: SEANOE). doi: 10.17882/97636
Krasakopoulou E., Rapsomanikis S., Papadopoulos A., Papathanassiou E. (2009). Partial pressure and air–sea CO2 flux in the Aegean Sea during February 2006. Cont. Shelf Res. 29, 1477–1488. doi: 10.1016/j.csr.2009.03.015
Krasakopoulou E., Souvermezoglou E., Giannoudi L., Goyet C. (2017). Carbonate system parameters and anthropogenic CO2 in the North Aegean Sea during October 2013. Cont. Shelf Res. 149, 69–81. doi: 10.1016/j.csr.2017.04.002
Lagaria A., Mandalakis M., Mara P., Frangoulis C., Karatsolis B.-T., Pitta P., et al. (2017). Phytoplankton variability and community structure in relation to hydrographic features in the NE Aegean frontal area (NE Mediterranean Sea). Cont. Shelf Res. 149, 124–137. doi: 10.1016/j.csr.2016.07.014
Lagouvardos K., Kotroni V., Bezes A., Koletsis I., Kopania T., Lykoudis S., et al. (2017). The automatic weather stations NOANN network of the National Observatory of Athens: Operation and database. Geosci. Data J. 4, 4–16. doi: 10.1002/gdj3.44
Land P. E., Shutler J. D., Findlay H. S., Girard-Ardhuin F., Sabia R., Reul N., et al. (2015). Salinity from space unlocks satellite-based assessment of ocean acidification. Environ. Sci. Technol. 49, 1987–1994. doi: 10.1021/es504849s
Lee K., Sabine C. L., Tanhua T., Kim T.-W., Feely R. A., Kim H.-C. (2011). Roles of marginal seas in absorbing and storing fossil fuel CO2. Energy Environ. Sci. 4, 1133–1146. doi: 10.1039/C0EE00663G
Liu X., Patsavas M. C., Byrne R. H. (2011). Purification and characterization of meta-cresol purple for spectrophotometric seawater pH measurements. Environ. Sci. Technol. 45, 4862–4868. doi: 10.1021/es200665d
Malanotte-Rizzoli P., Eremeev V. N. (1999). The Eastern Mediterranean as a laboratory basin for the assessment of contrasting ecosystems Vol. 51 (Netherlands: Kluwer Academic Publishers).
Mehrbach C., Culberson C. H., Hawley J. E., Pytkowicx R. M. (1973). Measurement of the apparent dissociation constants of carbonic acid in seawater at atmospheric pressure 1. Limnol. Oceanogr. 18, 897–907. doi: 10.4319/lo.1973.18.6.0897
Merlivat L., Boutin J., Antoine D., Beaumont L., Golbol M., Vellucci V. (2018). Increase of dissolved inorganic carbon and decrease in pH in near-surface waters in the Mediterranean Sea during the past two decades. Biogeosciences 15, 5653–5662. doi: 10.5194/bg-15-5653-2018
Palmiéri J., Orr J. C., Dutay J.-C., Béranger K., Schneider A., Beuvier J. (2015). Simulated anthropogenic CO2 storage and acidification of the Mediterranean Sea. Biogeosciences 12, 781–802. doi: 10.5194/bg-12-781-2015
Parard G., Lefèvre N., Boutin J. (2010). Sea water fugacity of CO2 at the PIRATA mooring at 6 S, 10 W. Tellus B Chem. Phys. Meteorol. 62, 636–648. doi: 10.1111/j.1600-0889.2010.00503.x
Petihakis G., Perivoliotis L., Korres G., Ballas D., Pagonis P., Ntoumas M., et al. (2018). An integrated open-coastal biogeochemistry, ecosystem and biodiversity observatory of the Eastern Mediterranean. The Cretan Sea component of POSEIDON system. Ocean Sci. 14, 1223–12245. doi: 10.5194/os-14-1223-2018
Pierrot D., Epitalon J.-M., Orr J. C., Lewis E., Wallace D. W. R. (2021). MS Excel program developed for CO2 system calculations – version 3.0. GitHub Repository. Available at: https://github.com/dpierrot/co2sys_xl (Accessed December, 2023).
Potiris M., Mamoutos I. G., Zervakis V., Tragou E., Kassis D., Ballas D. (2023). Record-high salinity and interannual dense water formation variability in the Aegean Sea coincide with reduced inflow of Black Sea Water. in EGU General Assembly 2023 24–28 Apr 2023 (Katlenburg-Lindau: Copernicus Publishing). doi: 10.5194/egusphere-egu23-13363
Poulos S. E., Dounas C. G., Alexandrakis G., Koulouri P., Drakopoulos P. (2009). Trace metal distribution in sediments of northern continental shelf of Crete Island, Eastern Mediterranean. Environ. Geol. 58, 843–857. doi: 10.1007/s00254-008-1560-1
Psarra S., Tselepides A., Ignatiades L. (2000). Primary productivity in the oligotrophic Cretan Sea (NE Mediterranean): seasonal and interannual variability. Prog. Oceanogr. 46, 187–204. doi: 10.1016/S0079-6611(00)00018-5
Reale M., Cossarini G., Lazzari P., Lovato T., Bolzon G., Masina S., et al. (2022). Acidification, deoxygenation, and nutrient and biomass declines in a warming Mediterranean Sea. Biogeosciences 19, 4035–4065. doi: 10.5194/bg-19-4035-2022
Rimmelin P., Moutin T. (2005). Re-examination of the MAGIC method to determine low orthophosphate concentration in seawater. Anal. Chim. Acta 548, 174–182. doi: 10.1016/j.aca.2005.05.071
Robinson A. R., Golnaraghi M. (1994). “The Physical and Dynamical Oceanography of the Mediterranean Sea,” in Ocean Processes in Climate Dynamics: Global and Mediterranean Examples. Eds. Malanotte-Rizzoli R., Robison A. R. (Dordrecht: NATO ASI Series, Springer), vol. 419, 255–306. doi: 10.1007/978-94-011-0870-6_12
Sabia R., Olmedo E., Cossarini G., Alvera-Azcárate A., Gonzalez-Gambau V., Fernández-Prieto D. (2020). SMOS-based estimation and validation of Total Alkalinity in the Mediterranean basin. in EGU General Assembly 2020. 4–8 May 2020. (Katlenburg-Lindau: Copernicus Publishing). doi: 10.5194/egusphere-egu2020-20753
Schlitzer R. (2021). Ocean Data View. Available online at: https://odv.awi.de (Accessed January, 2024)
Schneider A., Tanhua T., Körtzinger A., Wallace D. W. R. (2010). High anthropogenic carbon content in the eastern Mediterranean. J. Geophys. Res. Ocean. 115, 1–11. doi: 10.1029/2010JC006171
Schneider A., Wallace D. W. R., Körtzinger A. (2007). Alkalinity of the Mediterranean Sea. Geophys. Res. Lett. 34, 1–5. doi: 10.1029/2006GL028842
Siokou-Frangou I., Bianchi M., Christaki U., Christou E. D., Giannakourou A., Gotsis O., et al. (2002). Carbon flow in the planktonic food web along a gradient of oligotrophy in the Aegean Sea (Mediterranean Sea). J. Mar. Syst. 33, 335–353. doi: 10.1016/S0924-7963(02)00065-9
Sisma-Ventura G., Bialik O. M., Yam R., Herut B., Silverman J. (2017). pCO2 variability in the surface waters of the ultra-oligotrophic Levantine Sea: Exploring the air–sea CO2 fluxes in a fast warming region. Mar. Chem. 196, 13–23. doi: 10.1016/j.marchem.2017.06.006
Strickland J. D. H., Parsons T. R. (1972). A Practical Handbook of Seawater Analysis. Bulletin Fisheries Research Board of Canada, Nr. 167 2nd ed. (Ottawa: Fisheries Research Board of Canada), 71–76. doi: 10.25607/OBP-1791
Taillandier V., D’Ortenzio F., Antoine D. (2012). Carbon fluxes in the mixed layer of the Mediterranean Sea in the 1980s and the 2000s. Deep Sea Res. Part I Oceanogr. Res. Pap. 65, 73–84. doi: 10.1016/j.dsr.2012.03.004
Takahashi T., Olafsson J., Goddard J. G., Chipman D. W., Sutherland S. C. (1993). Seasonal variation of CO2 and nutrients in the high-latitude surface oceans: A comparative study. Global Biogeochem. Cycles 7, 843–878. doi: 10.1029/93GB02263
Takahashi T., Sutherland S., Sweeney C., Poisson A., Metzl N., Tilbrook B., et al. (2002). Global sea-air CO2 flux based on climatological surface ocean pCO2, and seasonal biological and temperature effects. Deep Sea Res. Part II Top. Stud. Oceanogr. 49, 1601–1622. doi: 10.1016/S0967-0645(02)00003-6
Touratier F., Goyet C., Houpert L., De Madron X. D., Lefèvre D., Stabholz M., et al. (2016). Role of deep convection on anthropogenic CO2 sequestration in the Gulf of Lions (northwestern Mediterranean Sea). Deep Sea Res. Part I Oceanogr. Res. Pap. 113, 33–48. doi: 10.1016/j.dsr.2016.04.003
Turk D., Book J. W., McGillis W. R. (2013). pCO2 and CO2 exchange during high bora winds in the Northern Adriatic. J. Mar. Syst. 117, 65–71. doi: 10.1016/j.jmarsys.2013.02.010
Turk D., Malačič V., DeGrandpre M. D., McGillis W. R. (2010). Carbon dioxide variability and air-sea fluxes in the northern Adriatic Sea. J. Geophys. Res. 115, C10043. doi: 10.1029/2009JC006034
Urbini L., Ingrosso G., Djakovac T., Piacentino S., Giani M. (2020). Temporal and spatial variability of the CO2 system in a riverine influenced area of the Mediterranean Sea, the northern Adriatic. Front. Mar. Sci. 7. doi: 10.3389/fmars.2020.00679
Velaoras D., Papadopoulos V. P., Kontoyiannis H., Cardin V., Civitarese G. (2019). Water masses and hydrography during April and June 2016 in the cretan sea and cretan passage (Eastern Mediterranean Sea). Deep Sea Res. Part II Top. Stud. Oceanogr. 164, 25–40. doi: 10.1016/j.dsr2.2018.09.005
Wanninkhof R. (2014). Relationship between wind speed and gas exchange over the ocean revisited. Limnol. Oceanogr. Methods 12, 351–362. doi: 10.4319/lom.2014.12.351
Weiss R. (1974). Carbon dioxide in water and seawater: the solubility of a non-ideal gas. Mar. Chem. 2, 203–215. doi: 10.1016/0304-4203(74)90015-2
Wimart-Rousseau C., Lajaunie-Salla K., Marrec P., Wagener T., Raimbault P., Lagadec V., et al. (2020). Temporal variability of the carbonate system and air-sea CO2 exchanges in a Mediterranean human-impacted coastal site. Estuar. Coast. Shelf Sci. 236, 106641. doi: 10.1016/j.ecss.2020.106641
Wimart-Rousseau C., Wagener T., Álvarez M., Moutin T., Fourrier M., Coppola L., et al. (2021). Seasonal and interannual variability of the CO2 system in the Eastern Mediterranean Sea: A case study in the North Western Levantine basin. Front. Mar. Sci. 8. doi: 10.3389/fmars.2021.649246
Wimart-Rousseau C., Wagener T., Bosse A., Raimbault P., Coppola L., Fourrier M., et al. (2023). Assessing seasonal and interannual changes in carbonate chemistry across two time-series sites in the North Western Mediterranean Sea. Front. Mar. Sci. 10, 1281003. doi: 10.3389/fmars.2023.1281003
Keywords: carbonate algorithms, CO2 flux, oligotrophic, satellite salinity, source or sink
Citation: Frangoulis C, Stamataki N, Pettas M, Michelinakis S, King AL, Giannoudi L, Tsiaras K, Christodoulaki S, Seppälä J, Thyssen M, Borges AV and Krasakopoulou E (2024) A carbonate system time series in the Eastern Mediterranean Sea. Two years of high-frequency in-situ observations and remote sensing. Front. Mar. Sci. 11:1348161. doi: 10.3389/fmars.2024.1348161
Received: 01 December 2023; Accepted: 29 January 2024;
Published: 15 February 2024.
Edited by:
Abed El Rahman Hassoun, Helmholtz Association of German Research Centres (HZ), GermanyReviewed by:
Naohiro Kosugi, Japan Meteorological Agency, JapanCopyright © 2024 Frangoulis, Stamataki, Pettas, Michelinakis, King, Giannoudi, Tsiaras, Christodoulaki, Seppälä, Thyssen, Borges and Krasakopoulou. This is an open-access article distributed under the terms of the Creative Commons Attribution License (CC BY). The use, distribution or reproduction in other forums is permitted, provided the original author(s) and the copyright owner(s) are credited and that the original publication in this journal is cited, in accordance with accepted academic practice. No use, distribution or reproduction is permitted which does not comply with these terms.
*Correspondence: C. Frangoulis, Y2ZyYW5nb3VsaXNAaGNtci5ncg==
Disclaimer: All claims expressed in this article are solely those of the authors and do not necessarily represent those of their affiliated organizations, or those of the publisher, the editors and the reviewers. Any product that may be evaluated in this article or claim that may be made by its manufacturer is not guaranteed or endorsed by the publisher.
Research integrity at Frontiers
Learn more about the work of our research integrity team to safeguard the quality of each article we publish.