 Wenjie Zhang1
 Hongsheng Bi
 Xuemin Cheng
 Zhonghua Cai
95% of researchers rate our articles as excellent or good
Learn more about the work of our research integrity team to safeguard the quality of each article we publish.
Find out more
ORIGINAL RESEARCH article
Front. Mar. Sci. , 13 February 2024
Sec. Ocean Observation
Volume 11 - 2024 | https://doi.org/10.3389/fmars.2024.1341191
This article is part of the Research Topic Deep Learning for Marine Science, volume II View all 27 articles
Zooplankton size is a crucial indicator in marine ecosystems, reflecting demographic structure, species diversity and trophic status. Traditional methods for measuring zooplankton size, which involve direct sampling and microscopic analysis, are laborious and time-consuming. In situ imaging systems are useful sampling tools; however, the variation in angles, orientations, and image qualities presented considerable challenges to early machine learning models tasked with measuring sizes.. Our study introduces a novel, efficient, and precise deep learning-based method for zooplankton size measurement. This method employs a deep residual network with an adaptation: replacing the fully connected layer with a convolutional layer. This modification allows for the generation of an accurate predictive heat map for size determination. We validated this automated approach against manual sizing using ImageJ, employing in-situ images from the PlanktonScope. The focus was on three zooplankton groups: copepods, appendicularians, and shrimps. An analysis was conducted on 200 individuals from each of the three groups. Our automated method's performance was closely aligned with the manual process, demonstrating a minimal average discrepancy of just 1.84%. This significant advancement presents a rapid and reliable tool for zooplankton size measurement. By enhancing the capacity for immediate and informed ecosystem-based management decisions, our deep learning-based method addresses previous challenges and opens new avenues for research and monitoring in zooplankton.
Zooplankton, encompassing a diverse array of organisms, are integral to the functioning of marine ecosystems. They serve as the foundational elements of aquatic food chains, a role underscored by numerous studies (e.g., Frederiksen et al., 2006; Sun et al., 2021). As primary consumers, zooplankton play a pivotal role in transferring energy from the lowest trophic level, the phytoplankton, up the food web. This process is critical for the survival and growth of a multitude of marine species, including commercially important fish and larger marine mammals (Moustaka-Gouni and Sommer, 2020). Zooplankton are often characterized with short lifespans and rapid reproductive cycles which make them highly responsive to environmental changes. Consequently, they are living indicators for ecosystems structure and function. Variations in the abundance, distribution, and species composition of zooplankton populations can signal shifts in environmental conditions, such as changes in water temperature, salinity, and nutrient availability (Richardson, 2008; Bi et al., 2011; Dam and Baumann, 2017).
The size of zooplankton is a fundamental attribute and plays a crucial role in understanding and managing marine ecosystems (Brandão et al., 2021). The size of zooplankton is indicative of their energy and nutrient content, which is vital for the growth and survival of their predators (Ikeda, 1985; Hunt et al., 2011) and fish often selectively feed on large zooplankton (De Robertis et al., 2000). Larger zooplankton typically contain more energy and nutrients, making them a more valuable food source for higher trophic levels. This aspect is particularly important in fisheries science, as the growth and health of commercially important fish species are often directly linked to the availability and size of zooplankton in their diet (Castonguay et al., 2008; Perretti et al., 2017). Furthermore, the size distribution of zooplankton populations can provide insights into environmental conditions and the corresponding changes in demographic structure and growth rates (Caswell and Twombly, 1989; Shaw et al., 2021). Within the broader community context, the size distribution of plankton contributes significantly to the overall community dynamics and the structure of the ecosystem (Hooff and Peterson, 2006; Pitois et al., 2021).
Although plankton size is a critical parameter, automated measurement methods are underdeveloped. Traditionally, size is gauged under a microscope (Alvarez et al., 2014), a method praised for its precision but hampered by its time-intensive nature and reliance on skilled taxonomists. This can lead to errors due to human fatigue (Culverhouse et al., 2003). Moreover, conventional collection techniques like pumps and nets often harm these delicate organisms, complicating the process of obtaining intact samples (Remsen et al., 2004).
To improve efficiency and address existing challenges in plankton size measurement, innovative imaging systems have been developed. Technologies like the optical plankton counter and flow cam, coupled with machine learning approaches, are now utilized both in laboratory and field settings (Mullin and Ang, 1974; Edvardsen et al., 2002). These instruments, while expediting the measurement process, typically operate on the assumption that particles are spherical. They employ basic measurements such as cross-sectional length or major axis to estimate length. However, these methods have limitations, including strict requirements on particle size and the necessity for certain sample pretreatments. Such prerequisites can cause damage to the samples (Hernandez-Leon and Montero, 2006). Additionally, results from these instruments can be skewed by factors such as the assumption of particle sphericity and interference from bubbles (Herman, 1992).
In recent decades, the evolution of plankton imaging systems (Benfield et al., 2007) has further advanced the application of image-based machine learning for plankton size measurement. For instance, the ZooScan system utilizes semi-automated procedures for size measurement, analyzing variables like the target’s area, major, and minor axes (Gorsky et al., 2010; Vandromme et al., 2012). A notable development is the use of machine learning algorithms for measuring specific features, such as the length of copepods from head to tail, showcasing the potential of machine learning in automating plankton size measurement (Pitois et al., 2021). However, the accuracy of these measurements can be influenced by the organism’s orientation and complex morphology (Kydd et al., 2018). Organisms like appendicularians, chaetognaths, and small shrimps, which often exhibit curved shapes, present challenges as their lengths cannot be accurately measured with a straight line. This necessitates a more robust approach to size measurement. Moreover, the rapid advancements in deep learning-based recognition systems have enabled faster identification, instance segmentation, and enumeration of plankton species (e.g., Cheng et al., 2019; Campbell et al., 2020). Traditional image processing tools, such as ImageJ, are inadequate for managing large digital collections of plankton samples, underscoring the need for methods that can swiftly process extensive image datasets and accurately gather size information (Schneider et al., 2012).
Recent advancements in deep learning technologies have ushered in new methodologies for rapid measurement of plankton size. One notable example is MMDetection (Kai et al., 2019), an open-source platform for target detection built on the PyTorch framework (Paszke et al., 2019). This platform is capable of performing a variety of tasks, including instance segmentation, target detection, human key point detection, and semantic segmentation. Central to its functionality is the key point detection technology, which employs convolutional neural networks to model and predict specific node information within an image (Schmidhuber, 2015; Eltanany et al., 2019). This technology has seen widespread application in various fields, ranging from human posture estimation (Jalal et al., 2020) and behavior recognition (Bai and Han, 2020) to expression detection (An et al., 2015), human-computer interaction (Ju et al., 2014), and autonomous driving (Behera et al., 2018).
In the present study, we explore the use of key point detection technology for measuring the size of plankton. This approach involves identifying critical points on the plankton, such as the head and tail, and extracting their coordinate information. With this data, we can determine the length of the plankton directly from images. This technique is particularly useful for organisms with complex or curved shapes. By placing multiple key points along the organism’s body – for example, at the head, mid-point of the curve, and tail – we can approximate the length of each curved segment with a straight line. By summing the lengths of these segments, we can accurately estimate the total length of the organism. This innovative application of key point detection offers a promising solution for efficiently measuring plankton sizes, even in cases of irregularly shaped specimens.
In this study, plankton images were captured using PlanktonScope1, a shadowgraph imaging system, from the coastal waters of Guangdong, P.R. China (Song et al., 2020; Liu et al., 2021; Bi et al., 2022). PlanktonScope effectively preserves the original shape and size of specimens without distortion (Bi et al., 2012; Song et al., 2020). The images, presented as full frames (Figure 1), were sourced from a collection of 200,000 images acquired from Daya Bay, Shenzhen, in August 2021 (Liu et al., 2021). These images underwent initial processing using an end-to-end approach (Bi et al., 2024), involving segmentation, classification, and storage of target organisms into different classes (Figure 2). Ten representative classes are shown in Figure 2. A subset of 400 suitable images for each of the three classes: copepods, shrimps, and appendicularians, were selected for key point detection as the experimental dataset (Figure 3). Note that while we demonstrated the procedure using images captured by PlanktonScope, this method is versatile and can be applied to plankton images obtained from other imaging systems as well.
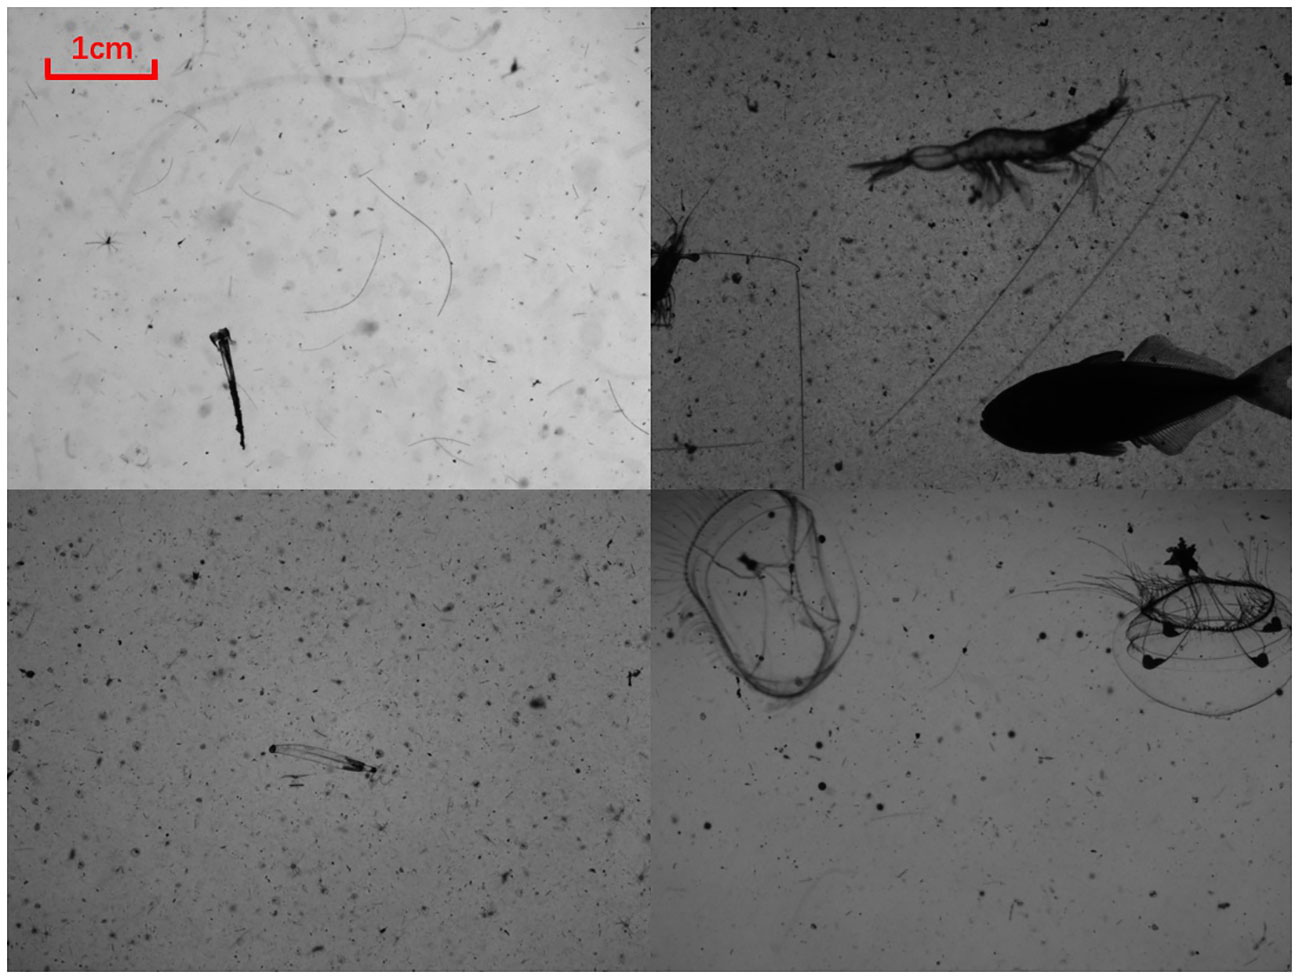
Figure 1 Examples of full frame images captured using PlanktonScope.
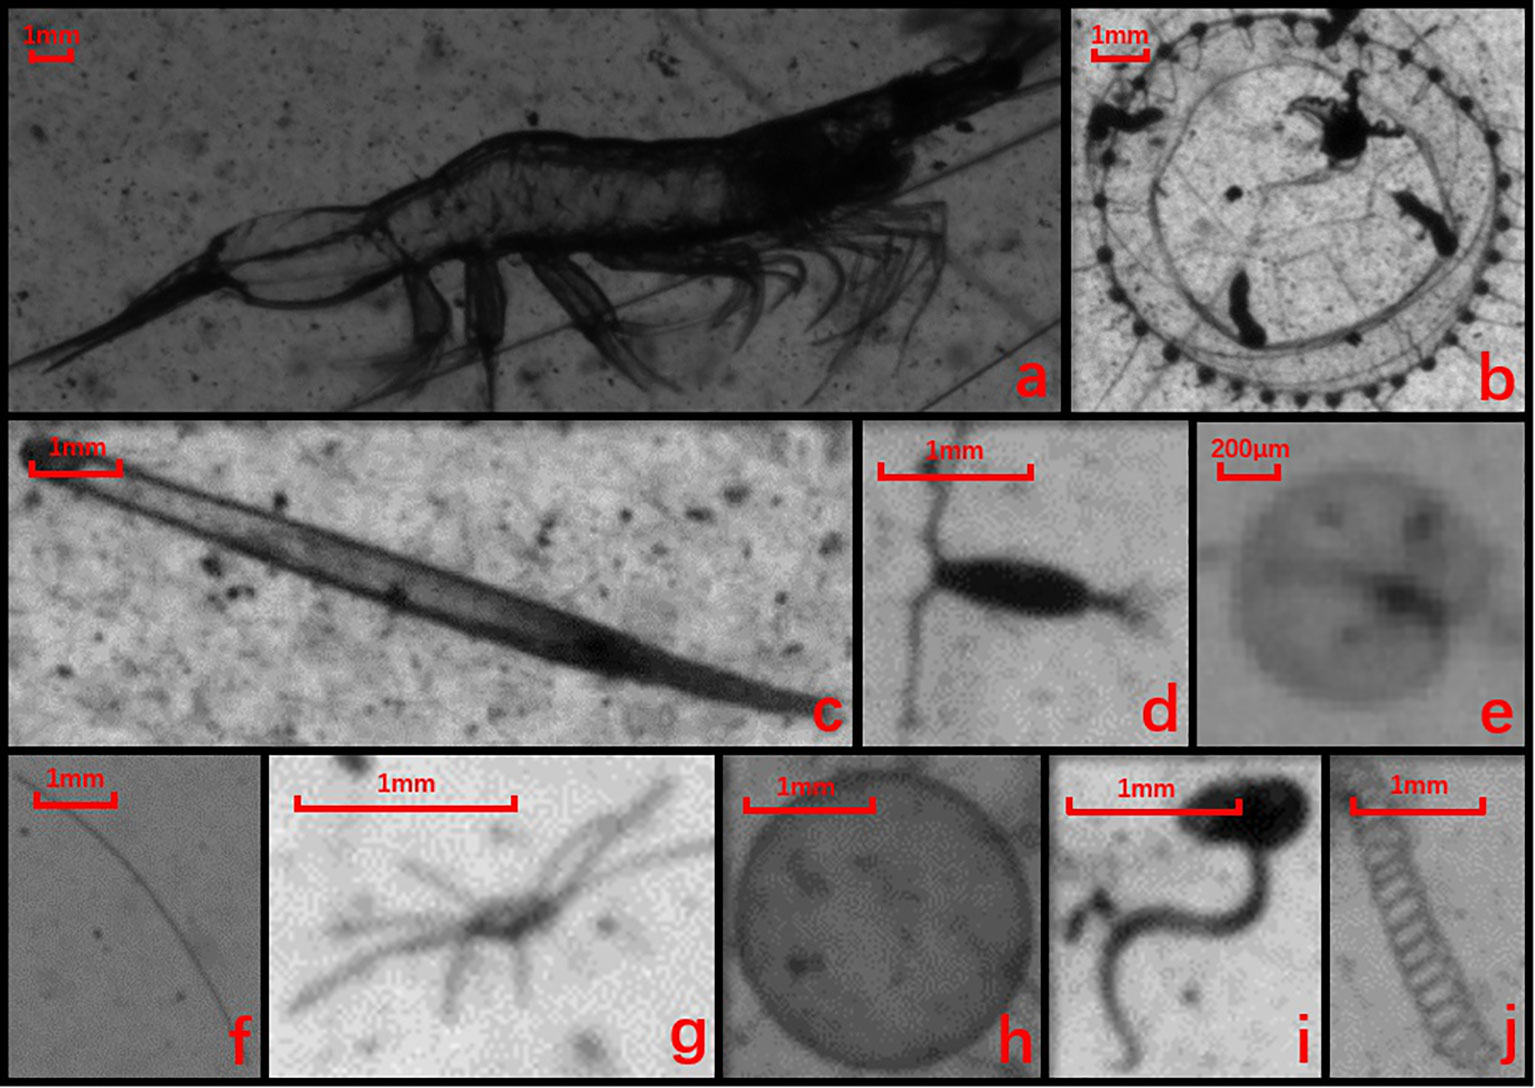
Figure 2 Example images of 10 dominant groups: a. mysid shrimp, b. medusa, c. chaetognath, d. copepod, e. Noctiluca, f. line-shaped algae, g. Echinoderm larva, h. Phaeocystis colony, i. Appendicularia, and j. spiral-shaped diatom.
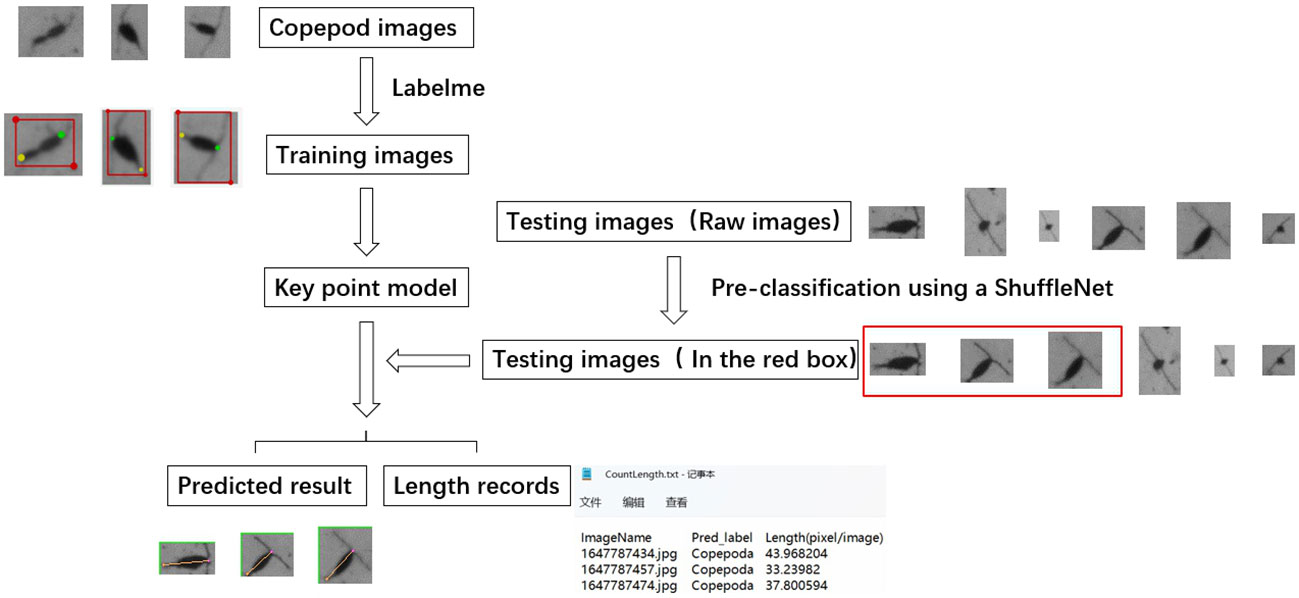
Figure 3 Schematic flowchart of key point detection model development for plankton size measurement, with copepod as an example. green dots represent the head of the copepod, while yellow dots mark the tail end.
During the pre-training phase of our study, we utilized ShuffleNet, an efficient pre-classification network (Zhang et al., 2018), to sort through segmented images, identifying those appropriate for body length measurement in the test set. An example of unsuitability for measurement is the bird’s-eye view of an organism (Figure 4), which cannot provide accurate length information. It is important to note that as long as the organism is captured fully and from the correct perspective, varying orientations do not affect the measurement process.
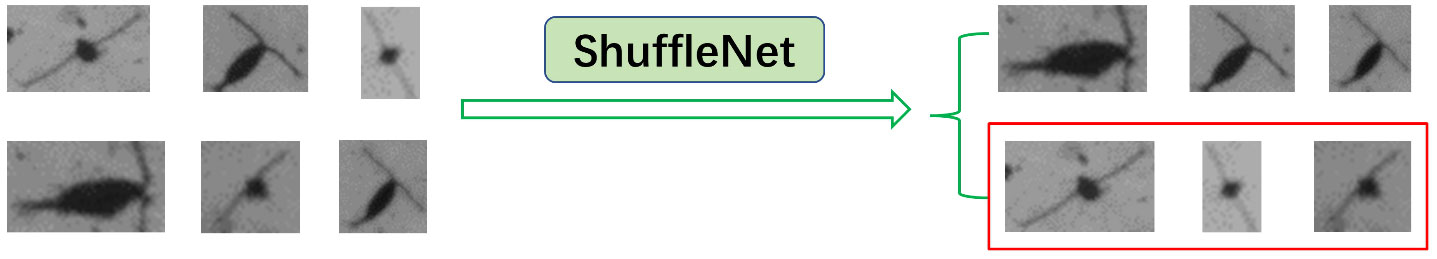
Figure 4 Description of the pre-classification process. The images highlighted within red boxes represent copepods deemed unsuitable for size measurement.
For the training of the ShuffleNet classification model, we selected a total of 2,000 copepod images, half of which were deemed suitable for body length measurement and the other half unsuitable, based on their imaging criteria. The selected images were divided into a training set (70%) and a validation set (30%). Additionally, we randomly selected an independent set of 300 individuals, distinct from those used in training and validation, to serve as a testing dataset. The performance of the model, as evidenced by the confusion matrix and test results, was robust and reliable. Detailed results of this evaluation can be found in the results section of this paper. Images that met the criteria for suitability were then processed through the key point detection model for precise body length measurement. This step involved predicting key points on each individual image and calculating their lengths accordingly. The model’s ability to accurately differentiate between suitable and unsuitable images for length measurement was confirmed through the test results and is elaborated upon in the results section.
From the pool of segmented images deemed suitable for size measurement, we selected 400 images for each of the three classes - copepods, shrimps, and appendicularians - to use in key point detection, forming our experimental dataset. These selected images were then subdivided into two categories: 300 images from each class, encompassing a variety of imaging conditions and viewing angles, were allocated for creating the training dataset. The remaining 100 images per class were reserved for testing purposes. The training set was manually labeled using Labelme, an image annotation tool (Wada, 2018), generating training data. The model underwent training using a heat map matching method to calculate loss and optimize backpropagation parameters (Yang et al., 2020).
Labelme is an image annotation tool developed by MIT’s Computer Science and Artificial Intelligence Laboratory (Schneider et al., 2012). In the present study, the labeling process began with marking each target organism within a rectangular bounding box (as shown in Figures 5a1-c4 training data) and assigning an appropriate class name. Subsequently, key points were identified and marked on the organism, with the number of key points varying based on the organism’s structural characteristics and its appearance in the image. It should be noted that the target box in the image annotations primarily served to facilitate future research focused on key point detection in scenarios involving multiple targets. However, the information from the target box itself was not utilized in the analysis conducted in this study.
For the copepod class, we implemented a 2-point detection system, tagging only the head and tail end (examples in Figure 3 and Figures 5C1-C4). This method is effective as the length of copepods in our samples can generally be measured with a straight line, except in cases of bird’s-eye view or rare occurrences of curvy shapes. Each copepod was initially encased in a rectangular box, labeled as “Copepoda,” and then the head and tail ends were marked with “0” and “1,” respectively. It’s noteworthy that an additional key point can be added between the prosome and urosome if necessary.
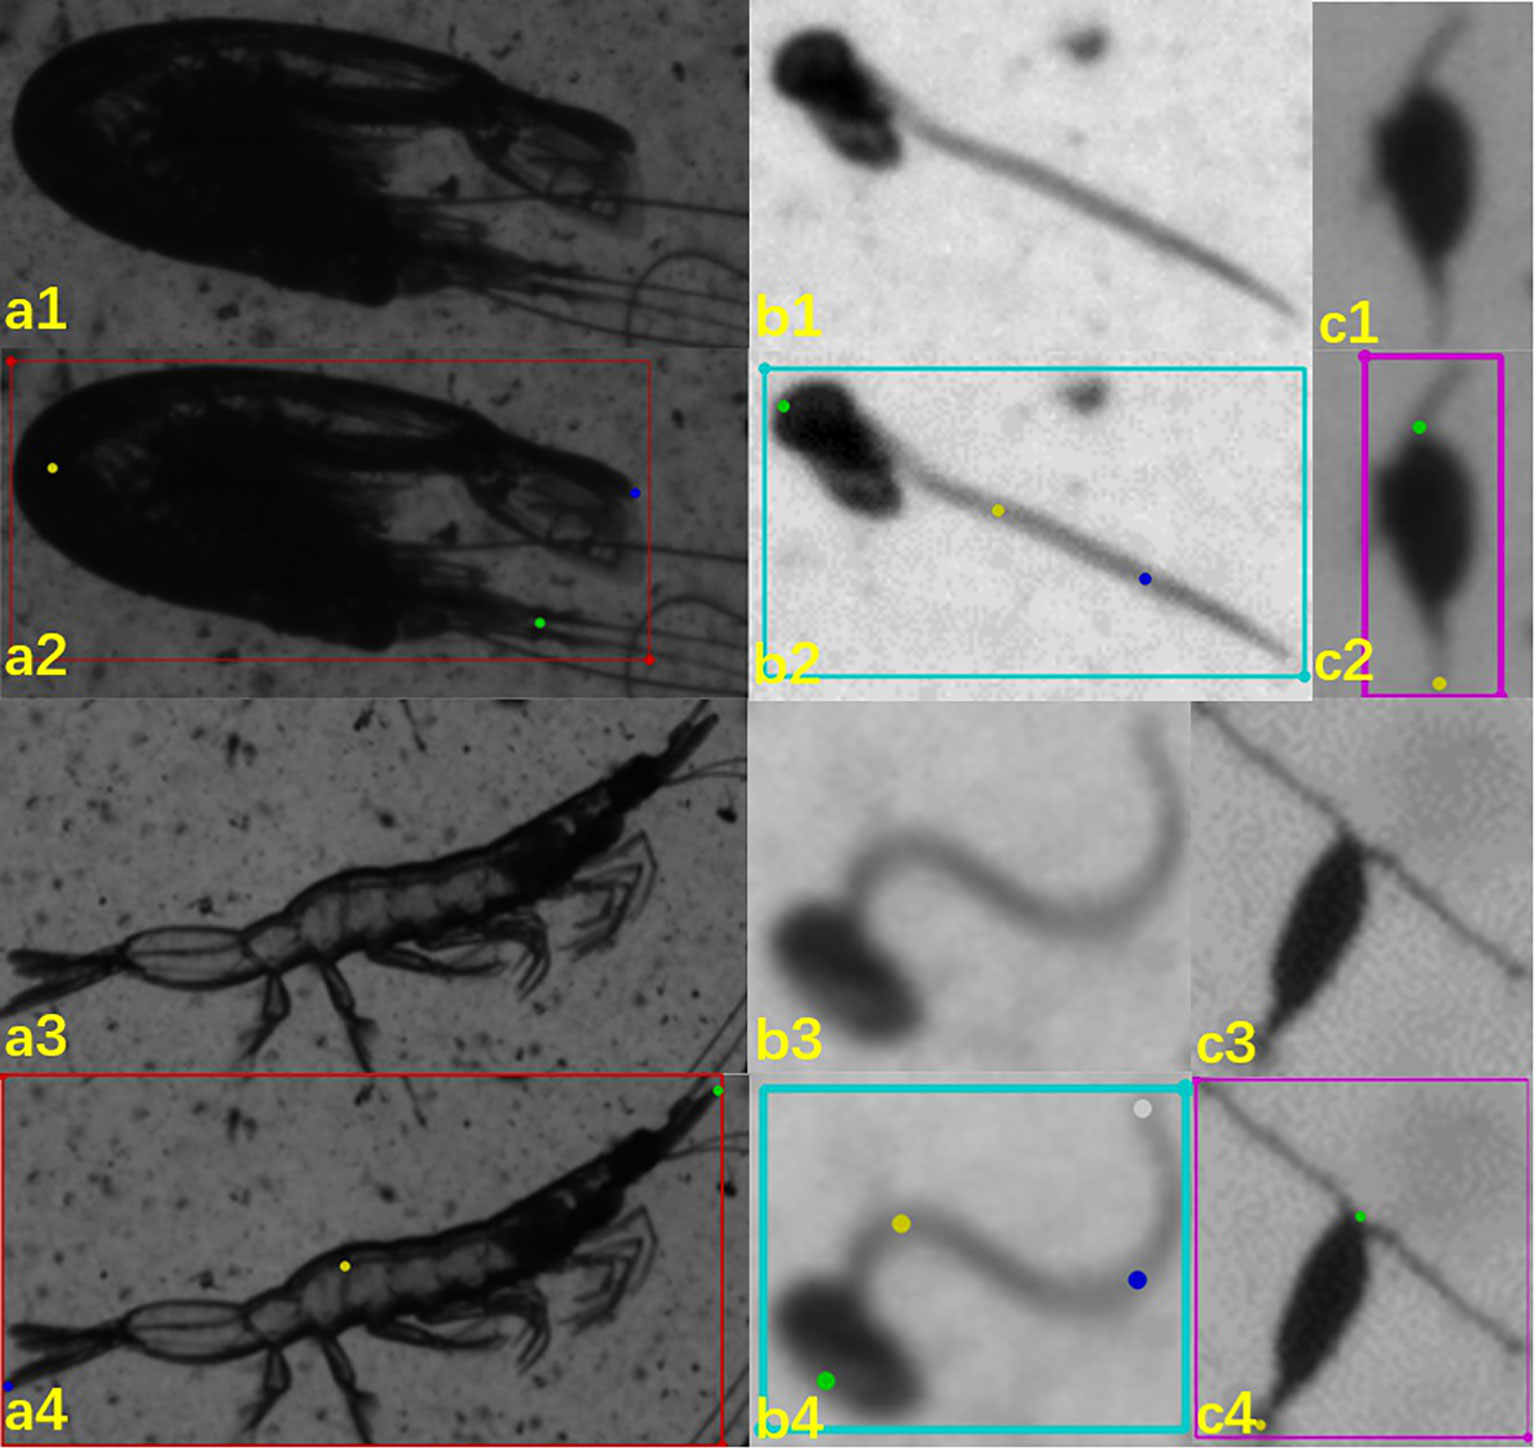
Figure 5 Illustration of three classes and their labeling: a. mysid-like shrimps, b. appendicularian, c. copepods. First row (a1 – c1) rare mode for the three targeted classes; second row (a2 – c2) the corresponding labeling map; third row (a3 – c3) common mode for the three targeted classes; and fourth row (a4 – c4) the corresponding labeling map.
For mysid-like shrimps, we first located each target with a rectangular bounding box and labeled it “Shrimp.” The length of these shrimps can be approximated by two straight-line segments, one from the head to the mid-point of the curve and another from this mid-point to the tail end. The key points—head, abdomen, and tail—were marked with “0,” “1,” and “2,” respectively. The abdomen’s position, being the principal inflection point of the curve, was chosen as a key point, thus capturing both straight and curved body shapes.
In the case of appendicularians, after examining numerous images, we observed that their bodies often exhibit two curves. Consequently, we selected four key points for this class: head, the first inflection point, the second inflection point, and the tail end, marked as “0,” “1,” “2,” and “3,” respectively. Each appendicularian was first enclosed in a rectangular bounding box and labeled “Appendicularia.”
In our study, we adopted a method developed by Microsoft Research Asia for transforming key points into heat maps (Qiu et al., 2019). This involves converting key points into Gaussian heat maps using two-dimensional Gaussian functions. For instance, with an input image resolution of 192x192 pixels, and key point coordinates at (96,96), the heat map size is typically set to a quarter of the input image’s size, resulting in a 48x48 heat map (Yuen and Trivedi, 2017). The corresponding coordinates on the heat map for the key points from the original image are (24,24). At this position in the heat map, we assign the highest probability value of 1, with surrounding values decreasing according to the Gaussian function (Zhang et al., 2020). The mathematical expression is as follows Equation 1:
where represents the standard deviation, represents the abscissa of the key point, and represents the ordinate of the key point. and are the horizontal and vertical coordinates of a point in the heat map.
Given that values decrease rapidly beyond the critical point of 3σ, approaching zero, we simplify calculations by only computing within a range around the key points, setting other coordinates in the heat map to zero. For instance, if is set to 2, the calculated region is a area (169 coordinate points) centered on the key point. The key point itself holds the maximum value of 1, while the values for the remaining 168 coordinate points are determined using the formula stated above.
For our study, we chose ResNet50 as the primary network for feature extraction from images, modifying it by replacing its final fully connected layer with a convolution layer. This alteration enables the model to generate predictive heat maps. ResNet, a type of residual network (He et al., 2016), is an advancement over the VGG19 network (Simonyan and Zisserman, 2014). It incorporates residual units through a short-circuit mechanism to address the degradation problem often encountered in deep networks.
Given that our images predominantly feature a single target without the symmetry seen in human faces or bones, our focus was on key nodes on the backbone of the target. Consequently, the process of target boundary frame positioning was deemed unnecessary. We utilized the Adam optimization algorithm for model optimization (Kingma and Ba, 2015). The initial learning rate was set at 5e-4, with a total of 666 training rounds. The loss was computed using the mean square error function. To adjust the learning rate, a linear warm-up method at a rate of 0.001 was implemented. The learning rate reached its maximum after 500 iterations and was subsequently reduced by a factor of 10 at epochs 120 and 180. This approach ensures that the model starts with a small learning rate to stabilize initial learning, then shifts to a larger pre-set rate for faster convergence. Towards the end of the training, the learning rate was reduced twice, each time to 10% of its current value, allowing for a more precise approximation of the optimal solution. Further details on this approach, see He et al. (2016).
We implemented the integration of key point heatmaps with ResNet50 using MMPose (MMPose Contributor, 2020), an open-source toolbox designed for pose estimation, based on the PyTorch framework (Paszke et al., 2019). For better visualization, we replaced the original grayscale images with pseudo-color images as described in Figure 6. Initially, the 300 copepod individuals labeled using Labelme, along with their respective annotation files, were divided into a training set and a validation set at a ratio of 19:1. These sets were then formatted into the COCO format, a standard data type supported by MMPose.
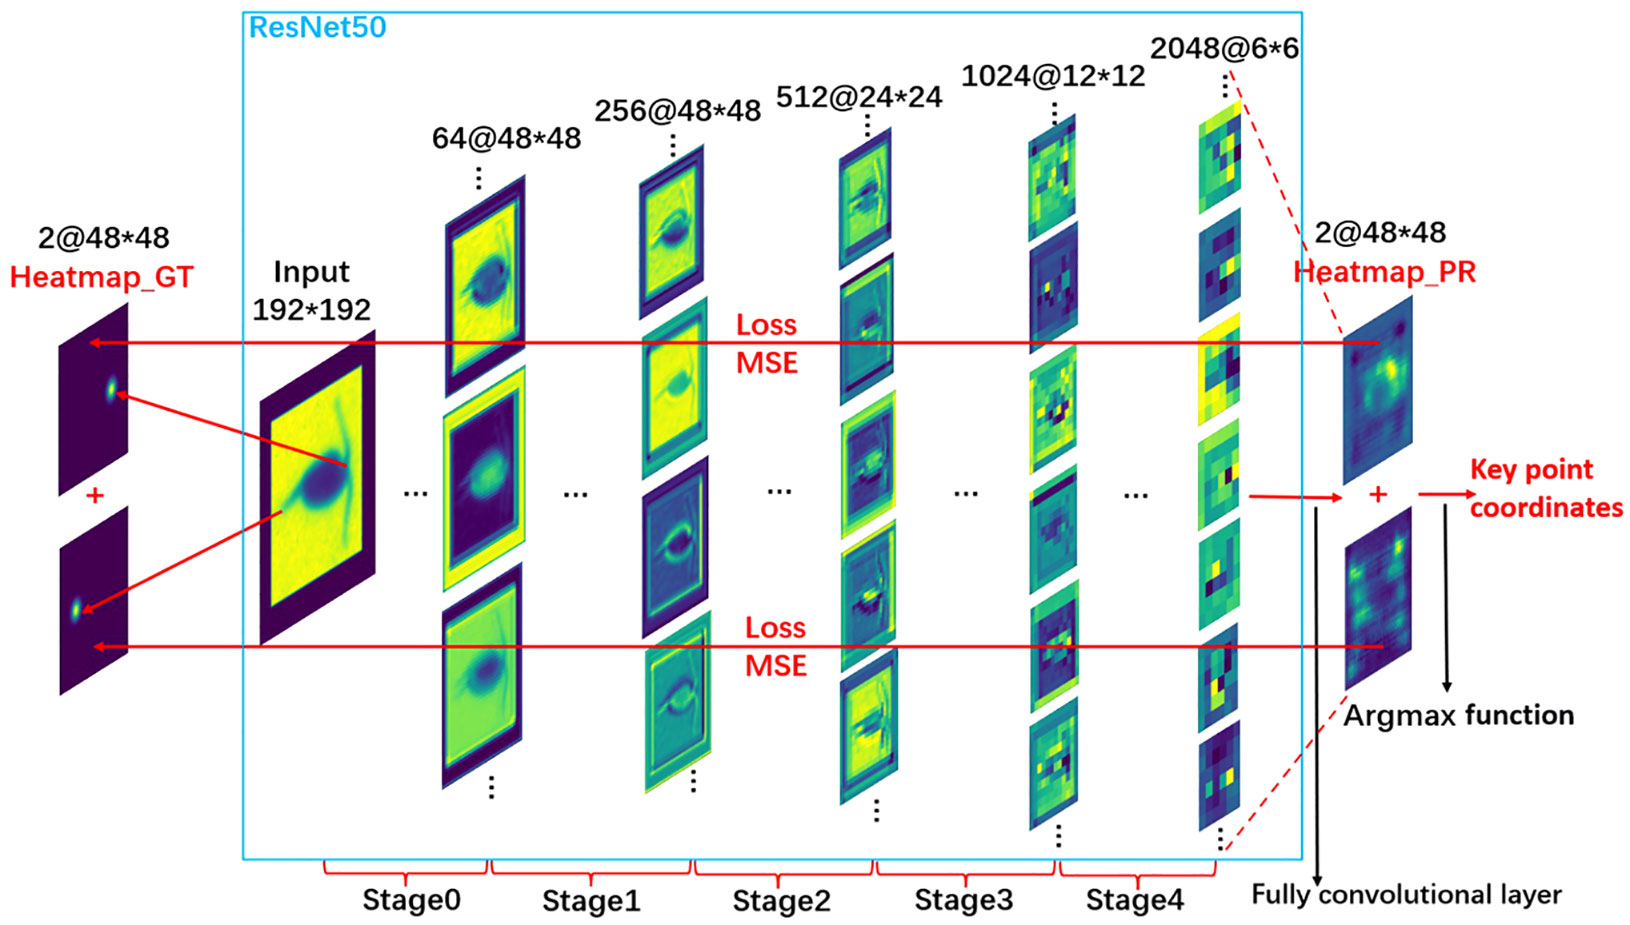
Figure 6 Description of the key point detection model training process. This figure illustrates the steps involved in training the model specifically for copepod size measurement.
The coordinates of the key points were encoded into a Gaussian heat map of 48x48 resolution using a two-dimensional Gaussian function, as described in Qiu et al. (2019). This heat map served as the ground truth data for calculating losses in the predicted heat map output from the ResNet50 backbone network. After inputting the images into the ResNet50 network, it sequentially extracted both shallow and deep feature information from the images. We modified the ResNet50 network by replacing its last fully connected layer with a full convolutional layer, enabling it to output a forecast heat map with a resolution of 48x48. The initial parameters of the model were based on the pre-trained ImageNet parameters (Deng et al., 2009), and adjustments were made as needed. The difference between the ground truth values and the predicted values was quantified using the mean square error (MSE).
Once the model generates the predictive heat map, we use the argmax function to decode this map and pinpoint the coordinates of the key points. Essentially, the argmax function identifies the point with the maximum value in the predictive heat map, which we designate as the key point. These coordinates are then translated back to the original image’s scale, allowing us to accurately determine the final positions of the key points. Using these coordinates, we can calculate the length of the observed organism.
We conducted manual measurements of body lengths on selected images using ImageJ (Schneider et al., 2012), an image processing software developed by the National Institutes of Health. This Java-based software is capable of various image manipulations, including scaling, rotating, distorting, and blurring. It also calculates a range of geometric features within a selected area, such as length, angle, circumference, area, and the dimensions of the longest and shortest axes.
The images used in our study are relatively small, each containing a single organism extracted from high-resolution plankton images with a resolution of 2180x1635 pixels (corresponding to an actual size of 5.7 cm x 4.28 cm). Given that copepods are quite small, occupying only a few pixels (approximately 30x50 pixels in size), there is a potential for observational errors when using ImageJ to visually determine the points on the head and tail of copepods. To mitigate this, we performed three separate measurements for each individual organism and calculated the average value. This mean value was then used as the manual measurement benchmark and was compared with the results obtained from the automated measurement procedure.
The pre-classification model, employing ShuffleNet, achieved remarkable accuracy, nearing 100% after training, with the model’s loss value rapidly decreasing to below 0.20 (as illustrated in Figure 7). The confusion matrix further reinforced the model’s high accuracy. In a test comprising 300 copepod images, the model classified 41 individuals as unsuitable and 259 as suitable for size measurement (refer to Figure 8). Upon visual inspection, it was observed that 6 individuals within the unsuitable group were suitable for size measurement, and conversely, 3 in the suitable group were unsuitable. The model demonstrated a true positive rate of 98.84%, a true negative rate of 1.16%, a false positive rate of 85.37%, and a false negative rate of 14.63%. Overall, the accuracy of the model stood at 97%.
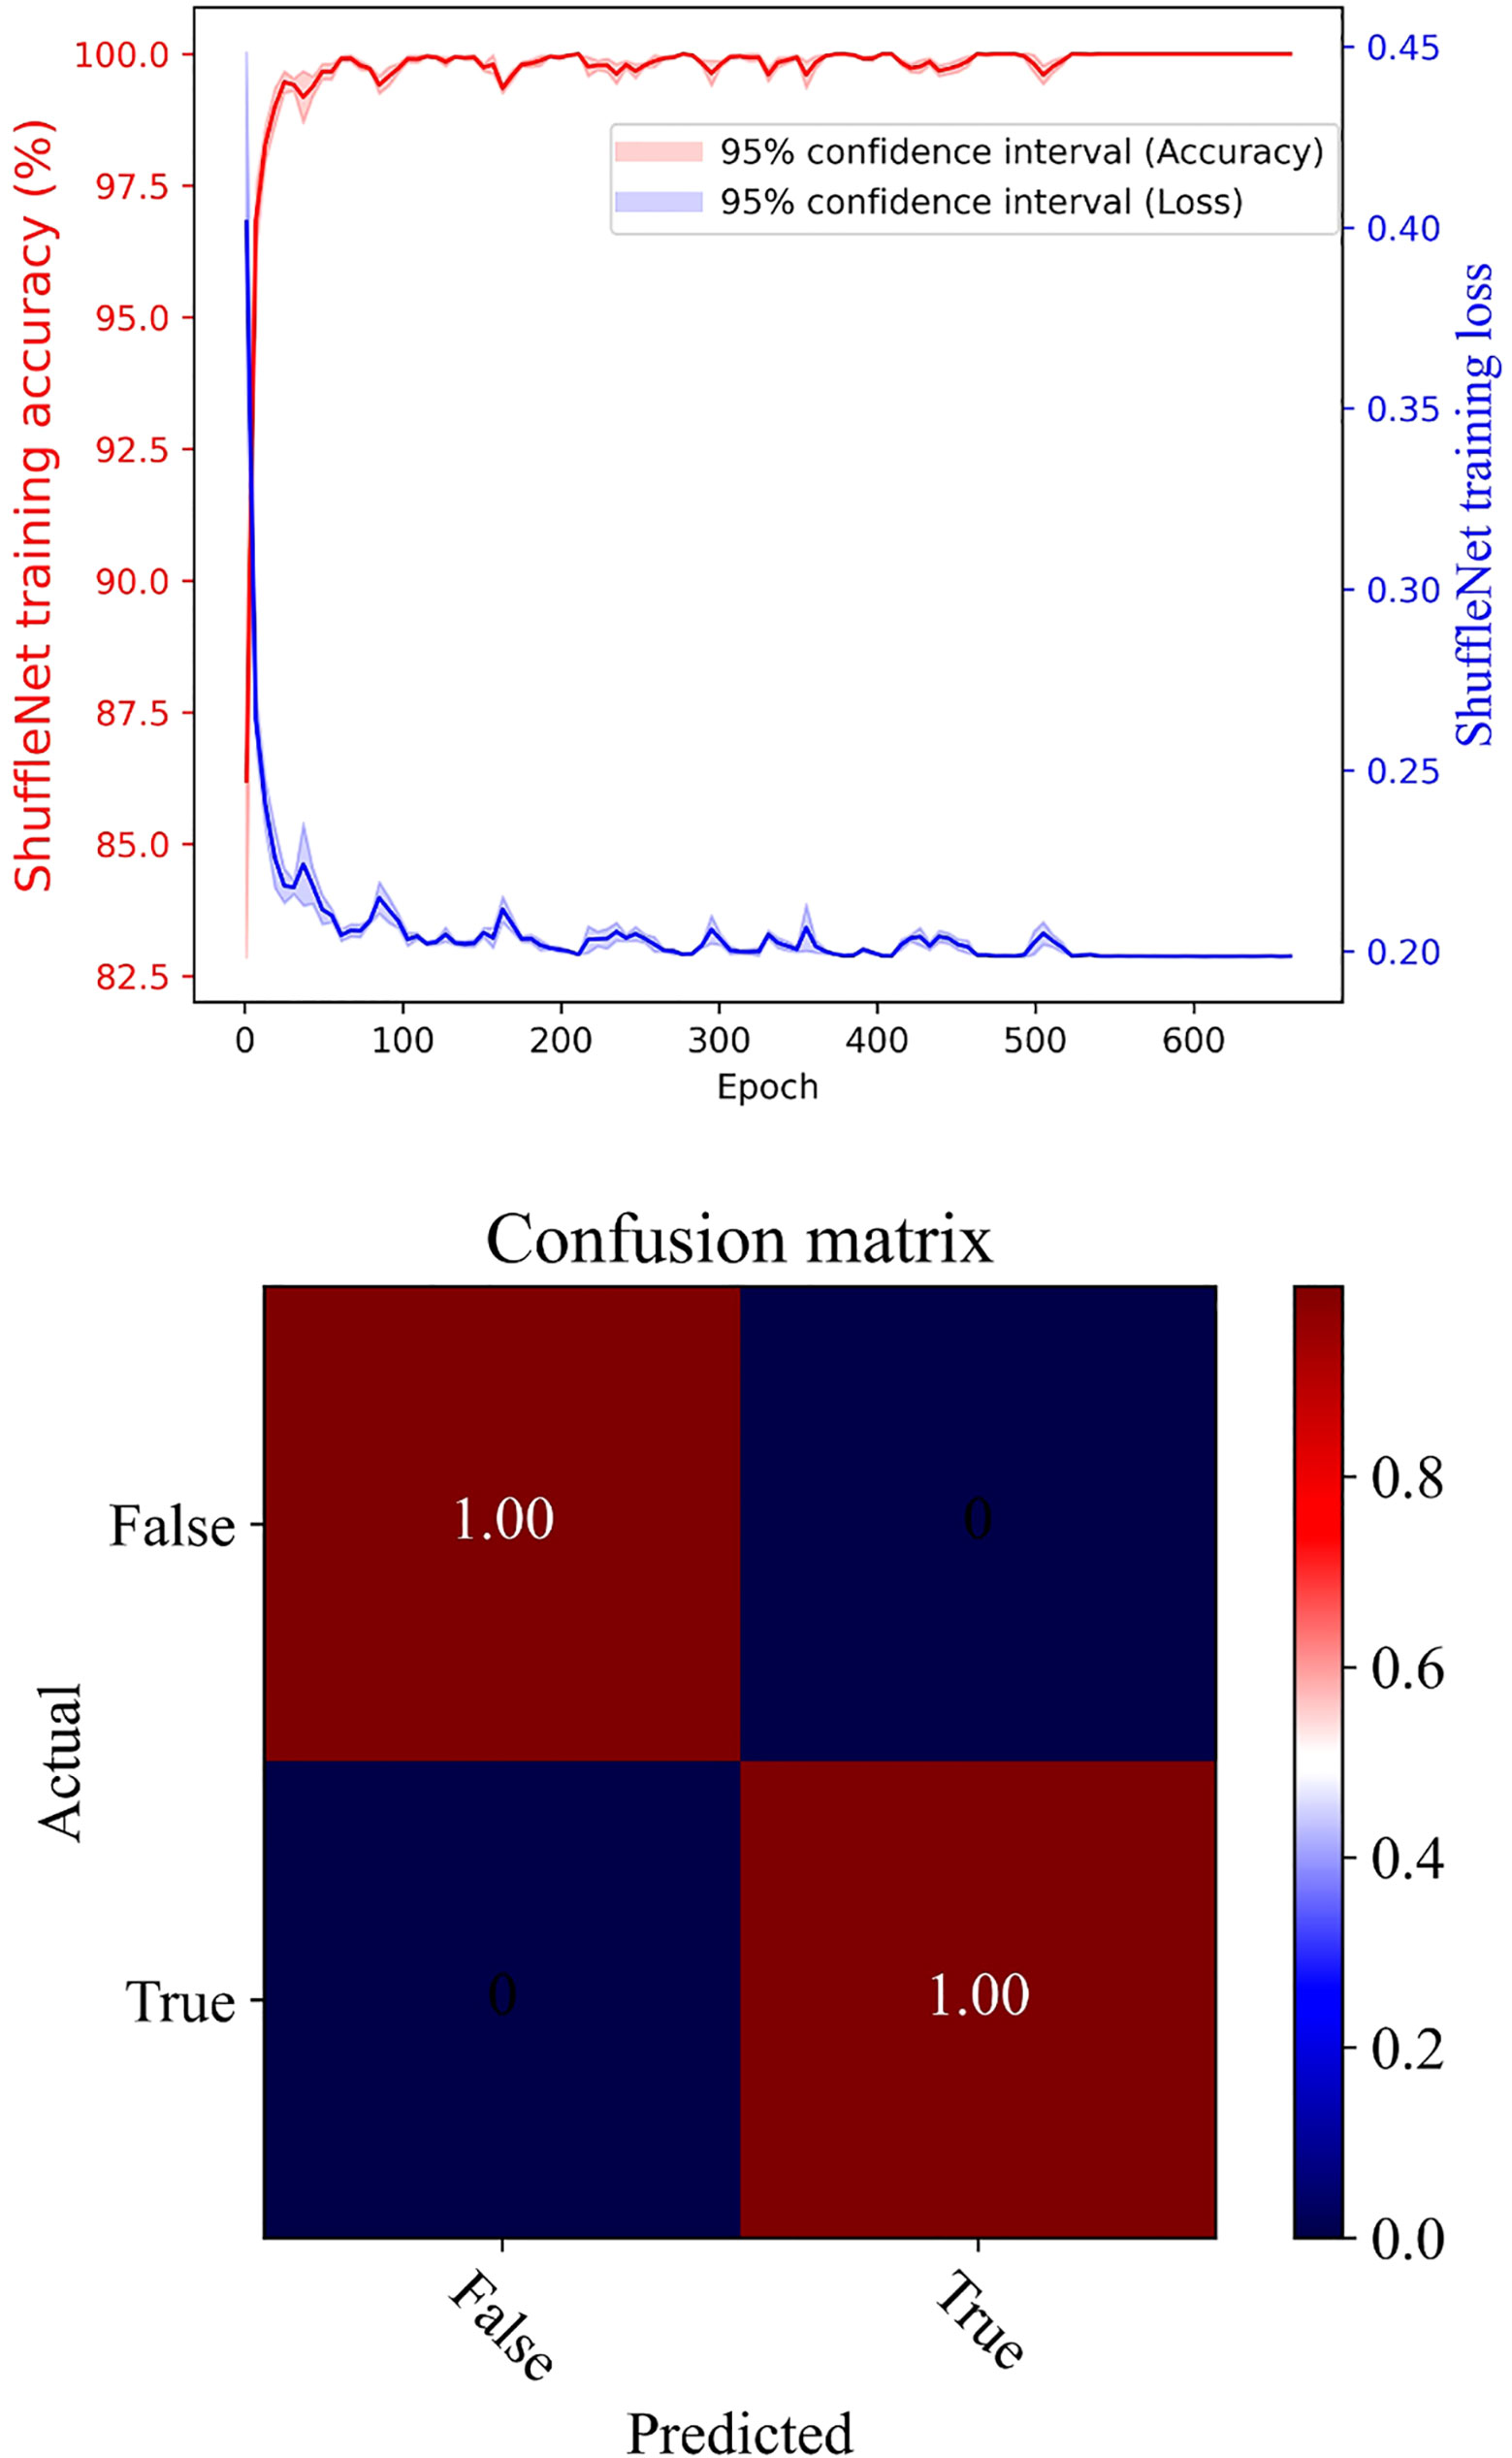
Figure 7 Pre-classification model using ShuffleNet: upper panel for training accuracy and loss, and lower panel for confusion matrix.
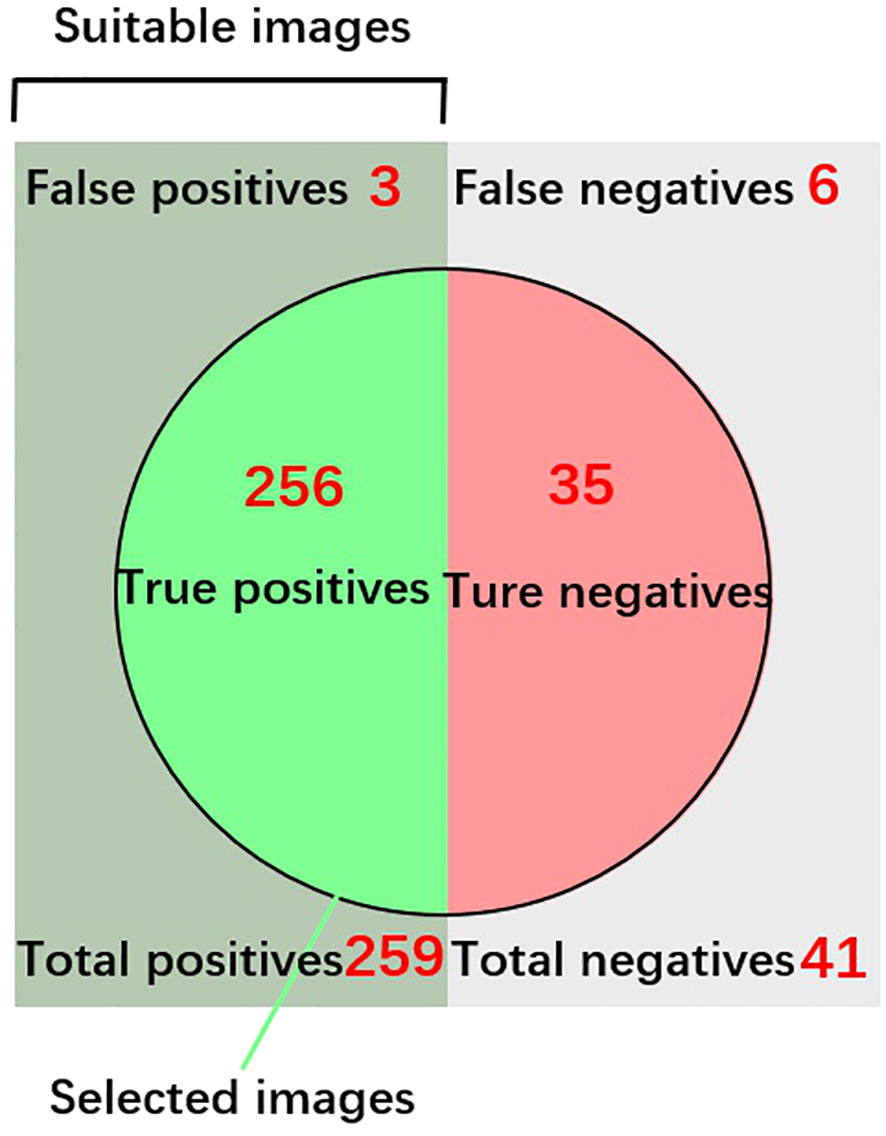
Figure 8 Testing Results of the Pre-Classification Model for the Copepod Class. The accuracy of the model was calculated using the formula: (True positives 256 + True negatives 35)/Total predictions (300). Images categorized as “True Positives” were further utilized for size measurement analysis.
The accuracy of the key point detection models for copepods, mysid-like shrimps, and appendicularians was 97.37%, 97.36%, and 95.63%, respectively, as depicted in Figure 9. For all three classes, the loss values were less than 0.001. A comparison of the body size measurements for 300 testing individuals in each class, obtained through the automated procedure and manual measurements using ImageJ, showed high consistency across all three classes (see Figure 10). The discrepancies between the automated and manual measurements were 1.11% for copepods, 1.78% for mysid-like shrimps, and 2.64% for appendicularians. The average difference across the three classes was 1.84%.
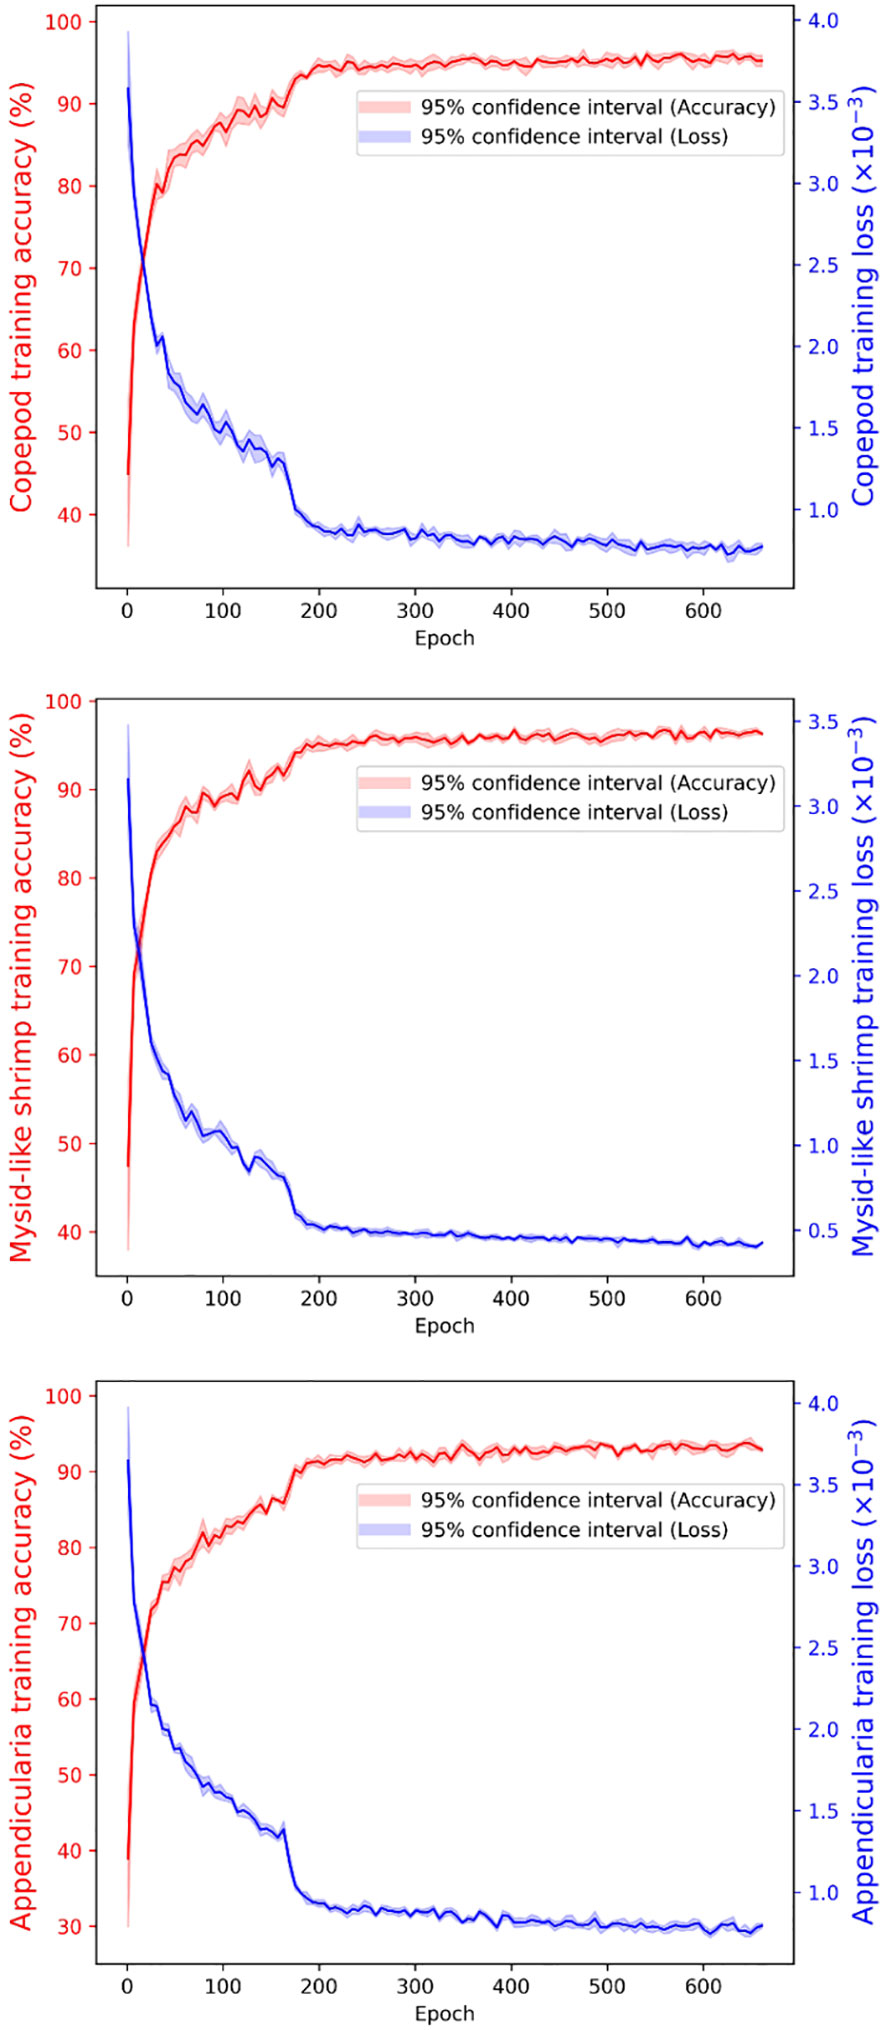
Figure 9 Training Accuracy and Loss Over Time. The top panel displays the training accuracy and loss for copepods, the middle panel for mysid-like shrimp, and the bottom panel for appendicularians.
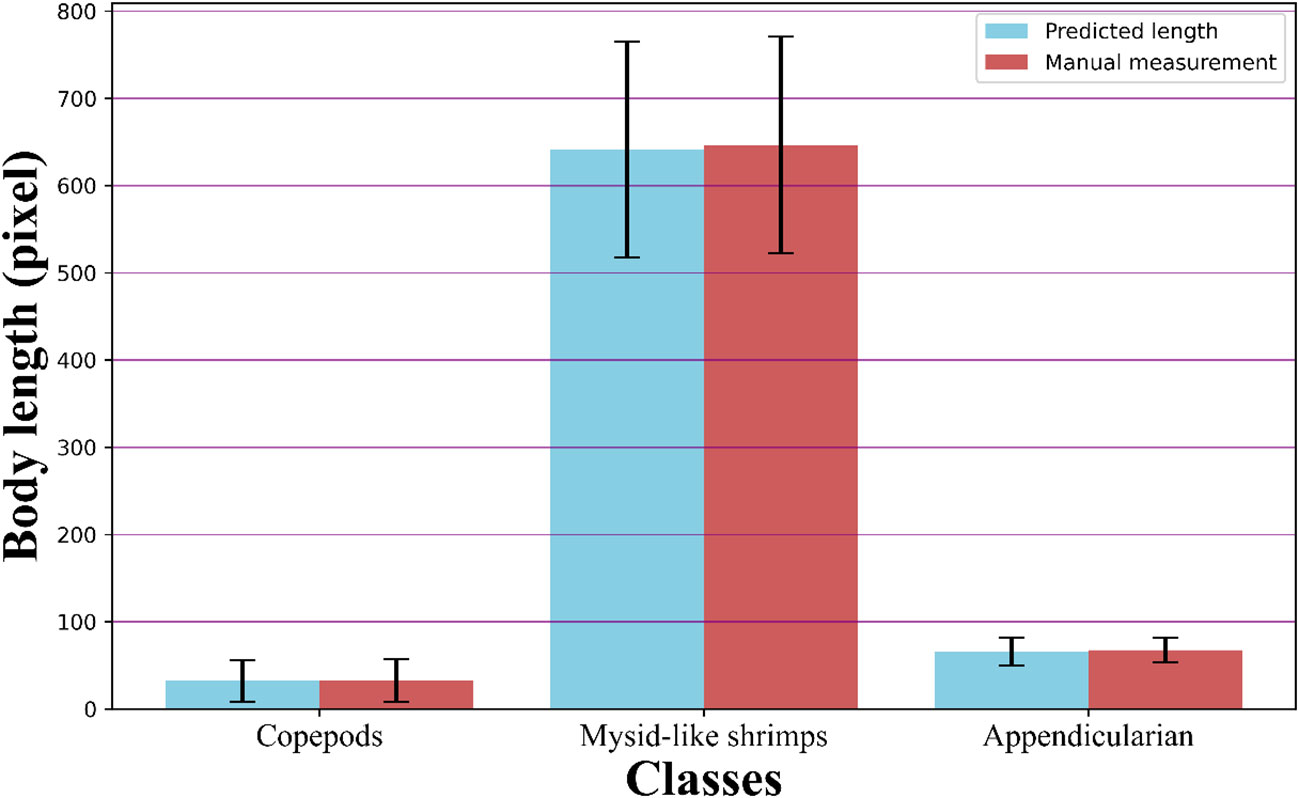
Figure 10 Comparative analysis of size measurements. This figure compares the results from the automated procedure with manual measurements conducted in ImageJ for three classes: copepods, mysid-like shrimps, and appendicularians.
Key point detection is a powerful computer vision technique for identifying key object parts on a 2-D or 3-D surface with high repeatability in different range images (Mian et al., 2008). It defines spatial locations or points that stand out in an image, like distinctive parts or key points of an object. The proposed automated procedure is robust key point detection-based approach. Our results demonstrated that it could measure individual plankton size rapidly and accurately for three plankton groups from a single straight-line approximation to multi-segments of straight-line approximation. The method is readily applicable for other groups like jellyfish, chaetognaths, pteropods, etc.
Key point detection, much like other deep learning processes, significantly benefits from having a substantial library of accurately labeled images, which serve as a foundation for training and improving the accuracy of the model. However, the current study implemented a unique approach by incorporating a pre-classification procedure, specifically tailored to select copepods that are suitable for size measurement. This selective approach effectively narrowed down the model’s domain, focusing solely on the most relevant data set for our specific measurement needs. As a result, even with a comparatively modest-sized library of images, the model was able to achieve commendable results. This strategy underscores the importance of targeted data selection in deep learning, demonstrating that the quality and relevance of the training data can be as crucial as its quantity in achieving high levels of accuracy and efficiency in specific applications like size measurement in marine biology.
The proposed approach in our study could see significant advancements with the integration of more sophisticated network architectures and heat map decoding techniques, such as the Differentiable Spatial to Numerical Transform (DSNT) network (Nibali et al., 2018). The current full-join method employed has a limited capacity for spatial generalization and is prone to overfitting. Additionally, the heat map approach, while effective, often underperforms with low-resolution images, as noted by Chi et al. (2023). Unlike the heat map method, which is not fully differentiable, the DSNT network directly supervises the heatmap and can generate a heatmap probability distribution using the softmax function, which allows for the backpropagation of optimization parameters, enhancing the accuracy and efficiency of the model. Such an upgrade to the DSNT network would address the current limitations, particularly in spatial generalization and low-resolution image processing, thereby improving the overall effectiveness of the model in key point detection and size measurement.
The benefits of the automated procedure developed in our study are clear and significant. Firstly, it boasts remarkable speed, capable of processing over 60 individuals per second, vastly outpacing manual methods. Secondly, the accuracy of this automated technique is impressively high, with discrepancies from manual measurements averaging at approximately 1.84%. This level of precision is crucial for reliable data analysis. Thirdly, our method demonstrates robustness, delivering consistent and accurate measurements across a diverse array of plankton, captured under varying imaging conditions. Coupled with advancements in plankton imaging technology and deep learning systems, this automated approach paves the way for rapid, large-scale measurements of plankton size. Such efficiency and precision are instrumental in enhancing our understanding of the population dynamics of key marine species, as well as the broader structure and functioning of marine ecosystems. Overall, the integration of these technological advancements represents a significant leap forward in marine biology research.
The raw data supporting the conclusions of this article will be made available by the authors, without undue reservation.
The manuscript presents research on animals that do not require ethical approval for their study.
WZ: Investigation, Methodology, Software, Validation, Writing – original draft, Formal analysis, Visualization. HB: Conceptualization, Data curation, Investigation, Methodology, Project administration, Resources, Software, Supervision, Validation, Writing – original draft, Writing – review & editing, Formal analysis, Visualization. DW: Investigation, Methodology, Software, Validation, Writing – original draft. XC: Methodology, Funding acquisition, Resources, Writing – review & editing. ZC: Funding acquisition, Resources, Conceptualization, Project administration, Supervision, Writing – original draft. KY: Conceptualization, Funding acquisition, Methodology, Project administration, Resources, Supervision, Writing – original draft.
The author(s) declare financial support was received for the research, authorship, and/or publication of this article. WZ, DW, XC, ZC and KY were supported by the Shenzhen Science and Technology Innovation Committee, project number KCXFZ202110201633557022.
Authors DW and KY are employed by the Shenzhen Oasis Photobio Tech Ltd.
The remaining authors declare that the research was conducted in the absence of any commercial or financial relationships that could be construed as a potential conflict of interest.
All claims expressed in this article are solely those of the authors and do not necessarily represent those of their affiliated organizations, or those of the publisher, the editors and the reviewers. Any product that may be evaluated in this article, or claim that may be made by its manufacturer, is not guaranteed or endorsed by the publisher.
Alvarez E., Moyano M., Lopez-Urrutia A., Nogueira E., Scharek R. (2014). Routine determination of plankton community composition and size structure: a comparison between FlowCAM and light microscopy. J. Plankton Res. 36, 170–184. doi: 10.1093/plankt/fbt069
An L., Yang S., Bhanu B. (2015). Efficient smile detection by Extreme Learning Machine. Neurocomputing 149, 354–363. doi: 10.1016/j.neucom.2014.04.072
Bai S., Han F. (2020). Tourist behavior recognition through scenic spot image retrieval based on image processing. Traitement Du Signal 37, 619–626. doi: 10.18280/ts.370410
Behera A., Keidel A. H., Ieee (2018). “Latent body-pose guided denseNet for recognizing driver’s fine-grained secondary activities,” in IEEE International Conference on Advanced Video and Signal Based Surveillance (AVSS), Auckland, New Zealand. 1–6. doi: 10.1109/AVSS.2018.8639158
Benfield M. C., Grosjean P., Culverhouse P. F., Irigoien X., Sieracki M. E., Lopez-Urrutia A., et al. (2007). RAPID research on automated plankton identification. Oceanography 20, 172–187. doi: 10.5670/oceanog.2007.63
Bi H., Cheng Y., Cheng X., Benfield M. C., Kimmel D. G., Zheng H., et al. (2024). Taming the data deluge: A novel end-to-end deep learning system for classifying marine biological and environmental images. Limonlogy and oceanograph: Methods 22, 47–64. doi: 10.1002/lom3.10591
Bi H., Cook S., Yu H., Benfield M. C., Houde E. D. (2012). Deployment of an imaging system to investigate fine-scale spatial distribution of early life stages of the ctenophore Mnemiopsis leidyi in Chesapeake Bay. J. Plankton Res. 35, 270–280. doi: 10.1093/plankt/fbs094
Bi H., Peterson W. T., Strub P. T. (2011). Transport and coastal zooplankton communities in the northern California Current system. Geophysical Res. Lett. 38, L12607. doi: 10.1029/2011GL047927
Bi H., Song J., Zhao J., Liu H., Cheng X., Wang L., et al. (2022). Temporal characteristics of plankton indicators in coastal waters: High-frequency data from PlanktonScope. J. Sea Res. 189, 102283. doi: 10.1016/j.seares.2022.102283
Brandão M. C., Benedetti F., Martini S., Soviadan Y. D., Irisson J.-O., Romagnan J.-B., et al. (2021). Macroscale patterns of oceanic zooplankton composition and size structure. Sci. Rep. 11, 15714. doi: 10.1038/s41598-021-94615-5
Campbell R. W., Roberts P. L., Jaffe J. (2020). The Prince William Sound Plankton Camera: a profiling in situ observatory of plankton and particulates. ICES J. Mar. Sci. 77, 1440–1455. doi: 10.1093/icesjms/fsaa029
Castonguay M., Plourde S., Robert D., Runge J. A., Fortier L. (2008). Copepod production drives recruitment in a marine fish. Can. J. Fisheries Aquat. Sci. 65, 1528–1531. doi: 10.1139/F08-126
Caswell H., Twombly S. (1989). “Estimation of stage—Specific demographic parameters for zooplankton populations: methods based on stage—Classified matrix projection models,” in McDonald L.L., Manly B.F.J., Lockwood J.A., Logan J.A. (eds) Estimation and Analysis of Insect Populations. Lecture Notes in Statistics, vol 55. New York, NY: Springer. doi: 10.1007/978-1-4612-3664-1_4
Cheng K., Cheng X., Wang Y., Bi H., Benfield M. C. (2019). Enhanced convolutional neural network for plankton identification and enumeration. PloS One 14, e0219570. doi: 10.1371/journal.pone.0219570
Chi C., Zhang D., Zhu Z., Wang X., Lee D.-J. (2023). Human pose estimation for low-resolution image using 1-D heatmaps and offset regression. Multimedia Tools Appl. 82, 6289–6307. doi: 10.1007/s11042-022-13468-w
Contributor M. (2020) OpenMMLab pose estimation toolbox and benchmark. Available at: https://github.com/open-mmlab/mmpose.
Culverhouse P. F., Williams R., Reguera B., Herry V., Gonzalez-Gil S. (2003). Do experts make mistakes? A comparison of human and machine identification of dinoflagellates. Mar. Ecol. Prog. Ser. 247, 17–25. doi: 10.3354/meps247017
Dam H. G., Baumann H. (2017). “Climate change, Zooplankton and Fisheries,” in Phillips B. F., Pérez-Ramírez M. (Eds) Climate Change Impacts on Fisheries and Aquaculture, Vol. I, John Wiley & Sons, Inc., Hoboken, Nj 07030, USA. 851–874.
Deng J., Dong W., Socher R., Li L. J., Li K., Li F. F., et al. (2009). “ImageNet: A large-scale hierarchical image database,” in IEEE Conference on Computer Vision and Pattern Recognition, IEEE, Miami, FL, USA. 248–255. doi: 10.1109/CVPR.2009.5206848
De Robertis A., Jaffe J. S., Ohman M. D. (2000). Size-dependent visual predation risk and the timing of vertical migration in zooplankton. Limnol. Oceanogr. 45, 1838–1844. doi: 10.4319/lo.2000.45.8.1838
Edvardsen A., Zhou M., Tande K. S., Zhu Y. W. (2002). Zooplankton population dynamics: measuring in situ growth and mortality rates using an Optical Plankton Counter. Mar. Ecol. Prog. Ser. 227, 205–219. doi: 10.3354/meps227205
Eltanany A. S., Elwan M. S., Amein A. S. (2019). “Key point detection techniques,” in Hassanien A., Shaalan K., Tolba M. (eds) Proceedings of the International Conference on Advanced Intelligent Systems and Informatics 2019. AISI 2019. Advances in Intelligent Systems and Computing, vol 1058. Springer, Cham. doi: 10.1007/978-3-030-31129-2_82
Frederiksen M., Edwards M., Richardson A. J., Halliday N. C., Wanless S. (2006). From plankton to top predators: bottom-up control of a marine food web across four trophic levels. J. Anim. Ecol. 75, 1259–1268. doi: 10.1111/j.1365-2656.2006.01148.x
Gorsky G., Ohman M. D., Picheral M., Gasparini S., Stemmann L., Romagnan J.-B., et al. (2010). Digital zooplankton image analysis using the ZooScan integrated system. J. Plankton Res. 32, 285–303. doi: 10.1093/plankt/fbp124
He K., Zhang X., Ren S., Sun J., Ieee (2016). “Deep residual learning for image recognition,” in Proceedings of the IEEE conference on computer vision and pattern recognition (CVPR), IEEE, Las Vegas NV, USA. pp. 770–778. doi: 10.48550/arXiv.1512.03385
Herman A. W. (1992). Design and calibration of a new optical plankton counter capable of sizing small zooplankton. Deep Sea Res. Part A. Oceanographic Res. Papers 39, 395–415. doi: 10.1016/0198-0149(92)90080-D
Hernandez-Leon S., Montero I. (2006). Zooplankton biomass estimated from digitalized images in Antarctic waters: A calibration exercise. J. Geophysical Research-Oceans 111, C05S03. doi: 10.1029/2005JC002887
Hooff R. C., Peterson W. T. (2006). Copepod biodiversity as an indicator of changes in ocean and climate conditions of the northern California current ecosystem. Limnol. Oceanogr. 51, 2607–2620. doi: 10.4319/lo.2006.51.6.2607
Hunt G. L. Jr., Coyle K. O., Eisner L. B., Farley E. V., Heintz R. A., Mueter F., et al. (2011). Climate impacts on eastern Bering Sea foodwebs: a synthesis of new data and an assessment of the Oscillating Control Hypothesis. ICES J. Mar. Sci. 68, 1230–1243. doi: 10.1093/icesjms/fsr036
Ikeda T. (1985). Metabolic rates of epipelagic marine zooplankton as a function of body mass and temperature. Mar. Biol. 85, 1–11. doi: 10.1007/BF00396409
Jalal A., Akhtar I., Kim K. (2020). Human posture estimation and sustainable events classification via pseudo-2D stick model and K-ary tree hashing. Sustainability 12, 9814. doi: 10.3390/su12239814
Ju Z., Wang Y., Zeng W., Cai H., Liu H., Ieee (2014). “A modified EM algorithm for hand gesture segmentation in RGB-D data,” in IEEE International Conference on Fuzzy Systems (FUZZ-IEEE), IEEE, Beijing, China, pp. 736–1742. doi: 10.1109/FUZZ-IEEE.2014.6891777
Kai C., Jiaqi W., Jiangmiao P., Yuhang C., Yu X., Xiaoxiao L., et al. (2019). MMDetection: open MMLab detection toolbox and benchmark. Preprint, arXiv. doi: 10.48550/arXiv.1906.07155
Kingma D. P., Ba J. (2014). “Adam: A method for stochastic optimization,” in Proceedings of International Conference for Learning Representation. San Diego, USA. doi: 10.48550/arXiv.1412.6980
Kydd J., Rajakaruna H., Briski E., Bailey S. (2018). Examination of a high resolution laser optical plankton counter and FlowCAM for measuring plankton concentration and size. J. Sea Res. 133, 2–10. doi: 10.1016/j.seares.2017.01.003
Liu D., Ying K., Cai Z., Huang H., Bi H. (2021). Outburst of Creseis acicula in southwest Daya Bay in July 2020. Oceanol. Limnol. Sin. 52, 1438–1447. doi: 10.11693/hyhz20210400086
Mian A. S., Bennamoun M., Owens R. (2008). Keypoint detection and local feature matching for textured 3D face recognition. Int. J. Comput. Vision 79, 1–12. doi: 10.1007/s11263-007-0085-5
Moustaka-Gouni M., Sommer U. (2020). Effects of harmful blooms of large-sized and colonial cyanobacteria on aquatic food webs. Water 12, 1587. doi: 10.3390/w12061587
Mullin J. W., Ang H. M. (1974). Crystal size measurement - comparision of techniques of sieving and Coulter counter. Powder Technol. 10, 153–156. doi: 10.1016/0032-5910(74)80040-9
Nibali A., He Z., Morgan S., Prendergast L. (2018). Numerical coordinate regression with convolutional neural networks. arXiv preprint arXiv:1801.07372.
Paszke A., Gross S., Massa F., Lerer A., Bradbury J., Chanan G., et al. (2019). “PyTorch: an imperative style, high-performance deep learning library,” in Wallacch H., Larochelle H., Beygelzimer A., d' Alché-Buc F., Fox E., Garnett R. (Eds) Advances in neural information processing systems. Curran Associates, Inc. Vol. 32. pp 8024–8035.
Perretti C. T., Fogarty M. J., Friedland K. D., Hare J. A., Lucey S. M., Mcbride R. S., et al. (2017). Regime shifts in fish recruitment on the Northeast US Continental Shelf. Mar. Ecol. Prog. Ser. 574, 1–11. doi: 10.3354/meps12183
Pitois S. G., Graves C. A., Close H., Lynam C., Scott J., Tilbury J., et al. (2021). A first approach to build and test the copepod mean size and total abundance (CMSTA) ecological indicator using in-situ size measurements from the Plankton Imager (PI). Ecol. Indic. 123, 107307. doi: 10.1016/j.ecolind.2020.107307
Qiu H., Wang C., Wang J., Wang N., Zeng W. (2019). “Cross view fusion for 3d human pose estimation,” in Proceedings of the IEEE/CVF international conference on computer vision. IEEE, Seoul, Korea. pp. 4342–4351.
Remsen A., Hopkins T. L., Samson S. (2004). What you see is not what you catch: a comparison of concurrently collected net, Optical Plankton Counter, and Shadowed Image Particle Profiling Evaluation Recorder data from the northeast Gulf of Mexico. Deep-Sea Res. Part I-Oceanographic Res. Papers 51, 129–151. doi: 10.1016/j.dsr.2003.09.008
Richardson A. J. (2008). In hot water: zooplankton and climate change. ICES J. Mar. Sci. 65, 279–295. doi: 10.1093/icesjms/fsn028
Schmidhuber J. (2015). Deep learning in neural networks: An overview. Neural Networks 61, 85–117. doi: 10.1016/j.neunet.2014.09.003
Schneider C. A., Rasband W. S., Eliceiri K. W. (2012). NIH Image to ImageJ: 25 years of image analysis. Nat. Methods 9, 671–675. doi: 10.1038/nmeth.2089
Shaw C. T., Bi H., Feinberg L. R., Peterson W. T. (2021). Cohort analysis of Euphausia pacifica from the Northeast Pacific population using a Gaussian mixture model. Prog. Oceanogr. 191, 102495. doi: 10.1016/j.pocean.2020.102495
Simonyan K., Zisserman A. (2014). “Very deep convolutional networks for large-scale image recognition.” in Proceedings of the international conference on learning representation. San Diego, USA. doi: 10.48550/arXiv.1409.1556
Song J., Bi H., Cai Z., Cheng X., He Y., Benfield M. C., et al. (2020). Early warning of Noctiluca scintillans blooms using in-situ plankton imaging system: An example from Dapeng Bay, P.R. China. Ecol. Indic. 112, 106123. doi: 10.1016/j.ecolind.2020.106123
Sun X., Guo S., Liu M., Li H. (2021). Research progress on phytoplankton and zooplankton ecology in Indo-Pacific convergence region. Oceanologia Limnologia Sin. 52, 323–331. doi: 10.11693/hyhz20200900243
Vandromme P., Stemmann L., Garcìa-Comas C., Berline L., Sun X., Gorsky G. (2012). Assessing biases in computing size spectra of automatically classified zooplankton from imaging systems: A case study with the ZooScan integrated system. Methods Oceanogr. 1-2, 3–21. doi: 10.1016/j.mio.2012.06.001
Wada K. (2018). Labelme: image polygonal annotation with python. GitHub repository. https://github.com/labelmeai/labelme
Yang L., Sun Y., Zhang H., Li F., Zhang X. (2020). Human keypoint matching network based on encoding and decoding residuals. Comput. Sci. 47, 114–120. doi: 10.11896/jsjkx.200300079
Yuen K., Trivedi M. M. (2017). An occluded stacked hourglass approach to facial landmark localization and occlusion estimation. IEEE Trans. Intelligent Vehicles 2, 321–331. doi: 10.1109/TIV.2017.2772889
Zhang F., Zhu X., Dai H., Ye M., Zhu C. (2020). “Distribution-aware coordinate representation for human pose estimation,” in Proceedings of the IEEE/CVF conference on computer vision and pattern recognition (CVPR), 7093–7102. doi: 10.48550/arXiv.1910.06278
Keywords: zooplankton size, deep learning, key point detection, plankton image, PlanktonScope
Citation: Zhang W, Bi H, Wang D, Cheng X, Cai Z and Ying K (2024) Automated zooplankton size measurement using deep learning: Overcoming the limitations of traditional methods. Front. Mar. Sci. 11:1341191. doi: 10.3389/fmars.2024.1341191
Received: 20 November 2023; Accepted: 26 January 2024;
Published: 13 February 2024.
Edited by:
Huiyu Zhou, University of Leicester, United KingdomReviewed by:
Sophie G. Pitois, Centre for Environment, Fisheries and Aquaculture Science (CEFAS), United KingdomCopyright © 2024 Zhang, Bi, Wang, Cheng, Cai and Ying. This is an open-access article distributed under the terms of the Creative Commons Attribution License (CC BY). The use, distribution or reproduction in other forums is permitted, provided the original author(s) and the copyright owner(s) are credited and that the original publication in this journal is cited, in accordance with accepted academic practice. No use, distribution or reproduction is permitted which does not comply with these terms.
*Correspondence: Hongsheng Bi, aG9uZ3NoZW5nYmlAZ21haWwuY29t
Disclaimer: All claims expressed in this article are solely those of the authors and do not necessarily represent those of their affiliated organizations, or those of the publisher, the editors and the reviewers. Any product that may be evaluated in this article or claim that may be made by its manufacturer is not guaranteed or endorsed by the publisher.
Research integrity at Frontiers
Learn more about the work of our research integrity team to safeguard the quality of each article we publish.