 Biswamoy Paul
 Balaji Baduru1,3,4
94% of researchers rate our articles as excellent or good
Learn more about the work of our research integrity team to safeguard the quality of each article we publish.
Find out more
ORIGINAL RESEARCH article
Front. Mar. Sci., 13 March 2024
Sec. Ocean Observation
Volume 11 - 2024 | https://doi.org/10.3389/fmars.2024.1340129
This article is part of the Research TopicDemonstrating Observation Impacts for the Ocean and Coupled PredictionView all 18 articles
Introduction: Assimilating all available observations in numerical models may lead to deterioration of the analysis. Ensemble Forecast Sensitivity to Observations (EFSO) is a method that helps to identify all such observations which benefit the analyses. EFSO has never been tested in an ocean data assimilation system because of a lack of robust formulation of a squared norm against which beneficiality of observations can be estimated.
Methods: Here, we explore the efficacy of EFSO in the ocean data assimilation system that comprises the ocean model, Regional Ocean Modeling System (ROMS), coupled to the assimilation system Local Ensemble Transform Kalman Filter (LETKF), collectively called LETKF- ROMS, in the Bay of Bengal by envisaging a novel squared norm. The Bay of Bengal is known for its higher stratification and shallow mixed layer depth. In view of baroclinicity representing the stratification of the ocean, we use the modulus of the baroclinic vector as the squared norm to evaluate forecast errors in EFSO.
Results: Using this approach, we identify beneficial observations. Assimilating only the beneficial observations greatly improves the ocean state. We also show that the improvements are more pronounced in the head of the Bay of Bengal where stratification is much higher compared to the rest of the basin.
Discussion: Though this approach doesn’t degrade the ocean state in other regions of the Indian Ocean, a universal squared norm is needed that can be extended beyond the Bay of Bengal basin.
In this modern era of observation networks wherein the ocean is observed through a multitude of observation lenses consisting of Argo floats, buoys, ship tracks, satellite measurements and so on, it is imperative to ascertain if these observations add value to a data assimilation system used to forecast ocean states or generate reanalysis products used by the scientific community in their quest to understand the workings of oceans better. Naively feeding the data assimilation system with all available quality controlled observations may lead to a degradation or a non-optimal improvement (Balmaseda et al., 2007; Hamrud et al., 2015; Schraff et al., 2016; Hotta et al., 2017; Sivareddy et al., 2017; Waters et al., 2017). One of the methods to ascertain the beneficiality of observations in the ocean has been to let each observation pass through the observing system experiments (OSEs). This method, even though robust, consumes large computational resources primarily because it is a data denial experiment. It comprises two systems - a control run where some observations, whose beneficiality is to be determined, are withheld from feeding it to the data assimilation system and a test run where all observations are assimilated. A short run of these two systems do not produce statistically significant results because the improvements or degradations in the test run are obscured by the presence of other observations. As a result, a long run is needed to produce statistically significant results, thereby consuming large computational resources. In contrast, ensemble forecast sensitivity to observations (EFSO) (Kalnay et al., 2012; Hotta et al., 2017; Lien et al., 2018) which is an ensemble version of forecast sensitivity to observations (FSO) (Langland and Baker, 2004; Lorenc and Marriott, 2014) - the resource consuming adjoint-based approaches - is an alternative robust method that has successfully identified beneficial observations and discarded the detrimental ones in the numerical weather prediction systems (Ota et al., 2013; Hotta et al., 2017; Chen and Kalnay, 2019). It measures the impact of observations on the forecast valid at a future time with a cost function which is the difference between the squares of forecast errors with and without assimilating the observations. The errors in forecast are calculated with a weight matrix resulting in the squared norm, taken as the dry total energy (Gelaro et al., 2010; Kalnay et al., 2012; Lorenc and Marriott, 2014) or moist total energy (Ehrendorfer et al., 1999; Ota et al., 2013; Hotta et al., 2017) in atmospheric systems, which decides the contribution of different variables in the errors. Fujii et al., 2019 have studied FSO for ocean model with a variational data assimilation system where observation sensitivity is evaluated from the adjoint of the model. Recently, Drake et al., 2023 have explored FSO in ROMS with 4DVar assimilation system to study the impact of different observation types using different norms in the California current system. But, the efficacy of FSO for ensemble data assimilation systems in oceanic models has not yet been explored adequately. The oceanic community still largely relies on resource consuming OSEs, at least for oceanic models with ensemble data assimilation systems. With the advent of high resolution models, the leeway with resources is limited and there is a pressing need for an alternative method to filter out beneficial observations in oceanic ensemble data assimilation systems.
We have employed the EFSO in our in-house developed ocean data assimilation system LETKF-ROMS (Local Ensemble Transform Kalman Filter coupled to Regional Ocean Modeling System) for the Indian Ocean (Balaji et al., 2018; Baduru et al., 2019). One of the challenges in implementing EFSO to ocean systems is the lack of any established squared norm unlike its atmospheric counterpart wherein the norm is defined as moist or dry total energy of the atmospheric state. The total error energy norm is straightforward for currents and temperature in the ocean, but salinity does not have an explicit energy form under hydrostatic approximation (Reid et al., 1981) which many state-of-the-art ocean models including ROMS assume. So, unlike meteorological systems, the total error energy of a parcel in the ocean may or may not be the best approximation for the squared norm.
The Indian Ocean (30°S-30°N; 30°E-120°E) consists of diverse water masses across the domain exhibiting very different characteristics. For example, the Bay of Bengal is a very stratified system owing to large river discharges from river Ganges and river Brahmaputra (see Figure 1). In contrast, the Arabian Sea and the equatorial Indian Ocean is comparatively mildly stratified. It is challenging to devise a squared norm that takes into account these diverse characteristics across the entire domain of the Indian Ocean. Instead, we focus our attention on the Bay of Bengal to begin with. It is a smaller domain compared to the Arabian Sea and the rest of the Indian Ocean and therefore easy to analyze. Its characteristics are unique and very different from other large basins. Also, it has been challenging to simulate the ocean states using ocean general circulation models in the Bay of Bengal. One of the reasons is the lack of daily river discharge data into the ocean. Most of the models either incorporate a monthly climatological river discharges (Ferrer et al., 2009) or simply relax the salinity to its climatological value (Reynolds et al., 1998; Haidvogel et al., 2000; Baduru et al., 2019; Francis et al., 2020, 2021). None of these approaches have been particularly successful in simulating the upper ocean stratification in the Bay of Bengal on a daily scale which is an essential requirement for operational centers. Another probable reason is that the parameterizations of oceanic processes like mixing, bottom stress, etc are formulated from observational expeditions done in mostly Pacific Ocean (Large and Gent, 1999; Li et al., 2001) or Atlantic Ocean (Halliwell, 2004) where the conditions are vastly different from that of the Bay of Bengal. This may result in inaccurate parameter estimates for the Bay of Bengal. Consequently, the estimation of currents and other salient features like the thermocline and the mixed layer depths in the Bay of Bengal are compromised leaving large scope of improvements even after assimilating all available tracer observations (Balaji et al., 2018; Baduru et al., 2019).
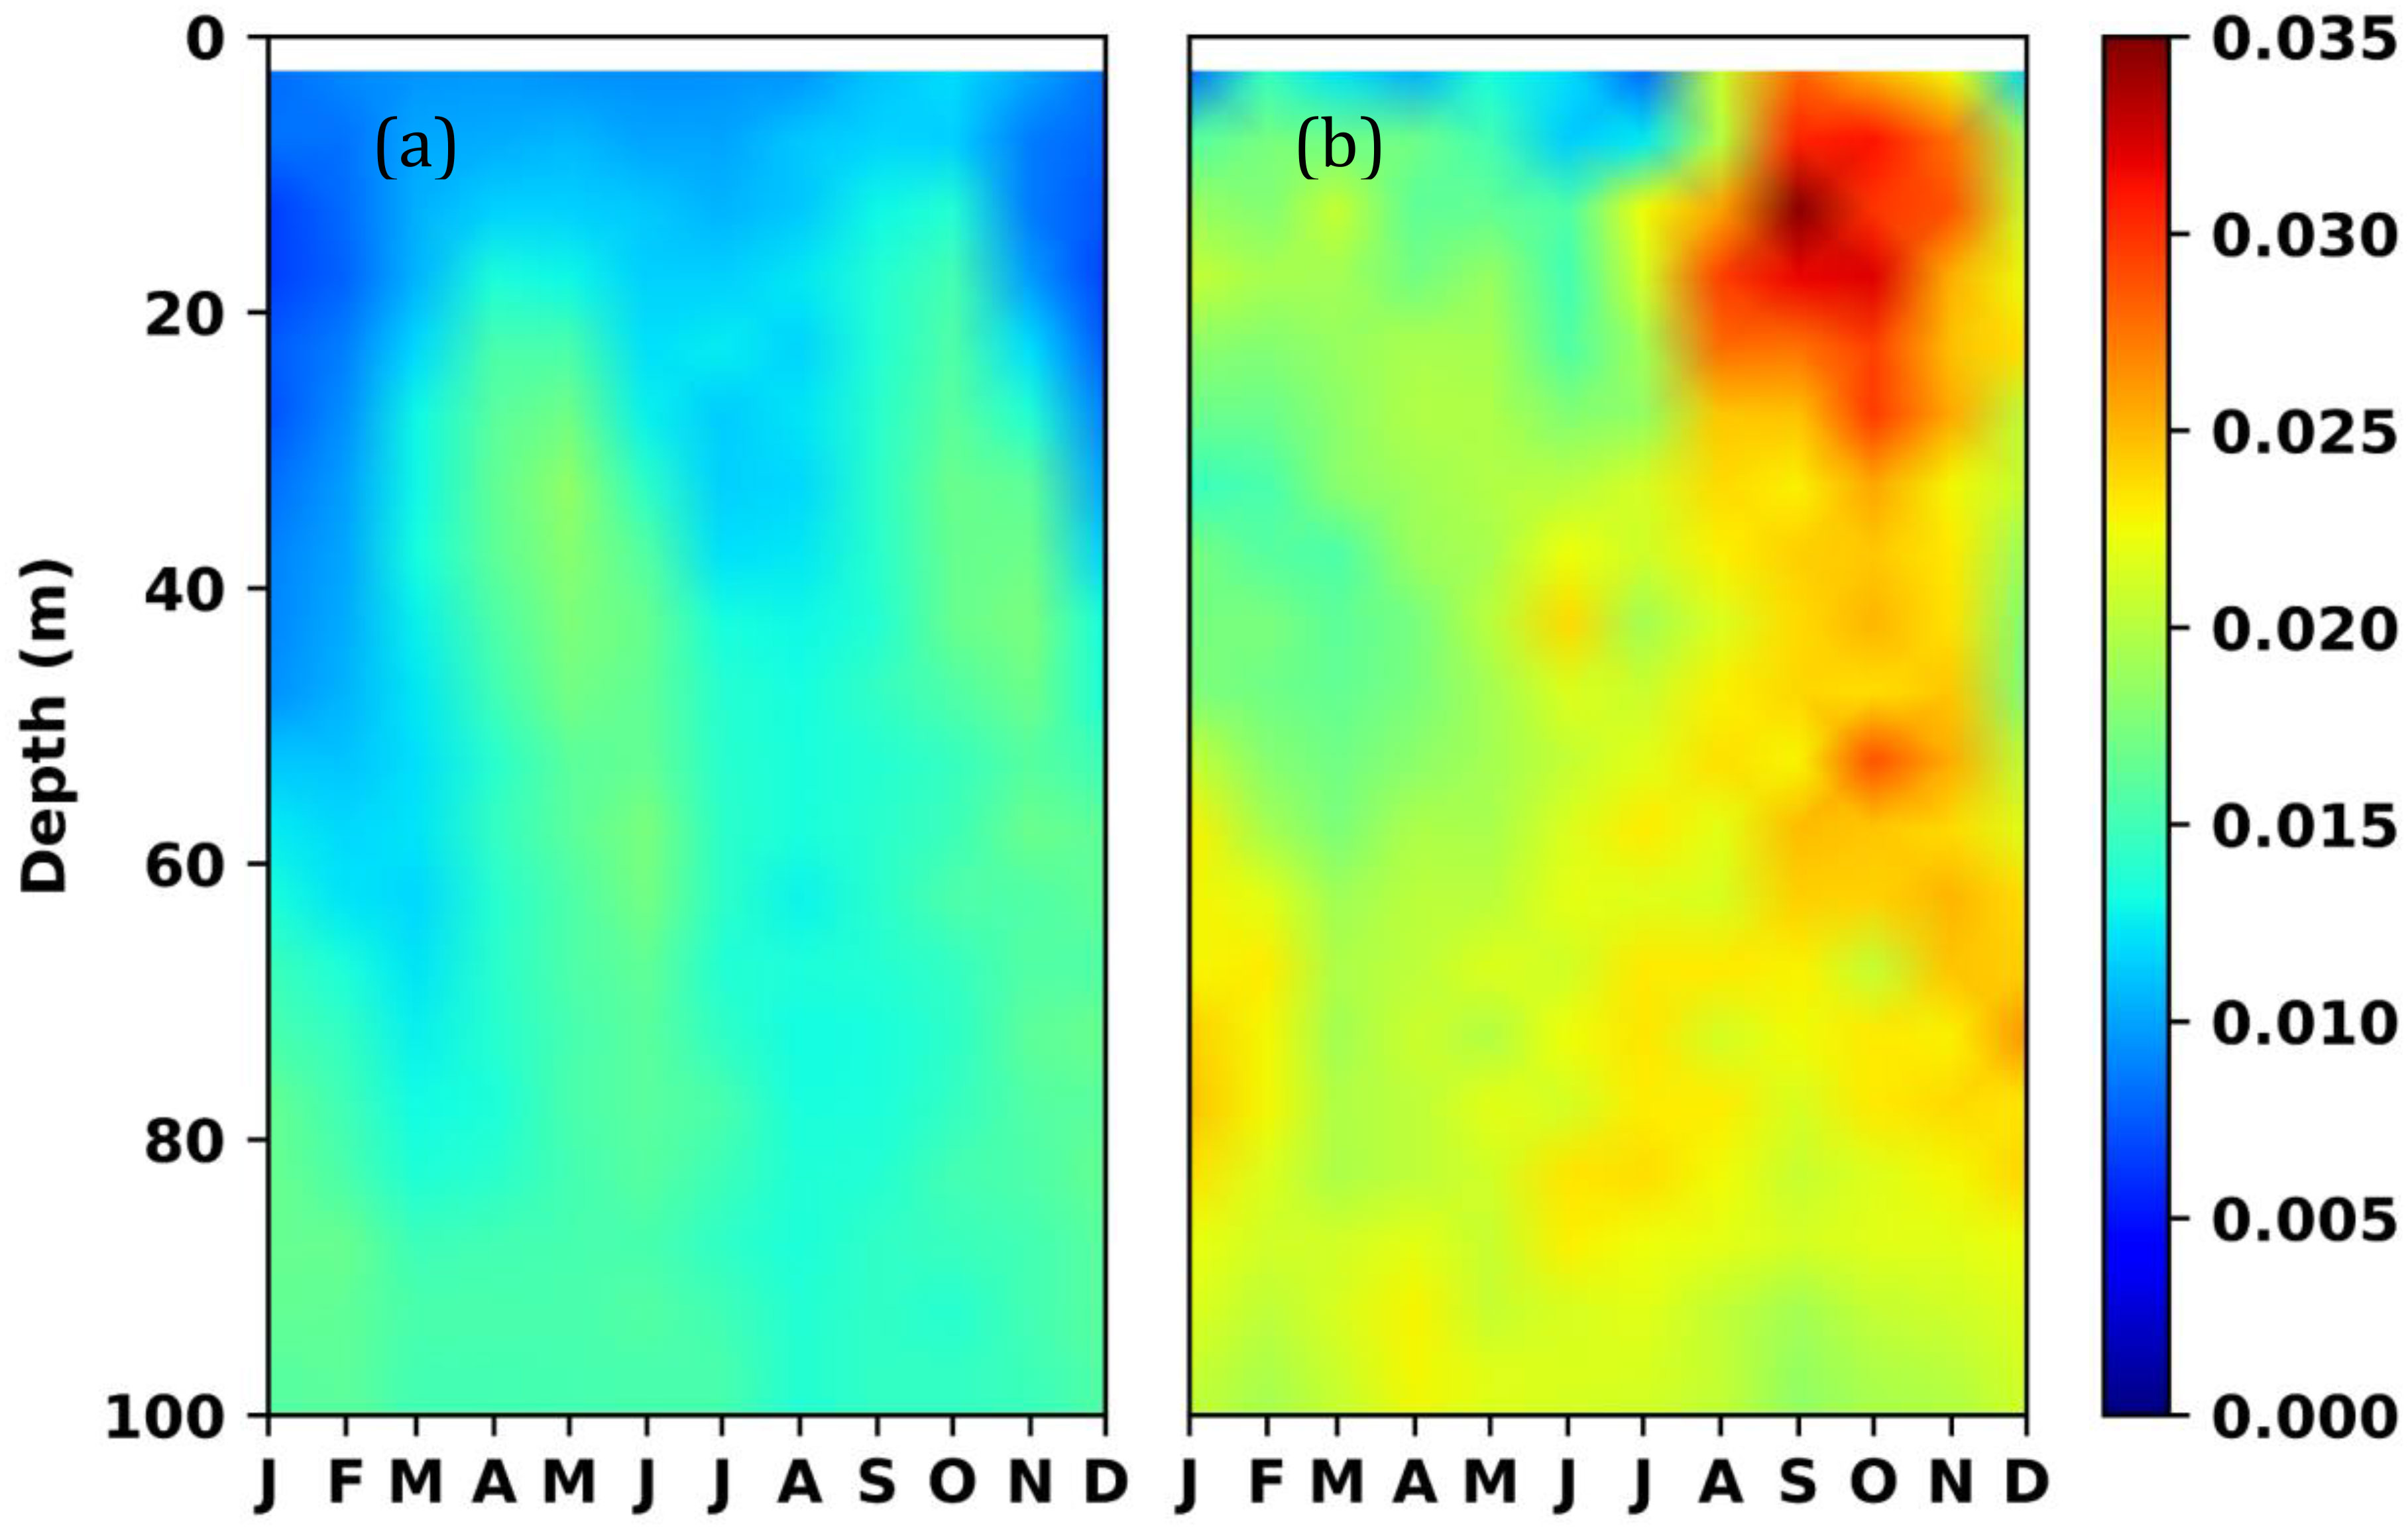
Figure 1 Time-depth plot of climatological Brunt-Vaisala frequency (unit in 1/s) in (A) Arabian Sea and (B) Bay of Bengal estimated from World Ocean Atlas 2018.
One of the variables that mirror stratification to a good extent is the baroclinicity of the ocean state. A large stratification yields a large baroclinicity and vice versa. The state of the ocean is called baroclinic if the constant pressure surfaces and the constant density surfaces are not parallel. If these surfaces are parallel, the state is called barotropic. In real oceans, the state is baroclinic and the baroclinicity vector contributes significantly to the rate of change of relative vorticity of the ocean and the circulation (Pedlosky, 1987). The vertical structure of the ocean can be decomposed into normal modes. The zeroth mode is the depth-integrated mode and hence is an outcome of the barotropic processes whereas all the other modes result from fluctuations in density interfaces and is an outcome of baroclinic processes. The barotropic mode is reasonably well simulated by the OGCMs because of the simplicity involved (Pedlosky, 1987). The propagation speeds of barotropic processes are also very fast. The domain of the Bay of Bengal is adjusted due to barotropic signals within the typical assimilation window in oceans which range from a day to a week. In contrast, the baroclinic modes propagate slowly, are harder to estimate, and have led to increased endeavors of accounting complicated processes through parameterizations (Treguier et al., 1997; Hallberg, 2013) and therefore the estimation of these modes leads to potentially larger errors. With this context in mind, we define the modulus of the baroclinic vector as the squared norm against which the cost function is estimated in the EFSO. We show that this approach yields promising results in identifying observations that contribute positively to the estimation of analysis.
Section 2 describes the experimental design we have for this EFSO experiment for the Indian Ocean. Section 3 shows the results where we identify the beneficial observations and its impact on the ocean state. We show that the inclusion of only beneficial observations significantly improves the estimation of the currents and the thermocline. Section 4 is a summary of the results and discussion of the future aspect of use of EFSO for the ocean.
The Regional Ocean Modeling System (ROMS) is a free surface and terrain-following ocean general circulation model (Song and Haidvogel, 1994; Shchepetkin and McWilliams, 2005). The set-up of ROMS for the Indian Ocean domain extends from 30°E to 120°E in the zonal direction and from 30°S to 30°N in the meridional direction. Though we are interested in testing the efficacy of the new norm in the Bay of Bengal which lies north of the equator, the southern boundary of our model domain is transgressed beyond the equator to 30°S. This is imperative because the dynamics in the north Indian Ocean is strongly influenced by the equatorial Indian Ocean dynamics (Chatterjee et al., 2017; Cheng et al., 2018). The remote influence of equatorial dynamics on the north Indian Ocean cannot be adequately captured through daily boundary conditions if the southern boundary of the model domain is kept north of the equator. Also, recent studies have shown that there are strong influences at intraseasonal scales of the dynamics in the Maritime Continent on the tropical Indian Ocean (Rohith et al., 2019; Afroosa et al., 2021). The horizontal grid resolution of the model is 1/12 degree (Francis et al., 2013). It has 40 vertical sigma levels. The boundaries in the east and south are open while the boundaries in the north and west are closed with no-slip boundary conditions. The model does not have a river runoff scheme; so model surface salinity is relaxed to its monthly climatology (Antonov et al., 2010) over a timescale of 30 days.
A Local Ensemble Transform Kalman Filter (LETKF) is a variant of Ensemble Kalman Filter where background error covariance is approximated by the sample covariance computed from ensemble members (Hunt et al., 2007). We use 20 ensemble members for the ocean initial state which are forced with 20 ensemble atmospheric fields from Global Forecast System (GFS) at National Centre for Medium Range Weather Forecasting (Prasad et al., 2016). The initial ensembles are drawn from 80-ensemble versions of LETKF-ROMS (Baduru et al., 2019) where initial ensembles are prepared by random sampling (Xu and Oey, 2014) from ROMS with a reasonable amount of initial spread. Further, we use two different schemes, viz., KPP (Large et al., 1994) and Mellor–Yamada (Mellor and Yamada, 1982) for parameterizing the vertical mixing to ensure that the ensemble spread is maintained during the model simulation. We also inflate the ensemble spread by 10% at each analysis cycle for the same reason. However, covariance inflation is not applied in calculating EFSO cost function. As the number of ensembles is much less than the length of model state vector, so, to minimize the long distance spurious correlation, this system uses a Gaussian profile for localization with a radius of 700 km (Anderson, 2007; Nurujjaman et al., 2013; Ying et al., 2018). Any particular observation influences all the prognostic variables at each grid location within its localization radius through the multivariate background error covariance matrix. No vertical localization has been applied, i.e., the observation at the surface influences the model ocean state even at the deepest layer beneath the observation. The observation errors have spatio-temporal variation and includes the representational errors which account for unresolved processes in the model (Sanikommu et al., 2019). In this experimental setup, LETKF-ROMS assimilates in-situ temperature (T) and salinity (S) profiles from Argo, buoy and ship track data, and satellite swaths of sea surface temperature (SST) from GHRSST only in the northern Indian Ocean (north of Equator), including the Arabian Sea and the Bay of Bengal, where we are interested in testing the new norm for measuring the forecast error. The errors in T, S, and SST observations consist of instrument errors of 0.2 °C, 0.1 PSU, and 0.1 °C respectively plus spatio-temporal varying representational errors estimated using the method prescribed in Sanikommu et al., 2019. The assimilation window for this system is 5 days where model initial conditions are updated with analysis generated by LETKF every 5th day with the observations available only on the 5th day. The observations from day 1 to day 4 during an assimilation cycle are ignored. More details about the assimilation system can be found in Baduru et al., 2019.
Kalnay et al., 2012 have developed EFSO whose efficacy was demonstrated in a toy atmospheric model. Later on, EFSO was applied with success in state-of-the-art numerical weather prediction systems (Ota et al., 2013; Hotta et al., 2017; Lien et al., 2018). EFSO for atmosphere generally uses dry or moist total energy as the squared norm matrix (see equation (9) of Kalnay et al., 2012). Squared norm assigns weights to each prognostic variable of the model for their contribution to the cost function. The cost function measures the impact of observations on the forecast at a future time. Such a predefined squared norm for the ocean which explicitly depends on each prognostic variable does not exist to the best of our knowledge. So, we choose the modulus of the baroclinicity vector as the squared norm. The norm of the baroclinicity vector is represented as , where ρ represents the density and p represents the pressure on the fluid parcel.
The cost function (J) for EFSO (defined by Kalnay et al., 2012) at j-th model grid point for l-th observation is given as
where,
= ensemble size;
is the innovation with respect to the first guess at t = 0;
H = observation operator;
= background state obtained from the analysis of 5 days ago;
= localization function at j-th grid point;
R = observational error covariance matrix;
where = analysis perturbation matrix at t = 0;
= forecast perturbation matrix;
= modulus of the baroclinic vector at the j-th model grid point;
Both the forecasts (with assimilation at days) and (with assimilation at days) were verified against a reference analysis which is a product of 80 ensemble LETKF-ROMS (Baduru et al., 2019) used for operational ocean state forecast at Indian National Centre for Ocean Information Services (INCOIS). The evaluation forecast time is taken as 5 days.
We use 20 ensembles in this EFSO experiment with a 5 days assimilation window in the LETKF-ROMS starting from August 15, 2016 till December 31, 2017. This study examines two data assimilation systems. In the first system, we assimilate all the available 5th day’s observations which lie north of the equator using LETKF in ROMS. We call this assimilation system ‘ALL’. For each observation during an assimilation cycle, we estimate the sum of the cost function over all those model grid points that lie within the localization radius of the particular observation. If this sum turns out to be negative (positive), the observation contributes positively (negatively) to the model analysis by reducing (increasing) the forecast error and we call this data beneficial (harmful) during that assimilation cycle. Note that the data measured by any observing system at any depth can alternate between beneficial and harmful over assimilation cycles. We see that approximately half of the total observations which go into ALL are beneficial to the system and contribute to the improvement of the model state (Figure 2). We identify these observations as beneficial observations. The rest of the observations do not either improve the model state or degrade the state. We identify these as detrimental observations. In the other data assimilation system, we use only the beneficial observations estimated from the first system to rerun the system from the same initial condition. We call this system ‘BEN’. Whenever we compare ALL or BEN with available observations, we use a short term forecast (up to five days) throughout the study.
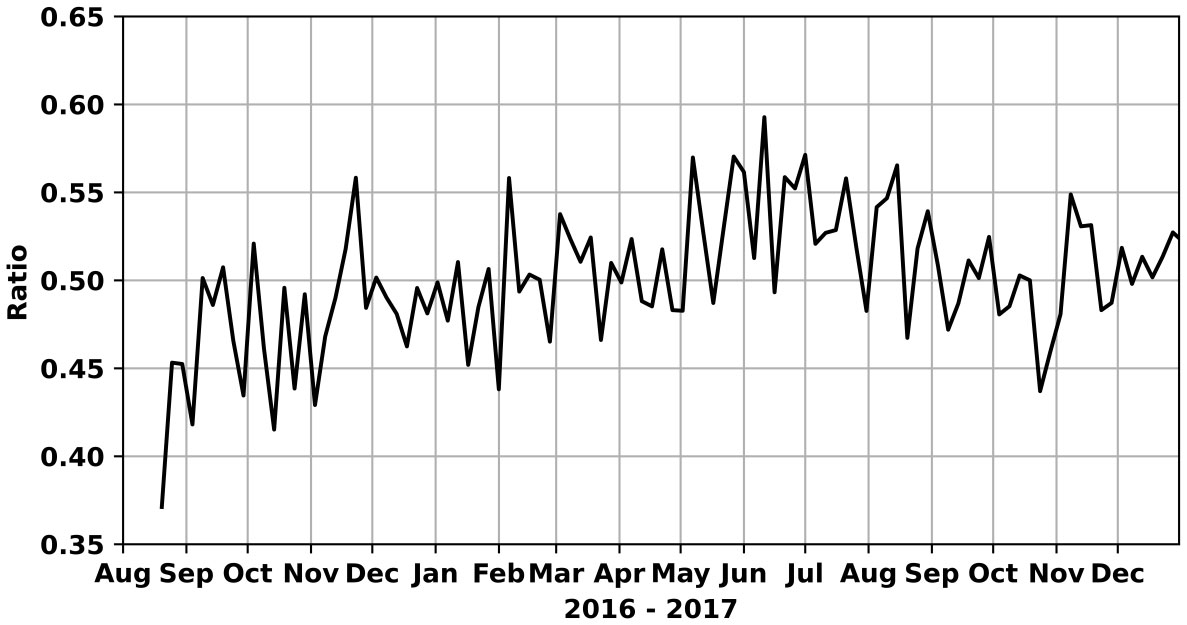
Figure 2 Time series of ratio of the number of beneficial observations to all the observations.
We assess the statistics of forecast error reductions and how well the estimated error reduction represents the true error reduction. Both the true and estimated forecast error reductions are calculated by comparing the ocean states from ALL with a forecast lead time of 5 days with the ocean states estimated from 80 ensemble LETKF-ROMS. At each assimilation cycle, the true error reduction is calculated as whereas the estimated error reduction is simply the cost function at that assimilation cycle. The cost function is estimated at each model grid point for each observation during each assimilation cycle. This allows us to assess the impact of the observation type (temperature, salinity and SST) on the cost function. Also, the improvements or degradations can be aggregated spatially or temporally for each observation type.
We estimate the cost function at time t (J(t)) as follows:
That is, the cost function at each model grid point (j) is summed across the model domain (both horizontally and vertically) and all observations (l) across all observation types. The estimated error reduction is equivalent to the true error reduction under ideal circumstances. However, the linearity approximations incorporated while arriving at the estimated error reduction introduces deviations from the true error reduction. Figure 3A shows the time series of true and estimated error reduction during the period of our study. A negative (positive) error reduction signifies improvement (degradation). The true error reduction (black curve in Figure 3A) remains negative during the period of our study signifying that there is an overall improvement in ALL due to assimilation. The estimated error reduction (red curve in Figure 3A) remains negative during most of the assimilation cycles. The estimated error reduction however is positive during a few occasions. Nevertheless, the estimated error reduction manages to capture almost every peak of the true error reduction during our period of study. The two time series have a correlation of 0.86 which is at a 99% confidence level. This shows that the estimated error reduction manages to reasonably represent the true error reduction during the period of our study. The error reduction (both estimated and true) during the initial one and half months is small because of assimilating only temperature and salinity profiles. Satellite SST has been assimilated since October 10, 2016. The introduction of SST appears to have a pronounced effect on both true and estimated error reduction. The errors have reduced once the SST is introduced as SST has a larger impact than temperature and salinity profiles as we will see while assessing the impact of each type of observation.
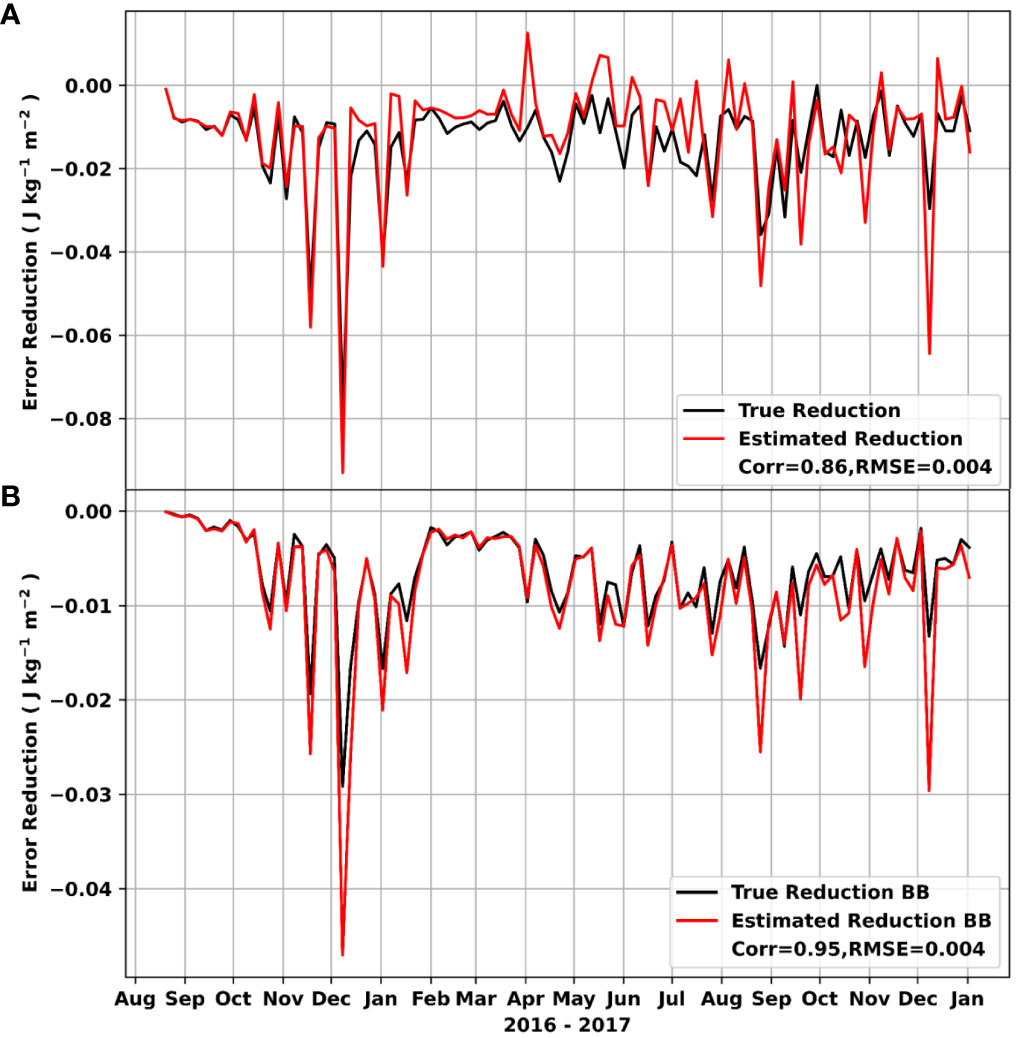
Figure 3 Time series of true (black) and estimated (red) forecast error reduction verified with 80 ensemble LETKF-ROMS for (A) Northern Indian Ocean and (B) Bay of Bengal.
We now focus our attention over the Bay of Bengal (the southern boundary of this analysis is up to 7°N). We plot the true (black curve) and estimated (red curve) error reduction only over the Bay of Bengal in Figure 3B. Both the true and the estimated error reduction remains negative during the entire period of our study signifying that there is an overall improvement in the Bay of Bengal due to assimilation. The correlation coefficient between the true and estimated error reduction has increased to 0.95 (> 99% significance). This implies that the estimated error reduction could represent the true error reduction over the Bay of Bengal significantly better than what it could for the whole northern Indian Ocean. Also, this indicates that the source of positive estimated error reduction during some occasions in Figure 3A could come from the Arabian Sea.
We now assess the average impact of each observation type in the two basins - Arabian Sea and Bay of Bengal. The southern boundary of the Arabian Sea (Bay of Bengal) is chosen at 5°N (7°N). The impact is estimated by summing the cost function of an observation type over the depth and the duration of the study followed by dividing it with the number of that observation type assimilated. It is then summed over the individual basin. We plot the average (total) impact per observation for the three observation types - temperature, salinity, and SST - in Figures 4A, B. We see that assimilating SST imparts the largest impact across the two basins both in terms of average impact and total impact. This is possibly because of the large number of available SST observations compared to temperature and salinity (see Figures 5A–F) and because of more homogeneous spatial coverage of SST observations (see Figure 5G). Also, the average impact of SST is pronounced in the Arabian Sea compared to that in the Bay of Bengal. That is because the number of SST observations in the Arabian Sea exceeds that of the Bay of Bengal by a considerable margin (see Figures 5A, B) coupled with a more homogeneous representation of SST in the Arabian Sea (Figure 5G). In addition, the SST variability in the Arabian Sea is more pronounced than in the Bay of Bengal (Murtugudde et al., 2007; Khan et al., 2021). Feeding the SST observations likely improves the mesoscale variability of SST near the western boundary of the Arabian Sea and the variability of SST in the south-central part of the basin during summer monsoon. In contrast, the numbers of temperature and salinity observations are comparable in the Bay of Bengal and Arabian Sea. But the impact of salinity observations is more pronounced in the Bay of Bengal than that of temperature.

Figure 4 (A) The average impact of Temperature, Salinity, and Sea Surface Temperature observations in Arabian Sea (blue) and Bay of Bengal (orange). (B) The total impact of Temperature, Salinity, and Sea Surface Temperature observations in Arabian Sea (blue) and Bay of Bengal (orange). Note that two different axes and hence labels are used in (B) – the top axis for temp and salt, and the bottom axis for SST.
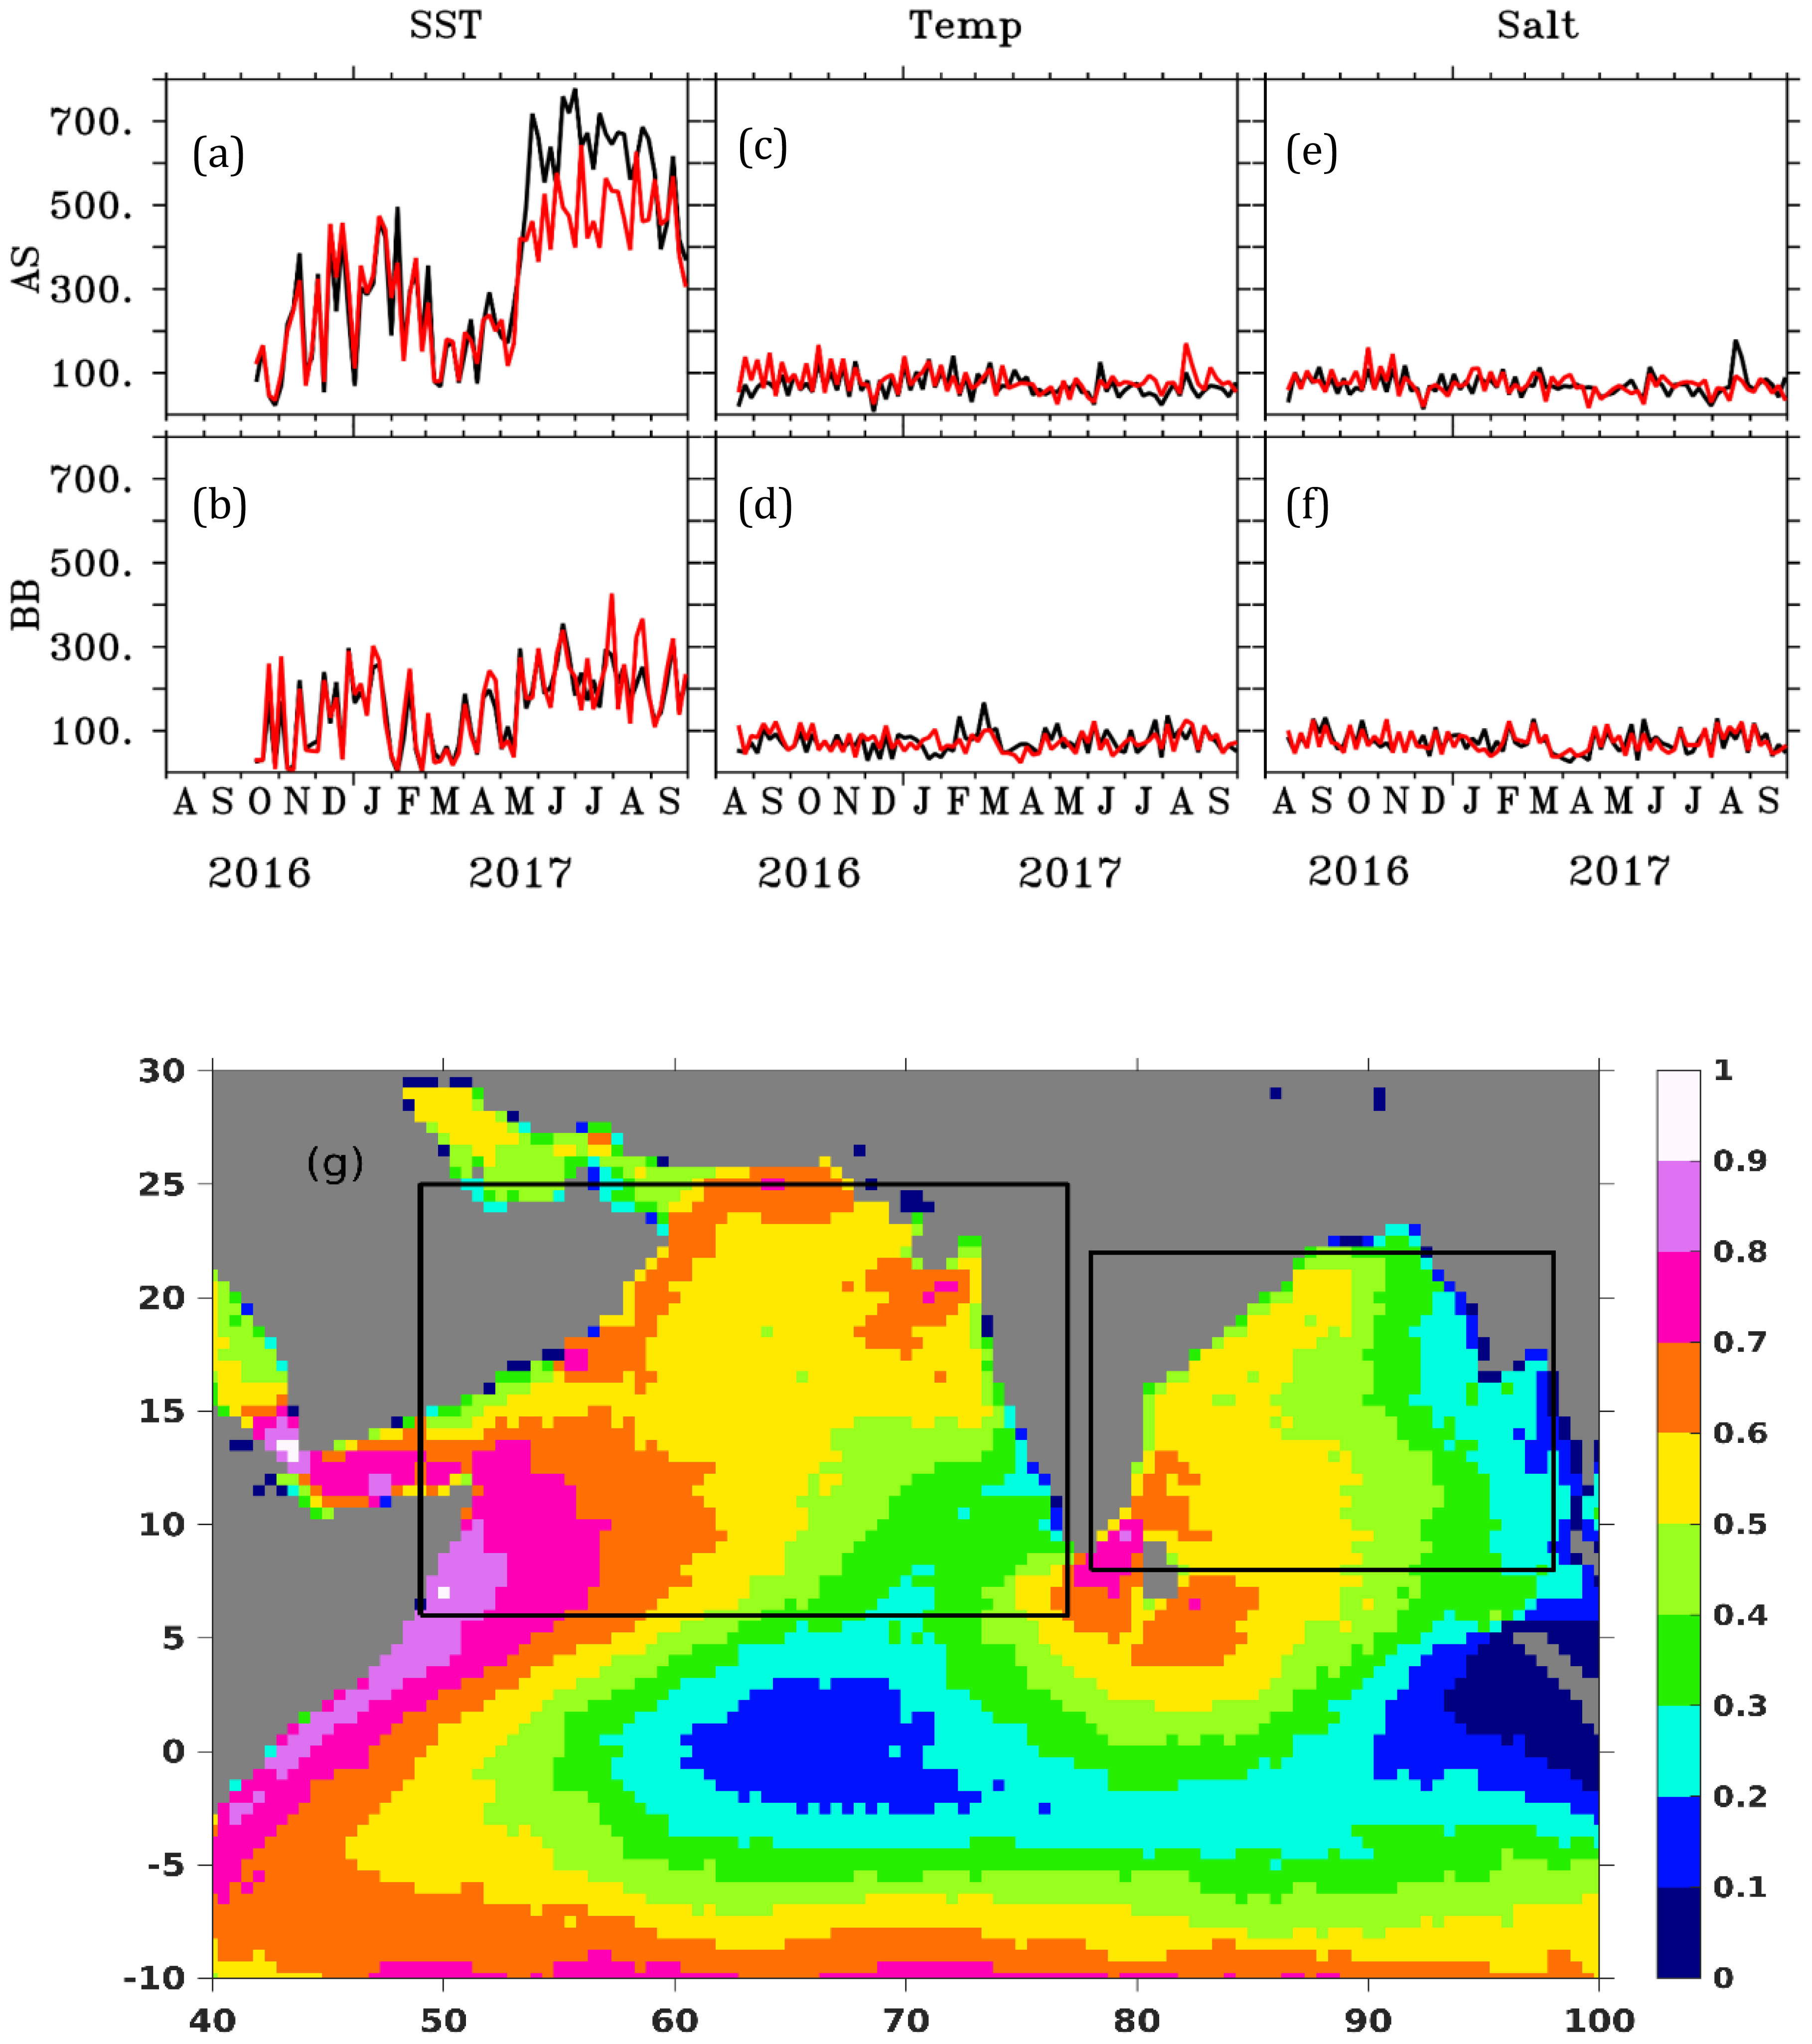
Figure 5 Time series of number of beneficial (black) and non-beneficial (red) SST (A, B), temperature (C, D) and salinity (E, F) observations in Arabian Sea (top) and Bay of Bengal (bottom). (G) The spatial coverage of SST observations on the northern Indian Ocean coarse-grained over a length scale of ~100 km.
To further analyze the impact of observation types with depth, we assess the impact of temperature (Figure 6) and salinity observations (Figure 7) versus depth in the two basins. For each basin, this is estimated by summing the cost function across all grid points for temperature (or salinity) observations at each vertical layer and subsequently dividing it by the total number of temperature (or salinity) observations in that layer during the period of our study. The impact of salinity observation in the Bay of Bengal is larger than that of the Arabian Sea across the depth. The largest impact of salinity observation in the Bay of Bengal occurs at 20-75 m. The impact of temperature observations is comparable along the depth of top 200 m in the Bay of Bengal and Arabian Sea. Also, the impact of salinity observations outscores the impact of temperature observations in the Bay of Bengal – particularly in the top layers where the freshwater resides. The model does not ingest freshwater fluxes from major rivers like Ganga and Brahmaputra. Instead, the impact of freshwater fluxes is captured only through a weak relaxation to monthly salinity climatology with a timescale of 30 days. Consequently, the salinity representation in Bay of Bengal is not properly reproduced in the model thereby leaving large scope for improvements.
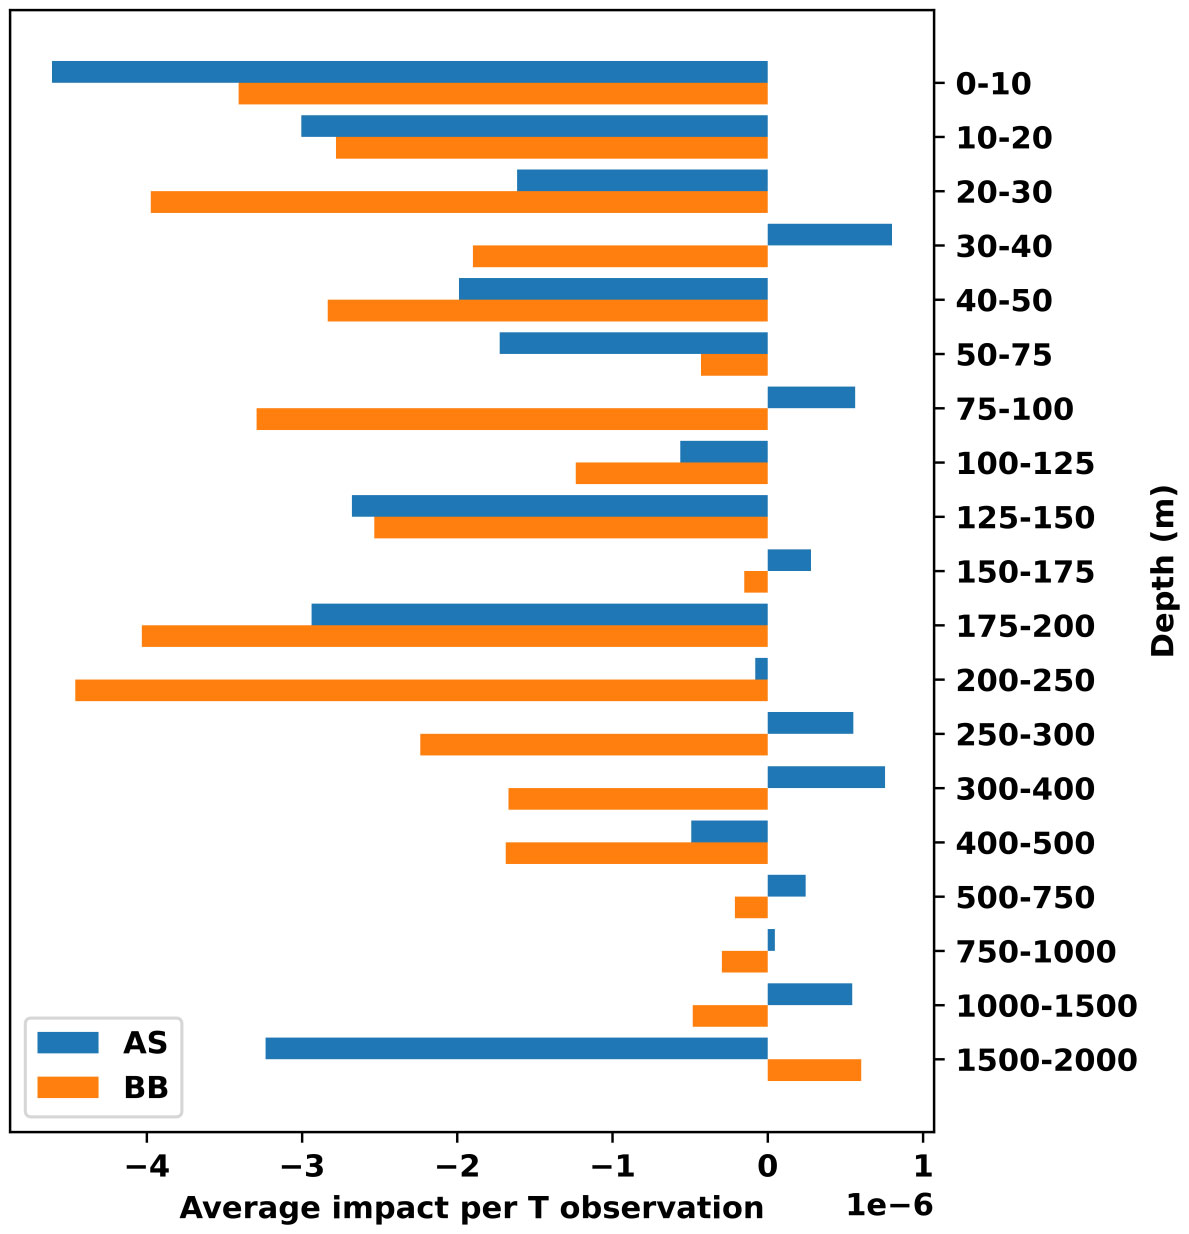
Figure 6 Average impact of each Temperature observation in the Arabian Sea (blue) and Bay of Bengal (orange) at different depths.
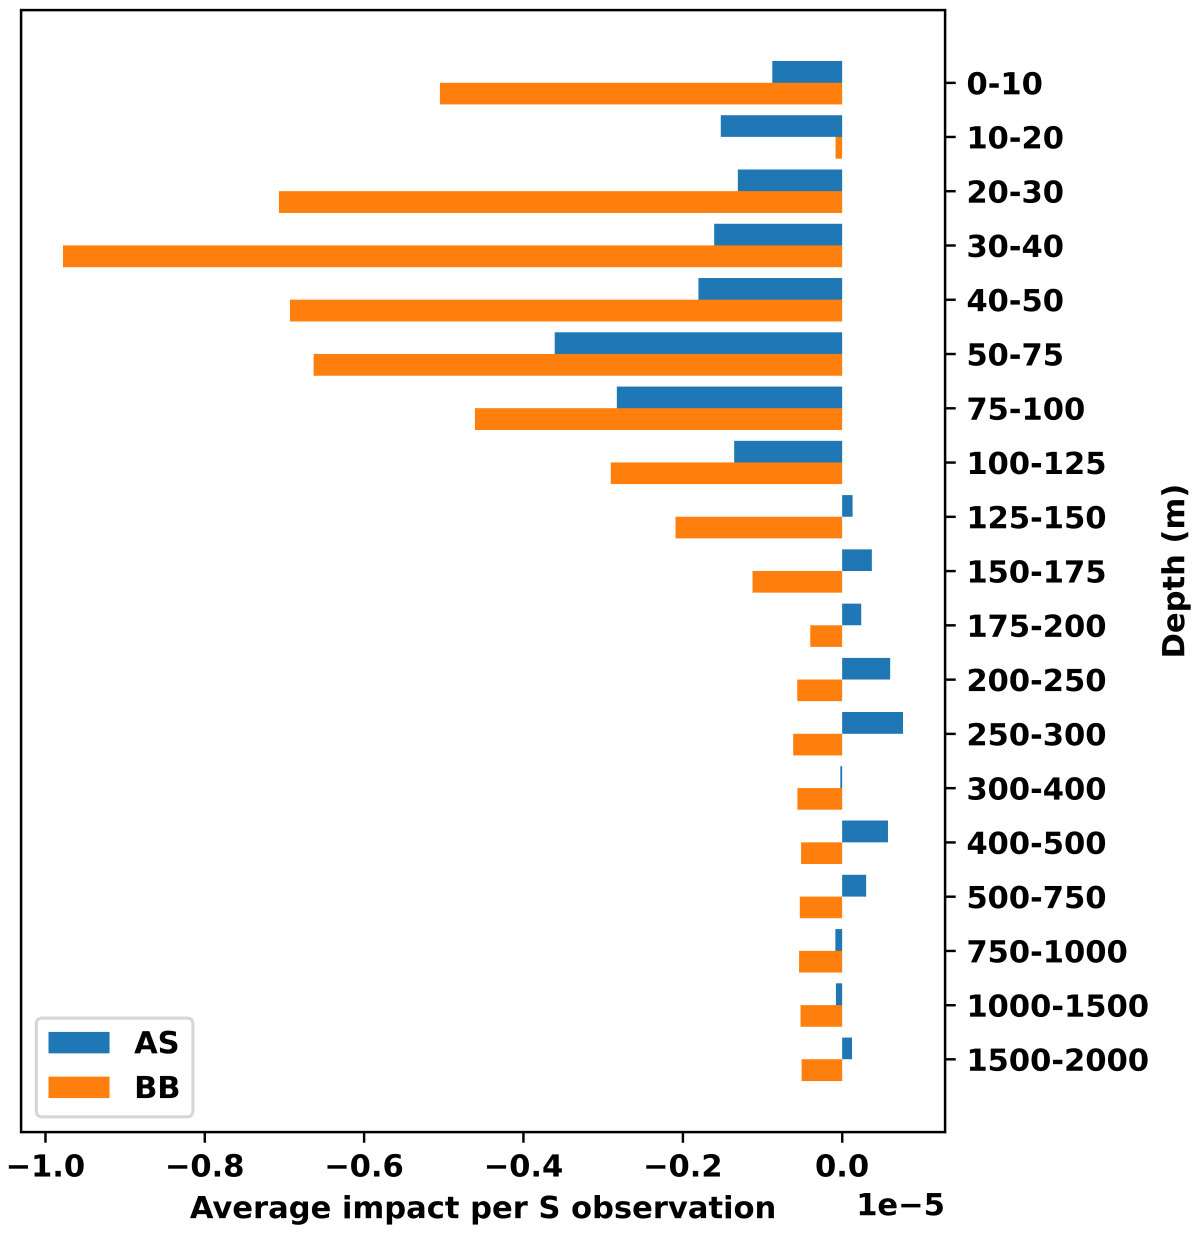
Figure 7 Average impact of each Salinity observation in the Arabian Sea (blue) and Bay of Bengal (orange) at different depths.
Which of the two regions - Arabian Sea and Bay of Bengal - have more beneficial observations? In Figure 8, we plot the percentage and number of beneficial temperature and salinity observations in the two basins - Arabian Sea and Bay of Bengal. We find that the Arabian Sea and Bay of Bengal have nearly comparable percentages of beneficial temperature and salinity observations even though the exact numbers vary across the period of our study. However, the Bay of Bengal has more beneficial temperature and salinity observations than the Arabian Sea, i.e., there are more observations in the Bay of Bengal that positively contribute to the improvement in the ocean state. Also, there are significantly more sub-surface beneficial observations in the Bay of Bengal. Does it render any positive impact on the estimation of thermocline in the Bay of Bengal?
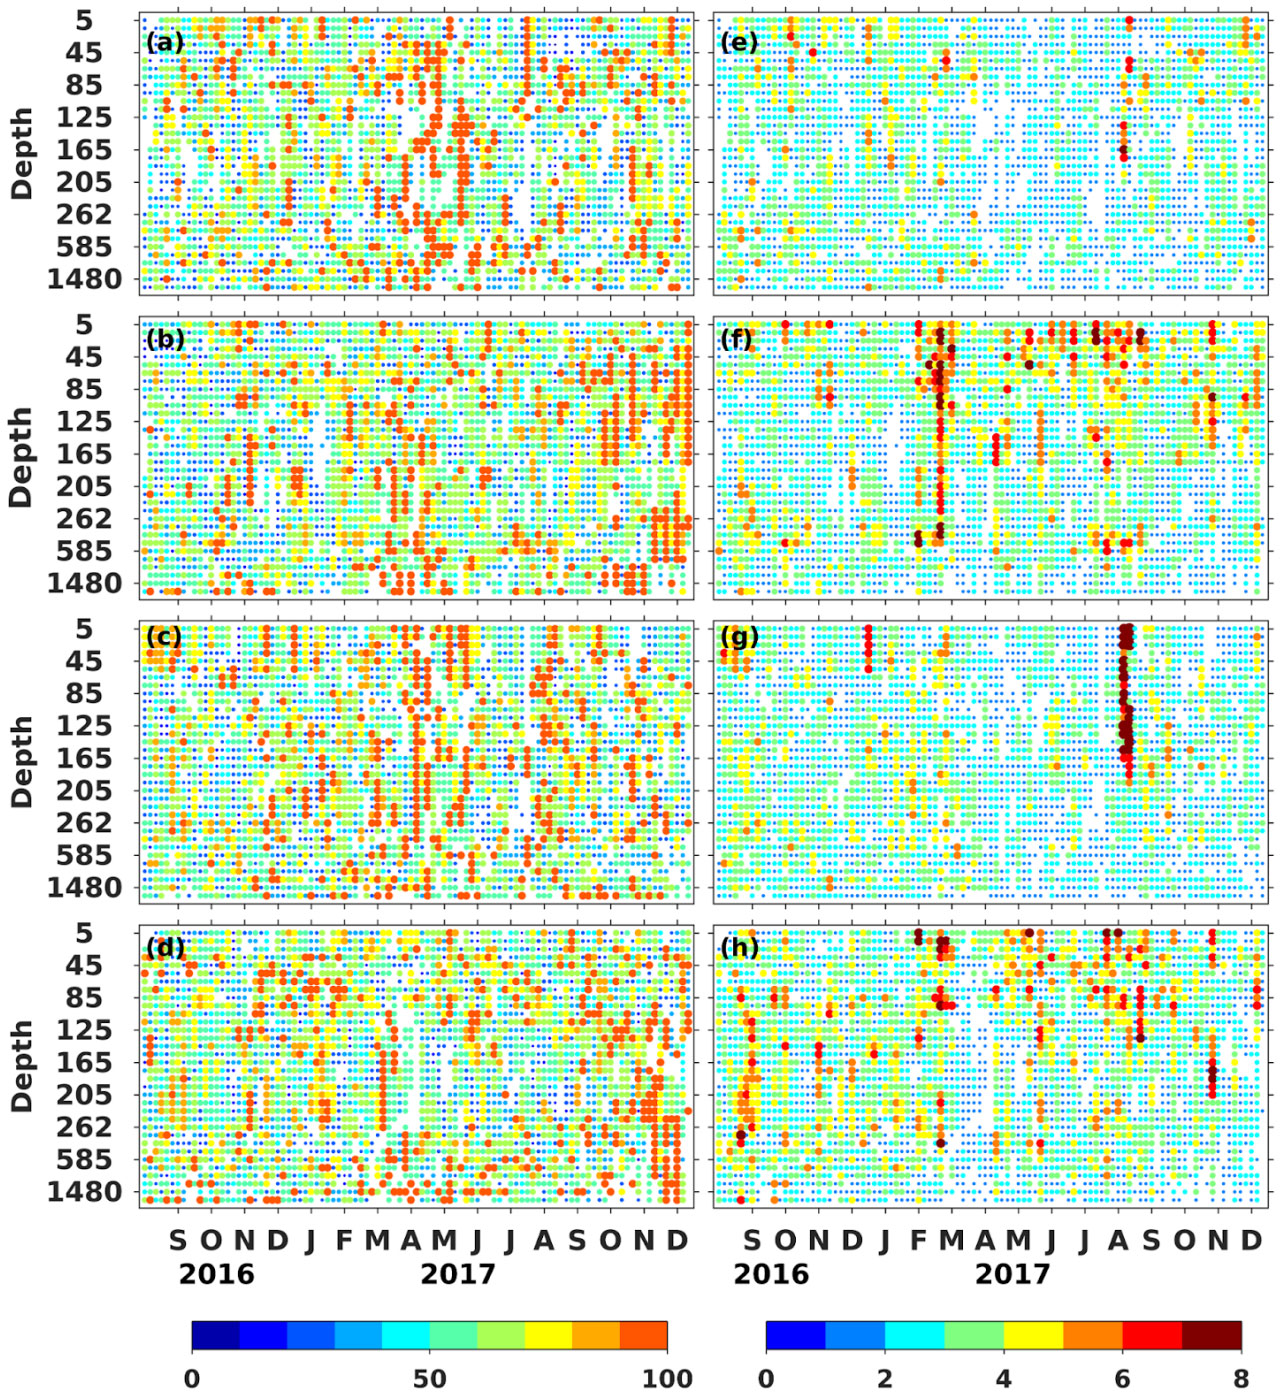
Figure 8 Time depth section of percentage (total number) of beneficial (A, E) temperature observations in Arabian Sea, (B, F) temperature observations in Bay of Bengal, (C, G) salinity observations in Arabian Sea, (D, H) salinity observations in Bay of Bengal.
In order to understand that, we look at the three buoys installed in the Bay of Bengal along 90°E at three latitudes - 0°N, 4°N and 12°N. We compare the thermocline depth estimated from ALL and BEN at these three locations (Figure 9). We would like to point out that all those three buoys are assimilated in ALL and BEN. Both BEN and ALL appear to be equally efficient in simulating the equatorial subsurface characteristics (thermocline depth). The RMSE in thermocline depth is less than 15 m and the correlation is higher than 0.75 across both the systems. However, as we approach northwards, the RMSE (correlation) progressively increases (decreases) in ALL. Near the head bay at 12°N, the model thermocline depth and the observed thermocline depth gets decorrelated. The RMSE rises to ~33 m at 12°N. This vindicates earlier results that the model fails to estimate the sub-surface oceanic structure close to the northern Bay where the ocean is largely stratified. In contrast, we see a much improved simulated thermocline depth in BEN even near the head bay. The correlation improves (>40%) and the RMSE decreases significantly (~26 m) with respect to ALL. The difference in RMSE between BEN and ALL progressively increases northwards. The stratification is more pronounced near the head Bay due to river discharges from Ganges and Brahmaputra. With baroclinicity as the squared norm, ALL tries to identify all those observations that improve the stratification of the system within the localization radius. And when only all those identified beneficial observations are fed into BEN and all observations that were detrimental are discarded, we see a marked improvement in the estimation of thermocline. It appears that the larger the stratification is, the larger the improvement is in the BEN.
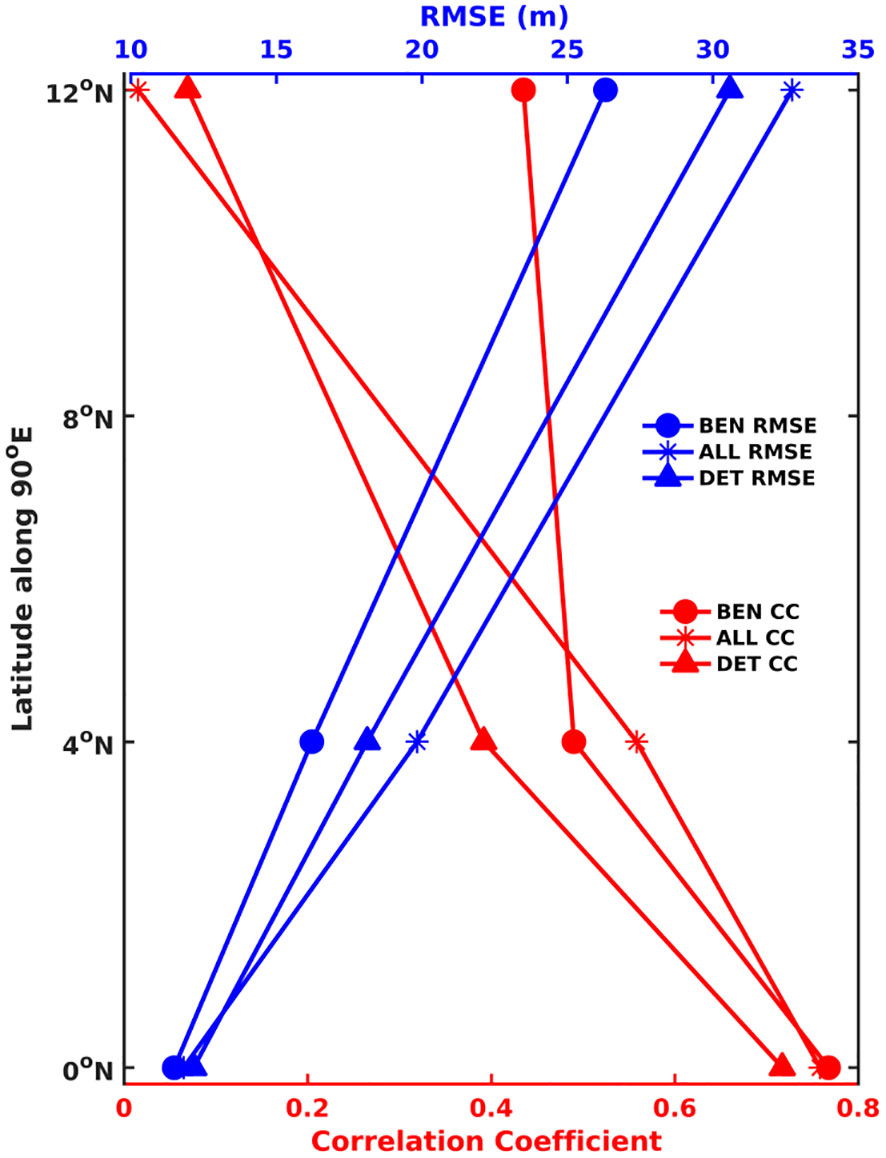
Figure 9 RMSE (blue) in meters and Correlation Coefficient (red) of thermocline depth from ALL (starred), BEN (solid circle) and DET (solid triangle) with respect to RAMA buoys at 0°N, 4°N and 12°N along 90°E.
This result is also vindicated when both these systems are compared against ARGO floats in the Bay of Bengal. We see a significant improvement in thermocline depth while comparing with an ARGO which drifts in and around the head of the Bay of Bengal (Figure 10). Are these improvements limited only in the estimation of the stratification or is it extended to ocean currents as well since an improved baroclinicity is expected to improve the circulation?
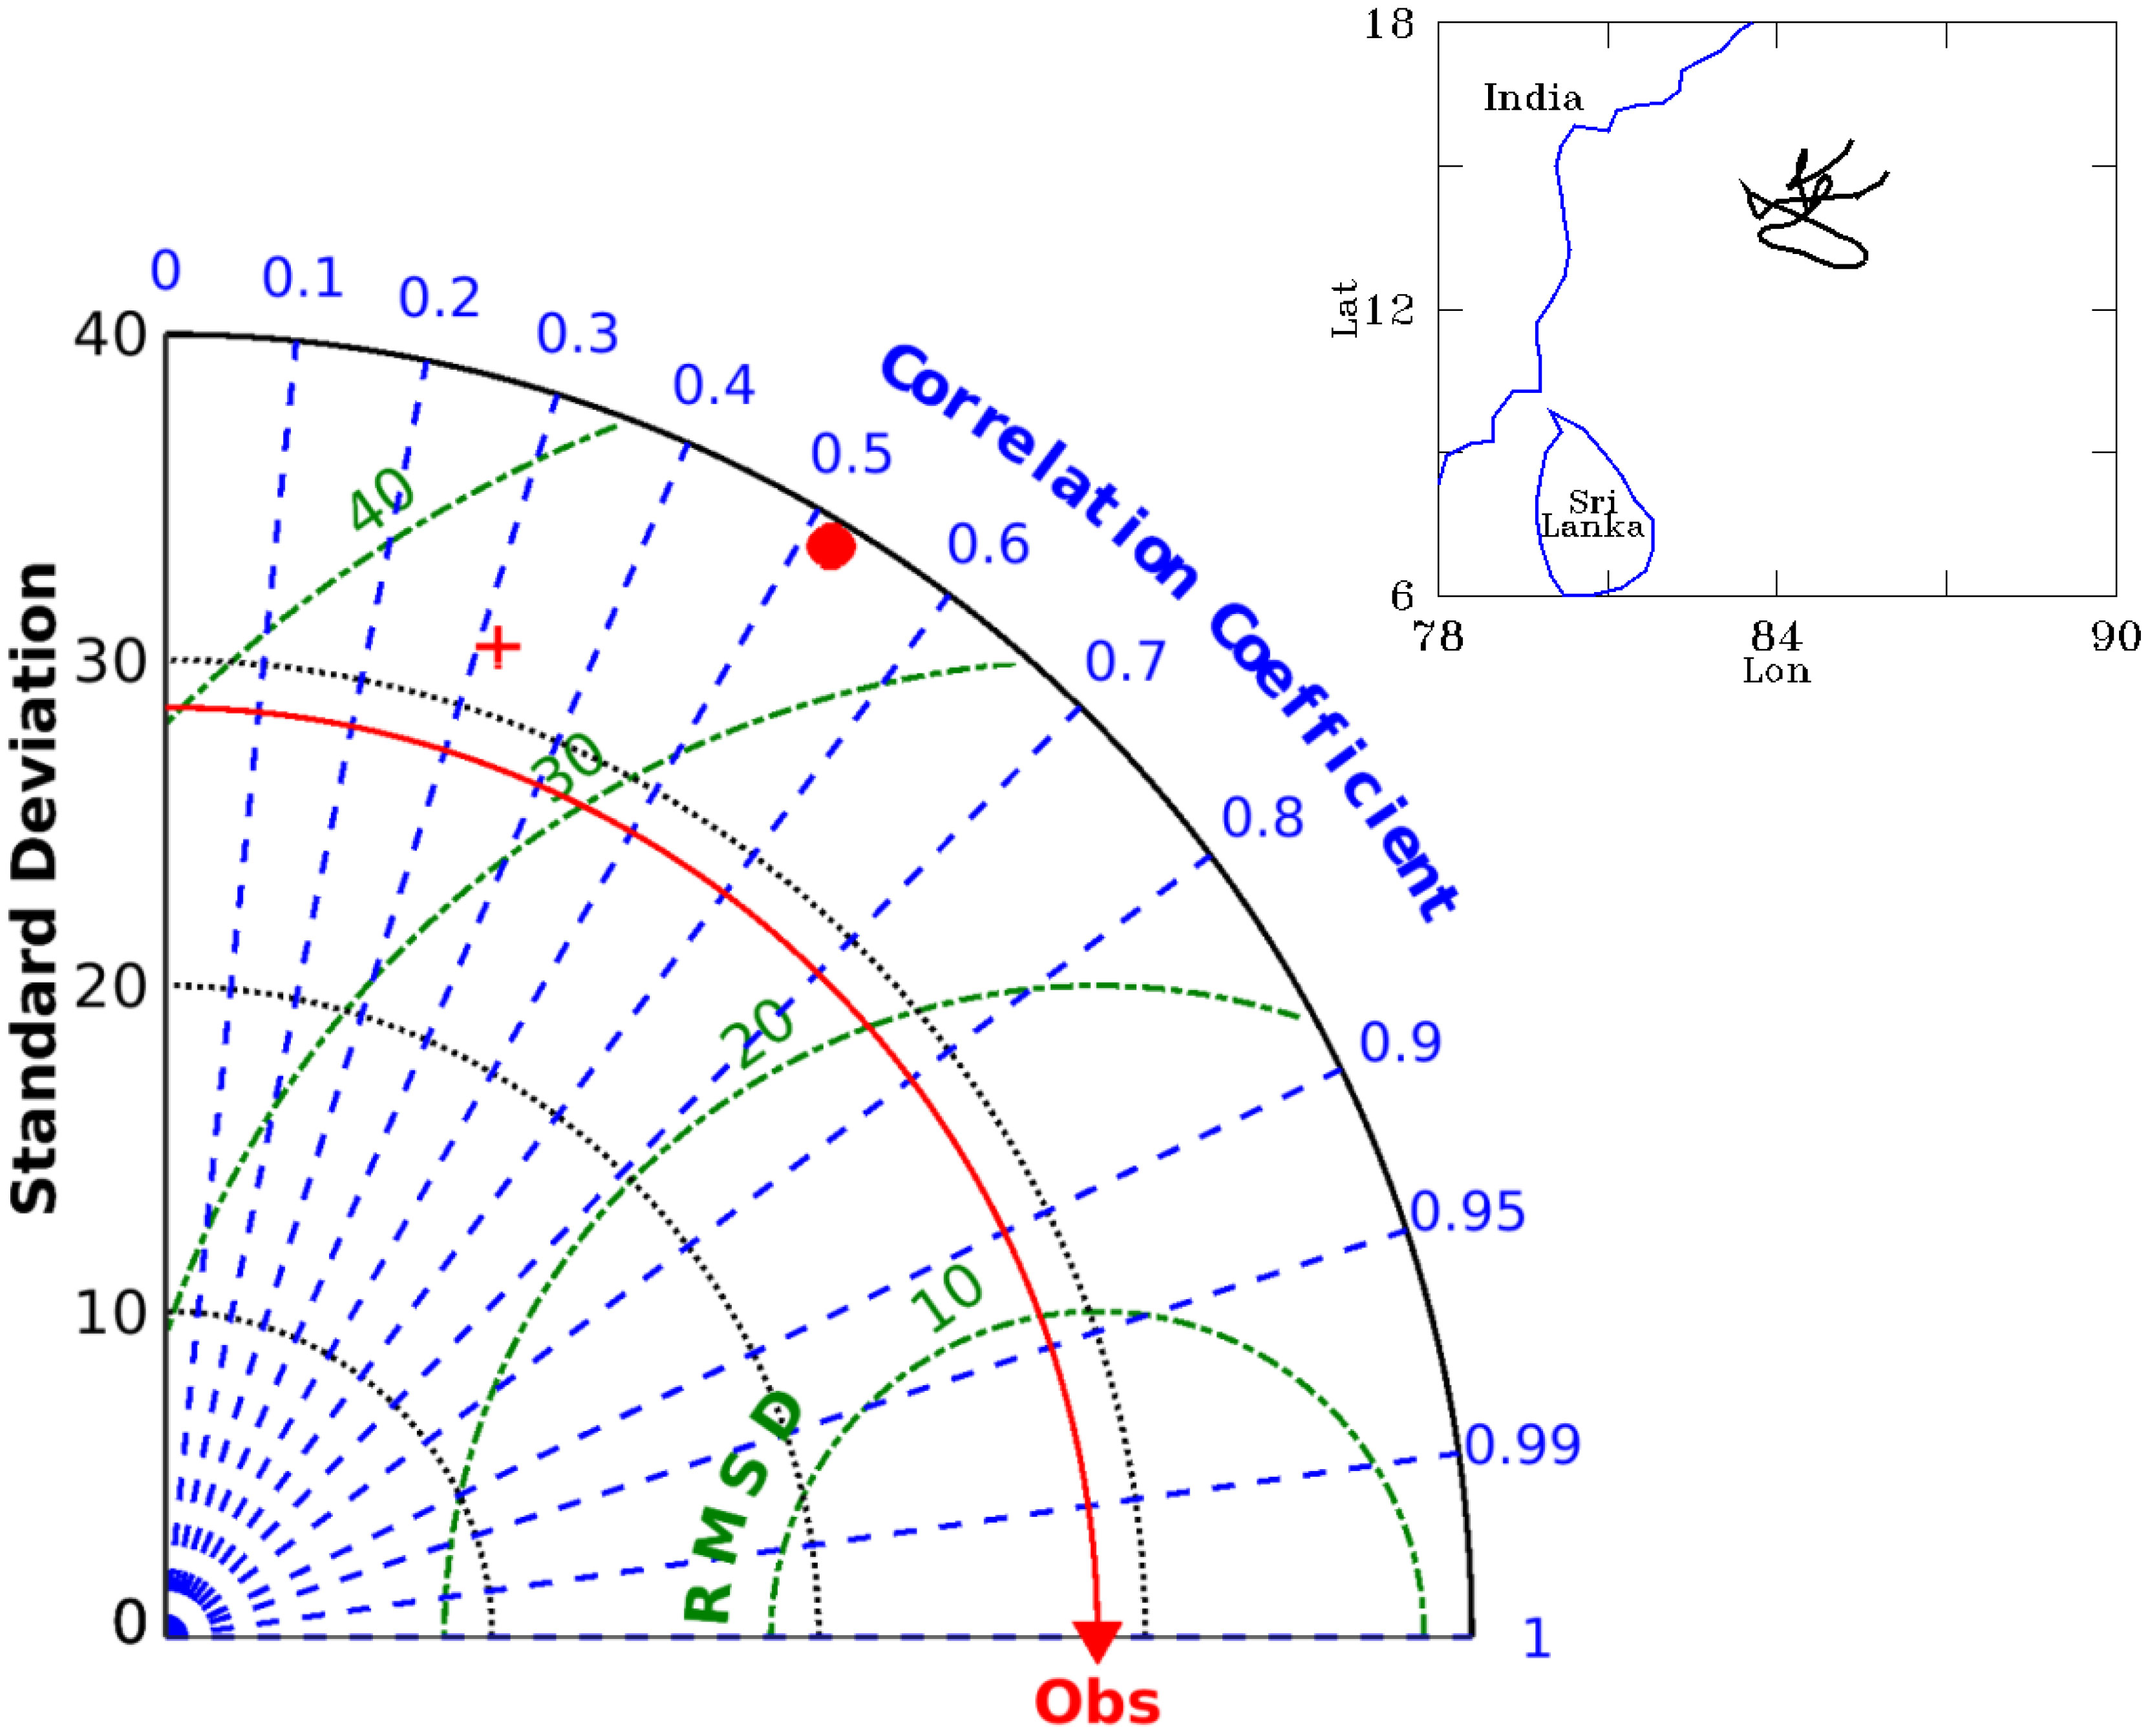
Figure 10 Taylor diagrams depicting the RMSE (unit in m), Correlation and Standard Deviation of thermocline depth from ALL (red cross) and BEN (red filled circle) with respect to along-track measurements from an ARGO in the head Bay of Bengal. The solid red curve represents the standard deviation of the observation. The dotted green curves represent RMSE contours. (Inset) Argo track (black curve) during the period of study.
The East India Coastal Currents (EICC) is one of the major events that have a prominent seasonal signal along the east coast of India. EICC flows poleward from May to October (Shankar et al., 2002; Schott et al., 2009) along the east coast of India (western Bay of Bengal). The observations from high-frequency coastal radar (HF-R) installed at approximately 11.7°N and 80.8°E on the east coast of India is used for comparison. Ocean current data were not assimilated during any of the experiments. HF-R measures hourly surface currents up to 200 km offshore with a spatial resolution of 6 km (Jena et al., 2019; Paul et al., 2021). We use daily averaged data for estimating RMSE. We compare surface currents from the BEN and ALL experiments with HF-R surface currents during the monsoon period June-September, 2017 when the stratification is large. We plot the difference in RMSE between these two experiments with respect to HF-R surface currents in Figure 11. Negative (positive) values indicate that BEN improves (degrades) the surface currents compared to ALL. We see that the zonal and meridional surface currents estimated in BEN are closer to observed EICC compared to that of ALL - particularly within the bulk of the region observed by the HF-R. We, however, do see some degradation at the edges of the domain of observation. This may be because the quality of HF-R currents at the edges is questionable (Cosoli and Bolzon, 2015; Wyatt et al., 2017). There are regions where the meridional (zonal) current has improved by more than 0.38 m/s (0.25 m/s). During the rest of the season, we do not see any significant improvement. This comparison exhibits improvements in surface currents that are limited to a small region across the east coast of India. Is this improvement extended across the entire basin of the Bay of Bengal?
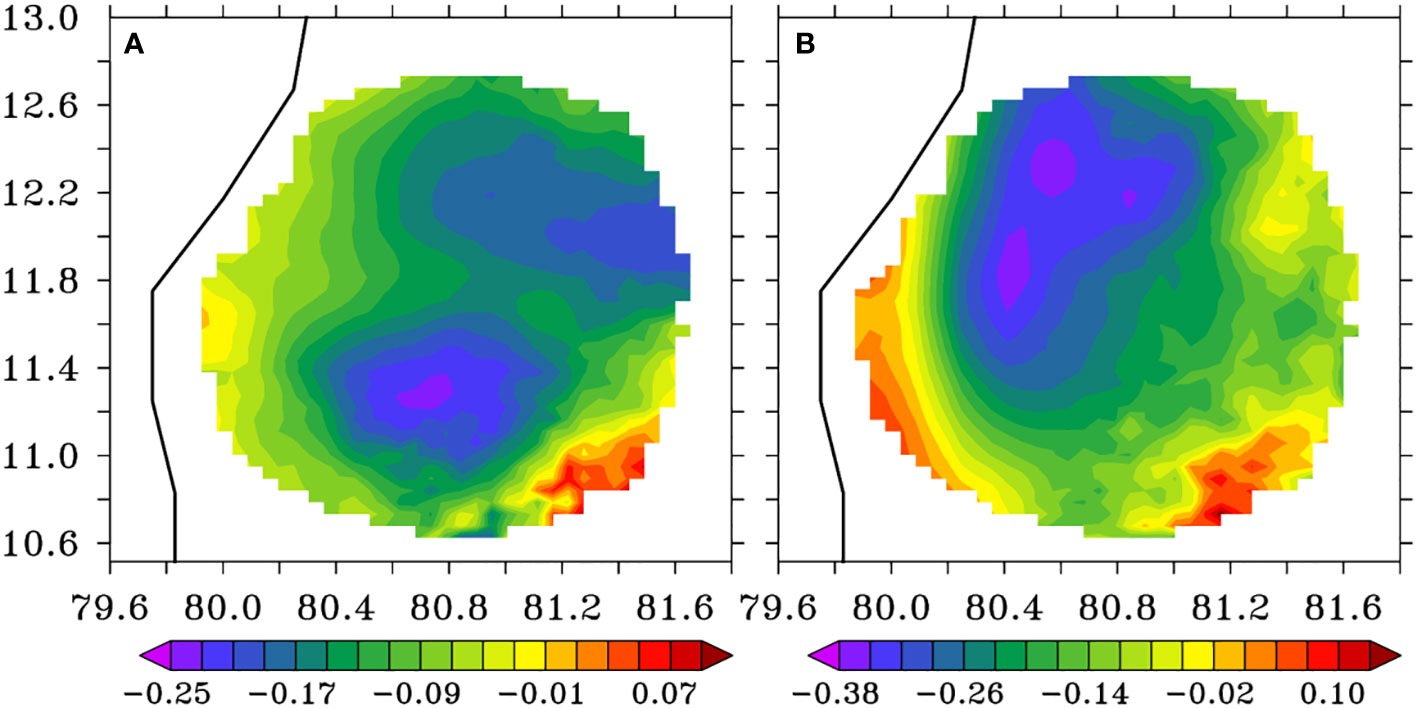
Figure 11 Difference in RMSE between BEN and ALL with respect to HF-R currents at 11.7°N and 80.8°E in (A) zonal and (B) meridional directions (unit in m/s). The black line on the left side represents the coastline.
We therefore compare the ocean surface currents averaged over the Bay of Bengal and the top 30 m from ALL and BEN with Ocean Surface Current Analysis Real-time (OSCAR) data. The mixed layer depth in the head of the Bay of Bengal is very shallow due to higher stratification and OSCAR currents capture the currents almost upto mixed layer depth (Li et al., 2017). BEN shows an overall improvement of near-surface currents along both zonal and meridional directions in the Bay of Bengal (Figure 12). The improvements are however not overwhelming.
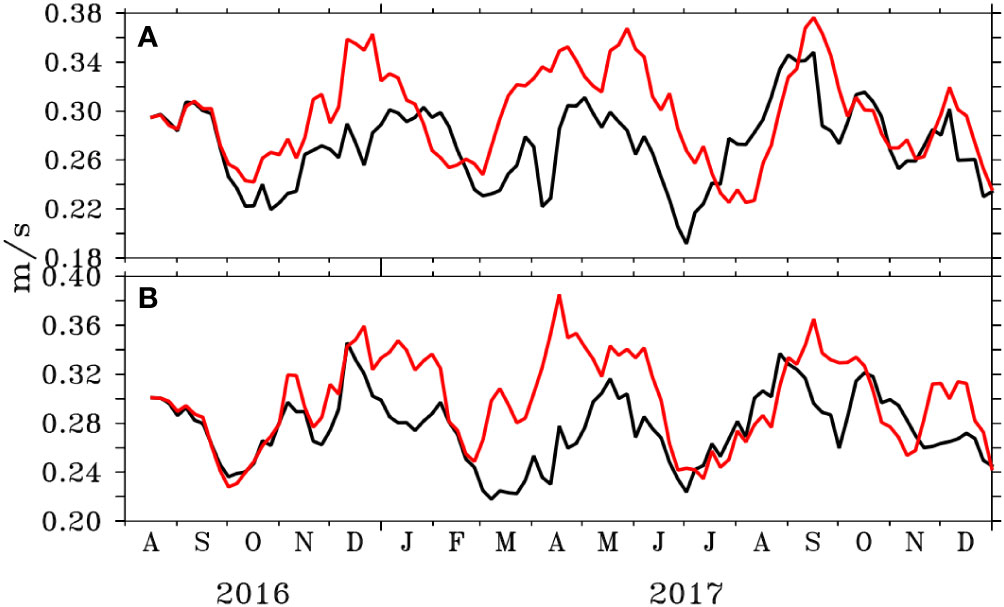
Figure 12 RMSE of (A) zonal and (B) meridional surface currents of ALL (red) and BEN (black) with respect to OSCAR currents in Bay of Bengal (unit in m/s).
Is this improvement in surface current reflected in the subsurface currents as well? We plot the time-series of zonal and meridional currents near Puri, Odisha at 86°E, 19°N (Figure 13A) during August, 2016-February, 2017 - the duration when the stratification over the Bay of Bengal is large due to monsoon and large river discharges (see Figure 1) - from Acoustic Doppler Current Profiler (ADCP), BEN and ALL. The strengthening of zonal current during October-November seen in ADCP is not captured when all observations are assimilated (ALL). However, if only beneficial observations are assimilated, the pronounced currents are captured during the late phase, i.e., during November. ALL also estimates a spurious large zonal and meridional current during February which is not vindicated by observations. BEN however manages to reduce the magnitude of this spurious current to a large extent. The subsurface currents of BEN improve in terms of reduced RMSE by ~5–10% and ~5% (Figure 13B). During the rest of the period of our study when the stratification is weaker, there is not much improvement in using beneficial observations in improving the subsurface currents.
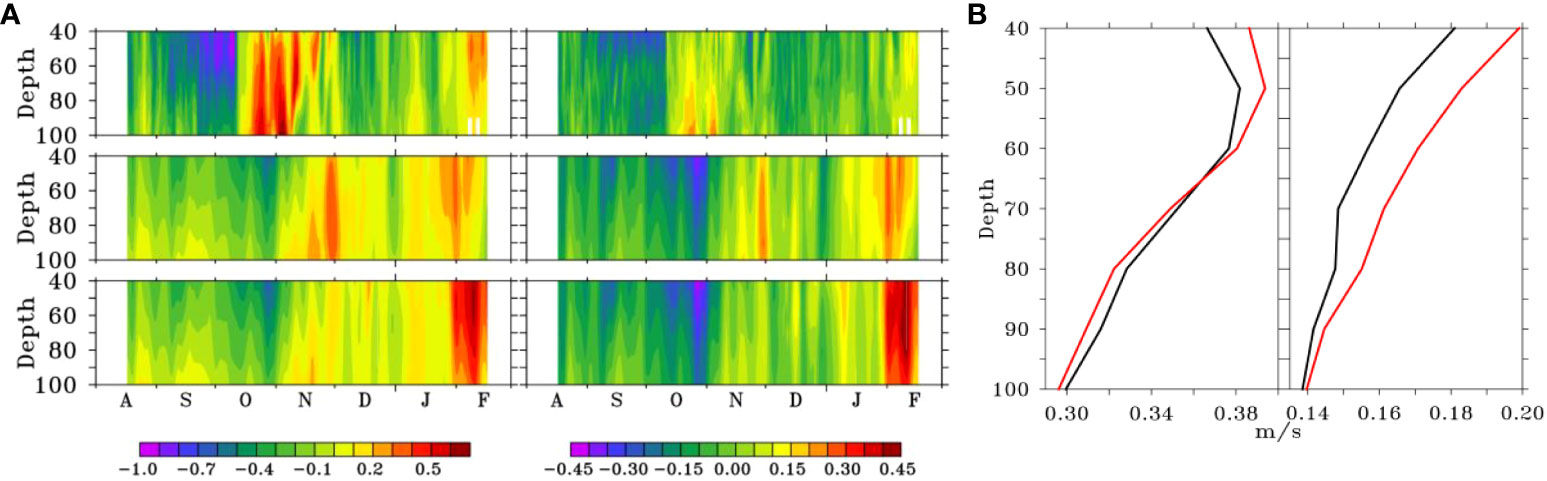
Figure 13 ADCP mooring in Bay of Bengal at 86°E, 19°N: (A) Time-depth section of ADCP (top), BEN (middle) and ALL (bottom) for zonal (left) and meridional (right) currents (unit in m/s); (B) RMSE of ALL (red) and BEN (black) currents with respect to ADCP along depth for zonal (left) and meridional (right) currents (unit in m/s).
In order to understand why the improvements are overwhelming in the Bay of Bengal, we assess the average impact of each beneficial temperature (Figure 14A) and salinity (Figure 14B) observations in the two basins along the depth on the ocean state in BEN. The impact of observations in BEN is calculated in a similar way of what is followed in ALL. This is to note that this impact should not be compared with the impact estimated in ALL because removal of detrimental or neutral observations at each assimilation cycle has cumulative effects on the background state, and the reduced number of observations exhibits a larger average impact than assimilating all the available observations. The purpose of this exercise is to compare the impact of subsurface beneficial observations in the Arabian Sea and Bay of Bengal in BEN. The impact of beneficial temperature and salinity observation in the Bay of Bengal outscores the Arabian Sea across all the depths. The largest impact of temperature (salinity) observation in the Bay of Bengal occurs at 75-100 m (50-75 m). In contrast, the largest impact of temperature (salinity) observation in the Arabian Sea occurs at 175-200 m (100-125 m) - at a much deeper depth. Also the impact of temperature transcends to a much greater depth across both the basins compared to that of the salinity. This is probably because of the larger variability in temperature at subsurface (below 200 m) compared to that of salinity across the two basins. The typical thermocline depth in the Bay of Bengal and Arabian Sea varies from ~30 m to ~110 m across the seasons (You, 1997). The larger impact of temperature and salinity in the comparatively upper layers in the Bay of Bengal ensures that the stratification and thermocline is better captured in the Bay of Bengal compared to the Arabian Sea and consequently larger improvements are seen in the ocean state in the Bay of Bengal. In short, the dynamically active sub-surface layers (top layers) in the Bay of Bengal are positively affected due to the assimilation of beneficial observations leading to an improved stratification and consequently an improved circulation - particularly during the monsoons. In contrast, the largest improvements in the Arabian Sea occur at layers which lie below or at the bottom boundary of the dynamically active zone leading to minimal or insignificant improvements in the ocean state.
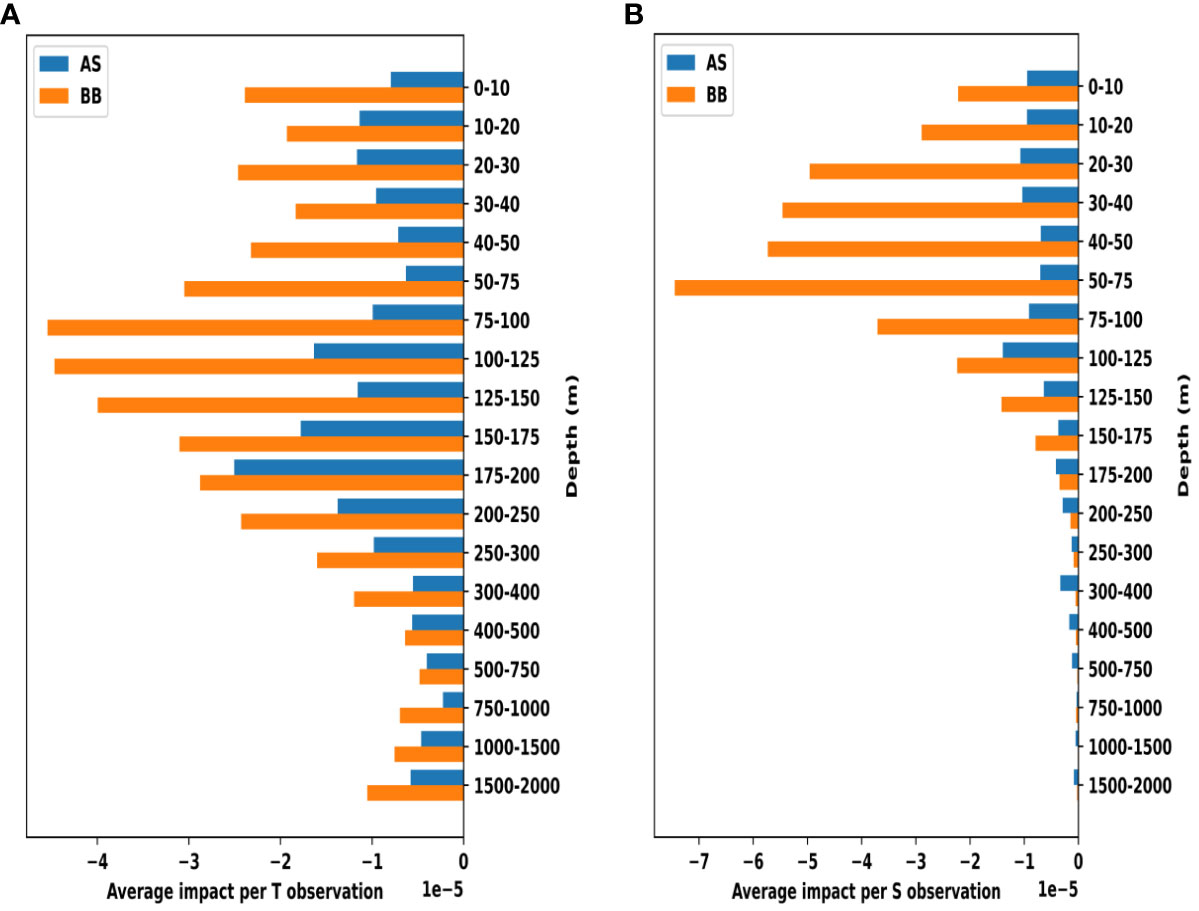
Figure 14 Average impact of each beneficial (A) Temperature and (B) Salinity observation in the Arabian Sea (blue) and Bay of Bengal (orange) at different depths.
In this study, we have explored the feasibility of using ensemble forecast sensitivity to observations (EFSO) in ocean models which, until now, have not been studied adequately in the ocean to the best of our knowledge. Unlike using some conventional energy norm as the squared norm, we instead used the modulus of the baroclinic vector to identify the observations that are beneficial to the data assimilation system, i.e., observations that improve ocean analysis. Only ~50% of the observations improve the ocean analysis while the rest are neutral or degrade the ocean state.
We see that the number of beneficial observations in the Bay of Bengal exceeds that in the Arabian Sea if the modulus of the baroclinic vector is chosen to be the squared norm - particularly in sub-surface. Using only these beneficial observations improves the thermocline in the Bay of Bengal. This improvement is most prominent in regions of large stratification, i.e., the closer we get to the head Bay, the more pronounced the improvements are. These improvements are translated into the improvements of ocean circulation in both surface and sub-surface in the Bay of Bengal. This is expected because an improved estimation of baroclinicity improves the circulation of the ocean (see equation 2.2.7 or 2.4.6 in Pedlosky, 1987). These improvements are most pronounced during the monsoon when the stratification is large in the Bay of Bengal.
Recent literature shows that locally assimilating many more observations than ensemble size may degrade analysis, and the analysis can be improved just by reducing the number of observations to be assimilated (Hotta and Ota, 2021). So, it can be argued that the improvements in a small ensemble system (20 members) like BEN can be attributed to a mere reduction in the number of observations by ~50% compared to its parent system which comprises 80 ensemble members (Hamrud et al., 2015; Schraff et al., 2016) and therefore the improvements may not be attributable to the chosen squared norm. In order to explore this possibility, we have conducted an additional experiment called “DET” where only the detrimental or neutral observations are assimilated. Interestingly, almost the same number of observations goes in the assimilation system in both DET and BEN (see Figure 5). We see that even though DET improves upon ALL - most likely because of a reduction in the number of observations - it significantly falls behind BEN (Figure 9). This establishes that the improvement seen in BEN is not merely an artefact of the reduction in numbers of observations.
The absence of daily river discharges in the model (due to lack of data) used to conduct these EFSO experiments poses a serious challenge in estimating the ocean state. This challenge is compounded in the Bay of Bengal particularly owing to large freshwater fluxes that pours in from rivers like Ganges and Brahmaputra. A part of this challenge is mitigated by weakly relaxing the model surface salinity to monthly climatology over a relaxation time scale of 30 days. A major part of this challenge is expected to be overcome using in-situ salinity observations in data assimilation. How well do these salinity observations fare in improving the ocean state? The average impact of salinity observation in the Bay of Bengal and the Arabian Sea are shown in Figures 7 and 14B from ALL and BEN. We see that when all observations are assimilated in ALL, salinity observations degrade the ocean state in the Arabian Sea below 125 m. However, in the Bay of Bengal, there are improvements till ~100-125 m after which the improvements are negligible. Once “bad” observations are removed from the assimilation system, significant improvements are seen in the Bay of Bengal and Arabian Sea. The impact in the Bay of Bengal is more pronounced and is also subsequently reflected in the improvement in the ocean state of the Bay. There are positive impacts on the Arabian Sea but are not transcended to significant improvements in the ocean state of the Arabian Sea because of two probable reasons - 1) the impact in the Arabian Sea per beneficial salinity observation is about 5-6 fold less compared to that of the Bay of Bengal, and 2) the spatio-temporal sampling of salinity in the Arabian Sea (Figure 8G) is inferior to that in the Bay of Bengal (Figure 8H).
This is reflected in the lack of improvement in the circulation in the Arabian Sea. We observe that this strategy does not improve the surface or subsurface circulation in the Arabian Sea (Figure 15) either near the coast or in the open ocean. But this strategy does not degrade the circulation either. In short, this strategy helps in identifying the beneficial observations that improve the ocean state in the Bay of Bengal and has limited or no influence on the ocean state in the Arabian Sea. We believe that this is because of the choice of the squared norm since the criterion of identifying beneficial observation depends on the choice of the norm.
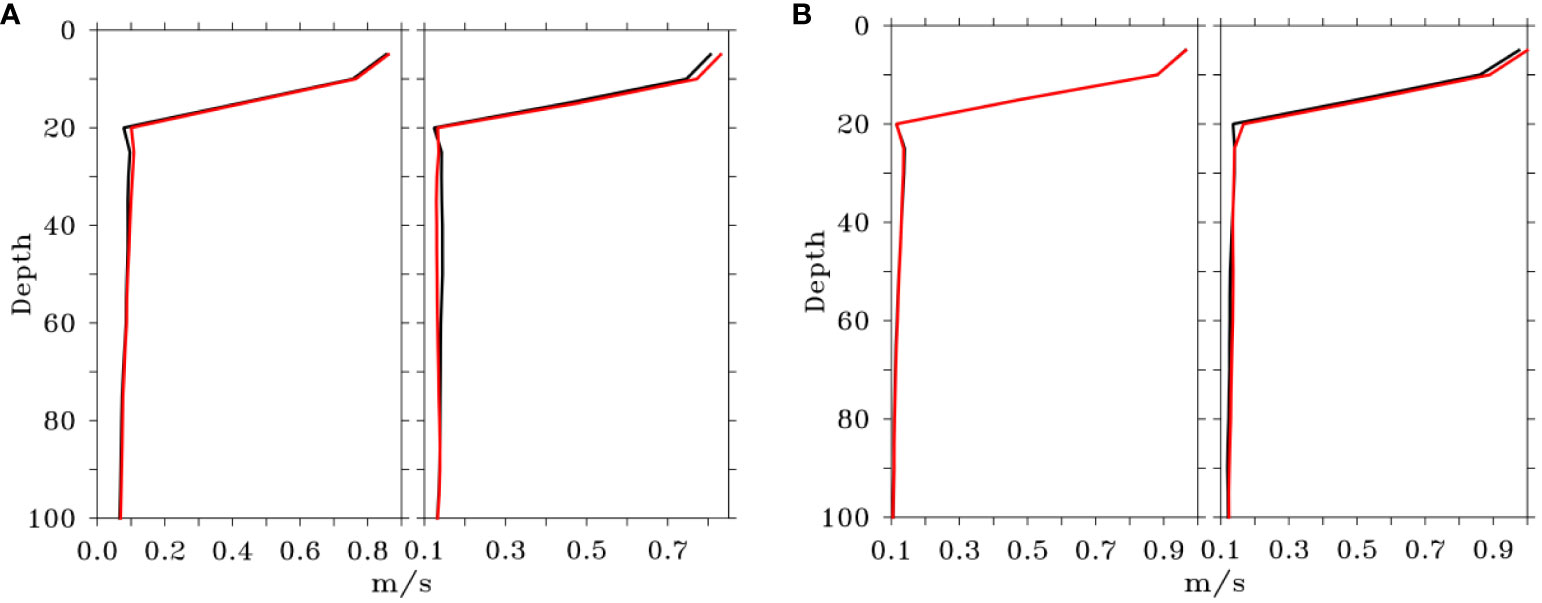
Figure 15 (A) RMSE of zonal (left) and meridional (right) currents of ALL (red) and BEN (black) at 73.4°E, 14°N in Arabian Sea; (B) RMSE of zonal (left) and meridional (right) currents of ALL (red) and BEN (black) at 69.2°E, 20°N in Arabian Sea.
We have tested EFSO with other possible norms, e.g., 1) Total energy, 2) Kinetic energy, 3) Relative vorticity, and 4) Potential vorticity. But none of these norms have produced an adequate improvement in model state in any of the basins like what baroclinic vector as norm does. Assimilating the beneficial observations determined using total or kinetic energy as squared norm degrades the subsurface currents in the Bay of Bengal and does not improve temperature or salinity profiles. Also assimilating the beneficial observations determined using vorticity as squared norm has a mixed effects on simulating subsurface currents and thermocline structure. We are exploring other squared norms that will have positive impacts across the basins.
EFSO is a handy tool for assessing the impact of assimilated observations for all operational agencies like INCOIS which use ensemble assimilation systems for their ocean forecast. However, increased effort is needed to come up with a holistic strategy that improves the ocean state across the regions. This is reserved for future work.
The raw data supporting the conclusions of this article will be made available by the authors, without undue reservation.
BP: Writing – review & editing, Writing – original draft, Visualization, Validation, Software, Methodology, Investigation, Formal analysis, Data curation. BB: Writing – review & editing, Writing – original draft, Visualization, Software, Investigation, Formal analysis, Data curation. AP: Writing – review & editing, Writing – original draft, Supervision, Resources, Project administration, Methodology, Investigation, Conceptualization.
The author(s) declare that no financial support was received for the research, authorship, and/or publication of this article.
The authors wish to thank Prof. (Dr.) Eugenia Kalnay, Distinguished University Professor, Department of Atmospheric and Oceanic Science, University of Maryland, College Park, MD for her valuable suggestions on the methodology of EFSO at the very initial stage. The authors acknowledge the facility and support provided by Dr. T. Srinivasa Kumar, Director, INCOIS. The authors thank the Editor Elisabeth Remy of Mercator Ocean, France, and the Reviewers Siva Reddy Sanikommu of King Abdullah University of Science and Technology, Saudi Arabia, and Andrew Michael Moore of University of California, Santa Cruz, United States for their valuable suggestions and comments, which improved the quality and readability of the manuscript. This is INCOIS contribution number 514.
The authors declare that the research was conducted in the absence of any commercial or financial relationships that could be construed as a potential conflict of interest.
All claims expressed in this article are solely those of the authors and do not necessarily represent those of their affiliated organizations, or those of the publisher, the editors and the reviewers. Any product that may be evaluated in this article, or claim that may be made by its manufacturer, is not guaranteed or endorsed by the publisher.
Afroosa M., Rohith B., Paul A., Durand F., Bourdallé-Badie R., Sreedevi P. V., et al. (2021). Madden-Julian oscillation winds excite an intraseasonal see-saw of ocean mass that affects Earth’s polar motion. Commun. Earth Environ. 2, 1–8. doi: 10.1038/s43247-021-00210-x
Anderson J. L. (2007). Exploring the need for localization in ensemble data assimilation using a hierarchical ensemble filter. Physica D: Nonlinear Phenomena 230, 99–111. doi: 10.1016/j.physd.2006.02.011
Antonov J. I., Seidov D., Boyer T. P., Locarnini R. A., Mishonov A. V., Garcia H. E., et al. (2010). World Ocean Atlas 2009, Volume 2: Salinity, NOAA Atlas NESDIS 69. Ed. Levitus S. [Doctoral dissertation]. (US Government Printing Office: Washington, DC), 184.
Baduru B., Paul B., Banerjee D. S., Sanikommu S., Paul A. (2019). Ensemble based regional ocean data assimilation system for the Indian Ocean: Implementation and evaluation. Ocean Model. 143, 101470. doi: 10.1016/j.ocemod.2019.101470
Balaji B., Banerjee D. S., Paul B., Sivareddy S., Francis P. A., Chatterjee A., et al. (2018). LETKF-ROMS: An improved predictability system for the Indian Ocean. INCOIS Technical reports. ESSO-INCOIS-MDG-TR-03(2018). 1 (1–96). Available at: https://incois.gov.in/documents/rain_reports/ESSO-INCOIS-MDG-TR-03_(2018).pdf.
Balmaseda M., Anderson D., Vidard A. (2007). Impact of Argo on analyses of the global ocean. Geophysical Res. Lett. 34, L16605 . doi: 10.1029/2007GL030452
Chatterjee A., Shankar D., McCreary J. P., Vinayachandran P. N., Mukherjee A. (2017). Dynamics of A ndaman S ea circulation and its role in connecting the equatorial I ndian O cean to the B ay of B engal. J. Geophysical Research: Oceans 122, 3200–3218. doi: 10.1002/2016JC012300
Chen T. C., Kalnay E. (2019). Proactive quality control: Observing system simulation experiments with the Lorenz ‘96 model. Monthly Weather Rev. 147, 53–67. doi: 10.1175/MWR-D-18-0138.1
Cheng X., McCreary J. P., Qiu B., Qi Y., Du Y., Chen X. (2018). Dynamics of eddy generation in the central Bay of Bengal. J. Geophysical Research: Oceans 123, 6861–6875. doi: 10.1029/2018JC014100
Cosoli S., Bolzon G. (2015). Accuracy of surface current mapping from High-Frequency (HF) ocean radars. Bollettino di Geofisica Teorica ed Applicata 56, 55–70. doi: 10.4430/bgta0132
Drake P., Edwards C. A., Arango H. G., Wilkin J., TajalliBakhsh T., Powell B., et al. (2023). Forecast Sensitivity-based Observation Impact (FSOI) in an analysis–forecast system of the California Current Circulation. Ocean Model. 182, 102159. doi: 10.1016/j.ocemod.2022.102159
Ehrendorfer M., Errico R. M., Raeder K. D. (1999). Singular-vector perturbation growth in a primitive equation model with moist physics. J. Atmospheric Sci. 56, 1627–1648. doi: 10.1175/1520-0469(1999)056<1627:SVPGIA>2.0.CO;2
Ferrer L., Fontán A., Mader J., Chust G., González M., Valencia V., et al. (2009). Low-salinity plumes in the oceanic region of the Basque Country. Continental Shelf Res. 29, 970–984. doi: 10.1016/j.csr.2008.12.014
Francis P. A., Jithin A. K., Effy J. B., Chatterjee A., Chakraborty K., Paul A., et al. (2020). High-resolution operational ocean forecast and reanalysis system for the Indian ocean. Bull. Am. Meteorological Soc. 101, E1340–E1356. doi: 10.1175/BAMS-D-19-0083.1
Francis P. A., Jithin A. K., Effy J. B., Chatterjee A., Chakraborty K., Paul A., et al. (2021). HOOFS: the operational ocean forecast system of India. Bull. Am. Meteorological Soc. 102, 137–142. doi: 10.1175/BAMS-D-19-0083.A
Francis P. A., Vinayachandran P. N., Shenoi S. S. C. (2013). The Indian ocean forecast system. Curr. Sci. 104 (10), 1354–1368.
Fujii Y., Rémy E., Zuo H., Oke P., Halliwell G., Gasparin F., et al. (2019). Observing system evaluation based on ocean data assimilation and prediction systems: on-going challenges and a future vision for designing and supporting ocean observational networks. Front. Mar. Sci. 6,417. doi: 10.3389/fmars.2019.00417
Gelaro R., Langland R. H., Pellerin S., Todling R. (2010). The THORPEX observation impact intercomparison experiment. Monthly Weather Rev. 138, 4009–4025. doi: 10.1175/2010MWR3393.1
Haidvogel D. B., Arango H. G., Hedstrom K., Beckmann A., Malanotte-Rizzoli P., Shchepetkin A. F. (2000). Model evaluation experiments in the North Atlantic Basin: simulations in nonlinear terrain-following coordinates. Dynamics atmospheres oceans 32, 239–281. doi: 10.1016/S0377-0265(00)00049-X
Hallberg R. (2013). Using a resolution function to regulate parameterizations of oceanic mesoscale eddy effects. Ocean Model. 72, 92–103. doi: 10.1016/j.ocemod.2013.08.007
Halliwell G. R. (2004). Evaluation of vertical coordinate and vertical mixing algorithms in the HYbrid-Coordinate Ocean Model (HYCOM). Ocean Model. 7, 285–322. doi: 10.1016/j.ocemod.2003.10.002
Hamrud M., Bonavita M., Isaksen L. (2015). EnKF and hybrid gain ensemble data assimilation. Part I: EnKF implementation. Monthly Weather Rev. 143, 4847–4864. doi: 10.1175/MWR-D-14-00333.1
Hotta D., Chen T. C., Kalnay E., Ota Y., Miyoshi T. (2017). Proactive QC: A fully flow-dependent quality control scheme based on EFSO. Monthly Weather Rev. 145, 3331–3354. doi: 10.1175/MWR-D-16-0290.1
Hotta D., Ota Y. (2021). Why does EnKF suffer from analysis overconfidence? An insight into exploiting the ever-increasing volume of observations. Q. J. R. Meteorological Soc. 147, 1258–1277. doi: 10.1002/qj.3970
Hunt B. R., Kostelich E. J., Szunyogh I. (2007). Efficient data assimilation for spatiotemporal chaos: A local ensemble transform Kalman filter. Physica D: Nonlinear Phenomena 230, 112–126. doi: 10.1016/j.physd.2006.11.008
Jena B. K., Arunraj K. S., Suseentharan V., Tushar K., Karthikeyan T. (2019). Indian coastal ocean radar network. Curr. Sci. 116, 372–378. doi: 10.18520/cs/v116/i3/372-378
Kalnay E., Ota Y., Miyoshi T., Liu J. (2012). A simpler formulation of forecast sensitivity to observations: Application to ensemble Kalman filters. Tellus A: Dynamic Meteorology Oceanography 64, 18462. doi: 10.3402/tellusa.v64i0.18462
Khan S., Piao S., Khan I. U., Xu B., Khan S., Ismail M. A., et al. (2021). Variability of SST and ILD in the arabian sea and sea of Oman in association with the monsoon cycle. Math. Problems Eng. 2021 (9958257), 1–15. doi: 10.1155/2021/9958257
Langland R. H., Baker N. L. (2004). Estimation of observation impact using the NRL atmospheric variational data assimilation adjoint system. Tellus A: Dynamic Meteorology Oceanography 56, 189–201. doi: 10.3402/tellusa.v56i3.14413
Large W. G., Gent P. R. (1999). Validation of vertical mixing in an equatorial ocean model using large eddy simulations and observations. J. Phys. Oceanography 29, 449–464. doi: 10.1175/1520-0485(1999)029<0449:VOVMIA>2.0.CO;2
Large W. G., McWilliams J. C., Doney S. C. (1994). Oceanic vertical mixing: A review and a model with a nonlocal boundary layer parameterization. Rev. geophysics 32, 363–403. doi: 10.1029/94RG01872
Li X., Chao Y., McWilliams J. C., Fu L. L. (2001). A comparison of two vertical-mixing schemes in a Pacific Ocean general circulation model. J. Climate 14, 1377–1398. doi: 10.1175/1520-0442(2001)014<1377:ACOTVM>2.0.CO;2
Li Y., Han W., Ravichandran M., Wang W., Shinoda T., Lee T. (2017). Bay of Bengal salinity stratification and Indian summer monsoon intraseasonal oscillation: 1. Intraseasonal variability and causes. J. Geophysical Research: Oceans 122, 4291–4311. doi: 10.1002/2017JC012691
Lien G. Y., Hotta D., Kalnay E., Miyoshi T., Chen T. C. (2018). Accelerating assimilation development for new observing systems using EFSO. Nonlinear Processes Geophysics 25, 129–143. doi: 10.5194/npg-25-129-2018
Lorenc A. C., Marriott R. T. (2014). Forecast sensitivity to observations in the Met Office global numerical weather prediction system. Q. J. R. Meteorological Soc. 140, 209–224. doi: 10.1002/qj.2122
Mellor G. L., Yamada T. (1982). Development of a turbulence closure model for geophysical fluid problems. Rev. Geophysics 20, 851–875. doi: 10.1029/RG020i004p00851
Murtugudde R., Seager R., Thoppil P. (2007). Arabian Sea response to monsoon variations. Paleoceanography 22, PA4217. doi: 10.1029/2007PA001467
Nurujjaman M., Apte A., Vinayachandran P. (2013). Data assimilation using ensemble transform Kalman filter (ETKF) in ROMS model for Indian Ocean. Eur. Phys. J. Special Topics 222, 875–883. doi: 10.1140/epjst/e2013-01890-3
Ota Y., Derber J. C., Kalnay E., Miyoshi T. (2013). Ensemble-based observation impact estimates using the NCEP GFS. Tellus A: Dynamic Meteorology Oceanography 65, 20038. doi: 10.3402/tellusa.v65i0.20038
Paul B., Baduru B., Paul A., Francis P. A., Shetye S. R. (2021). Absence of the annual cycle in shelf current inshore of the East Indian Coastal Current. Continental Shelf Res. 215, 104355. doi: 10.1016/j.csr.2021.104355
Prasad V. S., Johny C. J., Sodhi J. S. (2016). Impact of 3D Var GSI-ENKF hybrid data assimilation system. J. Earth System Sci. 125, 1509–1521. doi: 10.1007/s12040-016-0761-3
Reid R. O., Elliott B. A., Olson D. B. (1981). Available potential energy: A clarification. J. Phys. Oceanography 11, 15–29. doi: 10.1175/1520-0485(1981)011<0015:APEAC>2.0.CO;2
Reynolds R. W., Ji M., Leetmaa A. (1998). Use of salinity to improve ocean modeling. Phys. Chem. Earth 23, 543–553. doi: 10.1016/S0079-1946(98)00068-8
Rohith B., Paul A., Durand F., Testut L., Prerna S., Afroosa M., et al. (2019). Basin-wide sea level coherency in the tropical Indian Ocean driven by Madden–Julian Oscillation. Nat. Commun. 10, 1–9. doi: 10.1038/s41467-019-09243-5
Sanikommu S., Banerjee D. S., Baduru B., Paul B., Paul A., Chakraborty K., et al. (2019). Impact of dynamical representational errors on an Indian Ocean ensemble data assimilation system. Q. J. R. Meteorological Soc. 145, 3680–3691. doi: 10.1002/qj.3649
Schott F. A., Xie S. P., McCreary J. P. Jr. (2009). Indian Ocean circulation and climate variability. Rev. Geophysics 47, RG1002. doi: 10.1029/2007RG000245
Schraff C., Reich H., Rhodin A., Schomburg A., Stephan K., Periáñez A., et al. (2016). Kilometre-scale ensemble data assimilation for the COSMO model (KENDA). Q. J. R. Meteorological Soc. 142, 1453–1472. doi: 10.1002/qj.2748
Shankar D., Vinayachandran P. N., Unnikrishnan A. S. (2002). The monsoon currents in the north Indian Ocean. Prog. oceanography 52, 63–120. doi: 10.1016/S0079-6611(02)00024-1
Shchepetkin A. F., McWilliams J. C. (2005). The regional oceanic modeling system (ROMS): a split-explicit, free-surface, topography-following-coordinate oceanic model. Ocean Model. 9, 347–404. doi: 10.1016/j.ocemod.2004.08.002
Sivareddy S., Paul A., Sluka T., Ravichandran M., Kalnay E. (2017). The pre-Argo ocean reanalyses may be seriously affected by the spatial coverage of moored buoys. Sci. Rep. 7, 1–8. doi: 10.1038/srep46685
Song Y., Haidvogel D. (1994). A semi-implicit ocean circulation model using a generalized topography-following coordinate system. J. Comput. Phys. 115, 228–244. doi: 10.1006/jcph.1994.1189
Treguier A. M., Held I. M., Larichev V. D. (1997). Parameterization of quasi geostrophic eddies in primitive equation ocean models. J. Phys. Oceanography 27, 567–580. doi: 10.1175/1520-0485(1997)027<0567:POQEIP>2.0.CO;2
Waters J., Bell M. J., Martin M. J., Lea D. J. (2017). Reducing ocean model imbalances in the equatorial region caused by data assimilation. Q. J. R. Meteorological Soc. 143, 195–208. doi: 10.1002/qj.2912
Wyatt L. R., Mantovanelli A., Heron M. L., Roughan M., Steinberg C. R. (2017). Assessment of surface currents measured with high-frequency phased-array radars in two regions of complex circulation. IEEE J. Oceanic Eng. 43, 484–505. doi: 10.1109/JOE.2017.2704165
Xu F. H., Oey L. Y. (2014). State analysis using the Local Ensemble Transform Kalman Filter (LETKF) and the three-layer circulation structure of the Luzon Strait and the South China Sea. Ocean Dynamics 64, 905–923. doi: 10.1007/s10236-014-0720-y
Ying Y., Zhang F., Anderson J. L. (2018). On the selection of localization radius in ensemble filtering for multiscale quasigeostrophic dynamics. Monthly Weather Rev. 146, 543–560. doi: 10.1175/MWR-D-17-0336.1
Keywords: ensemble forecast sensitivity to observations, local ensemble transform Kalman filter, ocean general circulation models, Indian Ocean, Bay of Bengal
Citation: Paul B, Baduru B and Paul A (2024) A study of forecast sensitivity to observations in the Bay of Bengal using LETKF. Front. Mar. Sci. 11:1340129. doi: 10.3389/fmars.2024.1340129
Received: 17 November 2023; Accepted: 29 February 2024;
Published: 13 March 2024.
Edited by:
Elisabeth Remy, Mercator Ocean, FranceReviewed by:
Siva Reddy Sanikommu, King Abdullah University of Science and Technology, Saudi ArabiaCopyright © 2024 Paul, Baduru and Paul. This is an open-access article distributed under the terms of the Creative Commons Attribution License (CC BY). The use, distribution or reproduction in other forums is permitted, provided the original author(s) and the copyright owner(s) are credited and that the original publication in this journal is cited, in accordance with accepted academic practice. No use, distribution or reproduction is permitted which does not comply with these terms.
*Correspondence: Biswamoy Paul, Ymlzd2Ftb3kucEBpbmNvaXMuZ292Lmlu
Disclaimer: All claims expressed in this article are solely those of the authors and do not necessarily represent those of their affiliated organizations, or those of the publisher, the editors and the reviewers. Any product that may be evaluated in this article or claim that may be made by its manufacturer is not guaranteed or endorsed by the publisher.
Research integrity at Frontiers
Learn more about the work of our research integrity team to safeguard the quality of each article we publish.