 Wiebke Aldenhoff
 Jürgen Holfort*
- Abteilung für Meereskunde, Referat Eisdienst und Wasserstandsdienst Ostsee, Bundesamt für Seeschifffahrt und Hydrographie, Rostock, Germany
The ice service at the German Federal Maritime and Hydrographic Agency and its predecessors has been committed to the safety and easiness of ship navigation for more than 100 years. Within this paper, an overview of the operational products issued by the German ice service on a daily to weekly basis throughout the northern hemisphere winter season is given. These comprise written reports, ice charts, NAVTEX messages, and messages via the Global Telecommunication System to inform about the sea ice situation in German coastal waters, the Baltic Sea, and worldwide. Furthermore, the ice service has systematically collected ice observation data along the German North Sea and Baltic Sea coast since the winter of 1896/1897. The history of the German ice service is presented to put the sea ice data into context of the observation technologies used in the course of the existence of the ice service. These long-term observations enable climatological analyses of the sea ice cover in German coastal waters necessary for the safe operation of offshore infrastructure. An evaluation of the data shows a recent decline in sea ice occurrence in the Baltic Sea and German Bight. Current work is ongoing to preserve more of the historic data in digital form and also to transform the products to conform to modern standards in digital technologies and interactive solutions for the customers.
1 Introduction
For more than a hundred years, the German ice service has been committed to the safety and ease of shipping in German coastal waters and ice-infested waters worldwide. The ice service started its regular ice observation and ice information service in the winter of 1896/1897 as part of the “Deutsche Seewarte”. Ice observing stations along the coast sent daily ice information in coded form by telegraph that were published as part of the marine weather report. In the 1920s, international cooperation intensified between countries bordering the Baltic Sea and resulted in the first standardized sea ice code used for sea ice observations. In 1928/1929, the publication of the “Eisbericht”, the first stand-alone ice report, started. Until today, this is the main written publication of sea ice information in the Baltic Sea and German Bight published by the German ice service. The creation of ice charts started in the winter of 1927/1928. From the end of World War II until the German reunification, independent ice services existed in the Federal Republic of Germany and the German Democratic Republic, each taking responsibility for their respective sea areas. Since the reunification in 1990, the German ice service is part of the Federal Maritime and Hydrographic Agency [Bundesamt für Seeschifffahrt und Hydrographie (BSH)] and today is located in Rostock. The operation of the ice service is legally delegated to the BSH by the Federal Maritime Responsibilities Act (§1 paragraph 9c and §5 paragraph 1). The main task of the ice service is the delivery of sea ice information along the German North Sea and Baltic Sea coasts as well as the Baltic Sea to mariners and the public. To fulfill its duties, the ice service publishes several different operational ice products, i.e., written ice reports, ice charts, and NAVTEX or Global Telecommunication System (GTS) (WMO, 2015) messages, throughout the ice season, usually from about October to June.
In the early years of the ice service, manual ice observations at the different ice stations were the primary source of information. Sea ice information outside coastal areas were only accessible as long as ship traffic was possible. With advances in aeronautics, air reconnaissance started to be a valuable source of information after World War I. Space-borne optical imagery became available in the course of the 1960s (Strübing, 1970). Cloud cover and lack of solar illumination in higher latitudes, however, limited the use of such imagery for ice observations. Passive microwave radiometry overcame these limitations and has been the main source for systematical monitoring of the world’s sea ice cover since 1979. Microwave radiation is almost unaffected by the atmosphere and independent of solar illumination, thus delivering year-round information. The relative coarse resolution, however, limits the use for navigation in ice-infested waters and general observations of sea ice in coastal waters. Synthetic aperture radar (SAR) imagery starting operationally with ERS-1 in 1991 took available sea ice information to the next level. Nowadays, especially with the freely available data from the Copernicus Sentinel Program and a number of commercial and state-owned SAR-carrying satellites, SAR imagery is the prime information source not only for the German ice service but also for ice services around the world. Furthermore, optical remote sensing data is a great asset of high-resolution information if the cloud cover is not too dense. Manual ice observations are, however, still a valuable source of information in coastal areas and harbors and maintain the long-time series of station observations. At present, the availability of remote sensing data is rapidly increasing in space and time. This challenges the ice services to convey the latest available information to the customers. This is of great importance as sea ice is constantly changing and up-to-date, and timely information are therefore necessary to ensure safe navigation.
Sea ice is also an import indicator of climate change (Garcia-Soto et al., 2021). The interannual variability of sea ice occurrence in German waters requires a long time series to separate climate and weather effects. More-than-a-century-long history of sea ice observations provide a valuable data source to evaluate recent changes in the sea ice cover along the German coasts and the Baltic Sea. Parts of the historical sea ice data and ice charts are already digitized and available in a database for public access (https://login.bsh.de/fachverfahren/?lang=en). Nevertheless, there is still a large amount of data hidden in archives especially for the beginning of the 20th century. Furthermore, there is an increased interest in ice climatological data in the German exclusive economic zone for the installation of offshore infrastructure, e.g., wind turbines. Permission for the installation requires the consideration of sea ice impact on the structure. Therefore, it is necessary to make statistical information about sea ice coverage in German waters available to the customers.
The following sections give a detailed overview of the current operational and non-operational sea ice products as well as historical sea ice data available at the BSH. Furthermore, a summary of changes in the sea ice cover in German coastal waters is presented. The paper concludes with an outlook onto challenges the ice service is currently facing as well as the planned activities in the near future.
2 Products, publications, and data
2.1 Operational sea ice products
The German ice service produces several operational products to inform about sea ice conditions in German waters, the Baltic Sea, German Bight, and worldwide. An overview of the operational ice products and data, their publishing language, publication frequency, and data availability is shown in Table 1.
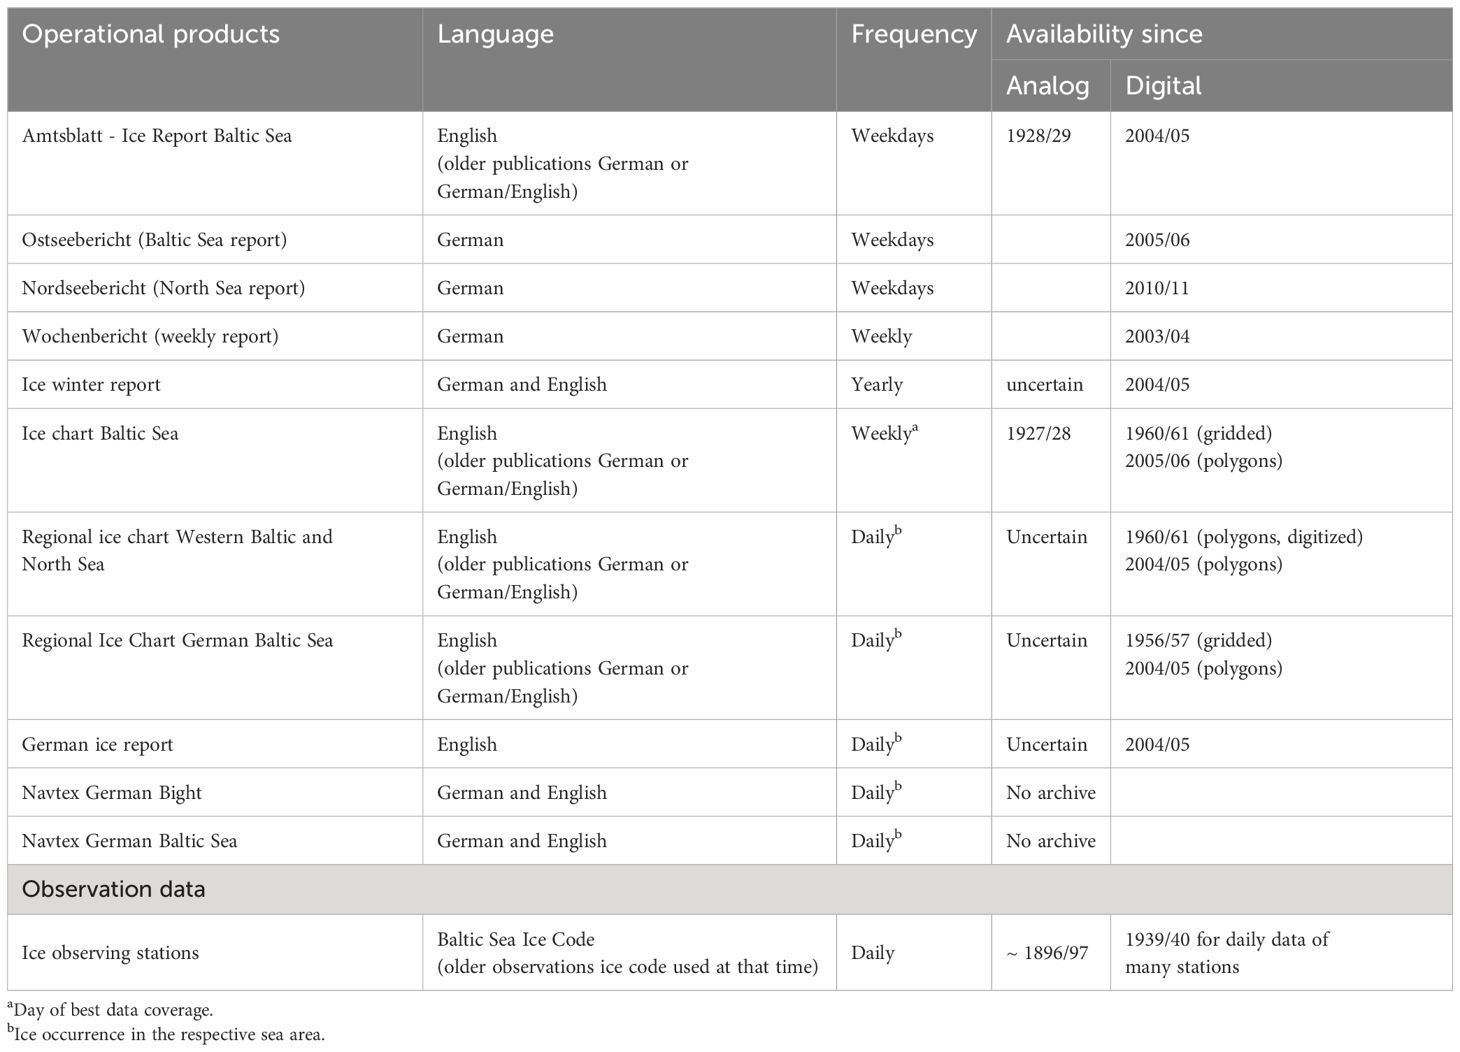
Table 1 Overview of operational ice products, their publishing language, publication frequency, and data availability.
Underlying ice information are obtained from a variety of different sources including remote sensing data, ice observers, meteorological data, and reports of other ice services around the world. Nowadays, the main information source especially outside coastal areas is remote sensing data from optical, microwave, and infrared sensors. Since the start of the Copernicus Program in 2014, the availability of timely and high-resolution data has greatly increased and improved the quality of sea ice products. In coastal areas and harbors, ice observers are, however, still an invaluable source of information. Therefore, a network of around 120 ice observing stations is maintained along the German coasts. The network and some historic ice stations are shown in Figure 1. These stations are operated by volunteers, often with a maritime background, or by administrative assistants from harbors or vessel traffic service centers. The advantages of ice observers are information about the beginning of ice formation, timeliness, and the possibility of thickness measurements, which are difficult to obtain from remote sensing data. The ice observers report ice conditions daily according to the Baltic Sea Ice Code, a four-digit code where each digit provides encoded information about ice coverage, stage of development, form of the ice, and navigation conditions, respectively (Koslowski, 1981). Additionally, ice thickness may be measured and other relevant observations, e.g., leads in the ice or accumulation of ice at shallows, can be reported. The information are checked for plausibility on reception, and an additional quality control is carried out at the end of the season. The history of official ice observations dates back to the winter of 1896/1897.

Figure 1 Ice observing stations in the North Sea and Baltic Sea (image courtesy: T. Moltmann).
Remote sensing data from optical, microwave, and infrared sensors are the prime information source for larger-scale information. Optical images provide high-resolution information that is easy to assess for humans but suffer from cloud cover and require solar illumination. Sources include Copernicus Sentinel-2 and Sentinel-3, MODIS from Aqua and Terra and Landsat-8/9. Lower-resolution optical data is obtained from MetOP satellites. SAR imagery provides high-resolution information independent from weather and solar illumination. Sentinel-1 is the main source for this kind of data, but other providers are used if data is available to the ice service.
The operational ice products are discussed in more detail in the following subsections. The products target different customers and therefore vary in detail and language. All products are available in digital form from the official website (www.bsh.de/ice), free of charge.
2.1.1 Ice report (Eisbericht, Amtsblatt des Bundesamtes für Seeschifffahrt und Hydrographie)
The main product throughout the winter season in the Baltic Sea and German Bight is the ice report (Eisbericht, Amtsblatt des Bundesamtes für Seeschifffahrt und Hydrographie) (BSH, 1928). The report informs in text form about the current ice conditions in the Baltic Sea and the German Bight. It was first published in the winter of 1928/1929. The report is divided into sections corresponding to sea areas with ice occurrence. Each section consists of a brief description of sea ice conditions and a short outlook of the expected development of the ice conditions in the next 24 h or 72 h on weekdays and Fridays, respectively. Furthermore, the ice report contains information about current and upcoming traffic restrictions as well as icebreaker activity published by national ice services. The report is concluded by a list of international ice observing stations and the respective observations coded by the four digit Baltic Sea Ice Code. The report is issued on weekdays and is written in English to reach a broader range of customers. Publication starts with the first persistent ice in the Baltic Sea and ends when the last ice has vanished or the last restrictions are retracted and only ice remnants are present.
2.1.2 Ice charts
There are three types of ice charts regularly published by the German ice service: an overview ice chart of the Baltic Sea, a regional ice chart of the German Baltic Sea, and a regional ice chart of the western Baltic and North Sea. Generally, each ice chart consist of two pages: the first shows sea ice concentration and the second sea ice stage of development. The ice charts follow the WMO Ice Chart Colour Code Standard (WMO, 2004). Color codes for rotten fast ice and hatching for different new ice concentrations are added to better reflect the ice conditions in the Baltic Sea. Furthermore, the ice charts contain contour lines of modeled sea surface temperature and meteorological information from coastal stations. All ice charts are, at present, manually drawn by an ice analyst using the geographic information system software QGIS (QGIS.org, 2022). The ice analyst draws polygons of similar ice types and assigns the ice concentration and ice thickness as the main parameters. Furthermore, information about the melt status, e.g., rotten ice, as well as point symbols for features like ridged ice areas, leads too small to outline, or brash ice barriers can be added. The decisions are mostly based on information from remote sensing imagery as well as auxiliary information from ice observers and other ice services. The ice charts are projected into WGS 84/World Mercator (EPSG:3395). The standard output file format of the published ice charts is PDF, but since the past several years, the charts are also delivered in S-411 format for Electronic Chart Display and Information Systems (ECDIS) (JCOMM, 2014). The original polygonal data is stored as shapefiles as well as in a geographical database for further use, processing, and analysis.
2.1.2.1 Overview ice chart of the Baltic Sea
The overview ice chart of the Baltic covers an area from approximately 53.5° N, 9.5° E to 66° N, 30.2° E. The page with the ice stage of development contains a table with actual restrictions to navigation. Furthermore, active icebreakers are annotated in the ice chart. Figure 2 shows an example of the ice chart from 2022-02-03. The overview ice chart is published weekly on the day with best data coverage. The focus is to produce an ice chart with a high level of detail and as accurate as possible at the time of data acquisition.
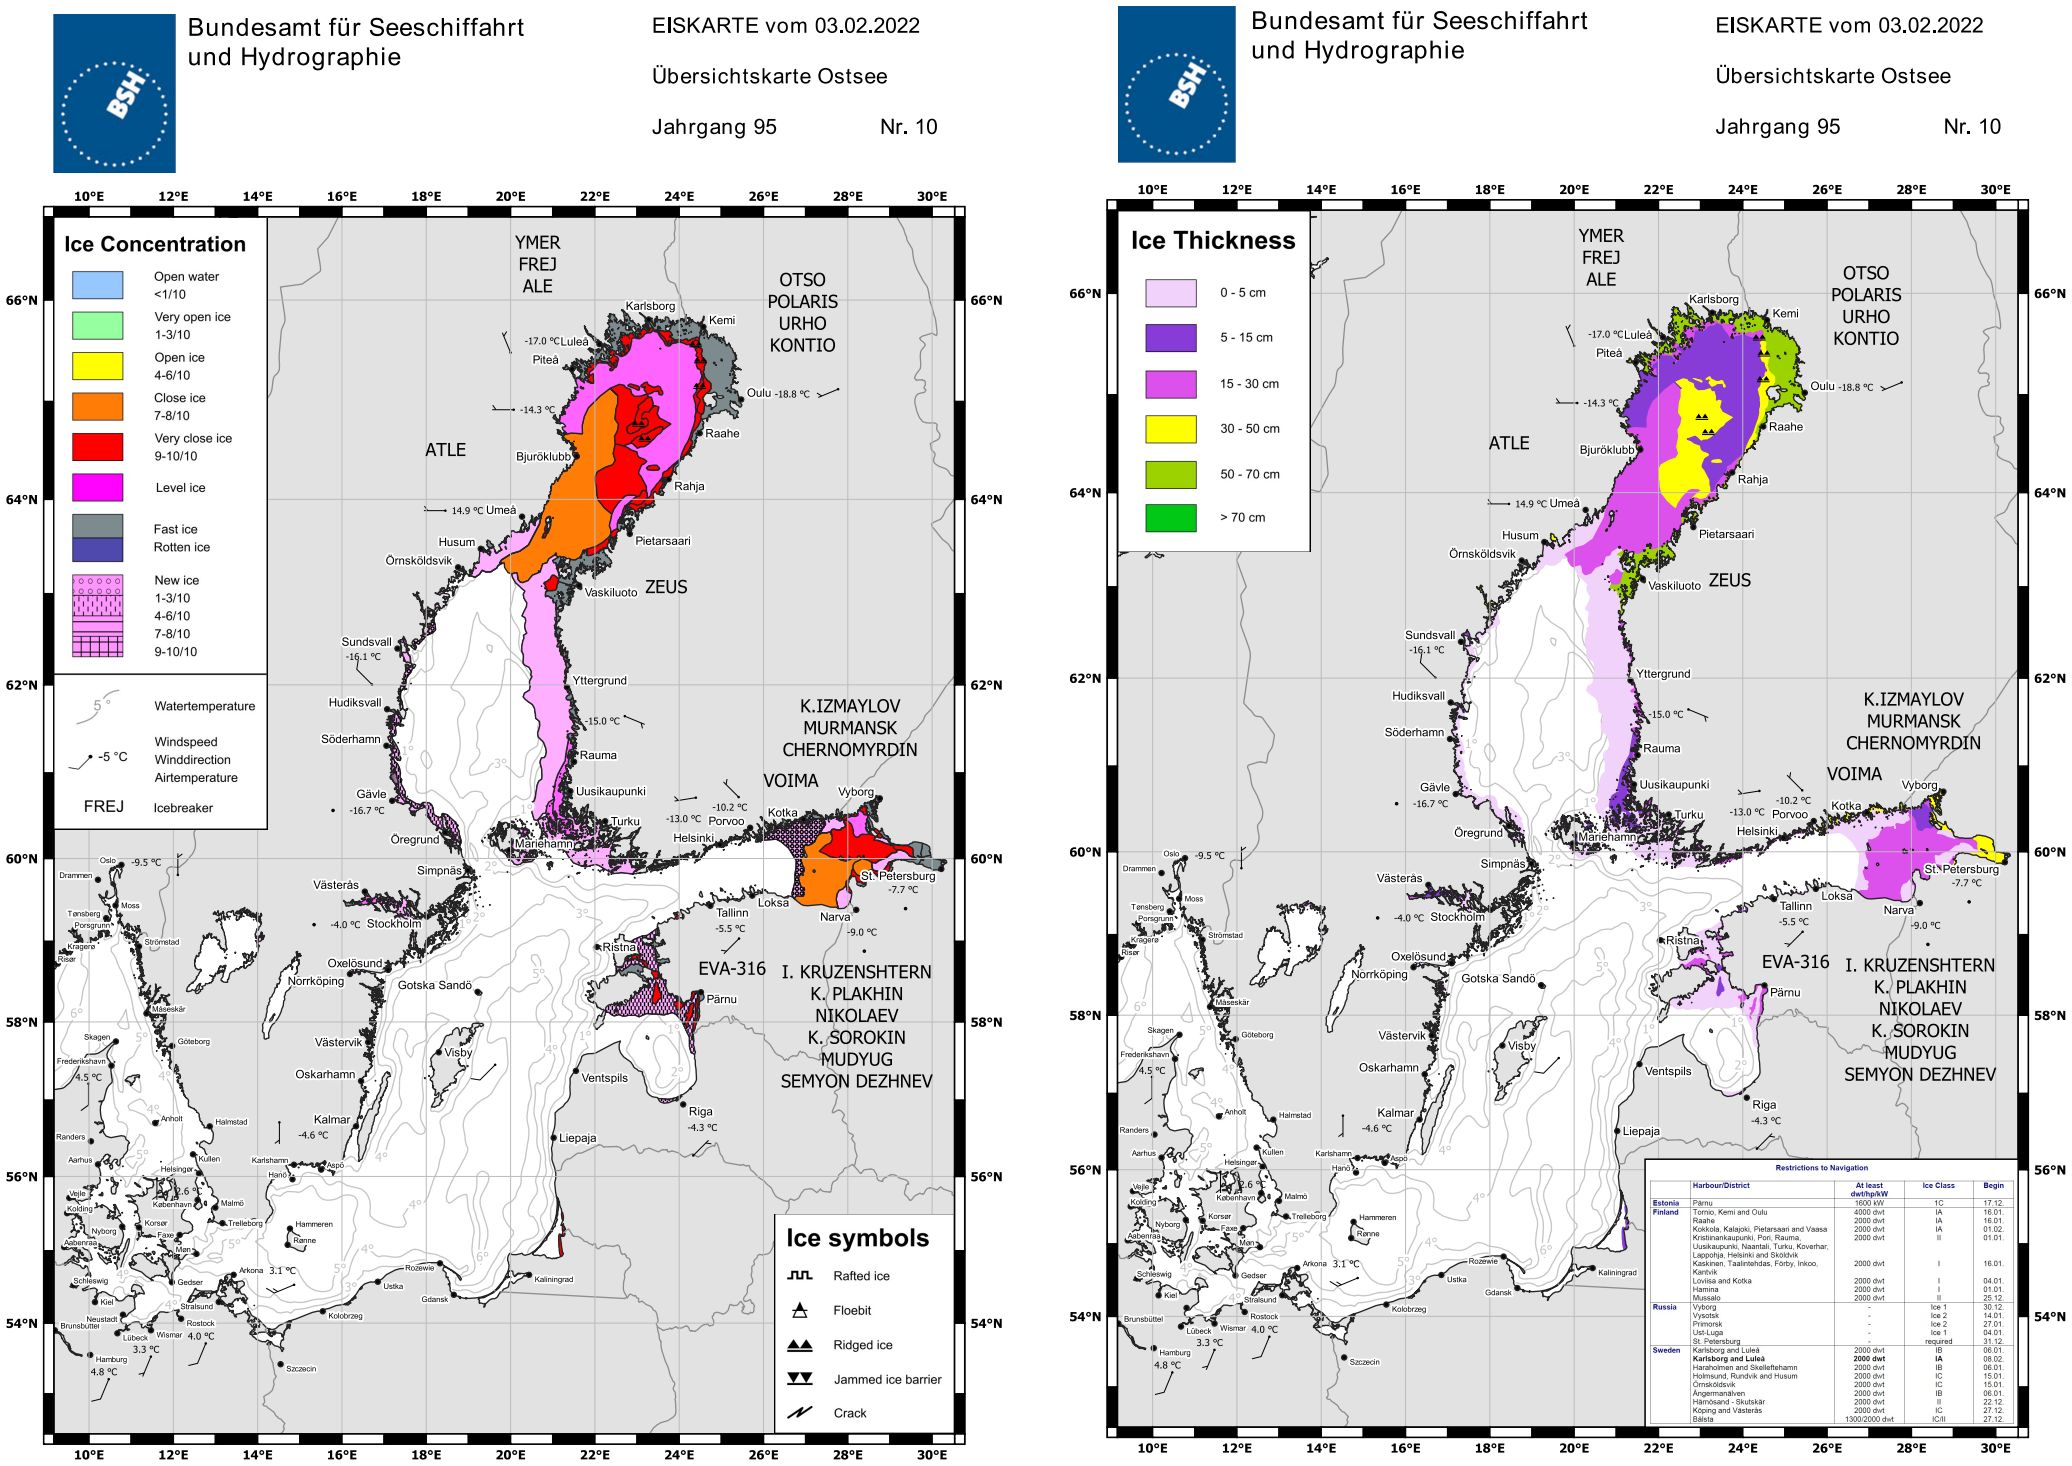
Figure 2 Overview ice chart of the Baltic Sea example from 2022-02-03.
2.1.2.2 Regional ice charts of the German Baltic Sea and the western Baltic Sea and North Sea
Regional ice charts of the German Baltic Sea and the western Baltic Sea and North Sea are produced daily in case of ice occurrence as operational ice charts for the German coastal waters. Publication time is around noon, local time. The ice chart of the German Baltic Sea covers an area from approximately 53.5° N, 8° E and 55.8°, N 15°E. Figure 3 shows an example from 2021-02-17. The ice chart for the western Baltic Sea and North Sea covers an area from approximately 53.5° N, 7° E to 60° N, 15° E. Figure 4 presents an example from 2021-02-17.
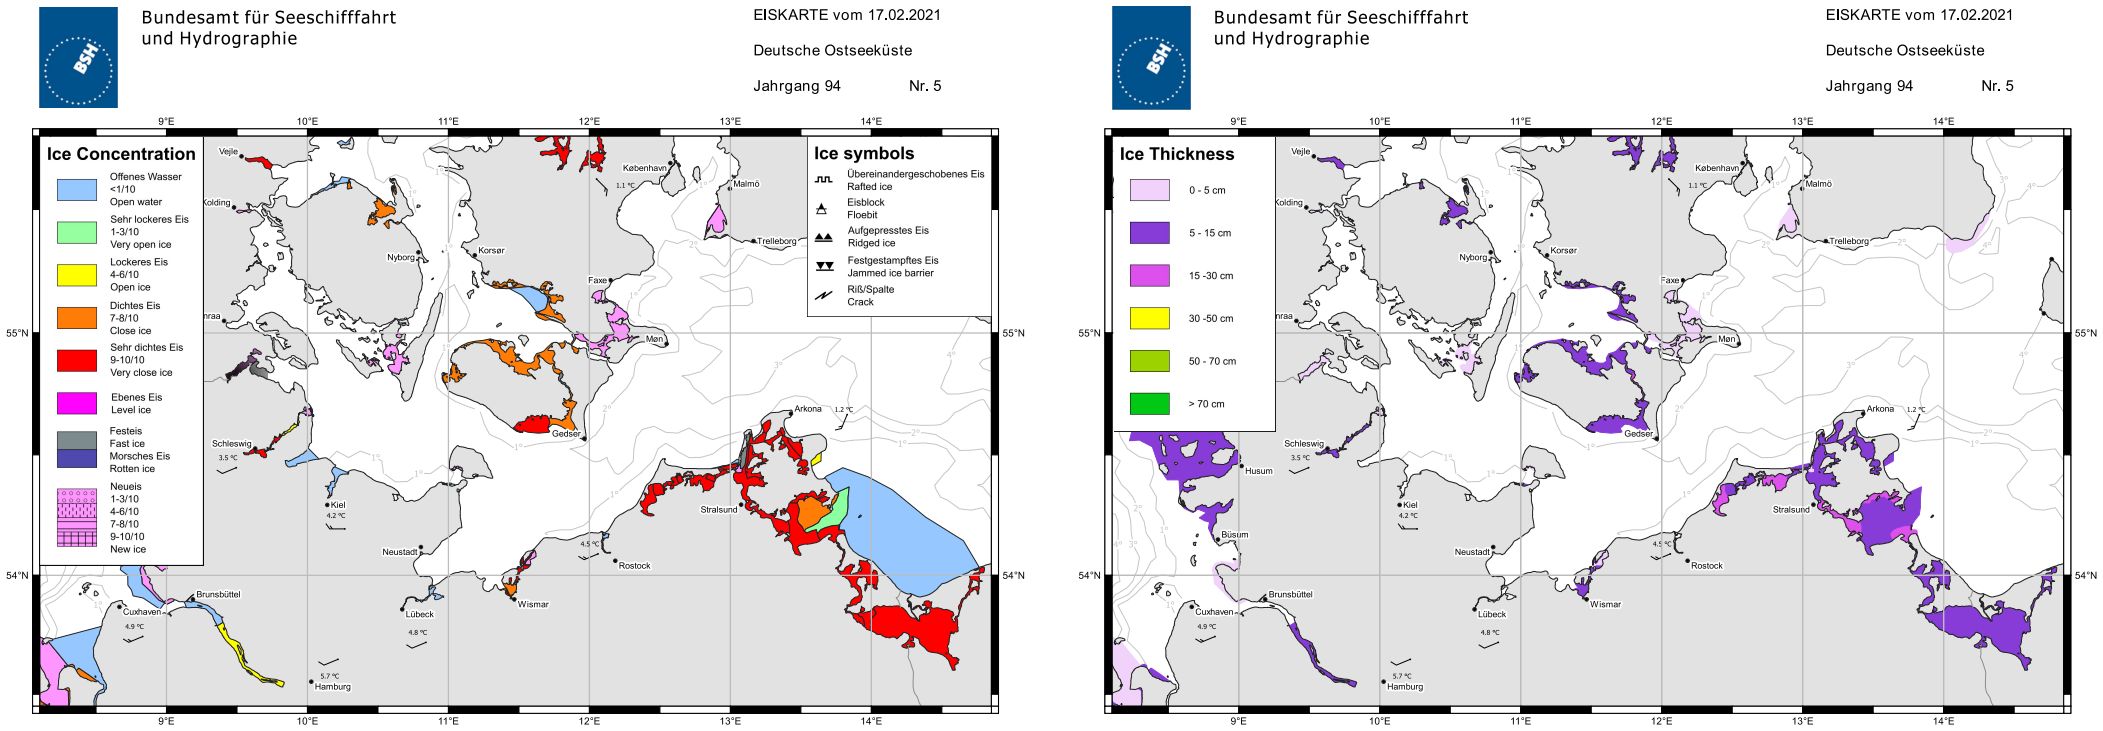
Figure 3 Ice chart of the German Baltic Sea example from 2021-02-17.
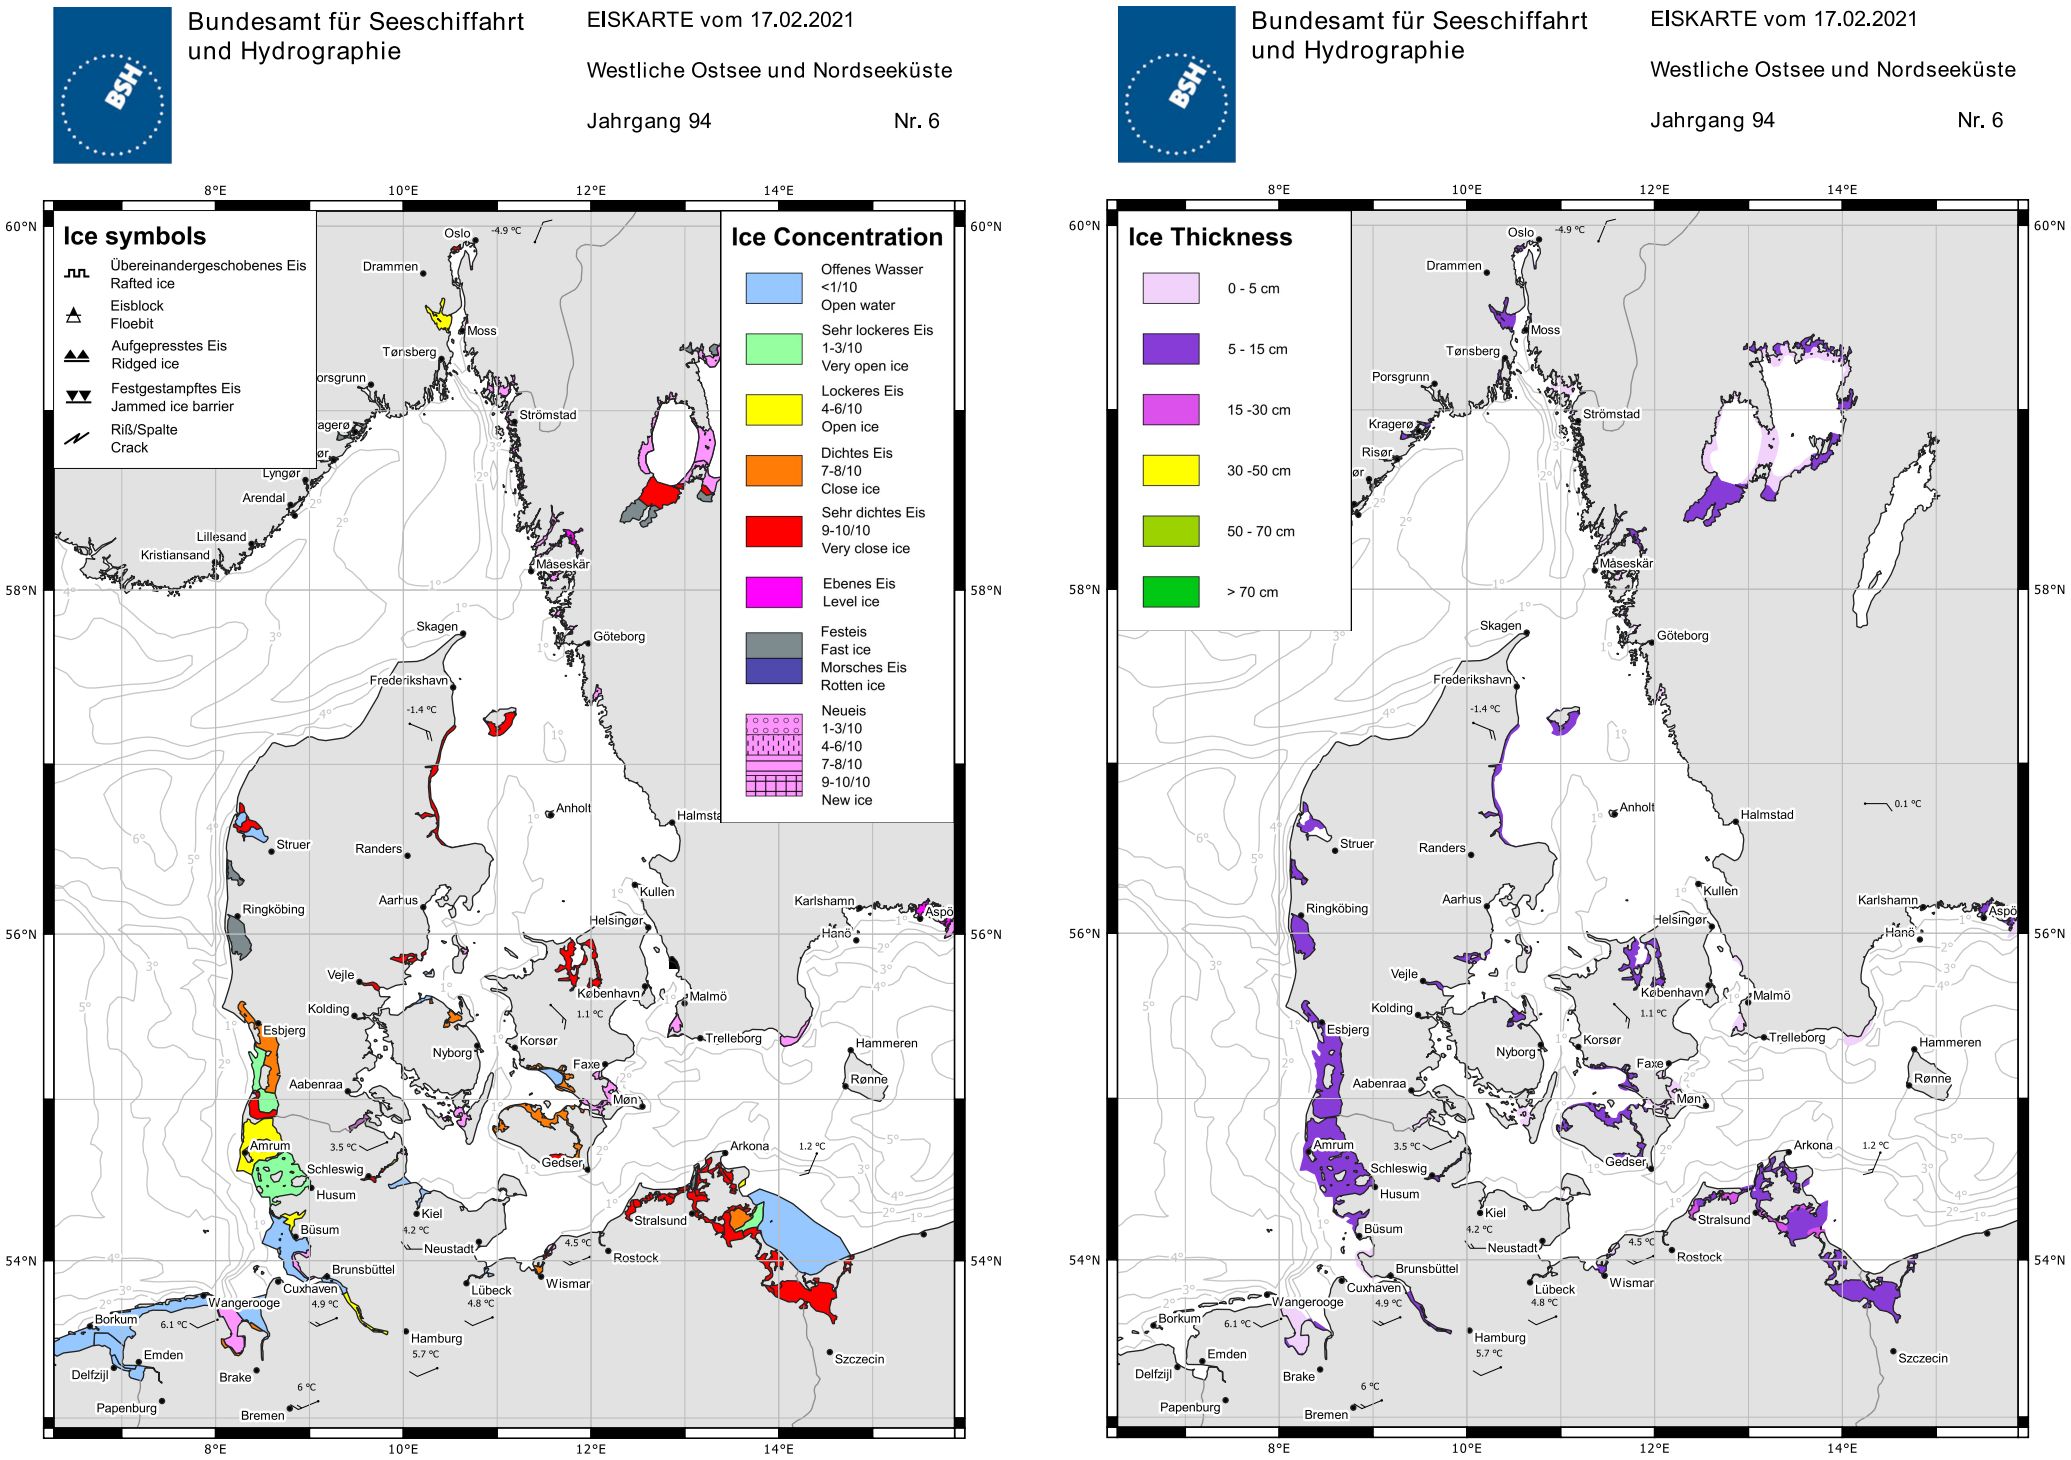
Figure 4 Ice chart of the German Bight, Skagerrak and western Baltic Sea example from 2021-02-17.
2.1.3 German ice report and NAVTEX messages
With ice occurrence along the German coasts, mariners are informed daily about sea ice conditions via the GTS and the NAVTEX service. The German ice report with information about the ice conditions in German coastal waters is transmitted via GTS. It contains the Baltic Sea Ice Code of the German fairway stations and a brief description of the ice situation in areas of interest for navigation in English. NAVTEX messages are very brief summaries of the ice conditions in German waters. They are published separately for the German Bight and the Baltic Sea in German and English before 10:30 a.m.
2.1.4 North Sea report (Nordseebericht) and Baltic Sea report (Ostseebericht)
North Sea report (Nordseebericht) and Baltic Sea report (Ostseebericht) are two publications that describe the ice situation along the German coasts. The reports are issued Monday to Friday when ice occurs at the respective coasts and are written in German. They contain information about the ice conditions for the main fairways and specific regional areas along the coasts that are more detailed compared to the Eisbericht and German ice report. The reports conclude with an outlook of the expected development of the ice situation. In case of restrictions to navigation in German waters, these are given at the end of the report. Sometimes the report starts with a brief statement of recent changes to the ice situation. The reports are available for download free of charge at the website (www.bsh.de/ice).
2.1.5 Weekly report
The weekly report (Wochenbericht) is a weekly report about the sea ice conditions and ice-related traffic restrictions in the Baltic Sea and German Bight. The weekly report briefly describes the current ice situation in the Baltic Sea and German Bight and gives an overview on current and upcoming navigational restrictions, ice breaker activities, and the expected development of the ice situation in the upcoming week. Since the winter of 2021/2022, it contains a brief section about general ice conditions in the Arctic and Antarctica. For the first time in 2022, this report has been continued through the northern summer months with information about ice conditions in the Arctic and Antarctica with a focus on typical areas for navigation, e.g., northern sea route, North West passage, and the western Antarctic Peninsula. The report is usually published on Mondays throughout the year. The publication language is German.
2.1.6 Ice winter report
The ice winter report summarizes the entire winter season and puts the ice winter into context of the long-term time series of winter observations. This report describes in detail the course of the ice winter along the German coasts as well as the meteorological and hydrographic situation. Furthermore, the bygone ice winter is assessed in the long-term context of previous winters. The central metric used for the German coast is the areal ice volume sum that categorizes the ice winter in weak, mild, severe, very severe, and extremely severe winters (Koslowski, 1989). The areal ice volume sum takes the concentration and thickness of the ice cover into account and is accumulated over the winter. A time series of this measure has been calculated for ice climatological stations in the Baltic Sea since 1879 and in the North Sea since 1897. The ice winter in the entire Baltic Sea is reviewed more briefly. The ice winter severity is assessed by the maximum sea ice extent derived from ice charts, and the time series dates back to 1971. Appended to the report is a graphical representation of the Baltic Sea Ice Code of the German ice observing stations as well as some key statistical parameters for each station. The report is available in German and English and is published after the ice season has ended.
2.2 Non-periodical publications
The ice service regularly contributes its expertise about sea ice to national nautical publications. Two regularly updated publications are the Nordsee-Handbuch (North Sea Handbook) and Ostsee-Handbuch (Baltic Sea Handbook) that provide a wide variety of information of the respective sea areas to mariners (BSH, 2020, 2021). The environmental conditions chapter contains a section about sea ice conditions relevant for navigation. On the one hand, these publications give information about ice formation and melting with respect to typical meteorological and oceanographic conditions and situations. On the other hand, climatological ice information are provided to ease the planning of shipping operations. These publications are in German.
Two ice atlases covering German waters and adjacent sea areas are available: one for the western and southwestern Baltic Sea (Schmelzer and Holfort, 2012) and one for the German Bight and Limfjord (Schmelzer and Holfort, 2015). These publications aim to give an overview of the geographic and yearly distribution of sea ice and its changes throughout the study period from 1961 to 2010. They comprise information such as the beginning/end of ice occurrence, number of days with ice, length of ice season, frequency of ice occurrence, ice thicknesses, and means of ice concentration as charts of the region and for selected stations. Furthermore, statistical parameters are calculated for 30-year periods (1961–1990, 1971–2000, and 1981–2010) to provide information about changes in sea ice coverage. Currently, work is ongoing to calculate the new climatological period from 1991 to 2020. Findings about changes of the sea ice cover are discussed in detail in Section 3.
2.3 Historical ice data and ice database
The German ice service has systematically collected ice information from ice observing stations along the North Sea and Baltic Sea coast since 1896/1897. The observation area comprises the North Sea coast from Emden in the west to the island Sylt in the north. The Baltic Sea coast was covered from about Flensburg in the north to Klaipeda in the east. The observation area, however, changed slightly with the borders of the German Reich. After World War II until today, the observation stations covered the coastal area of nowadays Germany. Most of the historical data is stored as written originals in the archives of the ice service. The data was usually received daily in coded form by telegraph from the ice observing stations. Additionally, the ice code plus valuable other information, i.e., weather data, ice thickness, and tides, was collected in monthly reports and sent to the ice service. For each winter season, a compilation of the stations’ monthly reports plus statistical analysis, about the length of the ice season, days with ice, and restrictions for navigation, exists in the archives. A written report containing these statistical winter summaries was usually published yearly in “Annalen der Hydrographie und Maritimen Meteorologie” from about 1905 to 1944 (Deutsche Seewarte, 1905–1944).
Parts of this historical data have been digitized to make it easily accessible and to facilitate its analysis. Data of stations east of Travemünde prior to the winter of 1939/1940 exists to date only in the analog archive. Winter summaries for stations along the North Sea and in the Baltic Sea from Flensburg to Travemünde have been digitized for the winters since 1901. Daily station data is available in digital format for the stations along the German coast since the winter of 1939/1940. The data is stored in the ice code used at the time of observation. This code changed with time to accommodate for more detailed ice information about the size and thickness of the ice. There exist rules to transform the ice code to comply with the ice objects catalog. Nowadays, the observation data is continuously transferred to an electronic ice database that exists since the early 1980s. Additionally, the Baltic Sea Ice Code of international ice stations is injected regularly in this database as received via GTS.
The historical station data has been used to calculate a time series of ice winter strength using the accumulated areal ice volume for the North Sea coast and the Baltic Sea coast (Koslowski, 1989). A total of 13 ice climatological stations have been used for each coast, respectively. These time series date back to 1879 for the Baltic Sea and to 1897 for the North Sea. This gives a good overview of the changes of the ice winter severity for more than a century. Additionally a time series of ice winter strength of the western Baltic has been created from 1301 to 2001 (Koslowski and Glaser, 1999; Koslowski and Schmelzer, 2007; Schmelzer and Holfort, 2011). Information was derived from historical sources of many kinds that enable conclusions about ice conditions, e.g., ship traffic, transportation over ice, or notes about sea ice cover. The results will be discussed in more detail in the next section.
Besides the ice observations, ice charts have been produced operationally for the North Sea and the Baltic Sea since the winter 1927/1928. In the beginning, ice charts of the Baltic Sea were produced daily. Sea ice information was given in different classes roughly resembling the ice concentration and relevance for navigation. Overview ice charts of the Baltic Sea are produced until today. The periodicity of the publication varied with the years, but usually one to two ice charts per week were produced since the 1950. Since the beginning of the 1980s, the ice charts use the WMO standards for sea ice concentration, which is still in use today (WMO, 2004), and additionally an ice thickness range is given.
The ice charts of the Baltic have been digitized on a 0.5° × 0.5° grid for the years 1957 to 2005 and cover an area north of 56°N. The ice charts of the German coast have been digitized in the course of the production of the ice atlases on a 2′ latitude × 4′ longitude grid that resembles roughly 2 NM by 2 NM. The paper charts for the years 1960-2006 were digitized. The ice charts of the German Bight have been redrawn and stored in shapefiles for all winters since 1960/1961. In the process, ice thickness information was added, and missing or incorrect data has been corrected. All ice charts contain information about concentration, but ice charts prior to the winter of 1981/1982 did not contain any information about ice thickness. Ice charts are readily stored as shapefiles since the winter of 2005/2006, with each polygon containing information about concentration and ice thickness as well as information such as rotten ice.
The ice service is currently working on transferring all the digitized data, including the ice chart information, into a geodatabase that will be accessible for the public. The database will contain daily station data, ice charts, restrictions to navigation (data included only for recent years), and winter summaries/simple statistics for the German stations.
3 Changes of sea ice occurrence in German coastal waters
Figures 5 and 6 show the time series of the areal ice volume sum from 13 ice observing stations along the North Sea and Baltic Sea coast, respectively. The black lines in the figure denote the boundaries for weak, moderate, severe, very severe, and extremely severe ice winters. The figures show not only a large interannual variability of the ice winter strength at the German coasts but also that ice winter strength at the different coasts correlate well with each other. However, the ice winters along the North Sea coast are generally milder than at the Baltic Sea due to the influence of the warmer water and tidal effects. Furthermore, there was a peak of very and extremely severe winters in the early 1940s. Since the beginning of the 21st century, there was no severe winter in the North Sea, and only the winter of 2010 has been severe at the Baltic Sea coast. Generally, a decreasing trend in ice winter severity can be observed for the ice winter strength in recent years.

Figure 5 Time series of ice volume sum at the German North Sea coast from winter 1896/97 to 2022/23. The black lines denote the boundaries for weak, moderate, severe, very severe, and extremely severe ice winters.
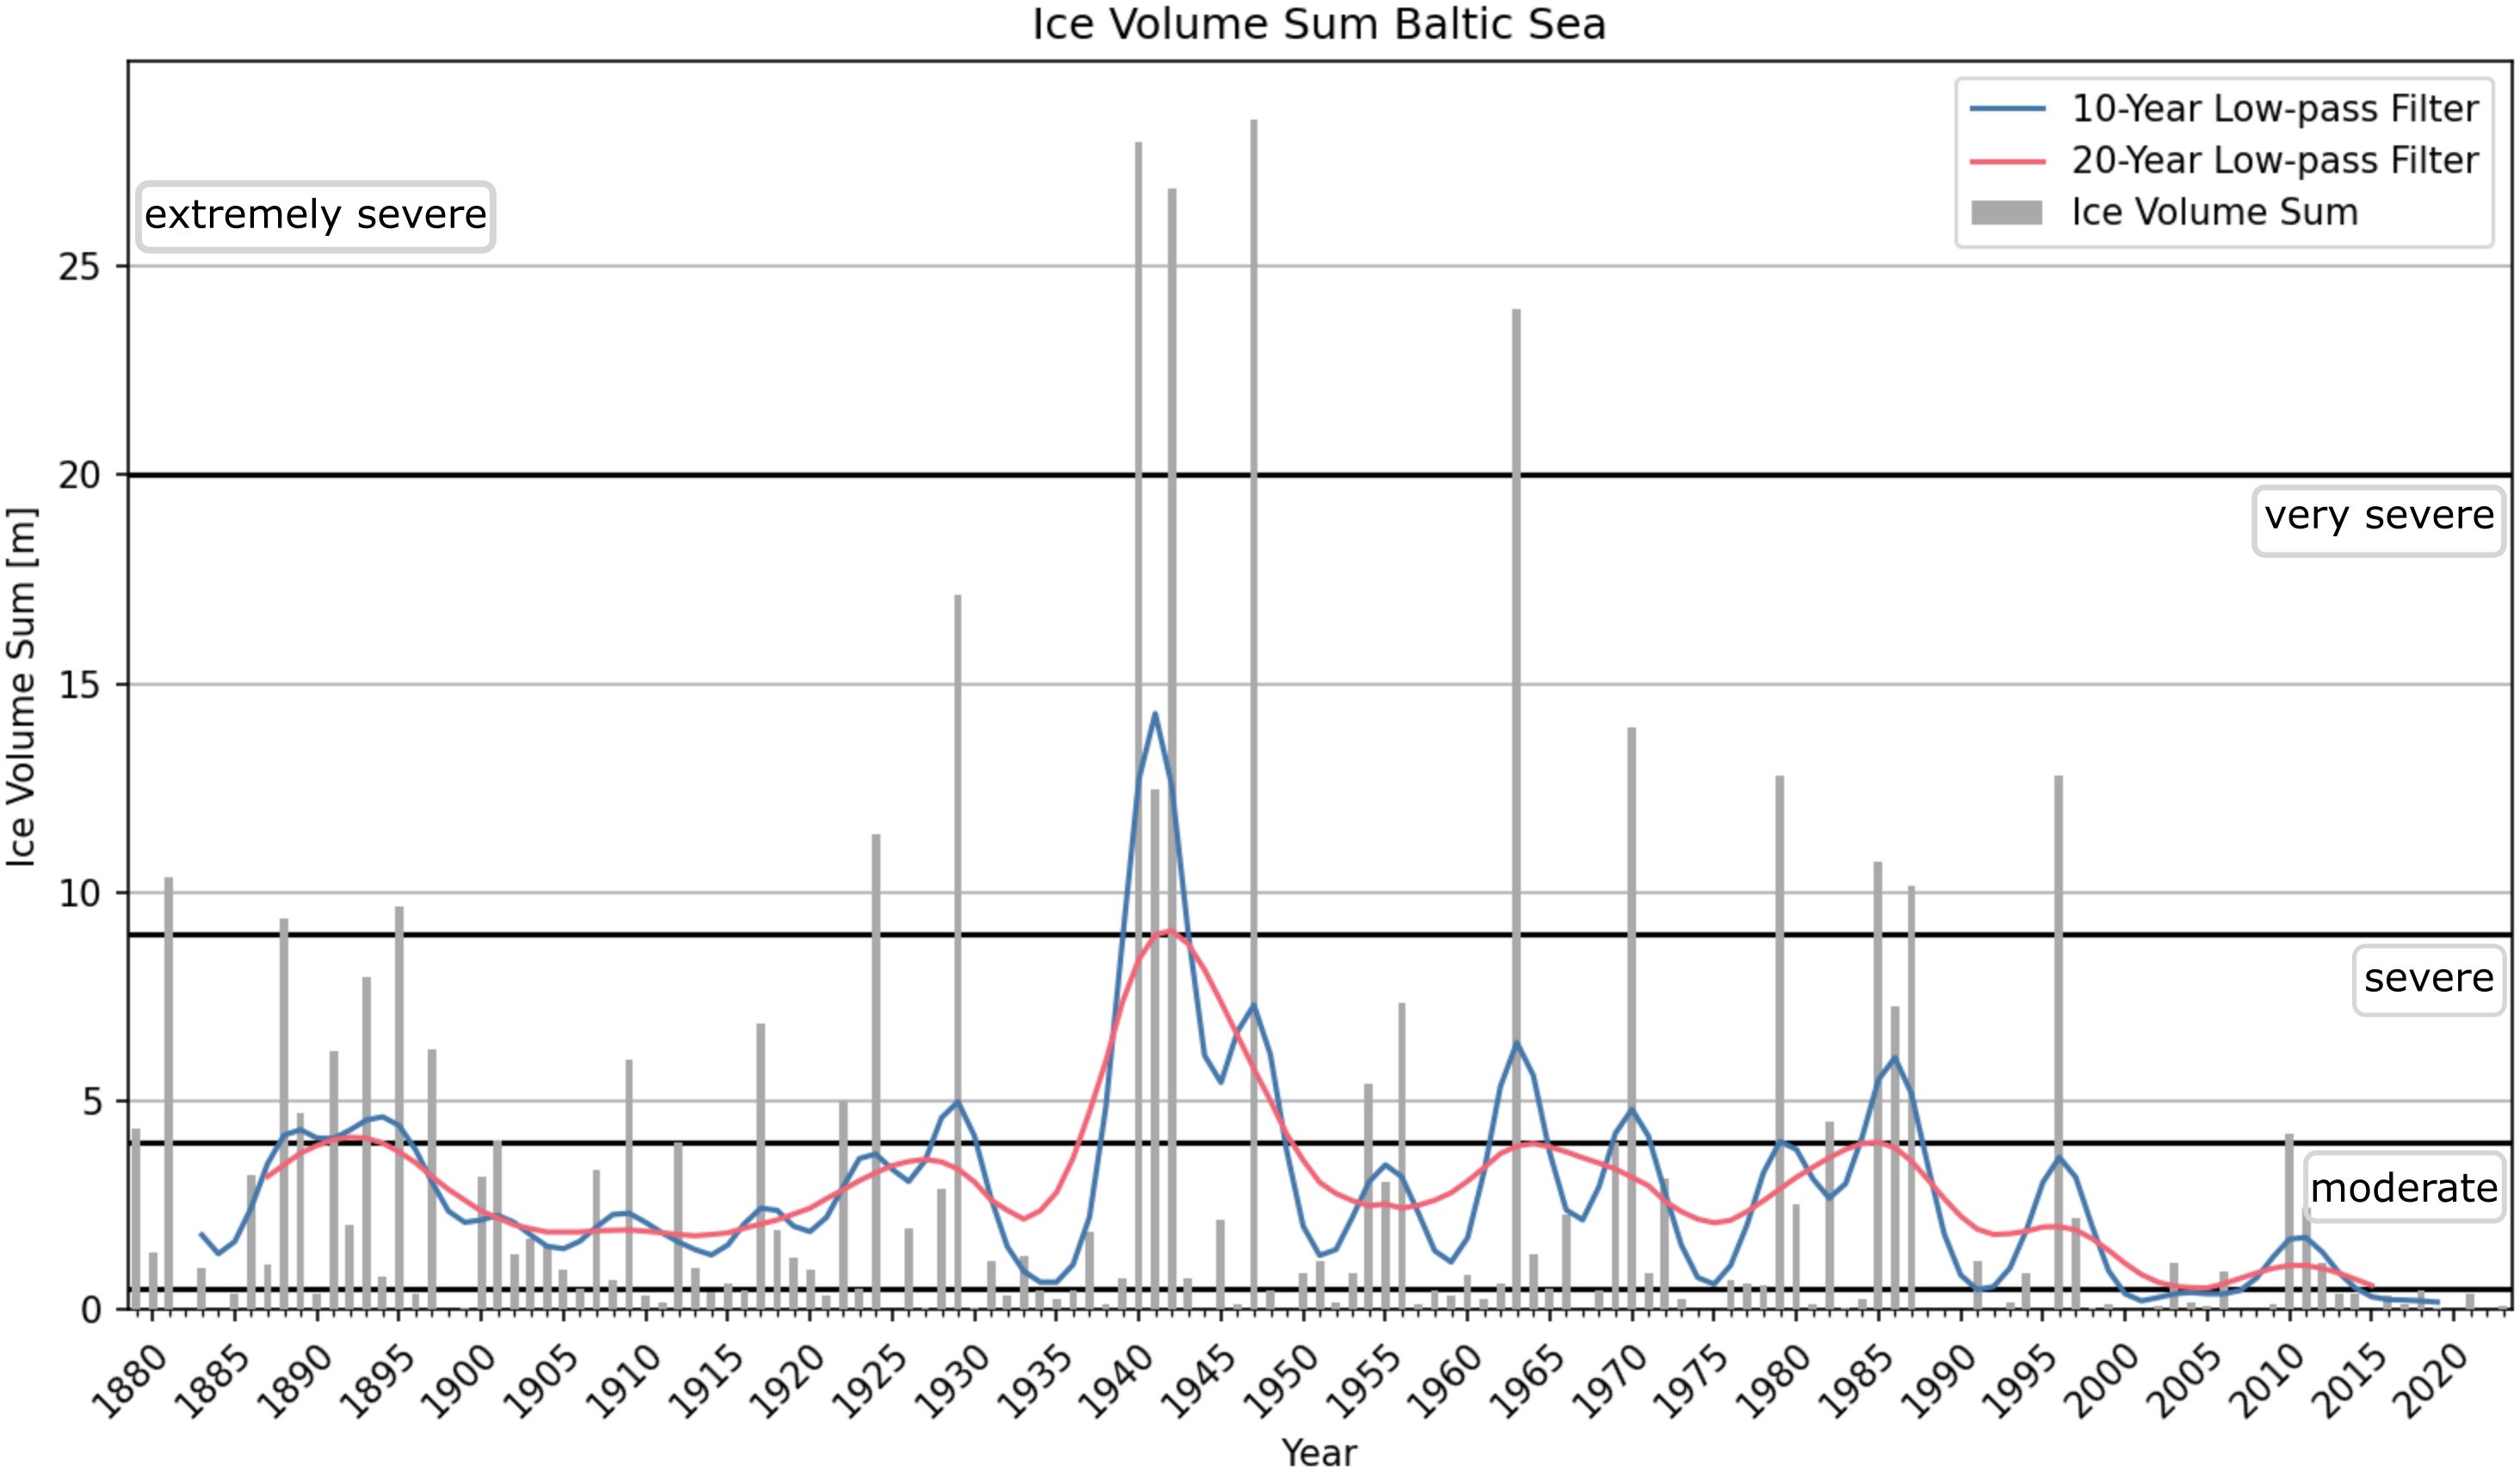
Figure 6 Time series of ice volume sum at the German Baltic Sea coast from winter 1878/79 to 2022/23. The black lines denote the boundaries for weak, moderate, severe, very severe, and extremely severe ice winters.
While these time series give a general view of the ice winter strength, they do not contain any information about the regional and yearly distribution of sea ice occurrence in different sea areas. These information are, however, of importance for navigation and installation of offshore infrastructure. The results and figures presented in the following section are a summary of information contained in the published ice atlases for the western and southwestern Baltic (Schmelzer and Holfort, 2012) and the German Bight and Limfjord (Schmelzer and Holfort, 2015). The presented cartographic information are based on ice charts and station observations produced in Germany, Denmark, and Poland.
Figures 7 and 8 show the probability of ice occurrence in the southwestern Baltic Sea and North Sea for the three time periods 1961–1991, 1971–2001, and 1981–2010, respectively. In both sea areas, there is a decrease in sea ice occurrence especially at the open sea. Areas that usually have been covered with sea ice every year in all three epochs, like the Schlei, the Bodden waters around Rügen, and the Szczecin Lagoon, do not show a diminishing probability of ice occurrence. Nevertheless, the diminishing winter strength in these areas can be seen as a decrease in the mean number of days with ice and in the mean length of the season.
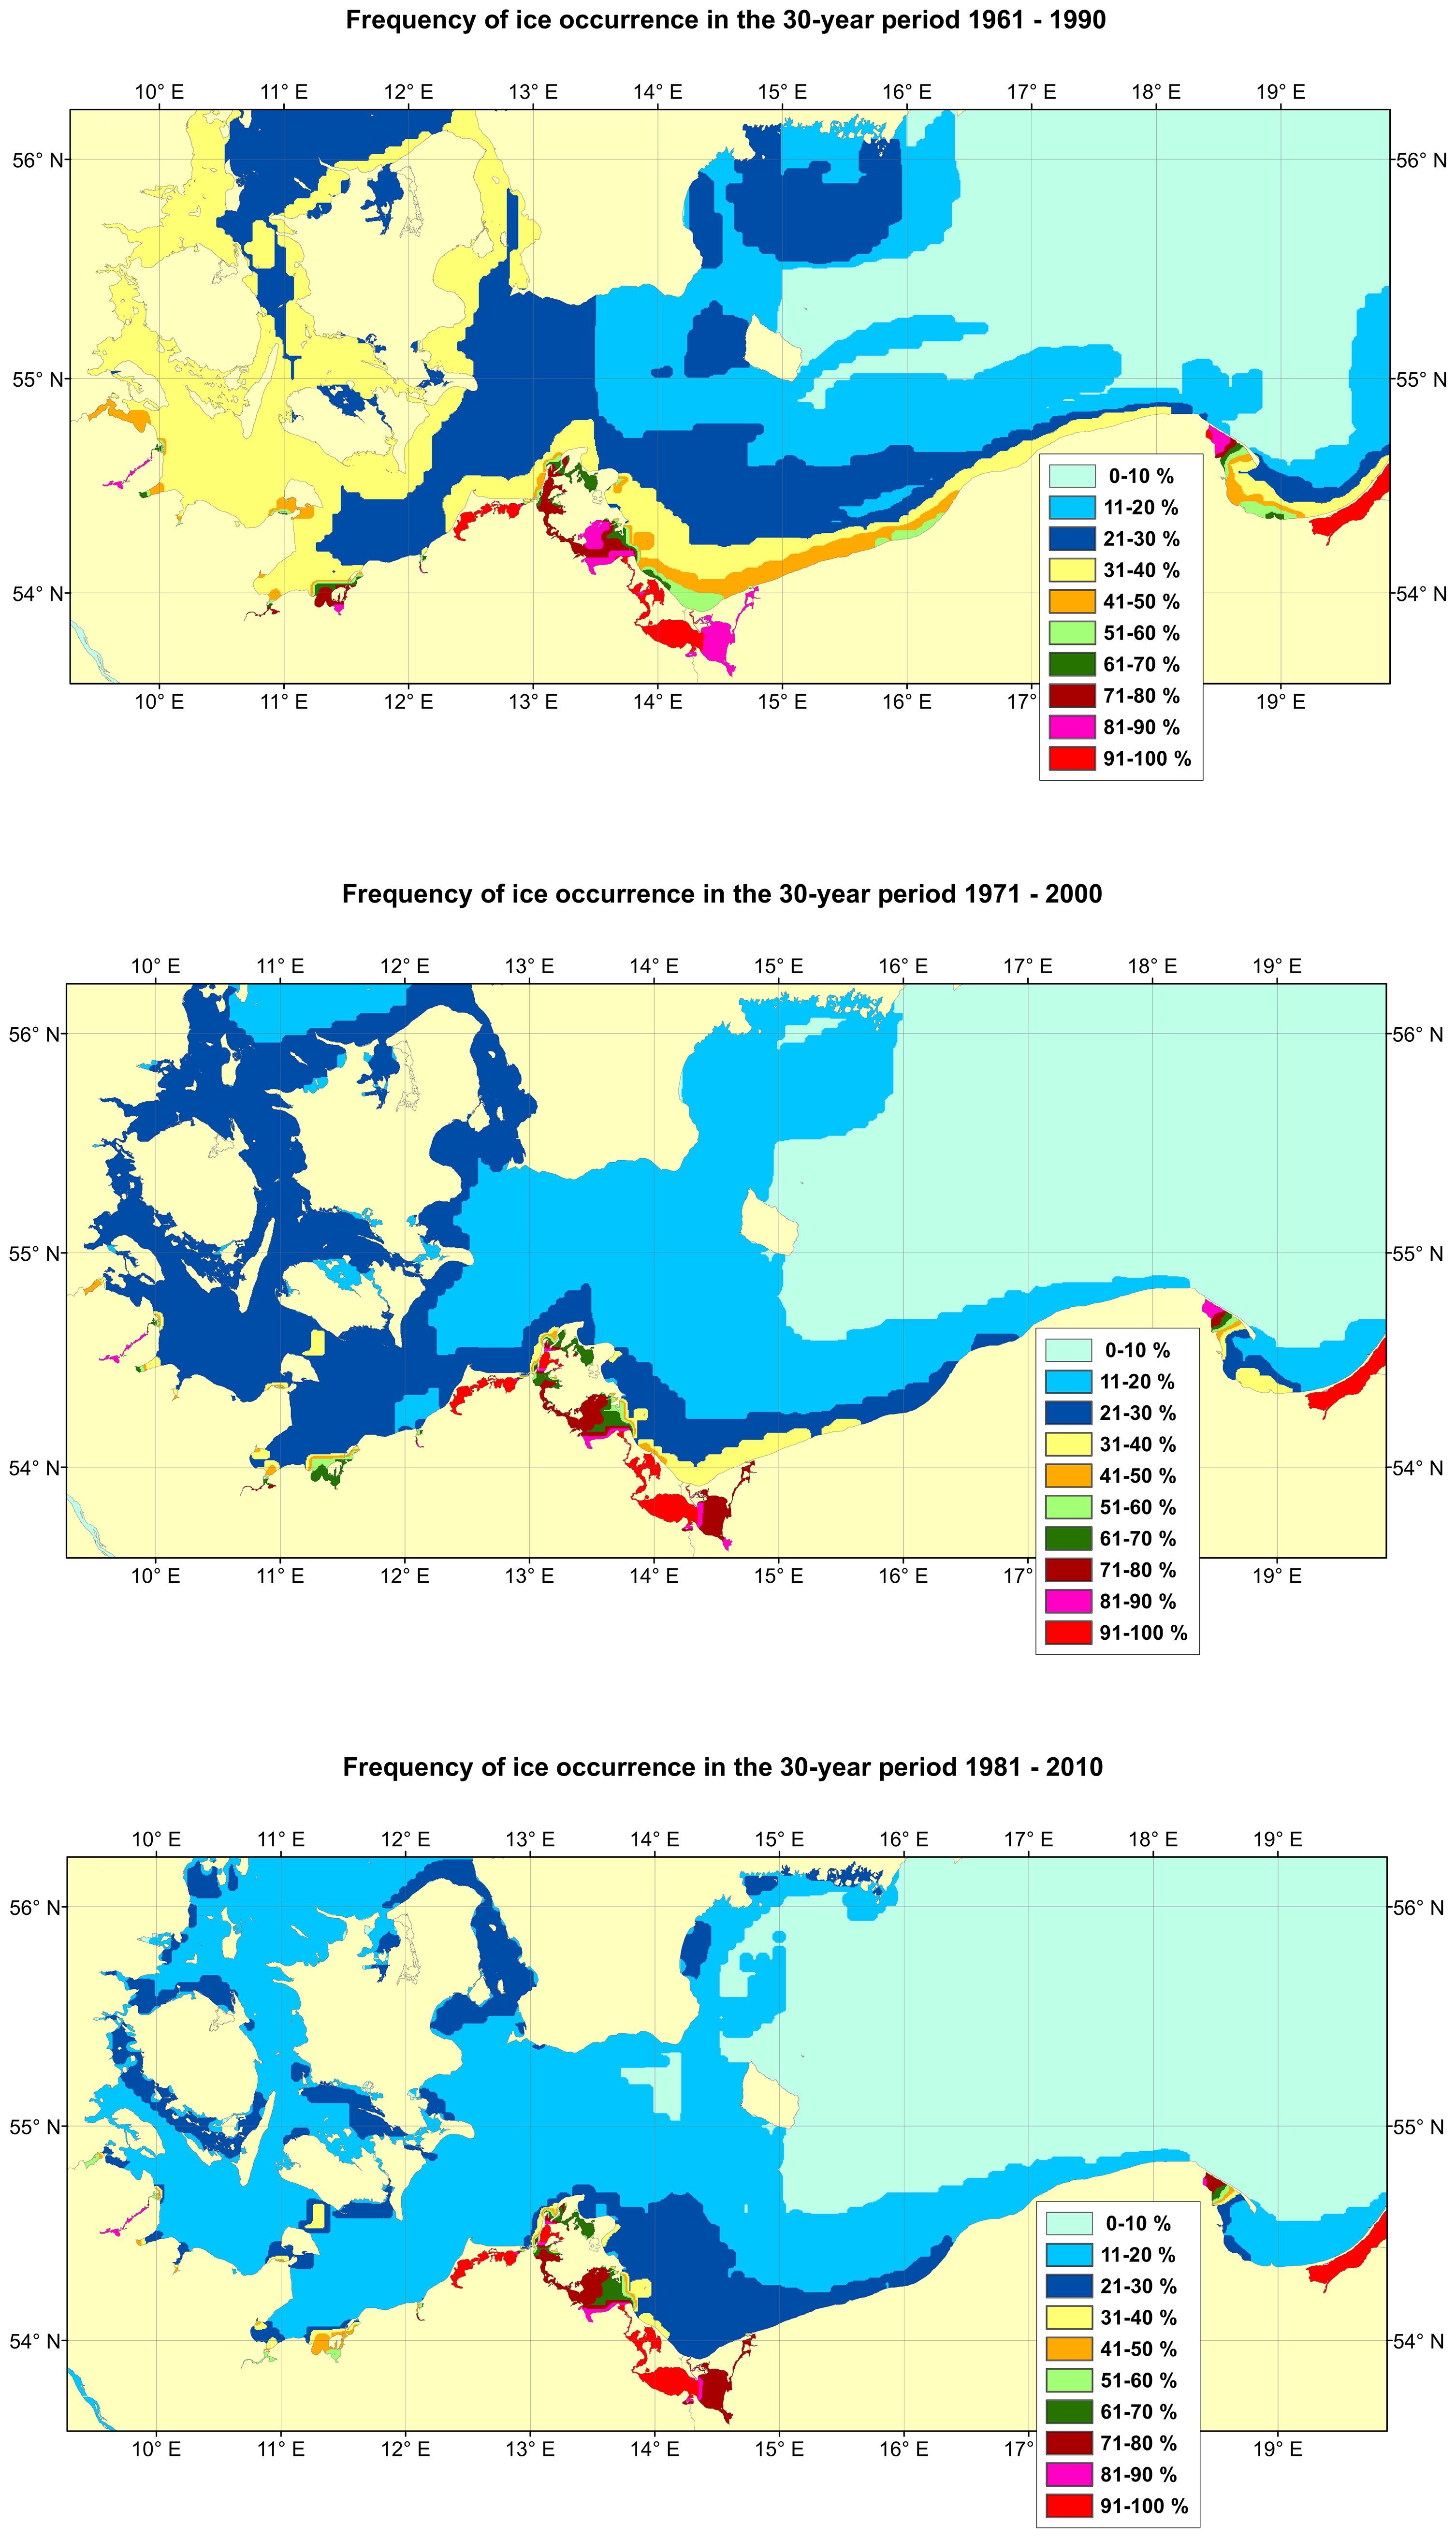
Figure 7 Charts of ice occurrence in the southwestern Baltic for the three epochs 1961-1990, 1971-2000, and 1981-2010. A decrease of ice occurrence with time is visible for almost all regions (Schmelzer and Holfort, 2012).
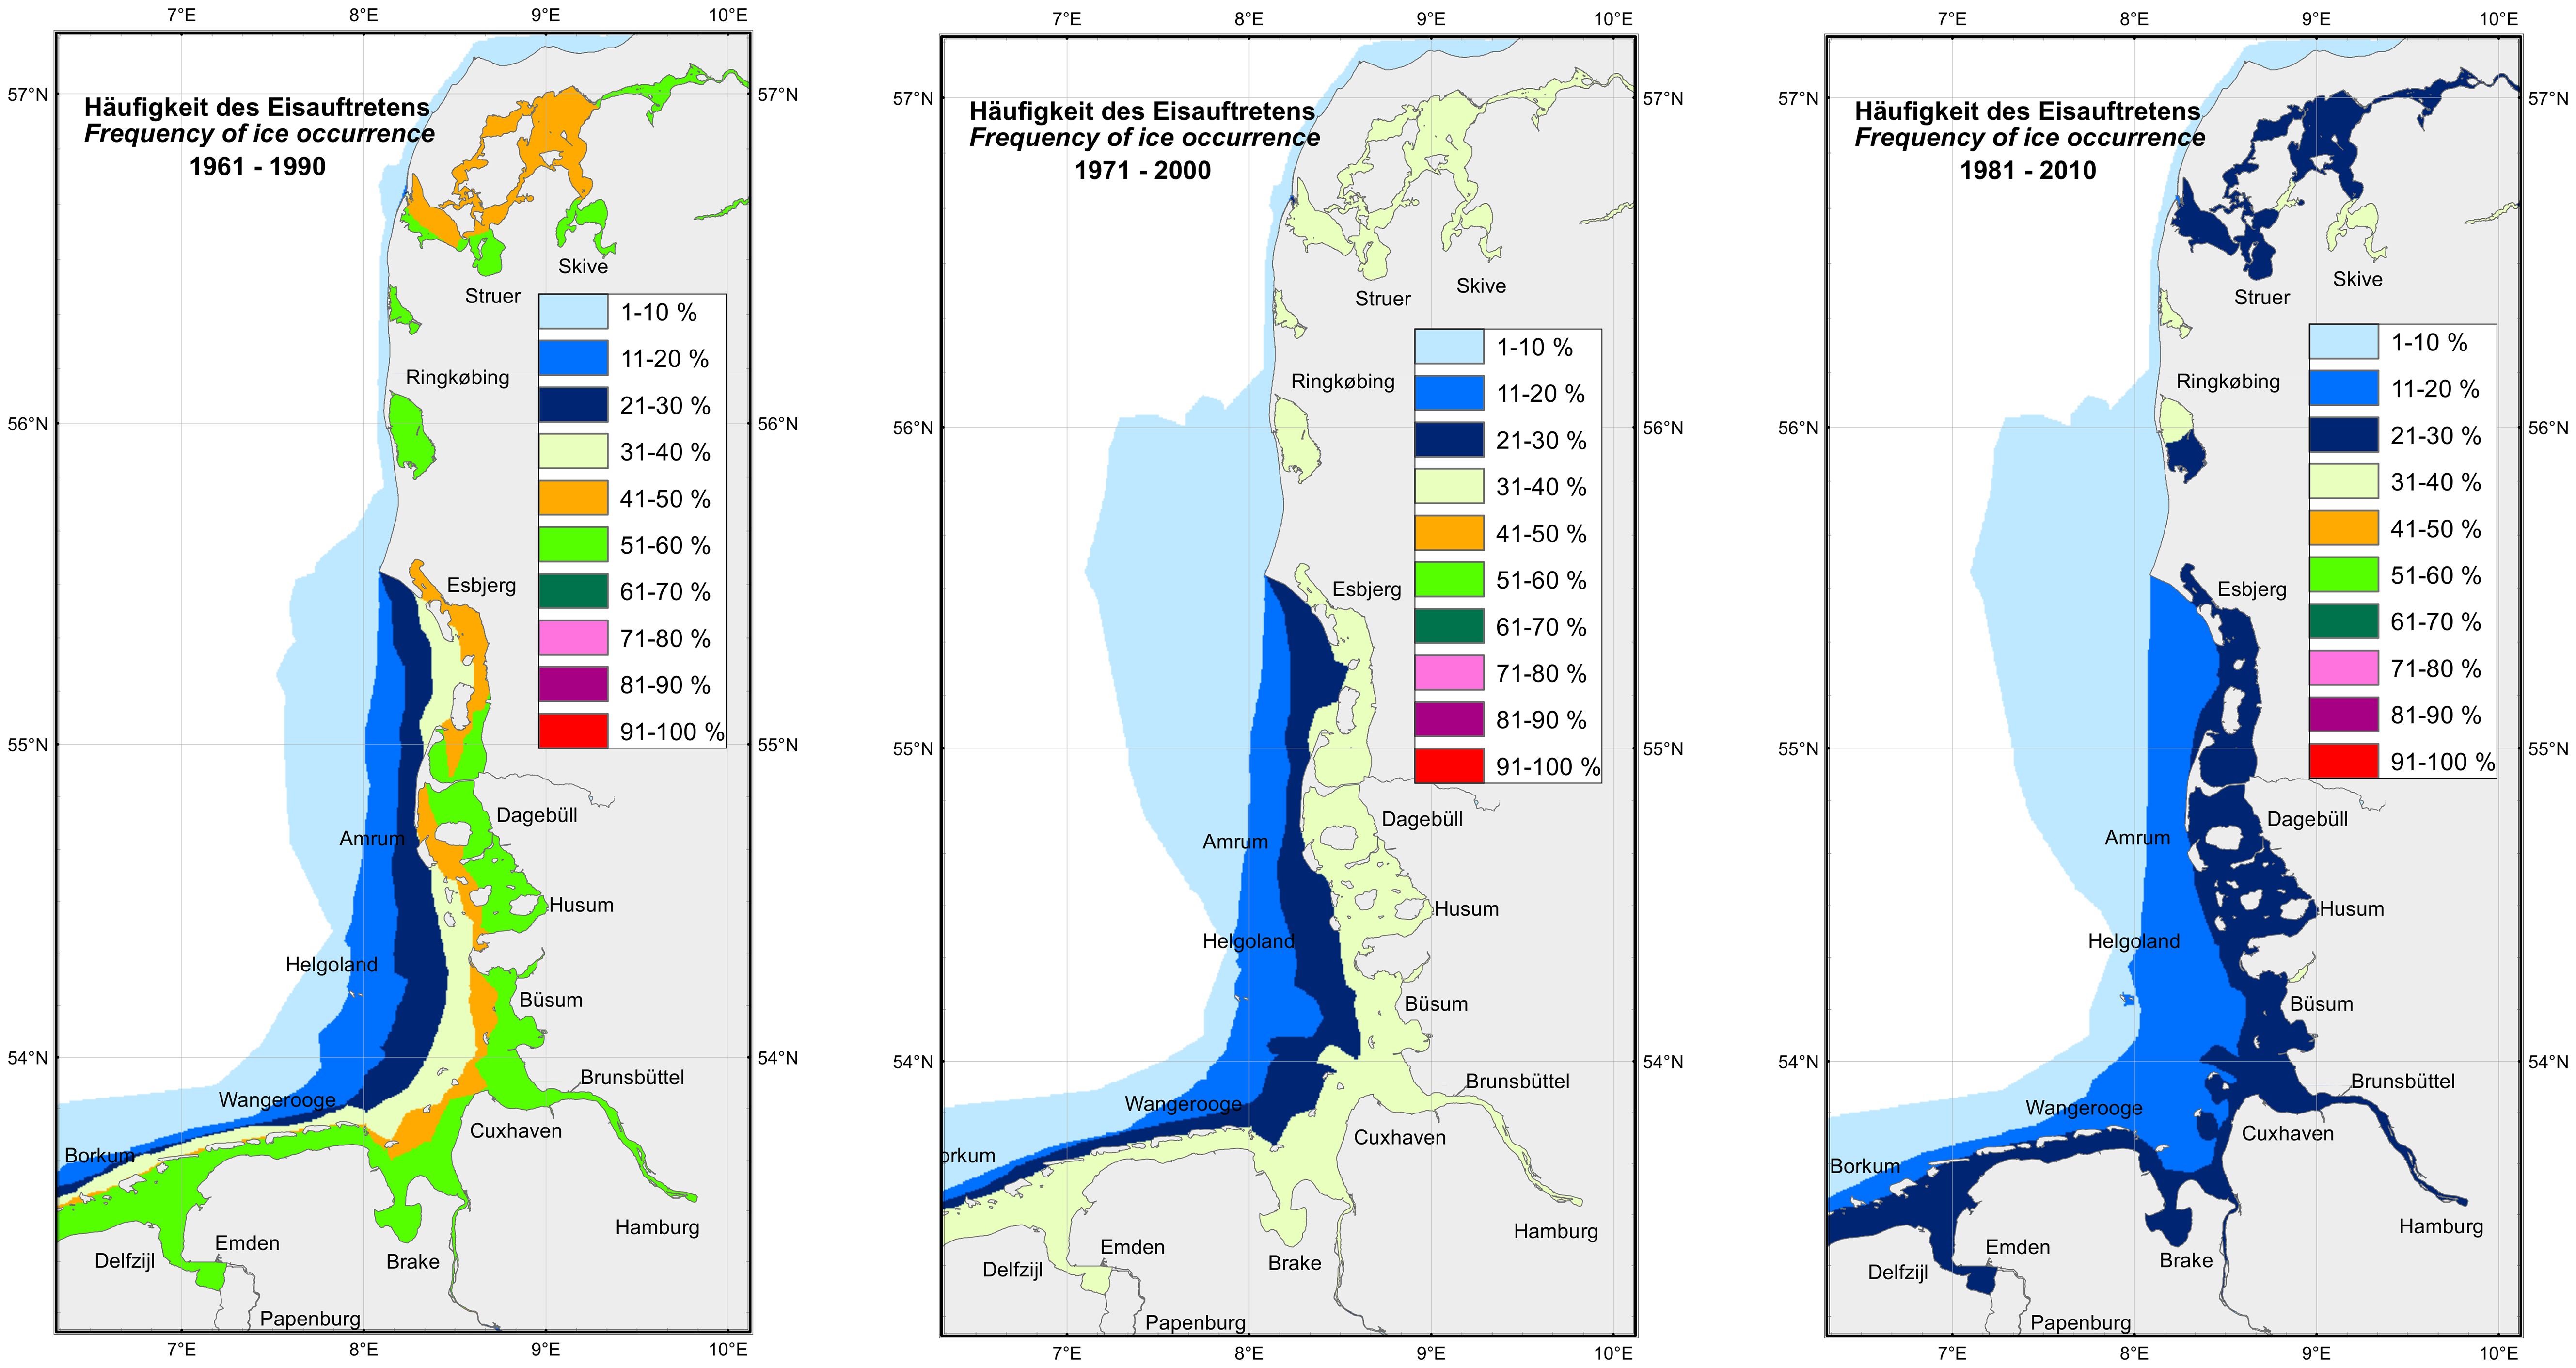
Figure 8 Charts of ice occurrence in the North Sea for the three epochs 1961-1990, 1971-2000, and 1981-2010. A decrease of ice occurrence with time is visible for almost all regions (Schmelzer and Holfort, 2015).
4 Future outlook
The German ice service will continue the production of its current operational sea ice products in the coming years. This ensures the distribution of well-established and international standardized products and use of worldwide proven communication methods. Digitalization, information availability, and advances in telecommunication capacities, however, increase the demand on timely and high-resolution information for safe and optimal navigation in ice-infested waters. Therefore, it is necessary to offer products that extend today’s static and often text-based products to the digital age. Electronic Chart Display and Information Systems (ECDIS) allow the integration of sea ice information into on-board navigation. The improvement of usability requires the further development of international standards, i.e., IHO/WMO S-411, for the display of sea ice information. S-411, in its actual version 1.1, was published in 2014 based on the version 1 of the underlying S100 standard. Although many ice charts are available in S411, the standard has to be updated to comply with the actual S100 version 5. Within the needed update, new features, especially for portrayal, will be implemented. Therefore, routines for scale-dependent display of sea information need to be established and internationally standardized. In addition, it will be necessary to adapt the current ice information, especially the actual ice charts, to comply with these future standards. Furthermore, the ice service is currently working on a web mapping tool to make ice station data, harbor restrictions, ice charts, and text information available on a scalable map. This facilitates the easy access to relevant sea ice information especially for the public.
A longer-term project includes forecast charts based on numerical models with assimilation of sea ice information from automatically classified satellite data. In principle, the needed tools (operational ocean models including ice, data assimilation, and satellite classification) are available at the BSH. However, much work is still needed before the quality and performance of these tools are good enough for general use.
During the time of its existence, the ice service has collected a long time series of historical sea ice information. Parts of this data are digitized and stored in a database alongside most recent sea ice information. To date, this data is only available on direct request from the ice service. For customers, it is not possible to explore the data and to obtain knowledge of the availability of sea ice information. The geospatial database currently under development will provide a user interface that allows customers to search the available information and download exactly the data of interest. These comprise, among others, ice observations from stations, statistical summaries of the ice winter for the stations, and ice charts. Other ice services have direct access to the database and the possibility to update/change their countries data. This will greatly simplify the access to historical sea ice data and make it accessible for a broad range of customers. However, there are still large amounts of data that have not yet been digitized, inspected, or evaluated. If workload permits, conservation and digitalization of this valuable data will be carried out in the future.
Climatological ice information are of great interest not only to evaluate climate change but also for the design of offshore infrastructure. The ice atlases of the western and southern Baltic Sea as well as the German Bight provide information for the 50-year period from 1961 to 2010. The ice service is currently working to update the data for the next 30-year period from 1991 to 2020. This is important to keep track of the most recent changes of sea ice cover and to provide the most up-to-date information to the customers.
Author contributions
WA: Conceptualization, Data curation, Formal analysis, Investigation, Methodology, Software, Writing – review & editing, Visualization, Writing – original draft. JH: Conceptualization, Data curation, Formal analysis, Investigation, Methodology, Project administration, Software, Supervision, Writing – review & editing.
Funding
The author(s) declare that no financial support was received for the research, authorship, and/or publication of this article.
Conflict of interest
The authors declare that the research was conducted in the absence of any commercial or financial relationships that could be construed as a potential conflict of interest.
Publisher’s note
All claims expressed in this article are solely those of the authors and do not necessarily represent those of their affiliated organizations, or those of the publisher, the editors and the reviewers. Any product that may be evaluated in this article, or claim that may be made by its manufacturer, is not guaranteed or endorsed by the publisher.
References
Bundesamt für Seeschiffahrt und Hydrographie (BSH). (1928). Eisbericht: Amtsblatt des Bundesamtes für Seeschifffahrt und Hydrographie (Hamburg: Bundesamt für Seeschiffahrt und Hydrographie).
Bundesamt für Seeschifffahrt und Hydrographie (BSH). (2020). Nordsee-Handbuch, südöstlicher Teil. 6th edn (Hamburg and Rostock).
Bundesamt für Seeschifffahrt und Hydrographie (BSH). (2021). Ostsee-Handbuch, südwestlicher Teil. 24th edn (Hamburg and Rostock).
Deutsche Seewarte. (1905–1944). Annalen der Hydrographie und Maritimen Meteorologie (Hamburg und Berlin).
Garcia-Soto C., Cheng L., Caesar L., Schmidtko S., Jewett E. B., Cheripka A., et al. (2021). An overview of ocean climate change indicators: sea surface temperature, ocean heat content, ocean pH, dissolved oxygen concentration, Arctic sea ice extent, thickness and volume, sea level and strength of the AMOC (Atlantic meridional overturning circulation). Front. Mar. Sci. 8. doi: 10.3389/fmars.2021.642372
Koslowski G. (1989). Die flächenbezogene Eisvolumensumme, eine neue Maßzahl für die Bewertung des Eiswinters an der Ostseeküste Schleswig-Holsteins und ihr Zusammenhang mit dem Charakter des meteorologischen Winters. Deutsche Hydrographische Z. 42, 61–80. doi: 10.1007/BF02226421
Koslowski G., Glaser R. (1999). Variations in reconstructed ice winter severity in the western Baltic from 1501 to 1995, and their implications for the North Atlantic oscillation. Climate Change 41, 175–191. doi: 10.1023/A:1005466226797
Koslowski G., Schmelzer N. (2007). Ice Winter Severity in the Western Baltic Sea in the Period 1301–1500, Hamburg and Rostock: Bundesamt für Seeschifffahrt und Hydrographie. Vol. 42. 47–56, Hamburg and Rostock: Berichte des BSH.
QGIS.org. (2022). QGIS Geographic Information System (QGIS Association). Available at: http://www.qgis.org.
Schmelzer N., Holfort J. (2011). Ice winter severity in the western Baltic Sea in the period of 1301–1500: comparison with other relevant data. Int. J. Climatol. 31, 1094–1098. doi: 10.1002/joc.2337
Schmelzer N., Holfort J. (2012). Climatological Ice Atlas for the western and southern Baltic Sea (1961–2010). Hamburg and Rostock: Bundesamt für Seeschifffahrt und Hydrographie.
Schmelzer N., Holfort J. (2015). Climatological Ice Atlas for the German Bight and Limfjord (1961-2010). Hamburg and Rostock: Bundesamt für Seeschifffahrt und Hydrographie.
Strübing K. (1970). Satellitenbild und meereiserkundung. Deutsche Hydrographische Z. 23, 193–213. doi: 10.1007/BF02311139
WMO. (2004). Ice Chart Colour Code Standard, World Meteorological Organization, Geneva: World Meteorological Organization. WMO/TD-No. 1215.
Keywords: ice service, ice charts, sea ice, Baltic Sea, North Sea
Citation: Aldenhoff W and Holfort J (2024) Information on operational sea ice products and current and future activities of the German ice service. Front. Mar. Sci. 11:1339610. doi: 10.3389/fmars.2024.1339610
Received: 16 November 2023; Accepted: 31 May 2024;
Published: 24 July 2024.
Edited by:
Ed Blockley, Met Office, United KingdomReviewed by:
Till Andreas Soya Rasmussen, Danish Meteorological Institute (DMI), DenmarkMeijie Liu, Qingdao University, China
Copyright © 2024 Aldenhoff and Holfort. This is an open-access article distributed under the terms of the Creative Commons Attribution License (CC BY). The use, distribution or reproduction in other forums is permitted, provided the original author(s) and the copyright owner(s) are credited and that the original publication in this journal is cited, in accordance with accepted academic practice. No use, distribution or reproduction is permitted which does not comply with these terms.
*Correspondence: Jürgen Holfort, anVlcmdlbi5ob2xmb3J0QGJzaC5kZQ==