 Dapeng Zhang
 Bowen Zhao
 Haoyu Jiang
- 1Ship and Maritime College, Guangdong Ocean University, Zhanjiang, Guangdong, China
- 2Department of Applied Mathematics and Mathematical Modeling, Saint-Petersburg State Marine Technical University, Saint-Petersburg, Russia
- 3School of Electronics and Information Engineering, Guangdong Ocean University, Zhanjiang, Guangdong, China
Mooring design for floating wave energy converters (WECs) is crucial for station maintaining, efficient power collection, and economic concerns. In order to study the dynamic response of the floating-point absorber under the coupling action of the catenary in regular waves, this research presents the numerical modeling of the floating-point absorber alone with a catenary mooring system. Hydrodynamic behavior of the floating-point absorber is analyzed with respect to wave height, wave period, and current velocity. From the computational fluid dynamics (CFD) results, it can be deduced that the wave height has a much more pronounced impact on the longitudinal motion properties of WEC, such as the longitudinal force and the surge motion, and essentially no impact on the vertical force and the heave motion. The dynamic performance of the WEC under small wave periods are quite different from those under large wave periods. The current velocity also significantly affects the hydrodynamic performance of the WEC. The larger current velocity brings strong nonlinearity for the forces of the WEC. Under the combination of waves and current, the WEC and its mooring system will achieve a dynamic balance.
1 Introduction
International organizations have pushed for the development of energy technologies such nuclear energy, solar energy, biogas technology, wind power, and marine energy in recent years due to the depletion of fossil fuels and growing concerns about global warming (Dincer, 2000; Antonio, 2010; Cheng et al., 2022a; Cheng et al., 2022b). Although devices that transform wave energy into practical electricity confront several design challenges, wave energy represents a potential renewable energy source (Li and Yu, 2012; Jin et al., 2019; Shahroozi et al., 2022). In recent research, there has been a growing interest in employing wave energy converters (WECs) to collect energy from the ocean and sea waves (Mercadé Ruiz et al., 2017; Zang et al., 2018; Sun et al., 2021). A floating-point absorber in offshore settings is one of the potential WECs, despite the fact that numerous kinds of WECs are built and employed.
A subset of floating oscillating bodies referred to as point absorbers (PAs) is composed of a heaving buoy that uses a Power Take-Off (PTO) to derive wave energy from motions between it and a fixed reference, a submerged oscillating body (a two-body point absorber), or the seabed. The interactions between waves and floating bodies are very important since here is where the majority of incoming wave energy is absorbed. A number of scholars are interested in various areas, including the numerical modeling of a floating body. The bulk of research conducted for hydrodynamic analysis are based on Computational Fluid Dynamics (CFD) methodologies, according to previous literature. For instance, Babarit et al. (2012) estimated the mean annual power absorption of eight WECs with different working principle through numerical modelling. Numerous performance indicators, such as capture width, power/mass, and power/surface area, were examined at different sites around Europe. Beatty et al. (2015) numerically simulated the performances of two self-reacting point absorbers. The experimental and numerical comparison was also undertaken for heave motions. Using the verified numerical model, the control mechanisms and hydrodynamics of each device in regular waves were examined. A three-degree-of-freedom submerged spherical point absorber was the subject of a hydrodynamic investigation by Meng et al. (2020) using the Navier-Stokes calculation and the computational fluid dynamic toolbox OpenFOAM in a model wave tank experiment. The efficiency of the spherical point absorber substantially decreased during lengthy waves, when surface penetration was most likely to happen, which led to the conclusion that submerged line relievers were less efficient than floating counterparts in this condition. Ulvgård et al. (2016) assessed the wave power output of a full-scale linear generator. The research also examined oscillations, compared the generator’s performance in uphill and downhill motion, and calculated no load losses at two distinct speeds. The computational model of the heaving point absorber developed by Guo et al. (2017) took into account the combined influence of fluid viscous and mechanical friction forces. Chen et al. (2017) created a three-dimensional mathematical model of the structural dynamics and hydrodynamics of a floating-point absorber with a stroke control system in erratic and strong waves using the Navier-Stokes equations. By comparing the numerical results with the results of the wave tank experiment, the model was confirmed. According to the literatures, the numerical modelling is widely used in the study of point absorbers, including the design, dynamics and hydrodynamic analysis as well as optimization (Bosma et al., 2012; Göteman et al., 2020; Giassi et al., 2020; Prakash et al., 2022).
The concept of point absorbers has been studied extensively, and several point absorbers have been proposed and tested. Point absorbers may be further subdivided into two categories: dual-mode and single-mode. The six modes of operation (surge, sway, heave, pitch, roll, and yaw) of a point absorber are typically all active if no motion limitation is imposed. Figure 1 depicts the basic principles of operation for three different types of point absorbers, including a self-contained point absorber, a self-reacting two-body point absorber, and a one-body point absorber. A spring and damper system is used as a metaphor for the PTO mechanism.
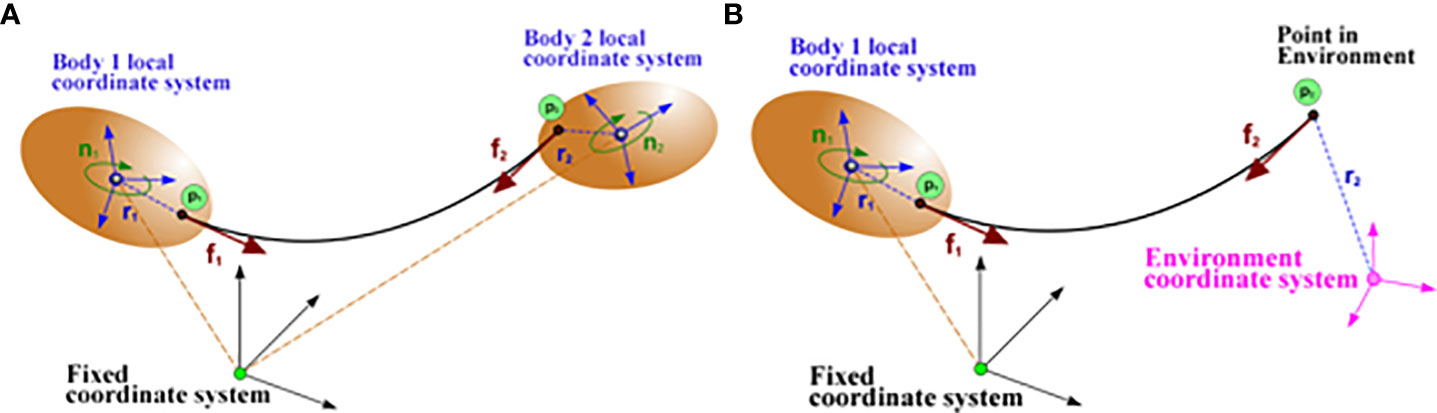
Figure 1 Catenary coupling: (A) between two bodies; (B) between a body and the environment.
It has been proposed that mooring system effects on point absorbers are rather modest; but, under extreme storm circumstances, the mooring load may have a significant impact on the point absorber’s stability and performance (Harris et al., 2004; Davidson and Ringwood, 2017; Xu et al., 2019). Fitzgerald and Bergdahl (2008) looked at the frequency-domain dynamics of point absorbers and the impacts of mooring systems. Several mooring configurations were evaluated. The results showed that the heave performance of devices is affected differently depending on the mooring mechanism used. The severe mooring loads were examined by Krivtsov and Linfoot (2014), who tested a physical model of a group of WECs. Logistic and normal distributions seemed to account for the bulk of the weights on the mooring lines, whereas the extreme value distribution seemed to account for the right tail. The slack mooring and two hybrid mooring techniques for WECs were the subjects of experimental research by Xu et al. (2020). Natural durations for heave and pitch were found to be mostly unaffected by mooring arrangement. By and large, the floating-point absorber should be constructed such that its concerned natural period is near to the normal wave period at the target location (Bachynski et al., 2012; Vicente et al., 2013; Xu et al., 2018).
The main function of the mooring system is station-keeping for the majority of wave energy ideas (Qiao et al., 2020; Touzon et al., 2020; Depalo et al., 2022; Xu et al., 2022; Liu and Soares, 2023). According to several studies (Bhinder et al., 2015; Palm et al., 2016; Paredes et al., 2016; Liu et al., 2023; Xu and Soares, 2023), mooring dynamics may be very non-linear and have a major impact on the dynamics, energy absorption, and survival of the system. The performance of an array may also be considerably affected by the mooring mechanism (Vicente et al., 2009; Vicente et al., 2010; Liu and Soares, 2022). Using the coupled response analysis approach, Yang et al. (2020) investigated the power performance of WEC arrays and the fatigue life of moorings. It was discovered that the fatigue damage in moorings was significantly influenced by the hydrodynamic contact between WECs in an array. Gubesch et al. (2022) carried out experimental study on the effects of different mooring configurations on the hydrodynamic performance of an oscillating water column WEC. The results showed that among the floating-moored conditions, the 45° taut mooring performed best, followed by the vertical taut and catenary mooring. The mooring stresses in both taut-moored circumstances were substantially greater than in the catenary moored condition.
As can be seen from the overview of recent studies, moorings in wave farm simulations are often approximated as linear springs or simply ignored because of the large processing demand necessary for non-linear mooring simulations (Harnois et al., 2015; Huang et al., 2019). The information that can be gleaned from past studies about the interaction between the mooring system and the floating-point absorber is insufficient. The purpose of this study is to develop a numerical model of a floating-point absorber coupled to a catenary mooring system and to get a better understanding of the mooring force and behavior of the point absorber subjected to waves of different lengths frequencies. The novel contribution is to provide a numerical technique for predicting the hydrodynamics of WEC coupled with mooring system. The main idea of this paper is organized as follows: In Section 2, numerical modeling methodology, computational fluid dynamics basics, and the coupling technique of body connections between the floating-point absorber and catenary mooring are all presented. The validations of the numerical technique are presented in Section 3. Section 4 introduces the numerical model used for investigating. The observations and analyses in Section 5 focus on three different types of wave circumstances, such as fluctuations in wave height, wave period, and current velocity. Finally, Section 6 concludes with presenting the findings of this investigation.
2 Methodology
2.1 Governing equation
The conservation of mass, linear, angular momentum, and energy are the basic rules that control the mechanics of fluids and solids. The Navier-Stokes equations and the equation of continuity may be utilized to condense equations. Turbulence models provide closure relations for the Reynolds-Averaged Navier-Stokes (RANS) equations, which govern the propagation of the average flow quantities in CFD simulation. The Reynolds-Averaged Navier-Stokes equations are derived from the instantaneous Navier-Stokes equations by decomposing each solution variable (ϕ) into its mean value and its fluctuating component (ϕ’) its mean value and its fluctuating component (ϕ'), as shown in Equation 1:
where ϕ stands for the various elements of velocity, pressure, energy, or species concentration.
For steady-state settings, the averaging procedure may be thought of as time-averaging, and for repeating transient events, as ensemble averaging. Equations for the mean quantities may be obtained by substituting the decomposed solution variables into the Navier-Stokes equations. The equations for the mean mass and momentum transit read as shown in Equations 2, 3:
where, ρ, , , I, I, , represents density, mean (velocity, pressure, identity tensor and viscous stress tensor) and fb is resultant of the body forces (such as gravity and centrifugal forces).
Except for the inclusion of a new component in the momentum and energy transfer equations, these equations are almost similar to the original Navier-Stokes equations. The following is a definition for the stress tensor, a new concept introduced as shown in Equation 4:
where k is the kinetic energy of the turbulent flow.
As a result, solving the governing equations by modeling T’ in relation to the median flow variables is challenging. The governing equations are solved in this research using the eddy viscosity model. The eddy viscosity model is based on the similarity between the molecular gradient-diffusion mechanism and turbulent motion. The turbulent eddy viscosity notion allows for the representation of the stress tensor as a function of average flow variables.
2.2 Turbulence model
The turbulent eddy viscosity (Wilcox, 1998; Wilcox, 2008) is calculated using the k-turbulence model, a two-equation model that resolves transfer equations for the chaotic kinetic energy and the specific dissipation rate. The k-ω model has been shown to perform better for boundary layers when there are negative pressure gradients than the k-ϵ model. The biggest benefit, however, is that it may be used without additional modification in the viscous-dominated portion of the boundary layer as well.
The SST k-ω model is employed as the turbulence model in this study. The converted equation resembles the Standard k-model equation, but it also includes a new non-conservative cross-diffusion component that contains the dot product ∇k·∇ω. The k-ω model may provide results that are the same as the k-model if this term is added to the transport equation. Menter (1994) advocated the use of a blending function (which incorporates wall distance functions) that would incorporate a cross-diffusion factor distant from walls but not close to the wall. This method successfully combines a k-ϵ model in the distant field with a k-ω model close to the wall. The transport equations for the specific dissipation rate k and the kinetic energy ω as shown in Equations 5, 6:
where, , and μ, are mean velocity dynamic viscosity. σk, and σω, Cϵ1, and Cϵ2 are model coefficients. Pk and Pω are production values. fβ∗ and fβ are vortex-stretching and vortex-stretching modification factor. Sk and Sω are user-specified source relations. k0 and ω0 are ambient disorder standards that stabilize turbulence decay.
2.3 Volume of fluid method
The development of free surface for a two-phase flow is captured using the volume of fluid (VOF) approach. The actualization of the Volume of Fluid (VOF) multiphase model is a member of a group of interface-capturing techniques that forecast when immiscible phase interfaces would move and disseminate. This modeling strategy presupposes that the mesh resolution sufficient for identifying the location and geometry of the phase interactions.
The fields of phase volume fraction ai describe the distribution of phases and the location of the interface. The following equation describes the volume fraction of phase i, as shown in Equation 7:
where V is cell’s volume and Vi is volume of phase I within the cell. It is generalized that volume fractions phases are sum a maximum value of 1, as shown in Equation 8.
where N represents total phases.
The existence of distinct phases or fluids in a cell may be identified based on the volume fraction’s value:
αi =0 complete negated of phase i;
αi =1 occupied with phase i;
0< αi< 1 denotes the difference between the two limits point to the existence of a phase interface.
The material properties of the component fluids are taken into account when calculating the material properties of the cells comprising the interface. In a cell with many interfaces, all of the fluids are considered to be part of a single mixture, as shown in Equations 9–11:
where ρi, μi and (Cp)i are density, dynamic viscosity and specific heat of phase i.
2.4 Catenary coupling
In this paper, the catenary coupling models an elastic, quasi-stationary catenary (such as a chain or towing rope), which is hanging between two end points, being subject to its own weight in the gravity field. In a local Cartesian coordinate system, the shape of the catenary is given by the following set of parametric equations, as shown in Equations 12, 13:
Where, , , . In these equations, g is the gravitational acceleration, λ0 and Leq are the mass per unit length and the relaxation length of the catenary, respectively, under force-free conditions. D is the stiffness of the catenary, and α and β are integration constants depending on the position of the two end points and the total mass of the catenary. The curve parameter u is related to the inclination angle ϕ of the catenary curve by the following as shown in Equation 14:
The parameter values u1 and u2 represent the positions of the catenary’s end points p1 and p2 in parameter space.
The forces f1 and f2 acting at the two end points of the catenary are directed along the local tangent vectors of the catenary curve at the parameter values u1 and u2, respectively. They are given by the following, as shown in Equations 15, 16:
The catenary coupling element, which a catenary coupling node represent, models a quasi-stationary, elastic catenary between a pair of bodies, or between one body and the environment. Examples of where this element could be used are in modeling a tugboat and its payload, or a moored vessel and its associated tether. Quasi-stationary means that the catenary has its steady state shape at each instant of time. This model is appropriate for body motions which are sufficiently slow compared to the wave velocity in the catenary. The catenary coupling between two bodies is depicted in Figure 1A.
The forces f1 and f2 are tangential to the catenary curve; sthe horizontal components are equal, but with opposite sign. For a coupling between a body and the environment, the system becomes the scene as depicted in Figure 1B.
There is a known limitation of the catenary coupling method: the end points of the coupling must not become vertically aligned, as this results in a singularity in the underlying catenary equation. It is therefore necessary to ensure that the end points of the catenary do not coincide in the vertical direction during the simulation.
3 Verification of numerical method
Two validation studies were carried out in order to verify the correctness of the aforementioned numerical methodologies. In the first case, numerical findings were compared with experimental data given by Ren et al. (2015) for the same wave heights and the floating body to validate the aforementioned numerical methodologies and wave making simulations. As a model, we choose Stokes waves of the first order. The smallest wave height is 0.04m and the largest is 0.1m. The duration of a wave is 1.2s. The dimensions of the floating cube are 0.3m by 0.42m by 0.2m. The dimensions of the computational tank are 4.3 m in length, 3 m in breadth, and 0.8 m in height. The centroid of the floating box is located 0.4 meters from the bottom of the numerical tank, giving a starting water depth of 0.4 meters. Figure 2A displays the dimensions and layout of the floating box and numerical tank.
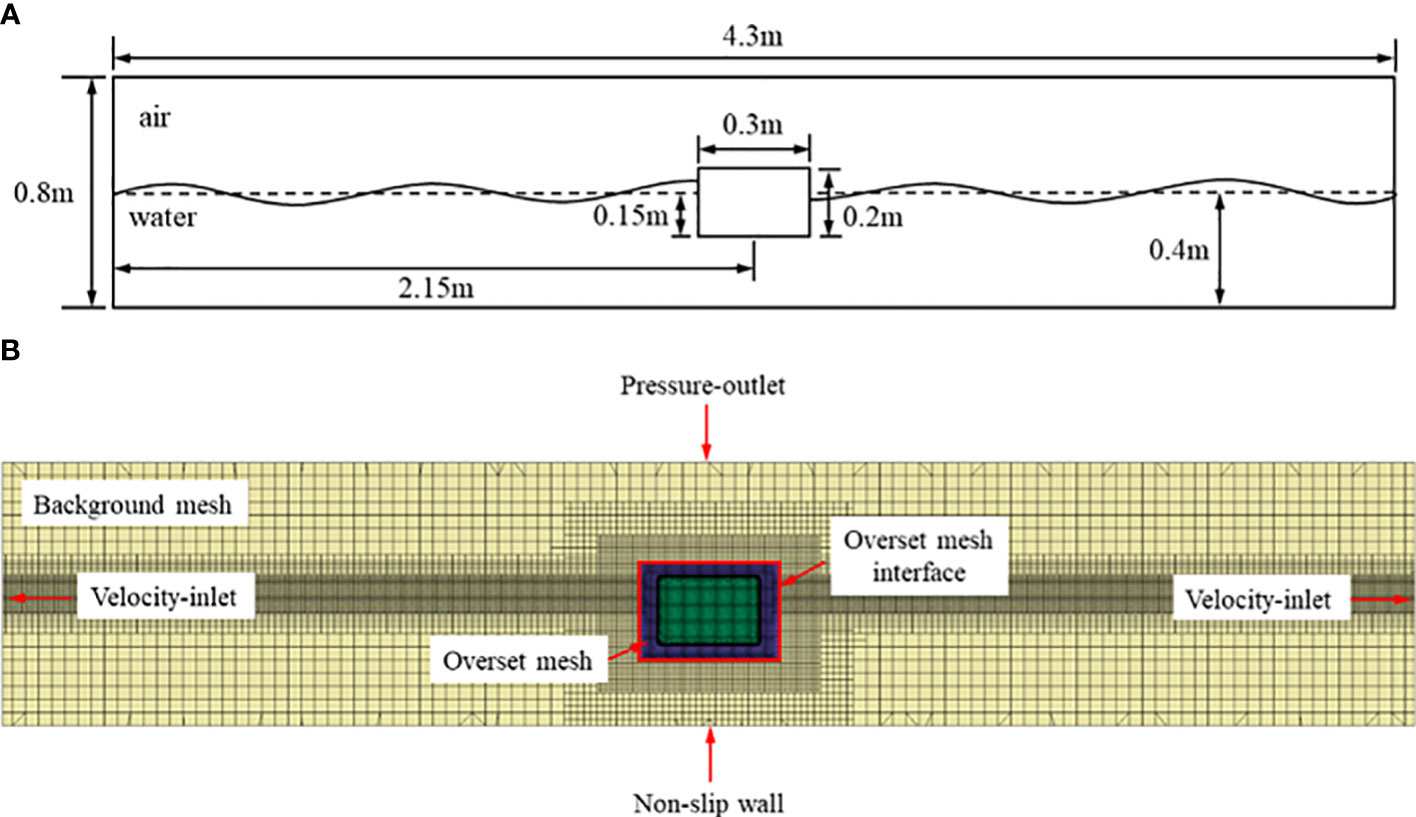
Figure 2 (A) Size and configuration of numerical tank and floating box; (B) Boundary conditions and the mesh of numerical tank and floating box.
To imitate the movements of the floating box, an overset mesh is used. The overset area has a mesh number of 408393, whereas the background area has a mesh number of 3739104. Figure 2B shows the boundary conditions and mesh. The bottom of the virtual tank is configured as a frictional barrier and the top as a pressure release valve. The use of force attenuation.
Figure 3 shows the results of a comparison between the simulation and the experiments. Where z is the centroid’s position at time t, d is the water tank’s depth, and T is the wave period, these values are shown as a function of t/T. As can be seen in Figure 3, the simulation findings closely mirror the actual data, particularly for the lower wave height. The modeling findings suggest a slightly smaller projection for the greater 0.1 m wave height, the maximum difference between calculation and the experimental result reaches nearly 5%. One possible explanation for such a large wave height is the use of the linear wave model. Possible cause: owing to numerical dissipation in the simulation, the numerical wave height is less than the actual wave height. The overall consistency between the simulation and the experiment demonstrates the validity of the numerical approach.
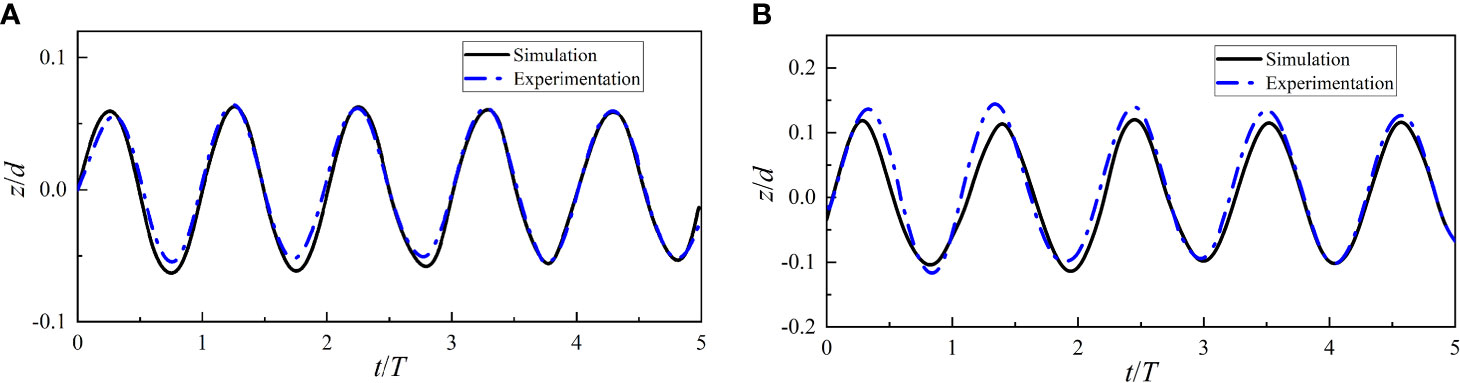
Figure 3 Comparison between the simulation results and experimental results: (A) wave height is 0.04m; (B) wave height is 0.1m.
The second case was a simulation of a floating box couped with a catenary mooring system to validate the reliability of catenary coupling method. Experimental results came from tests in a 30.0 m long, 1.0 m wide and 1.2 m high wave flume (Wu et al., 2019), which was equipped with second-order wave generation and absorption techniques. The numerical results were also compared numerical code MoorDyn provided by Chen and Hall (2022). The dimensions of the floating box are 0.2m by 0.2m by 0.132m. The box mass is 3.16kg. The mooring line length is 1.455m, the mass per unit length is 0.607g/cm. The initial pretension at the mooring anchor points calculated was set to 0.31N, in agreement with the experimental measurements. A global coordinate system is defined with the positive x-axis following the wave propagation direction (from left to right) and the positive z-axis pointing upwards. Horizontally x=0 and y=0 is located at the box’s geometric center, and vertically z=0 is defined at the still water level. The incident regular wave conditions for model validation are selected as follows: the wave height is 0.12m, the wave period is 2s, the water depth is 0.5m and the wave length is 4.06m. The overset area has a mesh number of 437264, whereas the background area has a mesh number of 3931886. The boundary conditions are set as that of the first case.
Figure 4 depicts the surge, heave and pitch motions of the floating box coupled with catenary system. Satisfactory agreements were obtained in surge motion predictions, while some discrepancies were present in heave and pitch motions with the maximum difference exceeding 20%. The MoorDyn code uses the lumped mass method to simulation the dynamic behavior of the catenary, while this paper uses a catenary coupling method. The boundary layer modeling on the lateral sides (normal to the y-axis) of the box and the 3D numerical wave tank setup may contribute to some of the discrepancies here. Overall, the CFD coupling method has a certain degree of predictability and can be applied to the subsequent calculation of the floating-point absorber coupling catenaries.
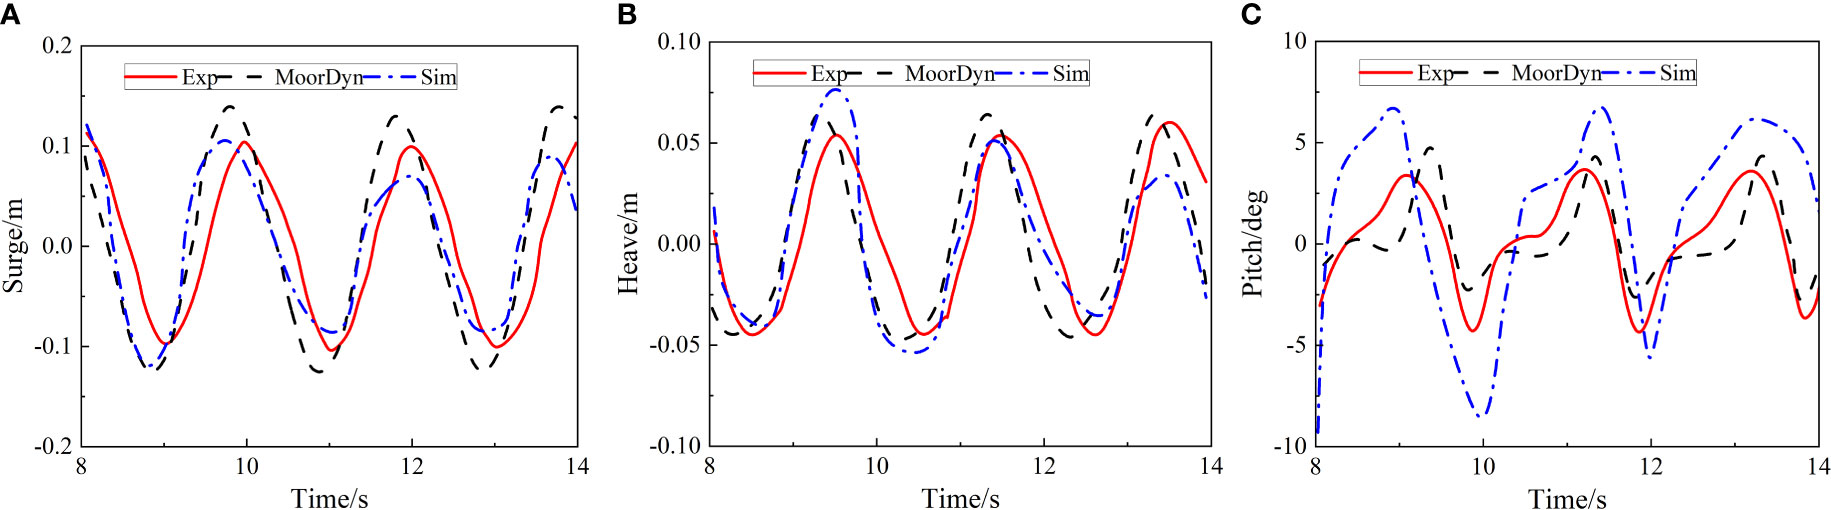
Figure 4 Motions of the floating box: (A) Surge; (B) heave, and (C) pitch.
4 Numerical model set-ups
Table 1 and Figure 5 list the WEC’s most salient features. This buoy, made out of a cylinder and a hemisphere, is a simplified version of a point-absorber WEC type. It collects energy from waves coming from all directions. Such shape design is referred to the study of Depalo et al. (2021). The radius of the cylinder is 0.15m and the height is 0.35m. The radius of the hemisphere is 0.15m. The draft of WEC is 0.399m. This study used simplified dimensions with a scaling ratio of 60, to maintain consistency with subsequent model experiments for better comparison between numerical results and experiment.
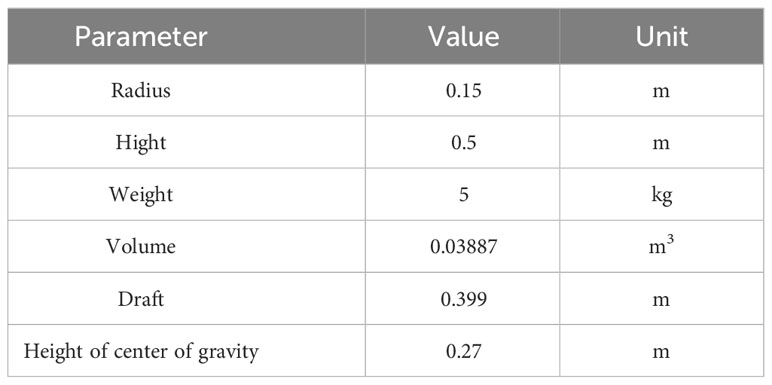
Table 1 Main characteristics of the WEC.
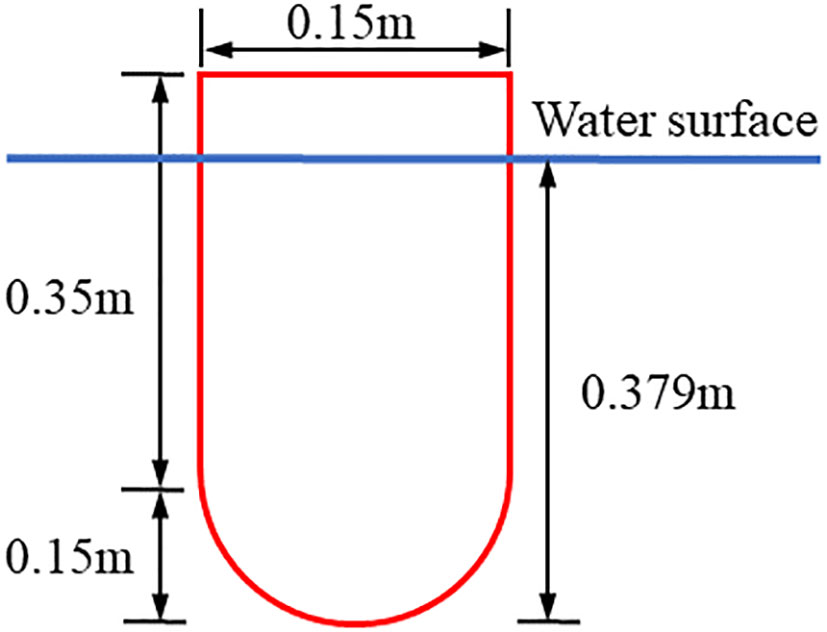
Figure 5 Sketch of the point-absorber WEC.
A catenary four-legs mooring system composed by only chain is considered for the WEC, as shown in Figure 6A, where A, B, C and D indicate the positions of the anchor points on the numerical tank. The four anchor points on the WEC are evenly distributed on the maximum circumference of the hemisphere. The unit mass length of catenary is 1kg/m, the rigidity is 1000N/m, and the relaxation length is 5.7m. The water depth is 3m.
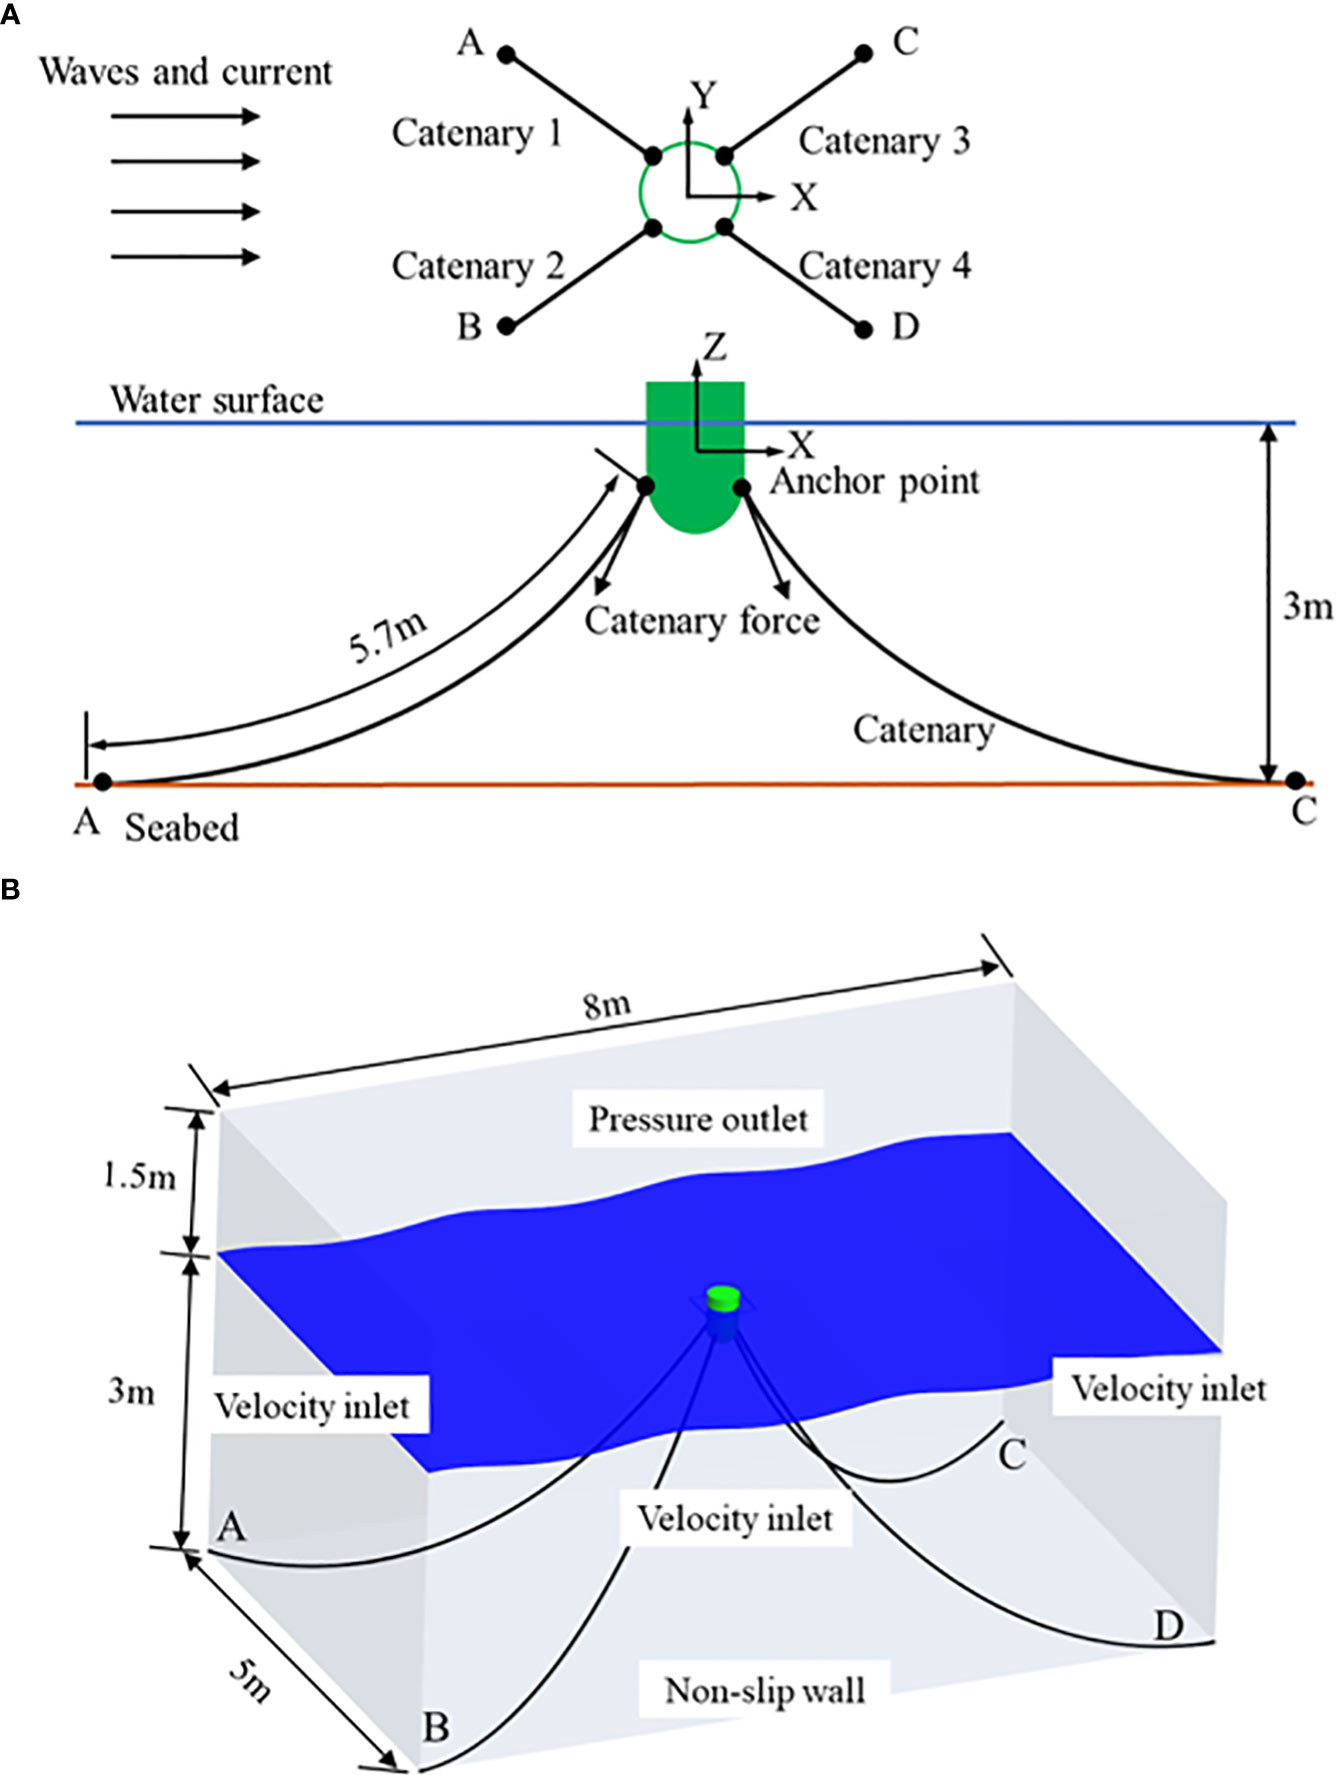
Figure 6 Numerical model setup: (A) Configuration of the mooring system; (B) The numerical aquarium’s dimensions and constraints.
The dimensions of the computational tank are 8 x 5 x 4.5 meters. The free surface is 3m above the bottom of the numerical tank. The velocity intake, pressure outlet, and non-slip wall make up the boundary conditions for the four sides of the numerical tank. Stokes waves of the first order is chosen. The dimensions and boundary conditions of the computational tank are shown in Figure 6B.
In this paper, the effects of the wave height, wave period, and current velocity on hydrodynamic performance of the floating-point absorber are studied. When studying the properties of wave height, the wave period is fixed at 1.2s, the current velocity is 0m/s, and the range of wave height variation is 0.04m-0.14m, with an interval of 0.02m. When studying the effects of wave period, the wave height is fixed at 0.1m, the current velocity is 0m/s, and the variation range of wave period is 0.6s-1.6s, with an interval of 0.2s. When studying the effects of current velocity, the wave height is fixed at 0.1m and the wave period is fixed at 1.2s, three current velocities, 0.5, 1, and 1.5m/s are designated.
5 Results and discussion
5.1 Effects of wave height
Dynamic properties of the point-absorber WEC and the catenary such as the forces in X and Z direction, the surge, heave and pitch motions and the forces of catenary 1 and 3 are studied. Figure 7 and 8 depict the X and Z forces of the WEC under different wave heights. After encountering waves, the longitudinal force (X force) of WEC varies significantly in the first 4 cycles. After t/T>4, the amplitude of X force is smaller. The mutual coupling between WEC and catenary mainly causes this phenomenon. At the initial moment, WEC will sway under the action of waves. The four catenaries will also change from loose to tight, controlling the movement of WEC within a certain range. In the time domain, the influence of wave height on X force is mainly reflected in the amplitude of the first 4 cycles. The higher the wave height, the larger amplitude of the X force. However, the wave height hardly changes the pattern of X force variation.
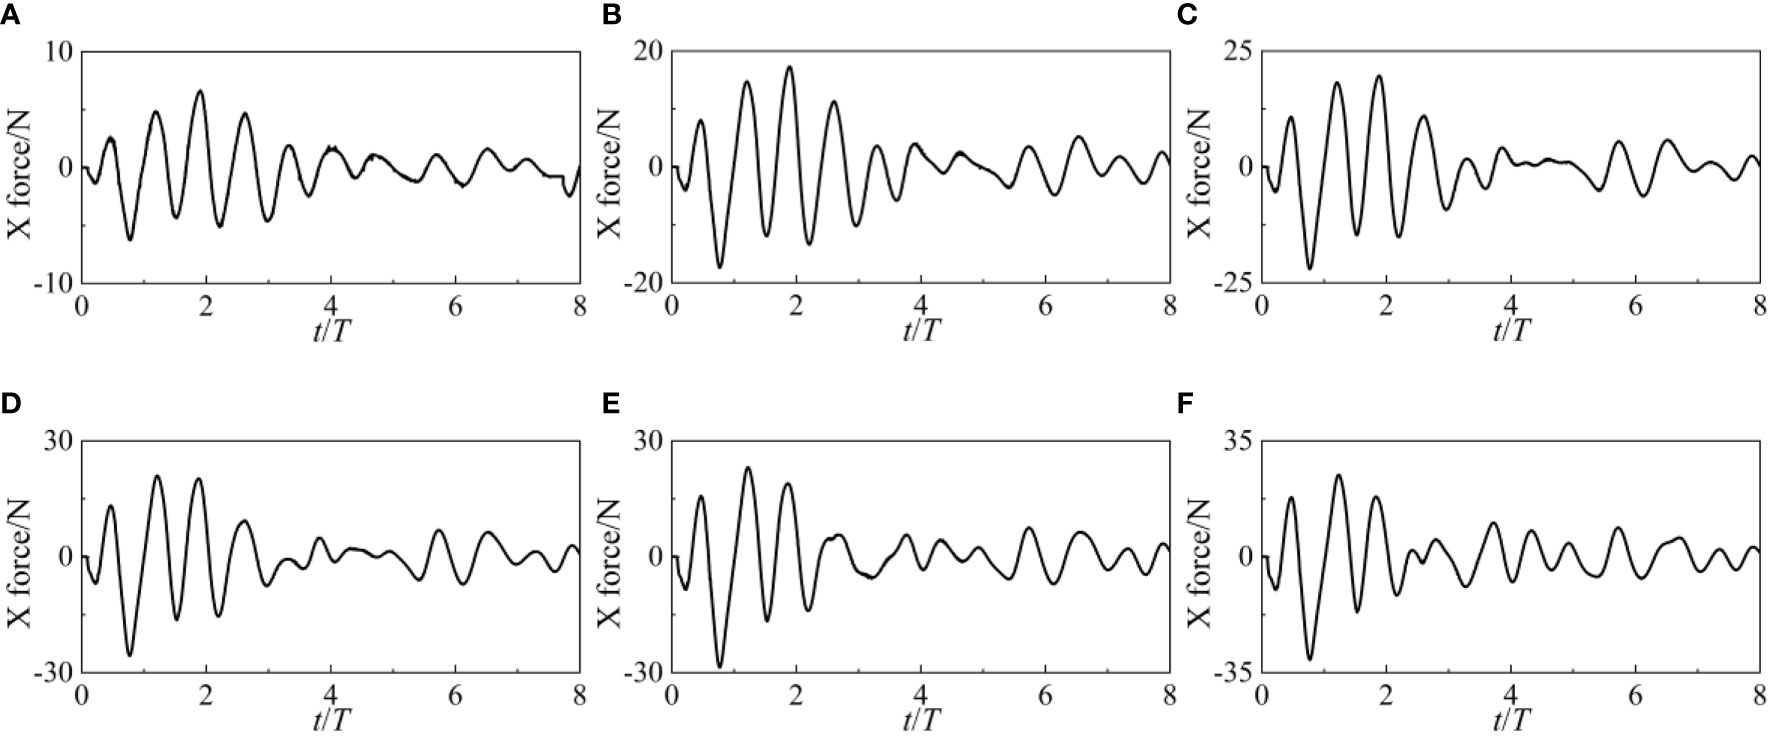
Figure 7 X force of point-absorber WEC under different wave heights: (A-F) 0.04-0.14m.
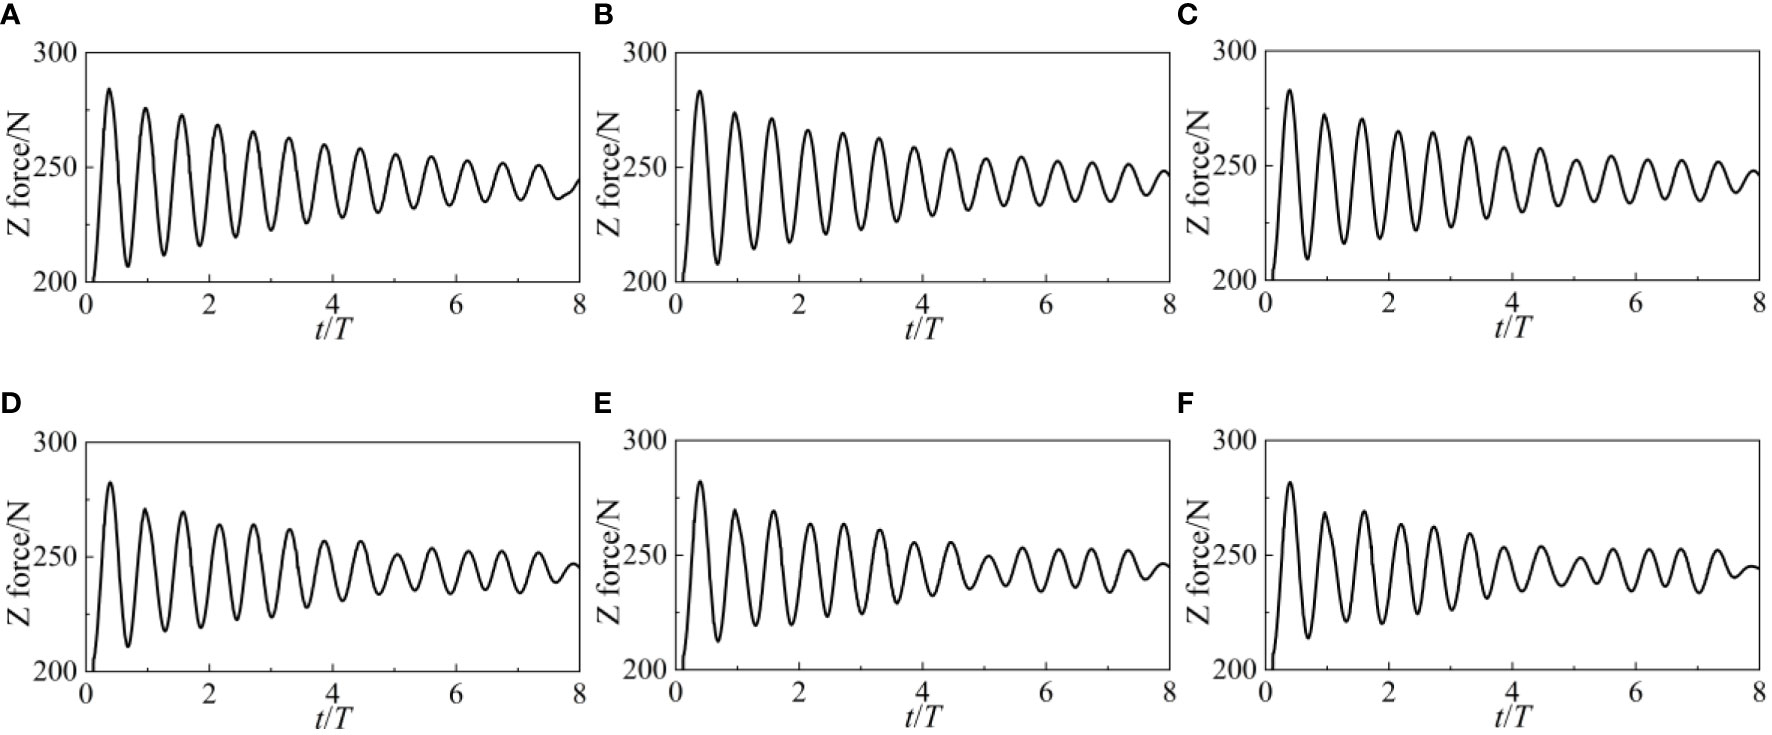
Figure 8 Z force of point-absorber WEC under different wave heights: (A-F) 0.04-0.14m.
The variation pattern of vertical force (Z force) in the time domain is linearly oscillating and decaying. At the initial moment, the variation amplitude of Z force is relatively large, and as time increases, the variation amplitude of Z force gradually decreases. The change in wave height does not alter the amplitude of the Z force or the temporal pattern of the Z force, indicating that the Z-force of WEC is not affected by wave height.
The surge, heave, and pitch movements of the point-absorber WEC are shown in Figures 9, 10, and 11 over a range of wave heights. Even if WEC’s force variations in the time domain are not linear, there are still criteria that the shaking motion must adhere to. If the surge value is positive, then the WEC is situated on the X axis’s positive half. The WEC is on the positive side of the Z-axis when the heave value is positive. A positive pitch value implies that the WEC is pitching in the opposite direction. The surge value of WEC quickly drops once it encounters waves, demonstrating that WEC will progress while being acted upon by waves. The rising heave value also suggests that the WEC is rising in the atmosphere. The WEC pitch forward as the pitch value drops sharply. Under the influence of waves, WEC experiences simultaneous surge, heave, and pitch motion, resulting in a total of three degrees of freedom.
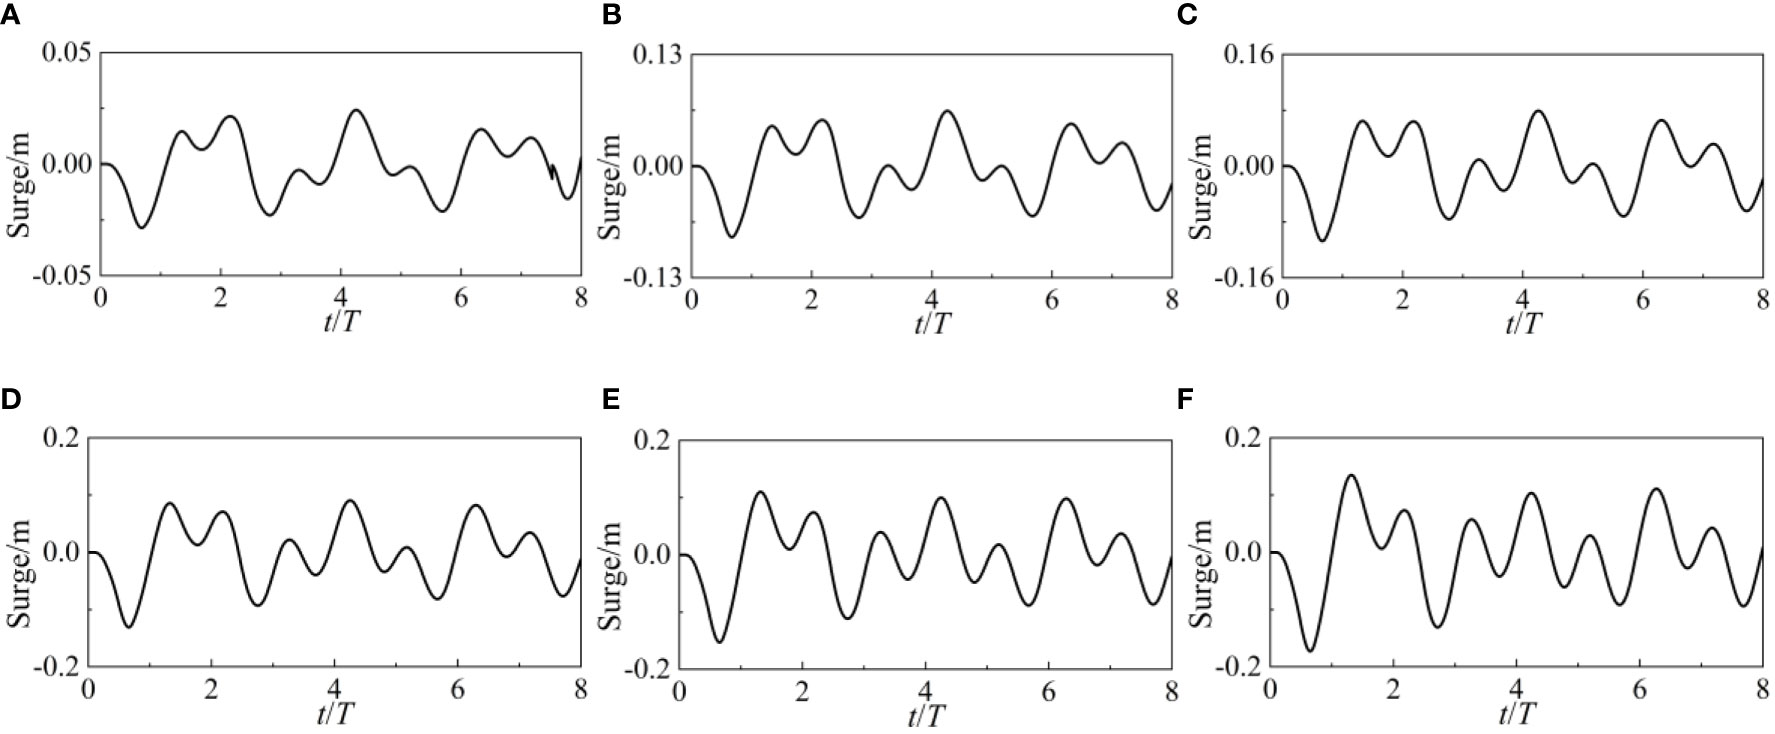
Figure 9 Surge motion of point-absorber WEC under different wave heights: (A-F) 0.04-0.14m.
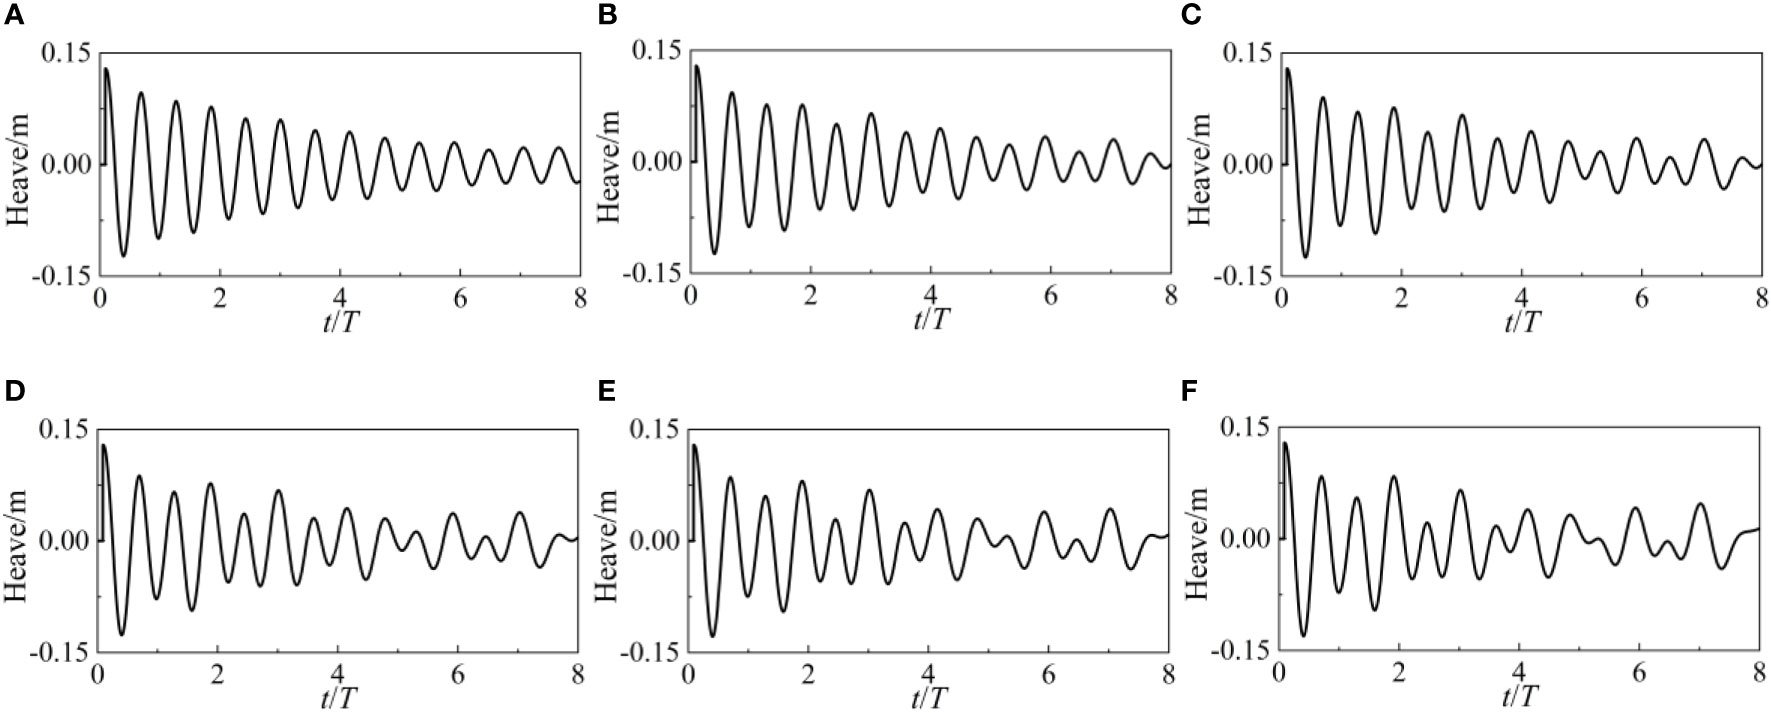
Figure 10 Heave motion of the point-absorber WEC under different wave heights: (A-F) 0.04-0.14m.
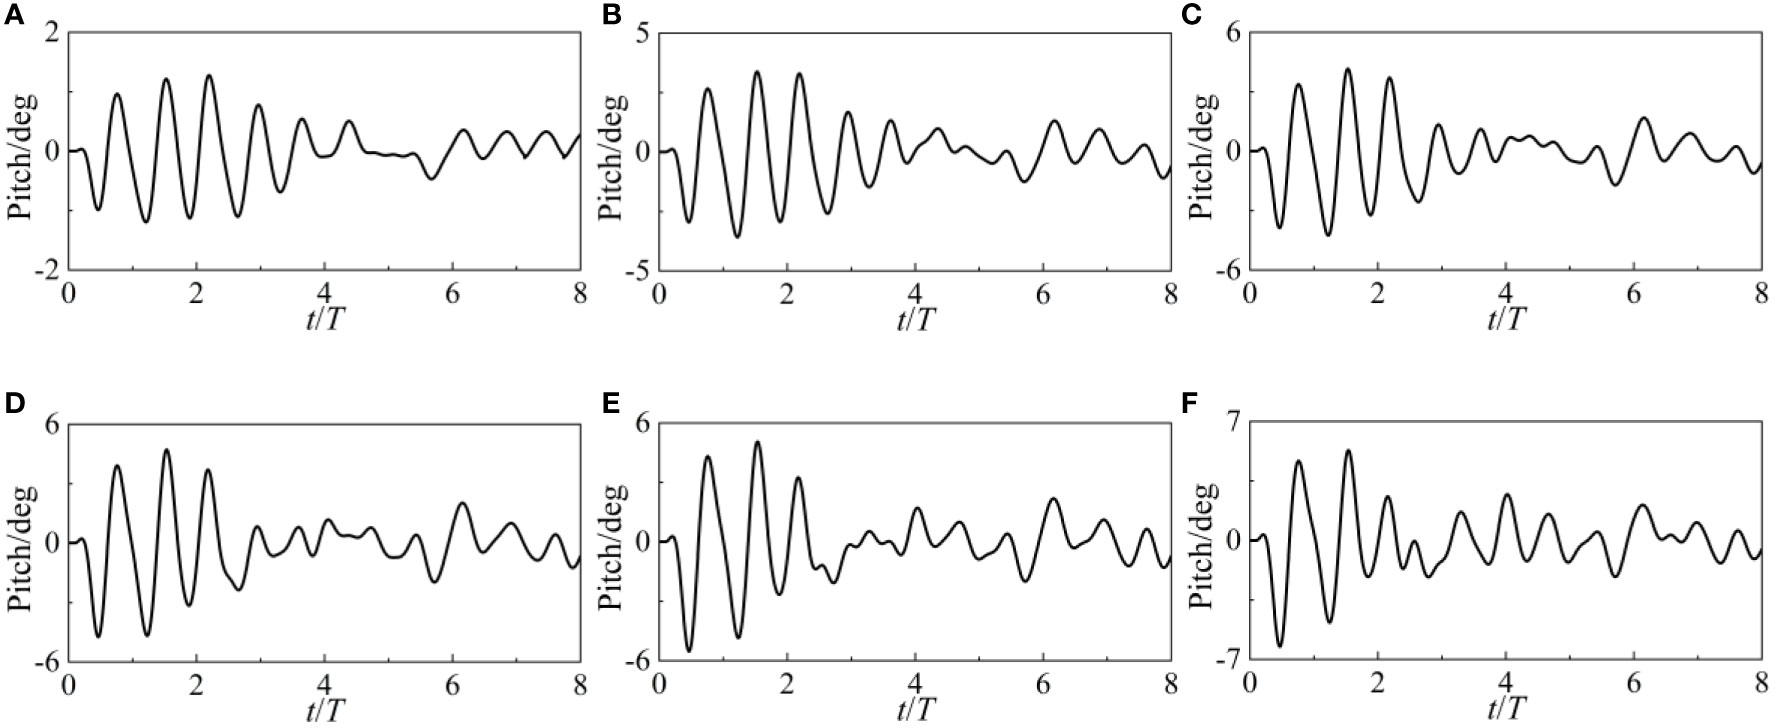
Figure 11 Pitch motion of the point-absorber WEC under different wave heights: (A-F) 0.04-0.14m.
The amplitude of the surge motion increases as the wave height increases. An increase in wave height of less than 0.1 m has little effect on the time-domain distribution of surge values. The disparity between the highest and lowest surge values increases at wave heights over 0.1 m. The WEC’s surge action is clearly amplified by these huge wave heights. The heave motion’s amplitude is equivalent to the change in Z force and is unaffected by the wave’s height. However, it is important to remember that the nonlinearity of heave motion grows in tandem with the height of the waves. The heave motion still shows periodic attenuation of oscillation at low wave heights. However, the heave action becomes disordered and chaotic at greater wave heights. The amplitude of a pitch change is proportional to the height of the wave. After t/T>3, the surge motion becomes erratic, but when t/T3, it is regular.
The catenary 1 and 3 forces are shown in Figures 12 and 13, respectively. WEC’s anchor point serves as the locus of application of the force, which acts in a direction parallel to the catenary’s tangent. Since the wave travels in a path perpendicular to the WEC, very little force is applied to the WEC in the Y axis. Both sides of the Y-axis experience the same force distribution from the catenaries. Catenary 1 and 3’s armies are excluded for that reason. The forces exerted by Catenary 2 and 4 are identical to those exerted by Catenary 1 and 3. Both the 1 and 3 catenary forces get stronger in the outset. The amplitude of the catenary’s force increases as the wave height grows. The catenary goes from a state of relaxation to tension in the first four cycles, as shown by the considerable force it exerts. There has been very little variation in the catenary force during the last four cycles. The steady operation of the WEC may be ensured by the assistance provided by the catenary.
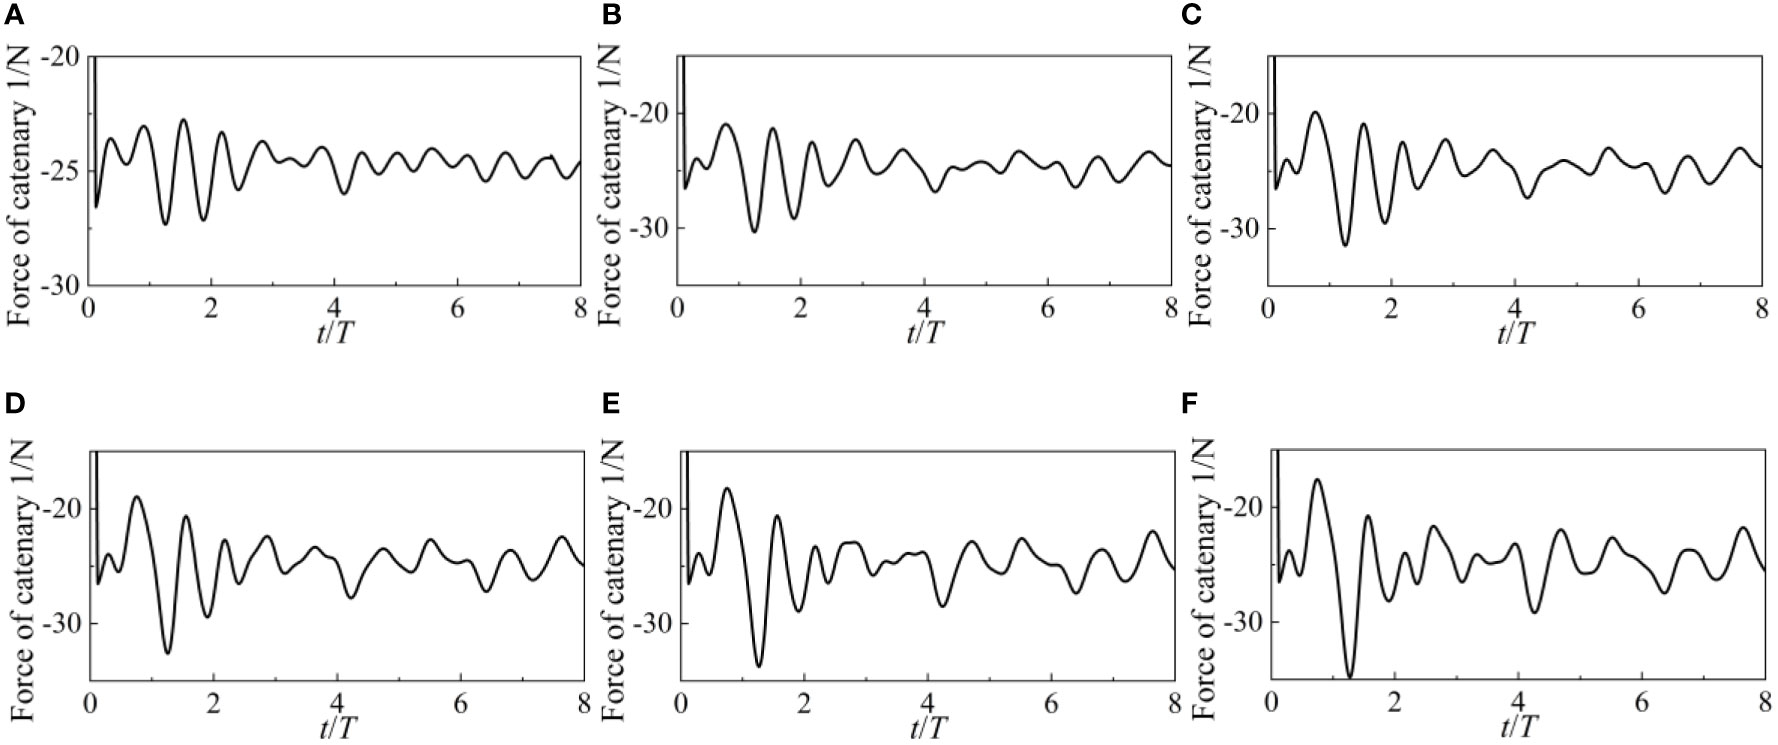
Figure 12 Force of the catenary 1 under different wave heights: (A-F) 0.04-0.14m.
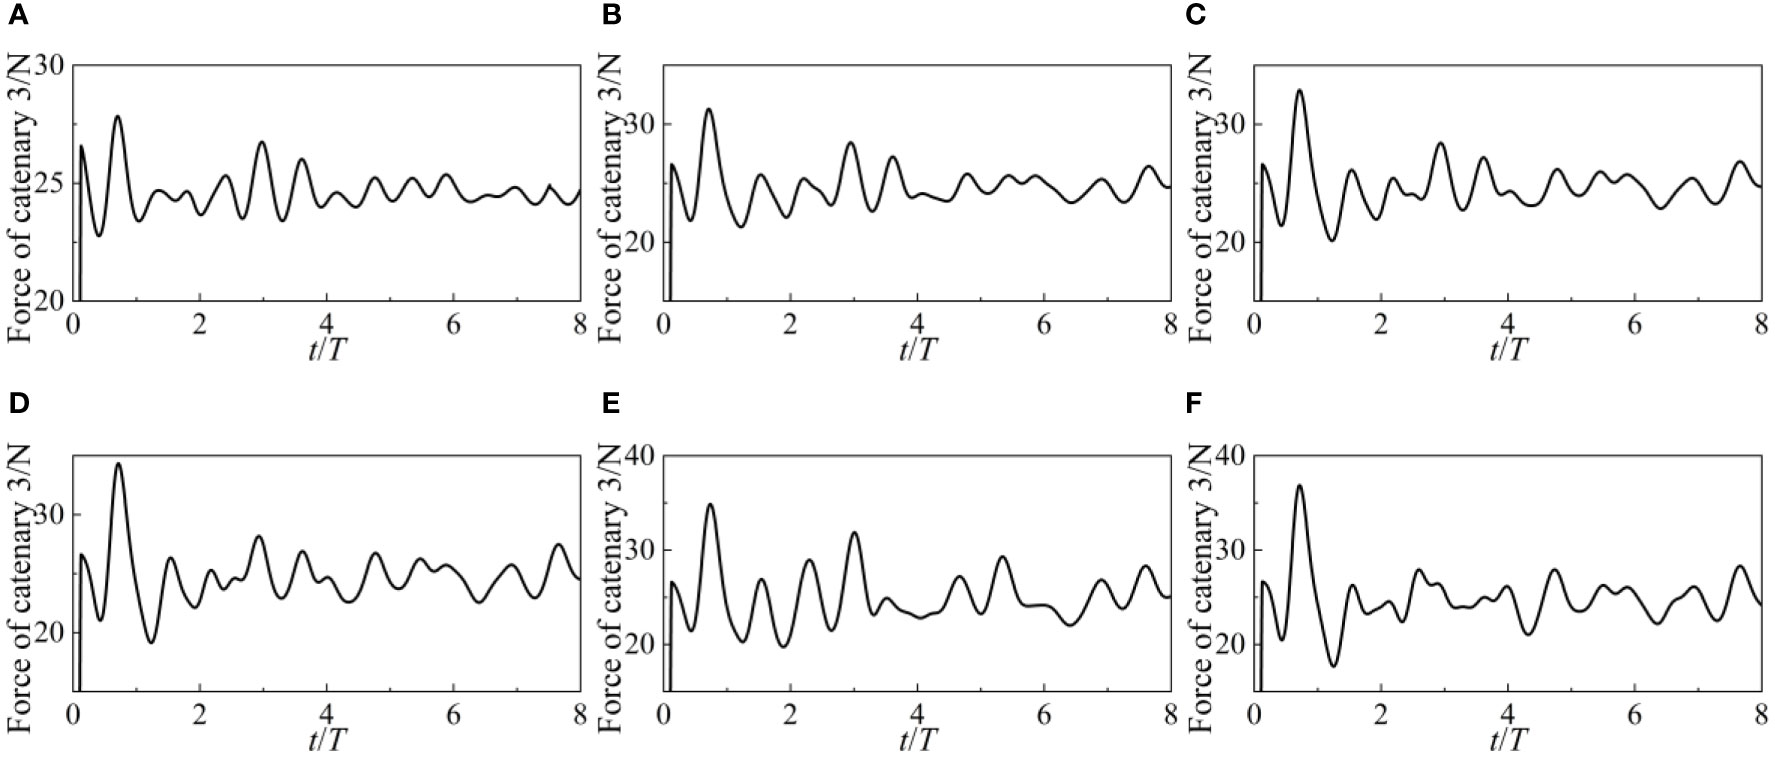
Figure 13 Force of the catenary 3 under different wave heights: (A-F) 0.04-0.14m.
5.2 Effects of wave period
The X force and Z force exerted by the point-absorber WEC throughout periods of varying wave heights are shown in Figures 14 and 15, respectively. The amplitude of the X force is close to 90N when the wave periods are 0.6s and 0.8s. The X force’s amplitude gradually reduces to about 20N as the wave period grows to 1s. The amplitude of the X force will rise somewhat as the wave period grows, but it will never go over 40N. This suggests that while the WEC is in short waves, it is exposed to a substantial longitudinal force since the frequency of waves impacting the WEC is quite high. The point-absorber WEC should stay away from producing high longitudinal forces and functioning in short waves. Similar to the variation law of wave height, the amplitude of the Z force is independent of the wave period. The Z force oscillates at a rate proportional to the frequency of the waves.
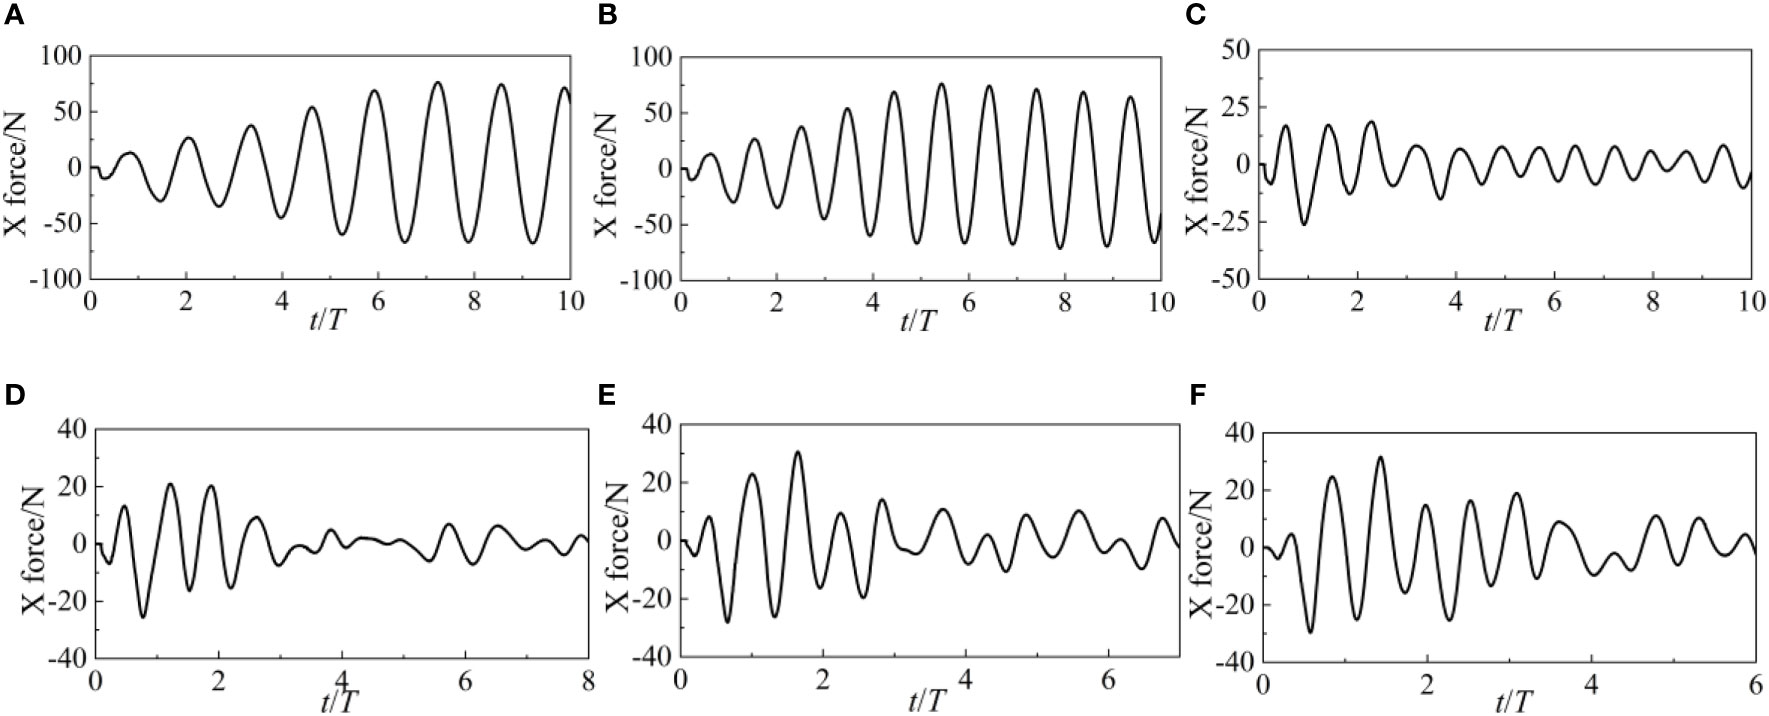
Figure 14 X force of the point-absorber WEC under different wave periods: (A-F) 0.6-1.6s.
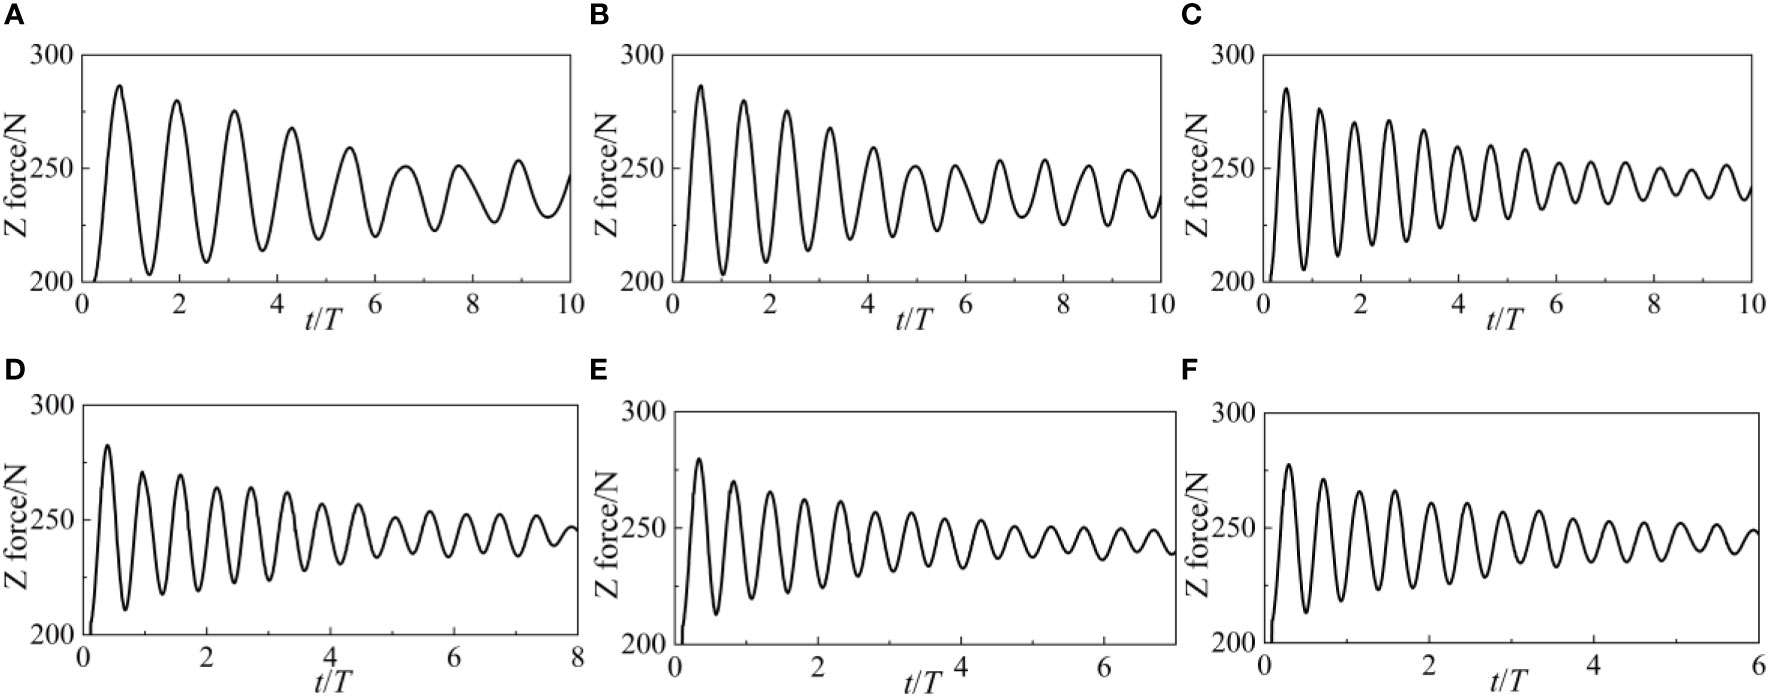
Figure 15 Z force of the point-absorber WEC under different wave periods: (A-F) 0.6-1.6s.
The point-absorber WEC is shown surging, heaving, and pitching in Figures 16, 17, and 18 as a function of wave period. The amplitude of a surge increases as the wave period grows. The WEC experiences a 4-period surge motion when the wave period is 0.6s. The period triples at a wave period of 1.6s. This indicates that the frequency of surge motion is affected by the wave period. For heave motion, the same reasoning holds true. It is important to note that the point-absorber WEC’s heave motion becomes uneven and chaotic under the situation of long wave periods. For pitch motion, an intriguing occurrence happens when the wave periods are 0.6s or 0.8s: the pitch value linearly shifts from low to high amplitude in the time domain. In contrast to periods of 0.6s and 0.8s, the pitch values are greatest in the first two cycles under periods of 1s, 1.2s, 1.4s, and 1.6s. In addition, the WEC is in a very unstable shaking condition, with pitch amplitudes of up to 20 deg under the wave periods of 0.6s and 0.8s.
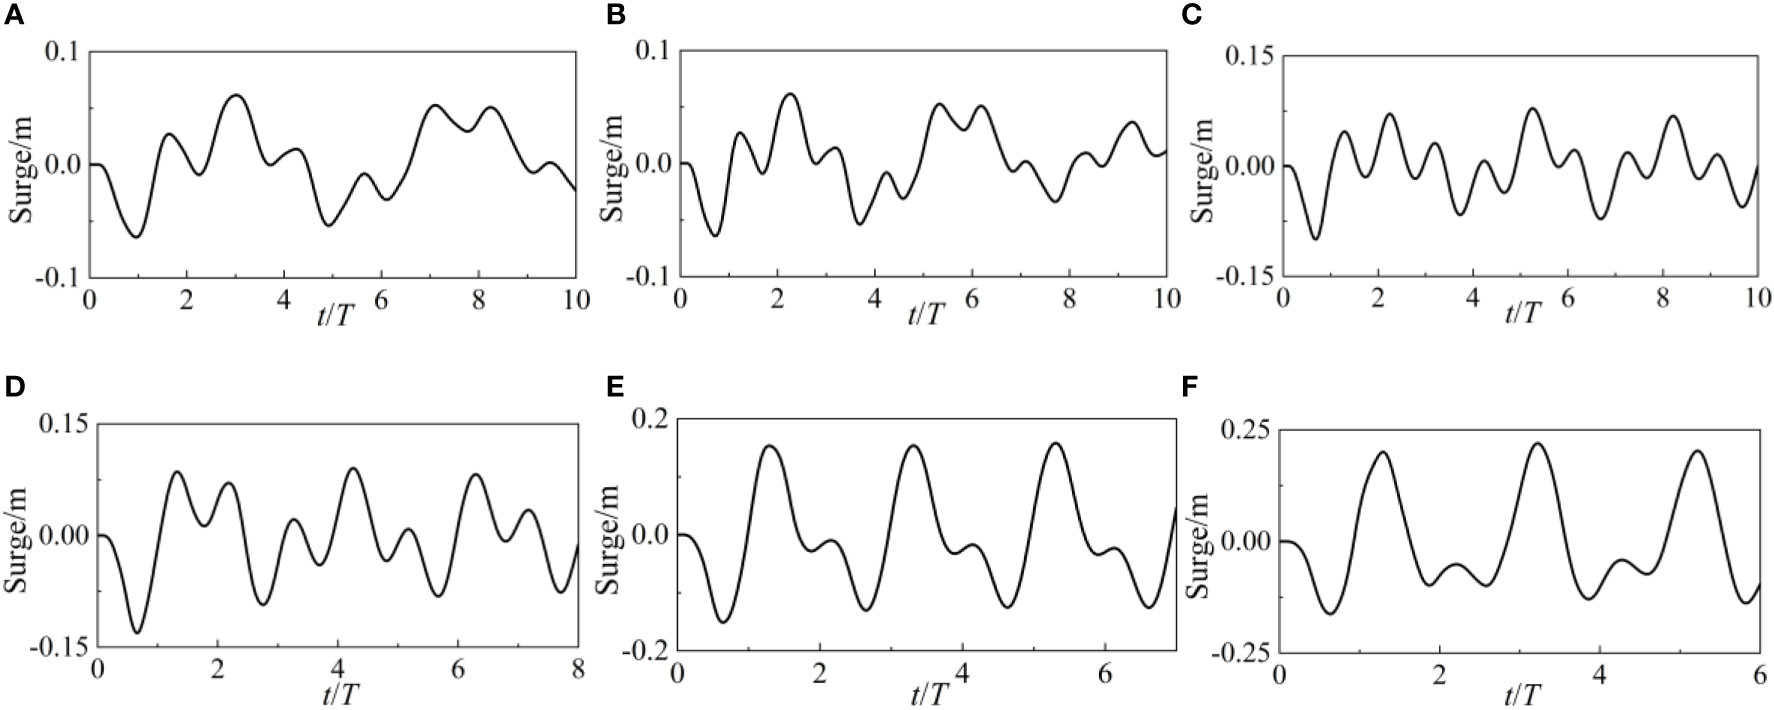
Figure 16 Surge motion of the point-absorber WEC under different wave periods: (A-F) 0.6-1.6s.

Figure 17 Heave motion of the point-absorber WEC under different wave periods: (A-F) 0.6-1.6s.
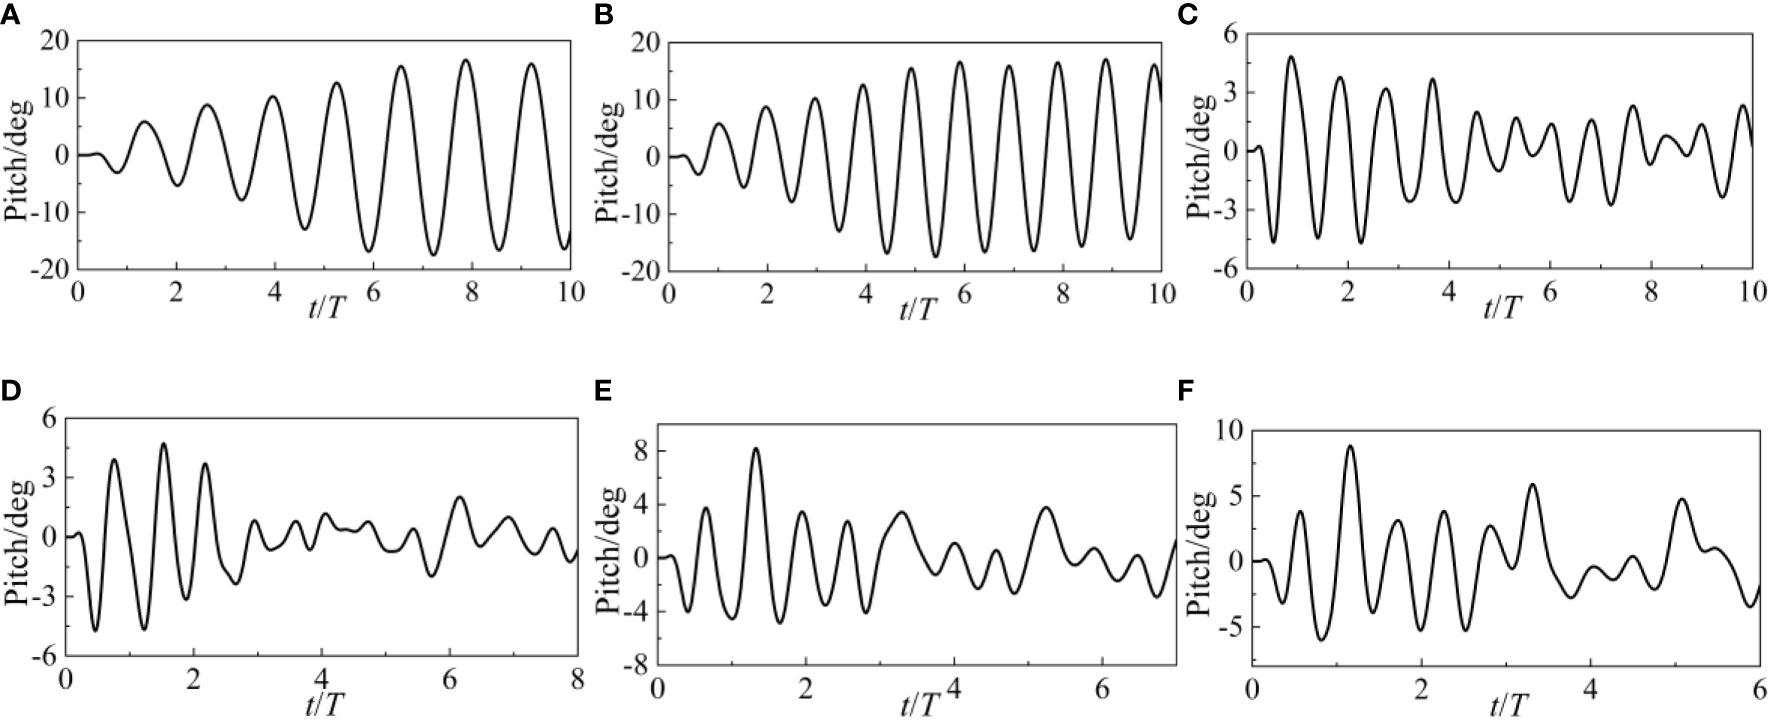
Figure 18 Pitch motion of the point-absorber WEC under different wave periods: (A-F) 0.6-1.6s.
The forces acting on the catenary 1 and 3 at various wave periods are shown in Figures 19 and 20, respectively. The forces of catenary 1 and 3 gradually grow from a low value to roughly 40N under tiny wave durations of 0.6s and 0.8s. Since the catenary’s force directions in directions 1 and 3 are almost identical, the catenary’s change in relaxation state must be the same in both directions. The four catenaries are simultaneously tightened or loosened while WEC is moving. When the wave period exceeds 0.8 seconds, the catenary forces grow together with the wave period. Both the tension states and the catenary stresses on each side of the WEC are no longer uniform.
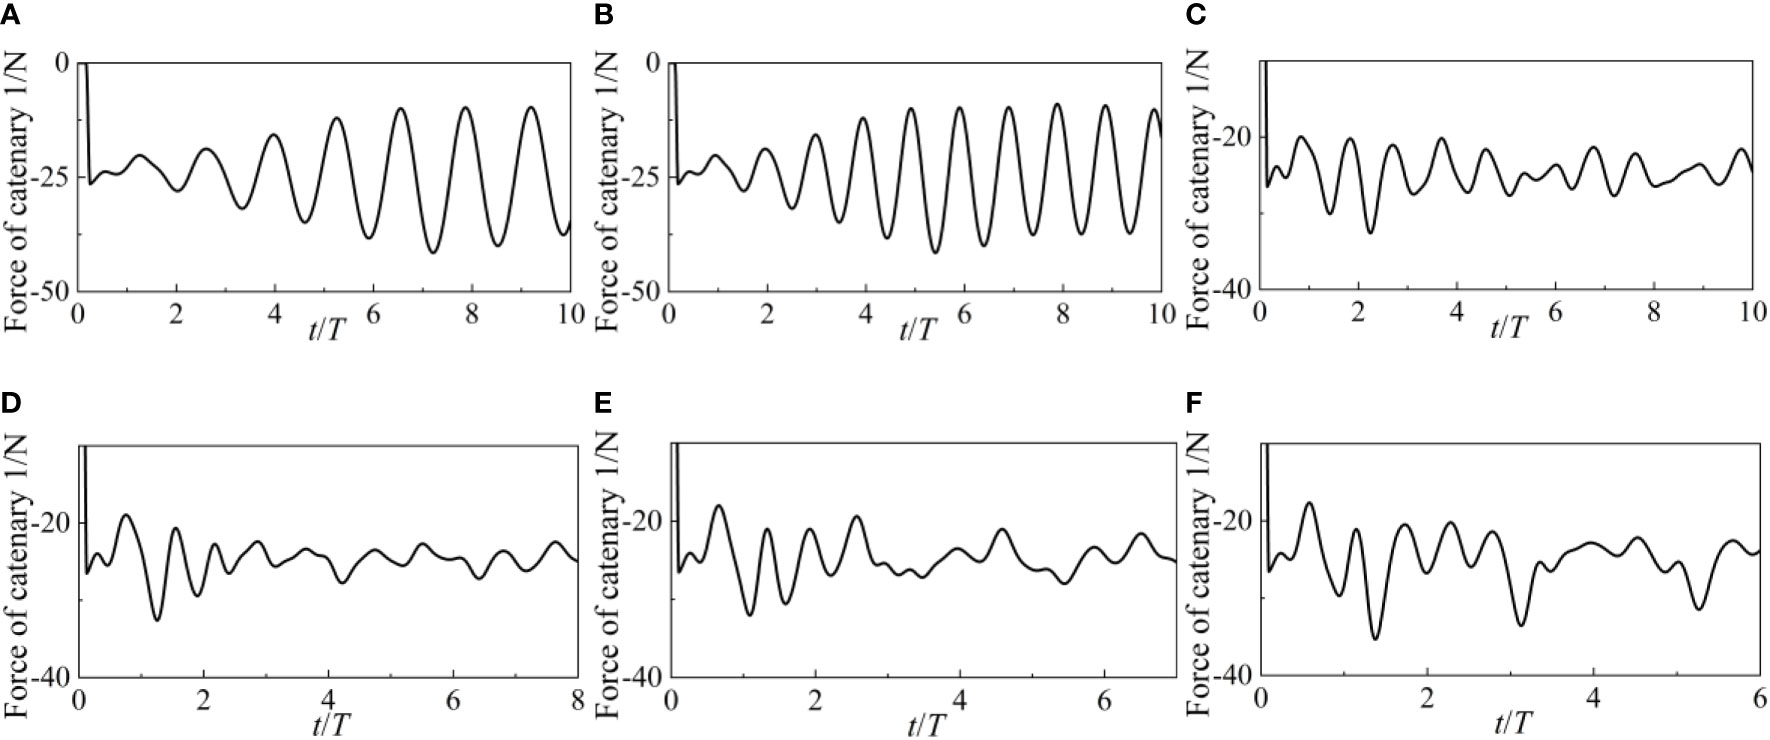
Figure 19 Force of the catenary 1 under different wave periods: (A-F) 0.6-1.6s.
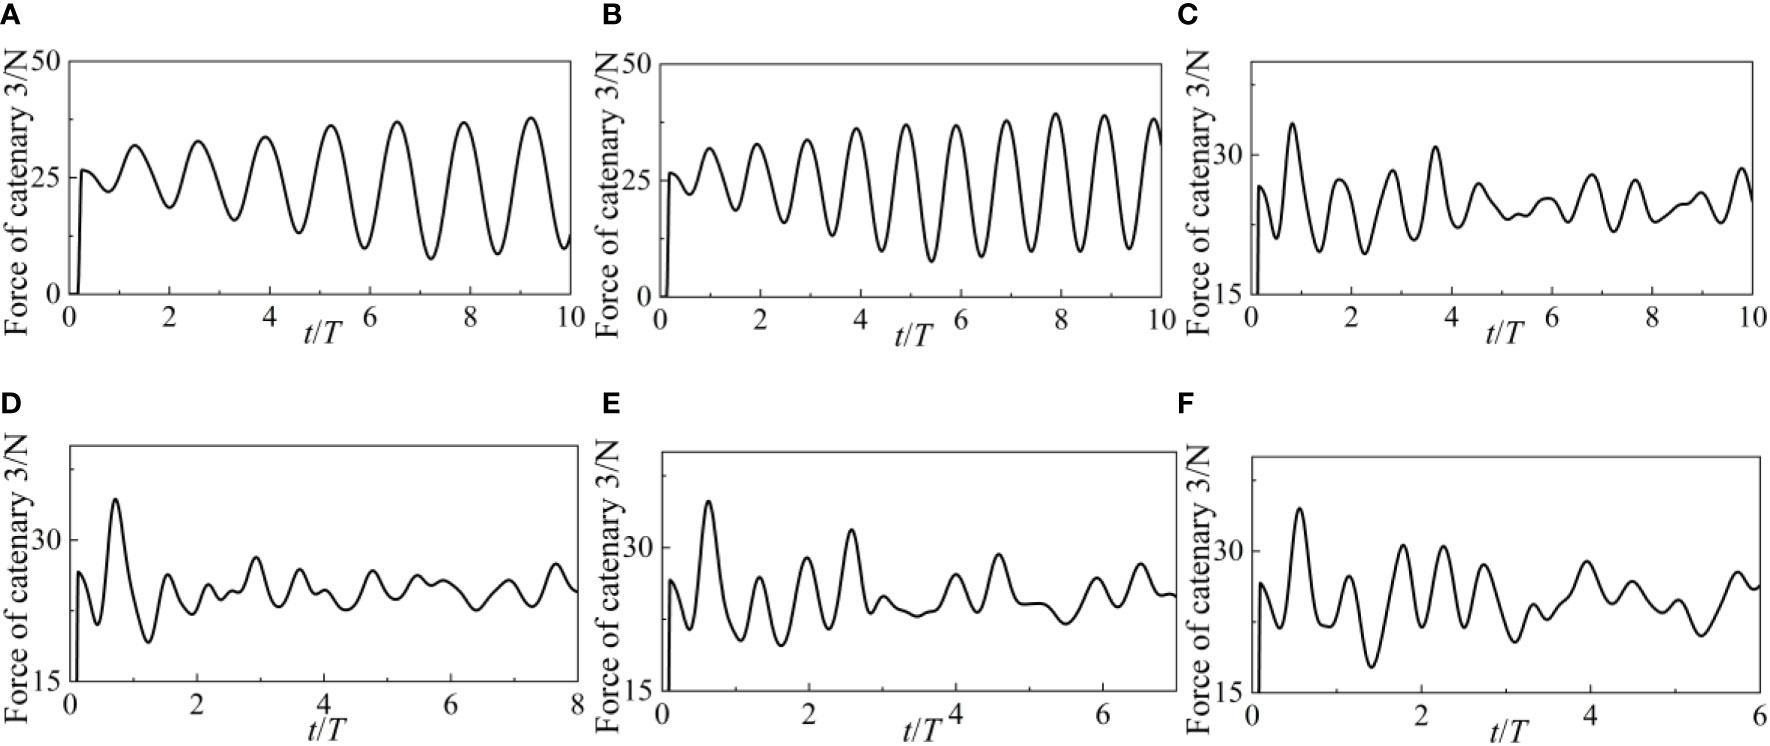
Figure 20 Force of the catenary 3 under different wave periods: (A-F) 0.6-1.6s.
5.3 Effects of current velocity
The X force and Z force of the point-absorber WEC at various current velocities are shown in Figures 21 and 22. The WEC’s hydrodynamic performance is substantially impacted by the current velocity. The X force of WEC exhibits both positive and negative values when there is no current, suggesting that WEC is being forced in the X direction. The negative X force values decrease as current increases. The X force increases with increasing current velocity, and its curves are stable oscillating curves. Since the average value of X force is always greater than 0, WEC is always under the same amount of force as the incoming current. The same results are true for the Z force. In particular, the presence of burrs in the X and Z force curves at current velocities of 1.5 m/s shows that the force acting on WEC has already shown substantial nonlinearity at such a high current velocity.
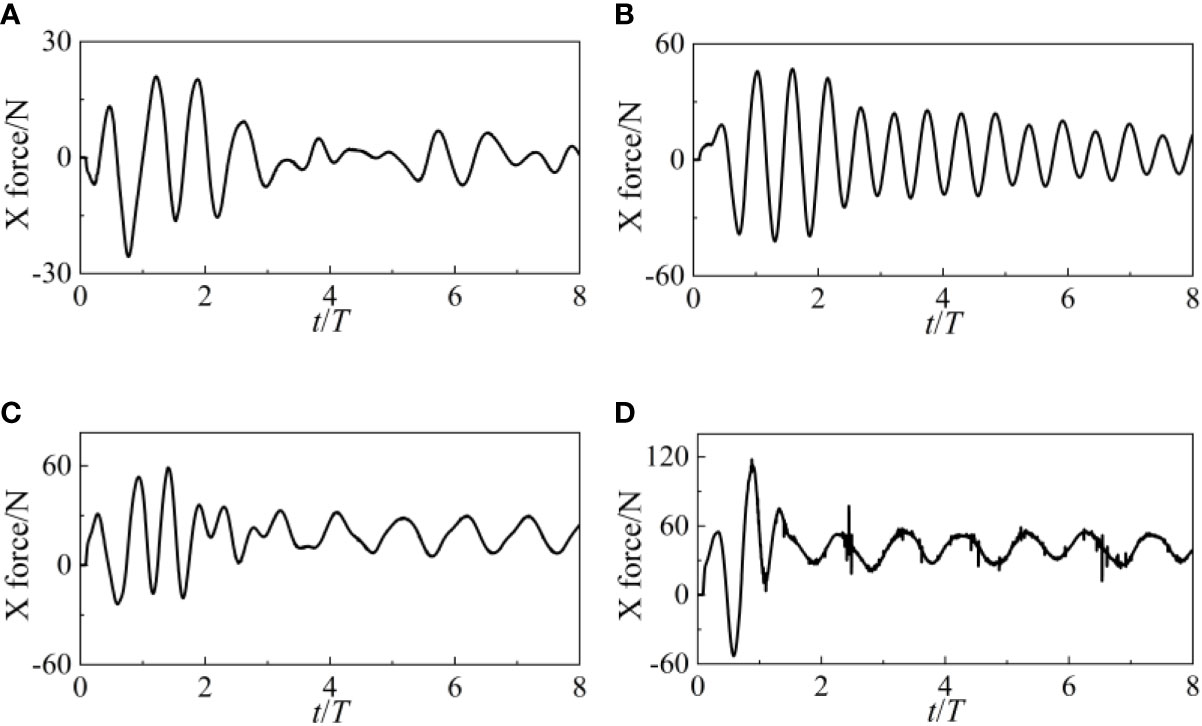
Figure 21 X force of the point-absorber WEC under different current velocities: (A-D) 0.6-1.6s.
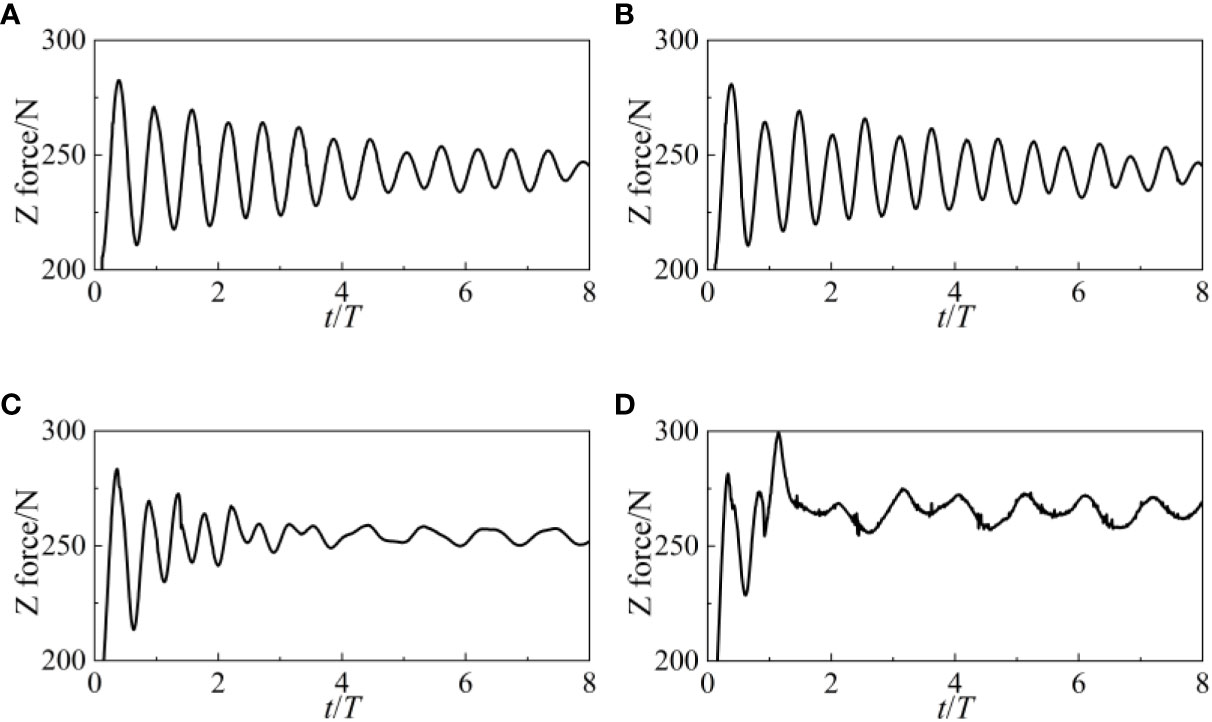
Figure 22 Z force of the point-absorber WEC under different current velocities: (A-D) 0.6-1.6s.
Figures 23, 24 and 25 depict surge, heave, and pitch motions of the point-absorber WEC under different current velocities. Under the combination of waves and current, the WEC and its mooring system will achieve a dynamic balance. Compared to the situation without current velocity, both surge, heave, and pitch undergo periodic changes around a fixed value. For surge motion, the larger the current velocity, the smaller the amplitude of the surge. This indicates that the impact of waves on the WEC is already weaker than the impact of current velocity. Notably, under such high current velocity of 1.5m/s, the WEC is completely below the water surface. Figures 26 and 27 depict the forces of the catenary 1 and 3 under different wave periods respectively. Due to the effect of incoming current, the forces on the catenaries will also increase significantly.
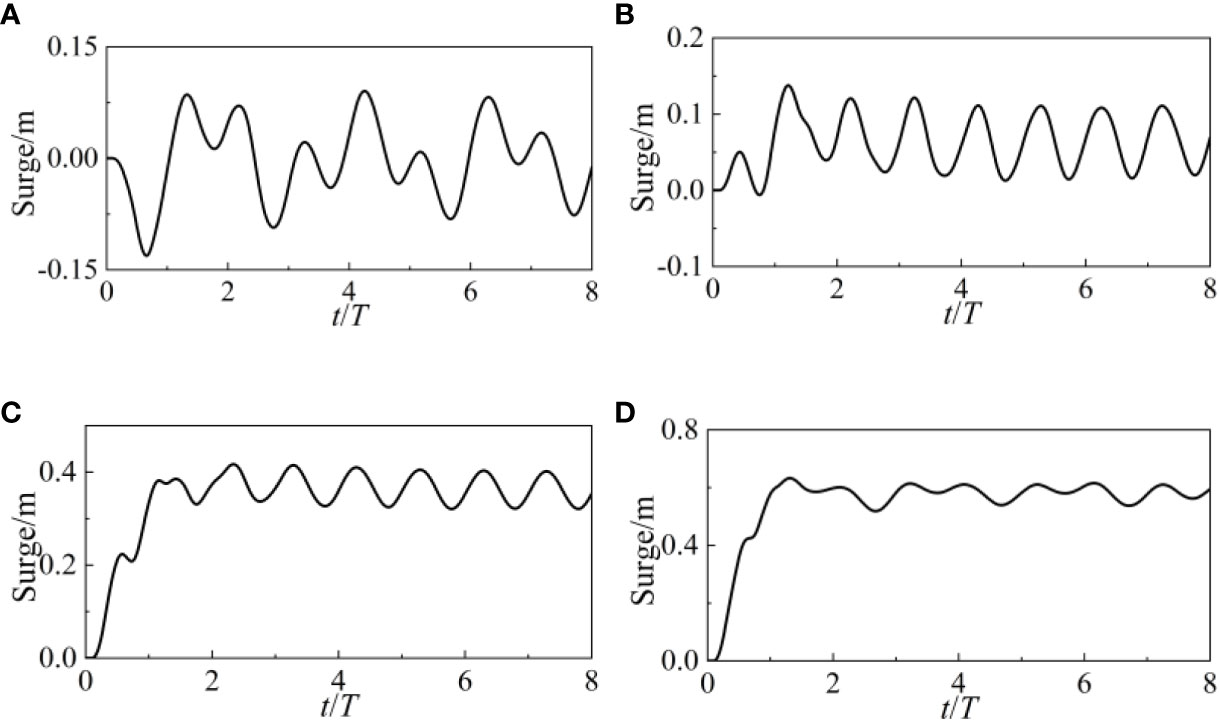
Figure 23 Surge motion of the point-absorber WEC under different current velocities: (A-D) 0-1.5m/s.
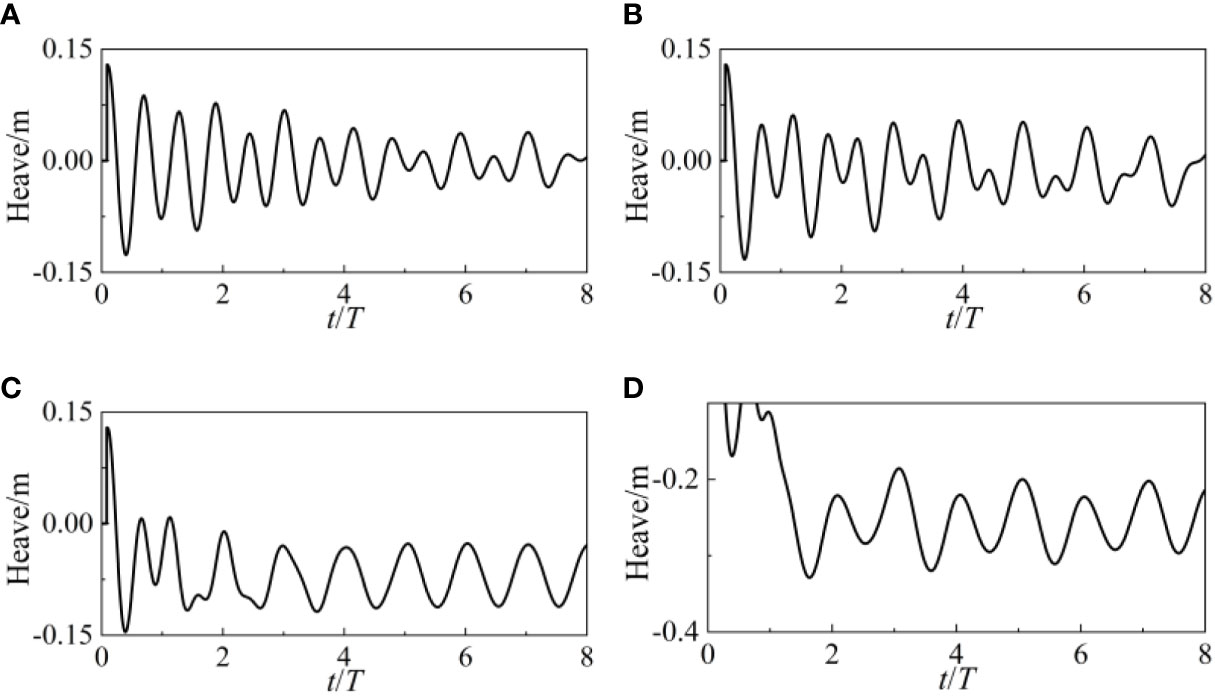
Figure 24 Heave motion of the point-absorber WEC under different current velocities: (A-D) 0-1.5m/s.
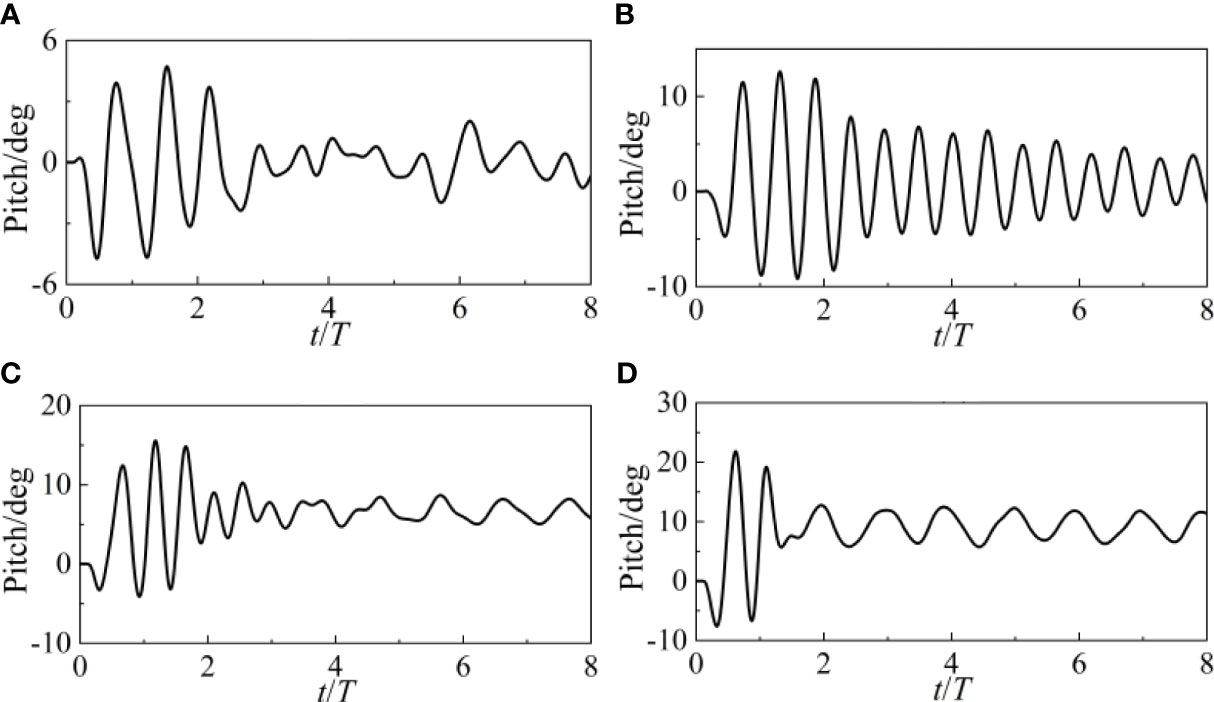
Figure 25 Pitch motion of the point-absorber WEC under different current velocities: (A-D) 0-1.5m/s.
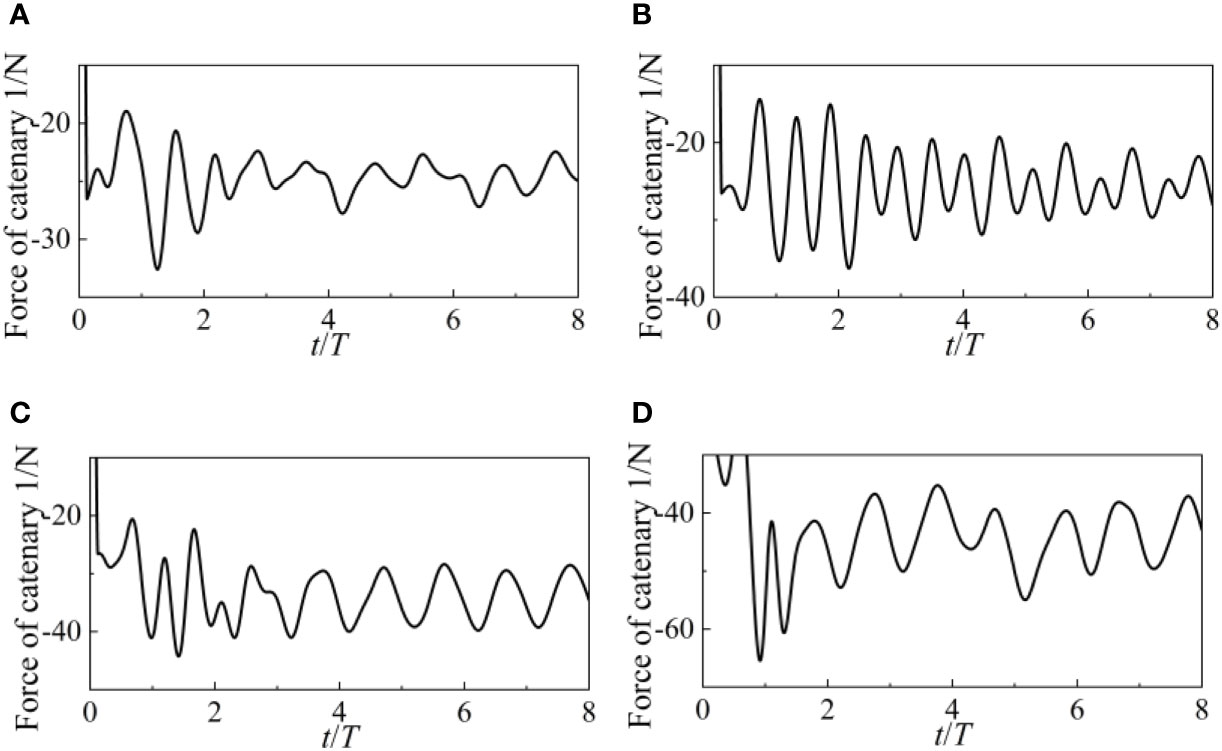
Figure 26 Force of the catenary 1 under different current velocities: (A-D) 0-1.5m/s.
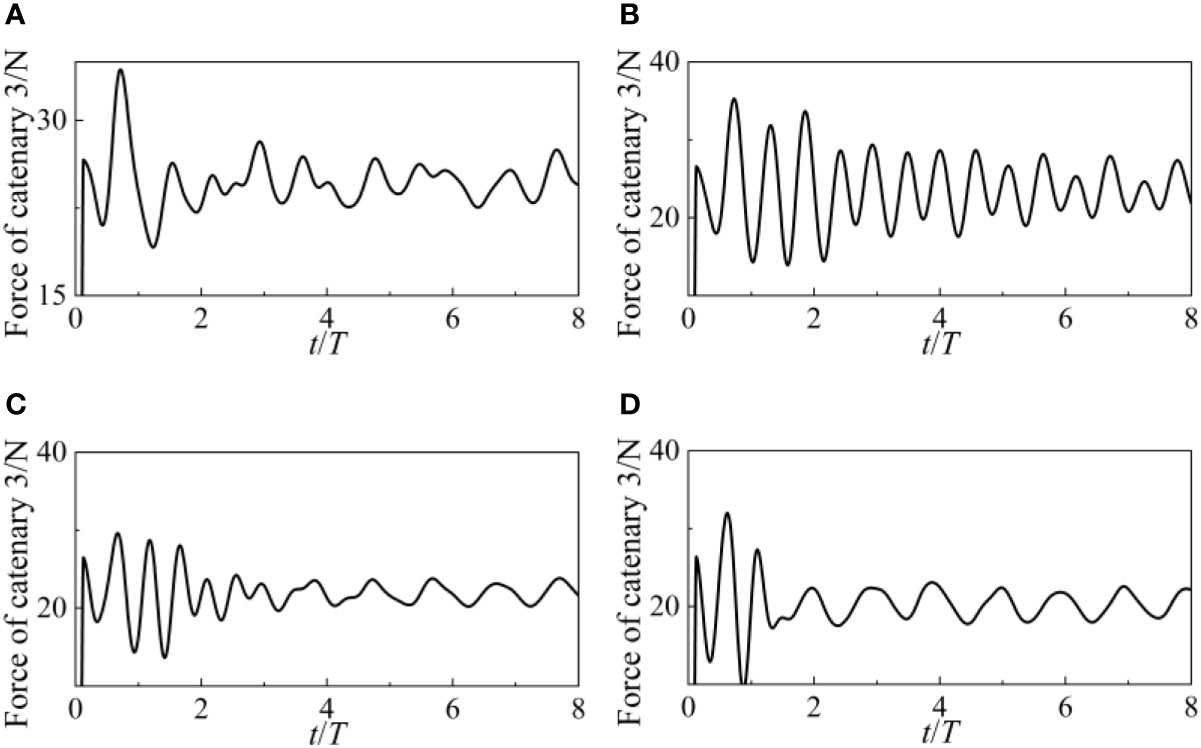
Figure 27 Force of the catenary 3 under different current velocities (A-D) 0-1.5m/s.
6 Conclusions
The study uses a CFD technique to do a dynamic analysis in the time domain for a floating-point wave-energy absorber with a catenary mooring system. The wave height primarily influences the longitudinal motion characteristics of the WEC, such as longitudinal force and surge motion, and has little to no impact on the vertical force and heave motion, according to the CFD simulations. In comparison to huge wave periods, the dynamic performance of the WEC is quite different for tiny wave periods. The frequency of waves striking the WEC is quite high while it is in short crests, which causes the WEC to experience a substantial longitudinal force. The hydrodynamic performance of the WEC is also strongly influenced by the current velocity. Strong nonlinearity is brought about by the higher current velocity for the WEC forces. The WEC and its mooring system can attain a dynamic equilibrium when subjected to waves and current together. The mooring design for floating WECs is crucial for station maintaining, efficient power collecting, and financial considerations. This is crucial for the catenary design and the linked dynamic time-domain analysis since the research demonstrates that the catenary can provide steady support for the WEC to retain its stable functioning condition in CFD simulation.
Despite its numerous benefits, there are limitations associated with the use of CFD for simulating coupled catenary mooring systems. CFD simulations often rely on assumptions and simplifications to model the complex interactions between the WEC, mooring lines, and the fluid domain, which may introduce uncertainties in the results. Additionally, the computational requirements for accurately capturing transient and non-linear behaviors of the system can be intensive, leading to challenges in terms of computational cost and time. Furthermore, the accuracy of CFD predictions is contingent upon the quality of input parameters, such as the wave and current conditions, as well as the fidelity of the numerical model. Variability in these input parameters may impact the reliability of the simulation results, highlighting the need for careful validation and sensitivity analysis.
Data availability statement
The original contributions presented in the study are included in the article/supplementary material. Further inquiries can be directed to the corresponding author.
Author contributions
DZ: Conceptualization, Methodology, Project administration, Supervision, Writing – original draft. BZ: Data curation, Formal Analysis, Investigation, Methodology, Resources, Writing – review & editing. HJ: Funding acquisition, Software, Validation, Visualization, Conceptualization, Project administration, Writing – review & editing.
Funding
The author(s) declare financial support was received for the research, authorship, and/or publication of this article. This study was financially supported by Program for Scientific Research Start-up Funds of Guangdong Ocean University (060302072101), Comparative Study and Optimization of Horizontal Lifting of Subsea Pipeline (2021E05011), the National Natural Science Foundation of China (62272109), China Scholarship Council (CSC202306320084).
Conflict of interest
The authors declare that the research was conducted in the absence of any commercial or financial relationships that could be construed as a potential conflict of interest.
Publisher’s note
All claims expressed in this article are solely those of the authors and do not necessarily represent those of their affiliated organizations, or those of the publisher, the editors and the reviewers. Any product that may be evaluated in this article, or claim that may be made by its manufacturer, is not guaranteed or endorsed by the publisher.
References
Antonio F. D. O. (2010). Wave energy utilization: A review of the technologies. Renewable Sustain. Energy Rev. 14 (3), 899–918.
Babarit A., Hals J., Muliawan M. J., Kurniawan A., Moan T., Krokstad J. (2012). Numerical benchmarking study of a selection of wave energy converters. Renewable Energy. 41, 44–63. doi: 10.1016/j.renene.2011.10.002
Bachynski E. E., Young Y. L., Yeung R. W. (2012). Analysis and optimization of a tethered wave energy converter in irregular waves. Renewable Energy. 48, 133–145. doi: 10.1016/j.renene.2012.04.044
Beatty S. J., Hall M., Buckham B. J., Wild P., Bocking B. (2015). Experimental and numerical comparisons of self-reacting point absorber wave energy converters in regular waves. Ocean. Engineering. 104, 370–386. doi: 10.1016/j.oceaneng.2015.05.027
Bhinder M. A., Karimirad M., Weller S., Debruyne Y., Guérinel M., Sheng W. (2015). “Modelling Mooring Line Non-Linearities (Material and Geometric Effects) for a Wave Energy Converter Using Aqwa, Sima and Orcaflex,” in Proceedings of the 11th European Wave and Tidal Energy Conference (Nantes, France: EWTEC).
Bosma B., Zhang Z., Brekken T. K., Özkan-Haller H. T., McNatt C., Yim S. C. (2012). “Wave Energy Converter Modeling in the Frequency Domain: A Design Guide,” in 2012 IEEE Energy Conversion Congress and Exposition (ECCE) (Raleigh, NC, USA: IEEE Conference).
Chen H., Hall M. (2022). CFD simulation of floating body motion with mooring dynamics: Coupling MoorDyn with OpenFOAM. Appl. Ocean. Res. 124, 103210. doi: 10.1016/j.apor.2022.103210
Chen W., Dolguntseva I., Savin A., Zhang Y., Li W., Svensson O., et al. (2017). Numerical modelling of a point-absorbing wave energy converter in irregular and extreme waves. Appl. Ocean. Res. 63, 90–105. doi: 10.1016/j.apor.2017.01.004
Cheng Y., Fu L., Dai S., Collu M., Cui L., Yuan Z., et al. (2022b). Experimental and numerical analysis of a hybrid WEC-breakwater system combining an oscillating water column and an oscillating buoy. Renewable Sustain. Energy Rev. 169, 112909. doi: 10.1016/j.rser.2022.112909
Cheng Y., Fu L., Dai S., Collu M., Ji C., Yuan Z., et al. (2022a). Experimental and numerical investigation of WEC-type floating breakwaters: A single-pontoon oscillating buoy and a dual-pontoon oscillating water column. Coast. Eng. 177, 104188. doi: 10.1016/j.coastaleng.2022.104188
Davidson J., Ringwood J. (2017). Mathematical modelling of mooring systems for wave energy converters-a review. Energies 10 (5), 666. doi: 10.3390/en10050666
Depalo F., Wang S., Xu S., Guedes Soares C. (2021). Design and analysis of a mooring system for a wave energy converter. J. Mar. Sci. Eng. 9 (7), 782. doi: 10.3390/jmse9070782
Depalo F., Wang S., Xu S., Soares C. G., Yang S. H., Ringsberg J. W. (2022). Effects of dynamic axial stiffness of elastic moorings for a wave energy converter. Ocean. Eng. 251, 111132. doi: 10.1016/j.oceaneng.2022.111132
Dincer I. (2000). Renewable energy and sustainable development: A crucial review. Renewable Sustain. Energy Rev. 4 (2), 157–175. doi: 10.1016/S1364-0321(99)00011-8
Fitzgerald J., Bergdahl L. (2008). Including moorings in the assessment of a generic offshore wave energy converter: A frequency domain approach. Mar. Structures. 21 (1), 23–46. doi: 10.1016/j.marstruc.2007.09.004
Giassi M., Engström J., Isberg J., Göteman M. (2020). Comparison of wave energy park layouts by experimental and numerical methods. JMSE 8 (10), 750. doi: 10.3390/jmse8100750
Göteman M., Giassi M., Engström J., Isberg J. (2020). Advances and challenges in wave energy park optimization—a review. Front. Energy Res. 8.
Gubesch E., Abdussamie N., Penesis I., Chin C. (2022). Effects of mooring configurations on the hydrodynamic performance of a floating offshore oscillating water column wave energy converter. Renewable Sustain. Energy Rev. 166, 112643. doi: 10.1016/j.rser.2022.112643
Guo B., Patton R., Jin S., Gilbert J., Parsons D. (2017). Nonlinear modeling and verification of a heaving point absorber for wave energy conversion. IEEE Trans. On Sustain. Energy. 9 (1), 453–461.
Harnois V., Weller S. D., Johanning L., Thies P. R., Le Boulluec M., Le Roux D., et al. (2015). Numerical model validation for mooring systems: method and application for wave energy converters. Renewable Energy. 75, 869–887. doi: 10.1016/j.renene.2014.10.063
Harris R. E., Johanning L., Wolfram J. (2004). Mooring systems for wave energy converters: A review of design issues and choices (Engineering, Environmental Science:Marec2004).
Huang S., Sheng S., Gerthoffert A., Cong Y., Zhang T., Wang Z. (2019). Numerical design study of multipoint mooring systems for the floating wave energy converter in deep water with a sloping bottom. Renewable Energy. 136, 558–571. doi: 10.1016/j.renene.2019.01.027
Jin S., Patton R. J., Guo B. (2019). Enhancement of wave energy absorption efficiency via geometry and power take-off damping tuning. Energy 169, 819–832. doi: 10.1016/j.energy.2018.12.074
Krivtsov V., Linfoot B. (2014). Basin testing of wave energy converters in trondheim: investigation of mooring loads and implications for wider research. JMSE 2 (2), 326–335. doi: 10.3390/jmse2020326
Li Y., Yu Y. (2012). A synthesis of numerical methods for modeling wave energy converter-point absorbers. Renewable Sustain. Energy Rev. 16 (6), 4352–4364. doi: 10.1016/j.rser.2011.11.008
Liu Z., Soares C. G. (2022). Experimental study of the behaviour of a circular gravity cage in linear waves. Aquacult. Eng. 99, 102291. doi: 10.1016/j.aquaeng.2022.102291
Liu Z., Soares C. G. (2023). Sensitivity analysis of the cage volume and mooring forces for a gravity cage subjected to current and waves. Ocean. Eng. 287, 115715. doi: 10.1016/j.oceaneng.2023.115715
Liu Z., Xu H., Soares C. G. (2023). Experimental study on the mooring forces and motions of a fish cage under regular waves. Ocean. Eng. 280, 114612. doi: 10.1016/j.oceaneng.2023.114612
Meng F., Rafiee A., Ding B., Cazzolato B., Arjomandi M. (2020). Nonlinear hydrodynamics analysis of a submerged spherical point absorber with asymmetric mass distribution. Renewable Energy. 147, 1895–1908. doi: 10.1016/j.renene.2019.09.101
Mercadé Ruiz P., Ferri F., Kofoed J. (2017). Experimental validation of a wave energy converter array hydrodynamics tool. Sustainability 9 (1), 115. doi: 10.3390/su9010115
Palm J., Eskilsson C., Paredes G. M., Bergdahl L. (2016). Coupled mooring analysis for floating wave energy converters using cfd: formulation and validation. Int. J. Mar. Energy. 16, 83–99. doi: 10.1016/j.ijome.2016.05.003
Paredes G. M., Palm J., Eskilsson C., Bergdahl L., Taveira-Pinto F. (2016). Experimental investigation of mooring configurations for wave energy converters. Int. J. Mar. Energy. 15, 56–67. doi: 10.1016/j.ijome.2016.04.009
Prakash R., Rathaur R., Gupta S., Ghosh S., Kumar D., Agarwal R., et al. (2022). A numerical study on float design for wave energy converter. Ocean. Engineering. 264, 112410. doi: 10.1016/j.oceaneng.2022.112410
Qiao D., Haider R., Yan J., Ning D., Li B. (2020). Review of wave energy converter and design of mooring system. Sustainability 12 (19), 8251. doi: 10.3390/su12198251
Ren B., He M., Dong P., Wen H. (2015). Nonlinear simulations of wave-induced motions of a freely floating body using Wcsph method. Appl. Ocean. Res. 50, 1–12. doi: 10.1016/j.apor.2014.12.003
Shahroozi Z., Göteman M., Nilsson E., Engström J. (2022). Environmental design load for the line force of a point-absorber wave energy converter. Appl. Ocean. Res. 128, 103305. doi: 10.1016/j.apor.2022.103305
Sun K., Yi Y., Zheng X., Cui L., Zhao C., Liu M., et al. (2021). Experimental investigation of semi-submersible platform combined with point-absorber array. Energy Conversion. Management. 245, 114623. doi: 10.1016/j.enconman.2021.114623
Touzon I., Nava V., de Miguel B., Petuya V. (2020). A comparison of numerical approaches for the design of mooring systems for wave energy converters. J. Mar. Sci. Engineering. 8 (7), 523. doi: 10.3390/jmse8070523
Ulvgård L., Sjökvist L., Göteman M., Leijon M. (2016). Line force and damping at full and partial stator overlap in a linear generator for wave power. J. Mar. Sci. Engineering. 4 (4), 81.
Vicente P. C., António F. D. O., Gato L. M., Justino P. A. (2009). Dynamics of arrays of floating point-absorber wave energy converters with inter-body and bottom slack-mooring connections. Appl. Ocean. Res. 31 (4), 267–281. doi: 10.1016/j.apor.2009.09.002
Vicente P. C., Falcão A. D. O., Justino P. A. (2010). “A time domain analysis of arrays of floating point-absorber wave energy converters including the effect of nonlinear mooring forces,” in ICOE’2010-3rd International Conference on Ocean Energy (Spain (Bilbao): EOC - Comunicações em encontros científicos internacionais).
Vicente P. C., Falcão A. F., Justino P. A. (2013). Nonlinear dynamics of a tightly moored point-absorber wave energy converter. Ocean. Engineering. 59, 20–36. doi: 10.1016/j.oceaneng.2012.12.008
Wilcox D. C. (2008). Formulation of the kw turbulence model revisited. Aiaa. J. 46 (11), 2823–2838. doi: 10.2514/1.36541
Wu M., Stratigaki V., Troch P., Altomare C., Verbrugghe T., Crespo A., et al. (2019). Experimental study of a moored floating oscillating water column wave-energy converter and of a moored cubic box. Energies 12 (10), 1834. doi: 10.3390/en12101834
Xu S., Soares C. G. (2023). Parametric study on the short-term extreme mooring tension of nylon rope for a point absorber. Ocean. Eng. 267, 113248. doi: 10.1016/j.oceaneng.2022.113248
Xu S., Ji C. Y., Soares C. G. (2022). A semiparametric Bayesian method with birth-death Markov Chain Monte Carlo algorithm for extreme mooring tension analysis. Ocean. Eng. 260, 111765. doi: 10.1016/j.oceaneng.2022.111765
Xu S., Wang S., Hallak T. S., Rezanejad K., Hinostroza M. A., Soares C. G., et al. (2018). Experimental study of two mooring systems for wave energy converters, progress in maritime technology and engineering (Taylor & Francis Group, London: CRC Press), 667–676.
Xu S., Wang S., Soares C. G. (2019). Review of mooring design for floating wave energy converters. Renewable Sustain. Energy Rev. 111, 595–621. doi: 10.1016/j.rser.2019.05.027
Xu S., Wang S., Soares C. G. (2020). Experimental investigation on hybrid mooring systems for wave energy converters. Renewable Energy. 158, 130–153. doi: 10.1016/j.renene.2020.05.070
Yang S., Ringsberg J. W., Johnson E. (2020). Wave energy converters in array configurations—Influence of interaction effects on the power performance and fatigue of mooring lines. Ocean. Engineering. 211, 107294. doi: 10.1016/j.oceaneng.2020.107294
Keywords: point absorber WEC, catenary mooring, CFD simulation, dynamic coupling analysis, Navier-Stokes equation
Citation: Zhang D, Zhao B and Jiang H (2024) Wave energy converter with floating-point absorber and catenary mooring: dynamic coupling analysis. Front. Mar. Sci. 11:1338330. doi: 10.3389/fmars.2024.1338330
Received: 14 November 2023; Accepted: 04 January 2024;
Published: 29 January 2024.
Edited by:
He Li, University of Lisbon, PortugalReviewed by:
Zhongchi Liu, University of Lisbon, PortugalMengzhen Li, Wuhan University of Technology, China
Copyright © 2024 Zhang, Zhao and Jiang. This is an open-access article distributed under the terms of the Creative Commons Attribution License (CC BY). The use, distribution or reproduction in other forums is permitted, provided the original author(s) and the copyright owner(s) are credited and that the original publication in this journal is cited, in accordance with accepted academic practice. No use, distribution or reproduction is permitted which does not comply with these terms.
*Correspondence: Bowen Zhao, emhid21haWxAMTYzLmNvbQ==