
95% of researchers rate our articles as excellent or good
Learn more about the work of our research integrity team to safeguard the quality of each article we publish.
Find out more
ORIGINAL RESEARCH article
Front. Mar. Sci. , 29 February 2024
Sec. Marine Pollution
Volume 11 - 2024 | https://doi.org/10.3389/fmars.2024.1334286
This article is part of the Research Topic Shipping Pressures and Impacts on the Marine Environment View all 8 articles
 Okko Outinen1*
 Sarah A. Bailey2
 Oscar Casas-Monroy2
 Stephanie Delacroix3Sonia Gorgula4Evelina Griniene5
 Jenni E. Kakkonen6
 Greta Srebaliene5
Ships’ ballast water and sediments are vectors that contribute to the unintentional spread of aquatic non-native species globally. Ballast water management, as well as commissioning testing of ballast water management systems and compliance monitoring under the regulations of the International Maritime Organization (IMO) aim at minimizing the unwanted spread of organisms. This study compiles data for treated ballast water samples collected and analyzed from 228 ships during 2017–2023. The samples were collected from the ballast discharge line or directly from the ballast tank for enumeration of living organism concentrations in the categories of ≥50µm and <50 to ≥10µm -sized organisms, as well as indicator microbes in comparison to the ballast water performance standard of the IMO (Regulation D-2). In addition, several ship-specific factors were examined to infer potential factors affecting compliance rates. Nearly all ships were compliant with the ballast water performance standard for indicator microbes and <50 to ≥10µm -sized organisms, whereas almost half of all samples exceeded the limit of ten viable organisms m-3 for the ≥50µm -sized organisms. Compliance testing results did not differ significantly between sampling years, indicating that compliance rate did not change through time. The rate of compliance was higher for commissioning testing than compliance testing. Clear ship- or system-specific factors that lead to compliance or non-compliance were not detected, even though type of ballast water management system, filter mesh size associated with the system and source of ballast water affected compliance significantly either for the samples taken from the discharge line, or ballast tank. As compliance did not improve significantly over time, compliance testing of ships’ ballast water should be undertaken to ensure that the systems remain operational after commissioning and ships meet requirements of the D-2 standard. Furthermore, the study outcomes promote further research on the efficiency of filter mesh sizes and different filtration units associated with ballast water management systems, to improve mechanical removal of larger organisms. Finally, as several ships exceeded the compliance limit by hundreds or thousands of living organisms, technological advancements and operational measures may be needed to improve the overall reliability of ballast water management.
Shipping is a well-known pathway for introduction of harmful aquatic organisms and pathogens, including non-native species (Bailey et al., 2020). More specifically, ships’ ballast water and associated sediments have been identified as the main mode of spread particularly for planktonic life stages of marine organisms, including bacteria, protists, phytoplankton, and zooplankton, as well as fishes, benthic animals, and nearly all pelagic taxa (Lavoie et al., 1999). As marine non-native species have the potential to severely impact ecology, economy, and human health in the recipient regions (Ruiz et al., 1997), several regional and international policies and regulations have been implemented to manage different pathways of introduction (Ojaveer et al., 2014).
In regards to ships’ ballast water, the International Maritime Organizations’ (IMO) International Convention for the Control and Management of Ships’ Ballast Water and Sediments, 2004 (Ballast Water Management Convention, hereafter BWMC) was adopted in 2004, and entered into force in 2017 (IMO, 2004, 2017). The BWMC aims to reduce ballast-related species introductions associated with international voyages, initially, through requirements to exchange ballast water. By September 2024 at the latest, all internationally trading ships will need to adhere to the ballast water performance standard (Regulation D-2, hereafter referred as the D-2 standard), where discharged ballast water is required to contain less than: one colony forming unit of Vibrio cholerae, 250 colony forming units of Escherichia coli and less than 100 colony forming units of intestinal enterococci 100 ml-1 (hereafter called indicator microbes), as well as less than ten viable organisms of size <50µm to ≥10µm ml-1, and ten viable organisms of size ≥50µm m-3 (hereafter referred to as the two size classes of organisms) (IMO, 2004; IMO, 2018a; IMO, 2020a).
Most ship operators will aim to comply with the D-2 standard through onboard installation of a ballast water management system (BWMS) that typically apply a combination of physical, chemical or biological methods to reduce organism viability in ballast waters (Gollasch and David, 2021). Each BWMS technology is certified through a set of standardized land-based and ship-board tests to demonstrate ability to meet the D-2 standard requirements under a specified range of abiotic water conditions with no harm to the ship, its’ crew, the environment, and public health (IMO, 2008; IMO, 2018b). After the BWMS technology has received this type approval, it can be commercialized, and individual units installed on ships. Effective June 1st, 2022, it became mandatory to test each BWMS unit following installation to ensure correct operation – known as commissioning testing – where a representative ballast water sample of at least one cubic meter in volume is collected during discharge of treated ballast water and assessed for compliance with respect to the two size classes of organisms (IMO, 2020b; Drillet et al., 2023). BWMS installed prior to June 2022 were not required to complete commissioning testing.
Despite type-approval and commissioning testing requirements, it cannot be assured that each BWMS will function and perform effectively throughout its lifetime, under all environmental conditions encountered by ships in operational service (Gerhard et al., 2019). Port State control authorities may monitor a ship’s compliance to the BWMC by directly collecting and analyzing a representative sample of ballast water (IMO, 2014; IMO, 2020a). To date, there has been limited compliance testing of ballast water due to limited resources and the challenge of collecting a representative sample when ships are discharging large volumes of ballast water (e.g., tens of thousands of cubic metres) (Carney et al., 2013; Bradie and Bailey, 2021; IMO, 2022a) A limitation with several previous ballast water compliance and treatment system efficacy studies, such as Paolucci et al. (2015); Wright et al. (2015) and Feng et al. (2023) is the limited number of ships and treatment systems tested per study. Consequently, the current study compiled data from multiple studies of treated ballast water samples with a view to assemble a large sample size covering a broad geographic region, sufficient to conduct statistical and trend analysis on D-2 standard compliance. In particular, the objectives of the study were to i) determine how often ships utilizing BWMS complied with the D-2 standard; ii) assess whether ballast water compliance of ships has improved over time; and iii) evaluate how various ship-specific factors, such as type and age of BWMS, mesh size of the filters associated with the BWMS, and source and holding time of ballast water affected D-2 standard compliance rates.
In total, data were assembled for 228 ballast water samples with the most recent ballast water uptake or exchange locations (the ‘study area’) representing mainly the North Sea (44%), Celtic-Biscay Shelf (7%), the Great Lakes-St. Lawrence River (6%), Norwegian Sea (5%) and Baltic Sea (4%), though a small number of samples originated from various regional sea areas in Asia (9%), Australia (7%), as well as Central and North America (4%) or had unknown origin (Figures 1, 2). As this dataset was collated from several research groups, there were differences in the sampling and analysis methods, including which organism groups were assessed. Altogether, data were available for 225 samples for <50 to ≥10µm -sized organisms, 222 samples for ≥50μm -sized organisms and 44 samples for indicator microbes.
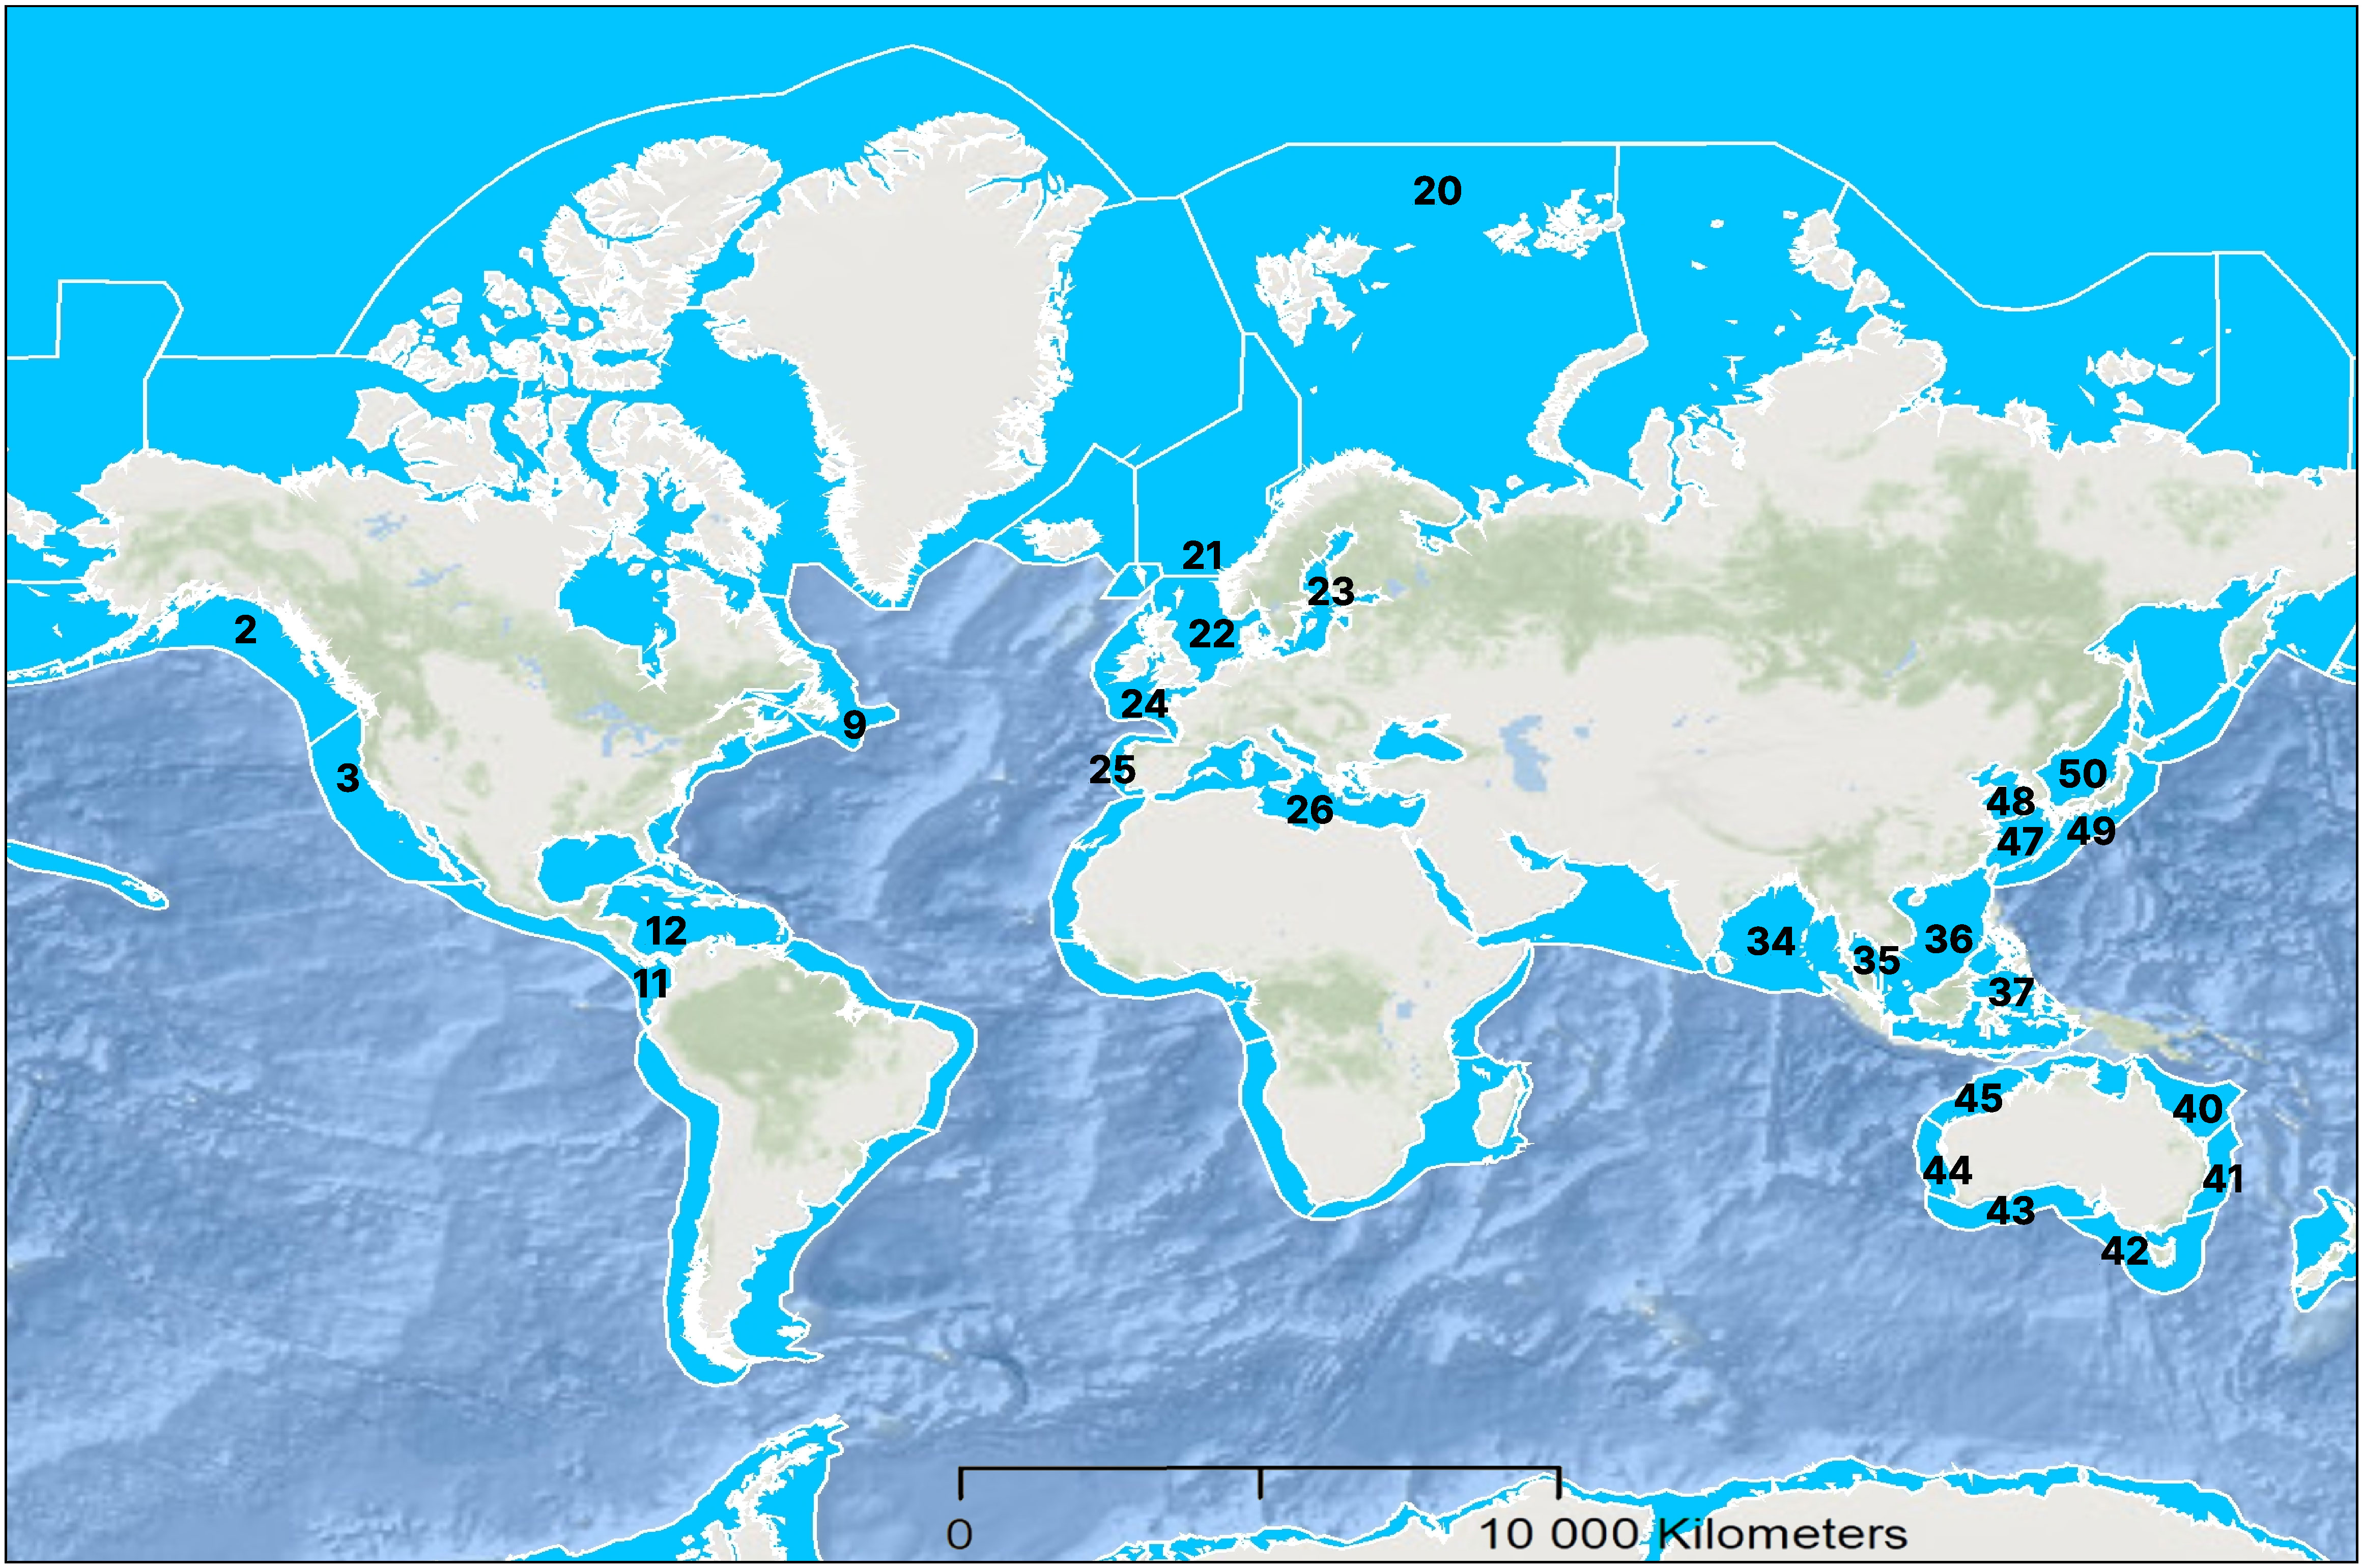
Figure 1 Large marine ecosystems numbered according to UNDP (2023), where the ballast water samples originated from in the present study. The number of in-tank and in-line ballast water samples originating from each large marine ecosystem is represented in Figure 2.
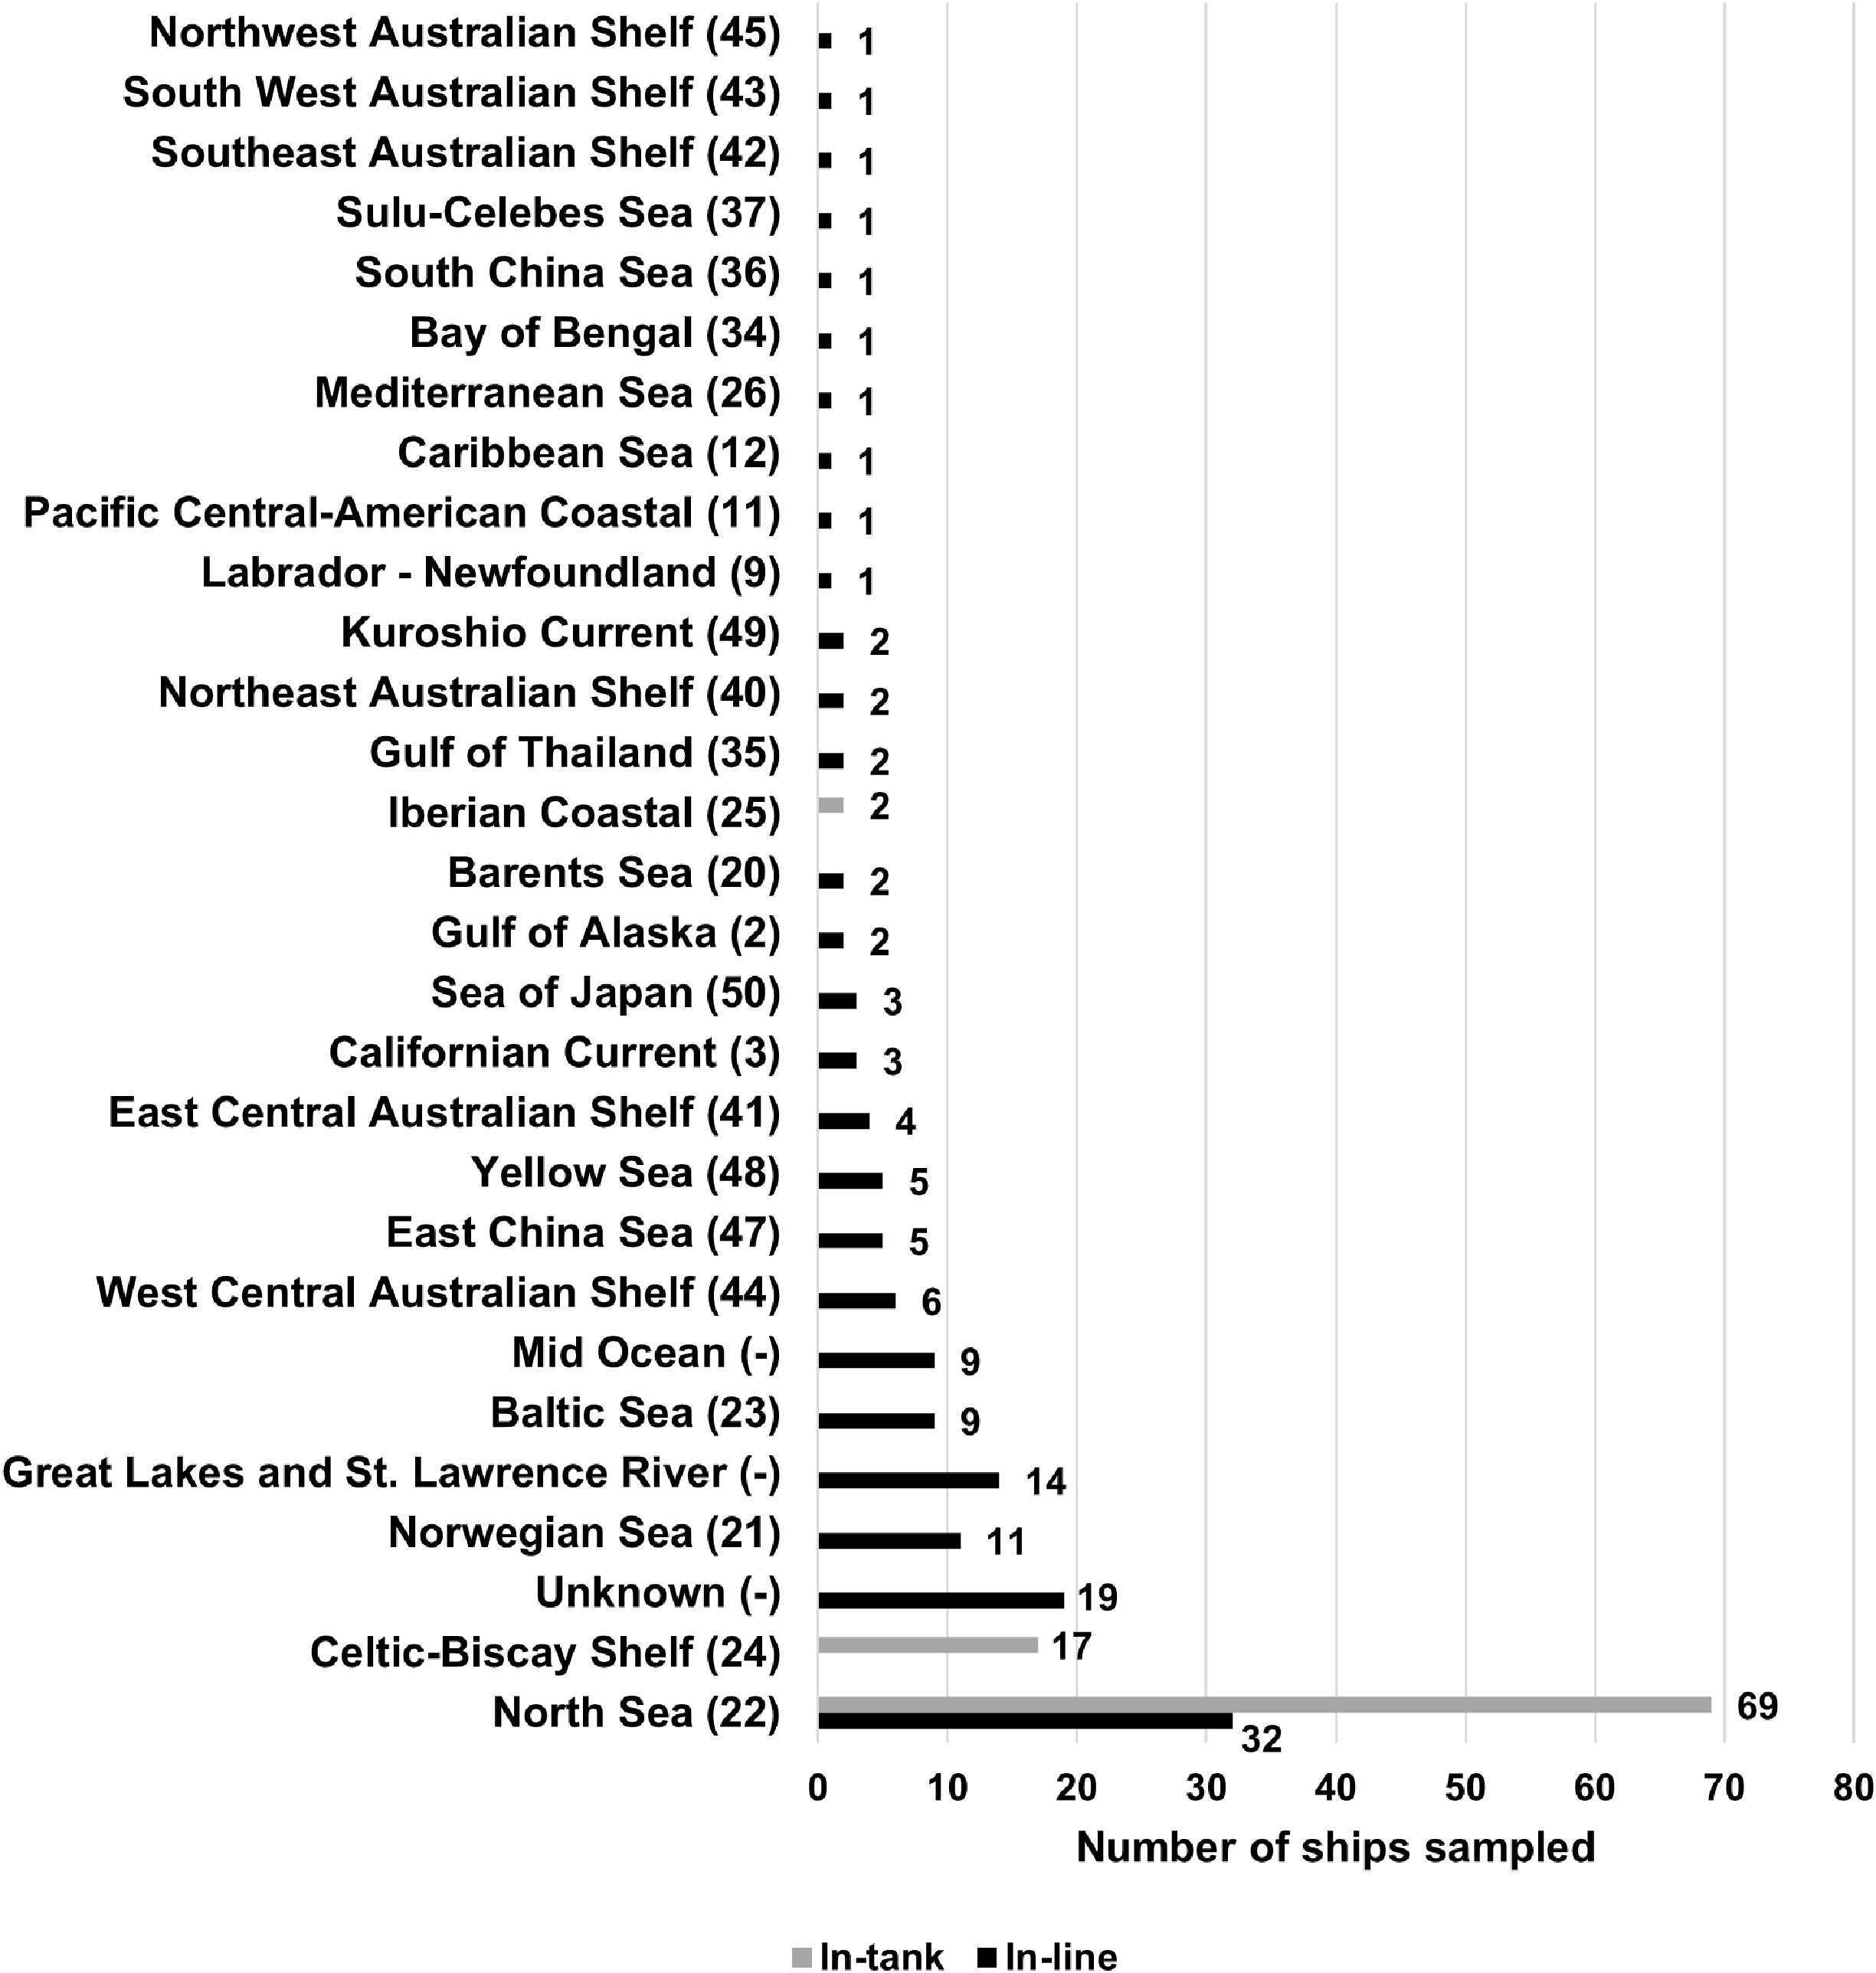
Figure 2 Number of sampled ships in the present study, divided according to ballast water sources using large marine ecosystems (UNDP, 2023). Freshwater bodies and mid oceanic locations do not have large marine ecosystem designations, and 19 samples were of unknown origin.
Ships’ ballast water was sampled between 2017 and 2023 for two main purposes: assessing D-2 standard compliance on operational vessels in service and commissioning testing of BWMS following installation (Table 1). Ballast water samples were collected following two approaches referenced in IMO sampling guidance: discharge (in-line) and tank (in-tank) sampling (IMO, 2020a). The in-line sampling was conducted on ships as part of voluntary research on BWMS compliance rates, whereas the in-tank compliance sampling and commissioning testing were mandatory activities. All samples were collected after ballast water treatment (no uptake/untreated samples).
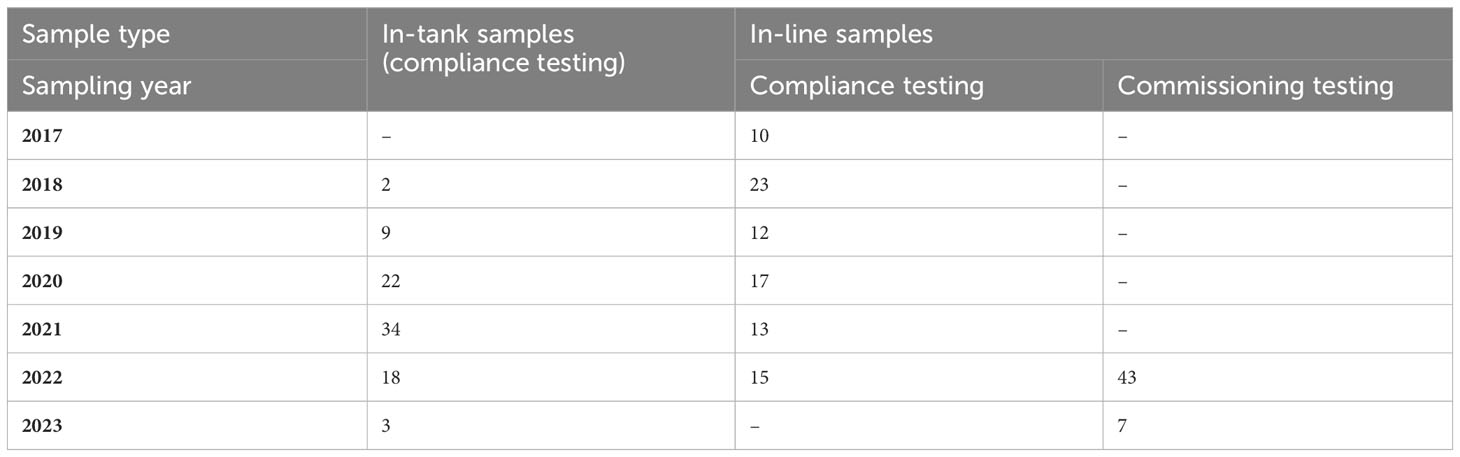
Table 1 Number of samples collected for compliance and commissioning testing purposes throughout the study using the in-tank and in-line sampling approaches.
Ship-specific information recorded during sampling events included the age and type of BWMS, source and holding time of ballast water, and the BWMS filter mesh size. Age of BWMS (in years) was recorded only for the in-line sampled ships, and it varied from 0 to 8 years. The age of the system was rounded to the closest year based on the date of installation for compliance tests, while BWMS age was set at zero for all commissioning tests. The type of BWMS was categorized as those that utilize active substances (e.g., chlorine) in the treatment process, or those that do not. Ballast water source was categorized into coastal, freshwater, or open ocean based on the location of the most recent uptake or exchange of ballast water recorded in the ballast water record books of the ships, or ballast water reporting forms (required by some port States, such as Canada). Holding time of the ballast water (in hours) ranged between 0 hours and 82 days, calculated as the duration between time of the most recent ballast water uptake or exchange and the time of collection when the ship was sampled and analyzed. If the system utilized a filtration unit, filter mesh size utilized by the filtration unit was recorded (in µm). Overall, the ship-specific factors varied between the in-tank and in-line sampled ships (Raw data presented in Supplementary Materials) (Table 2).
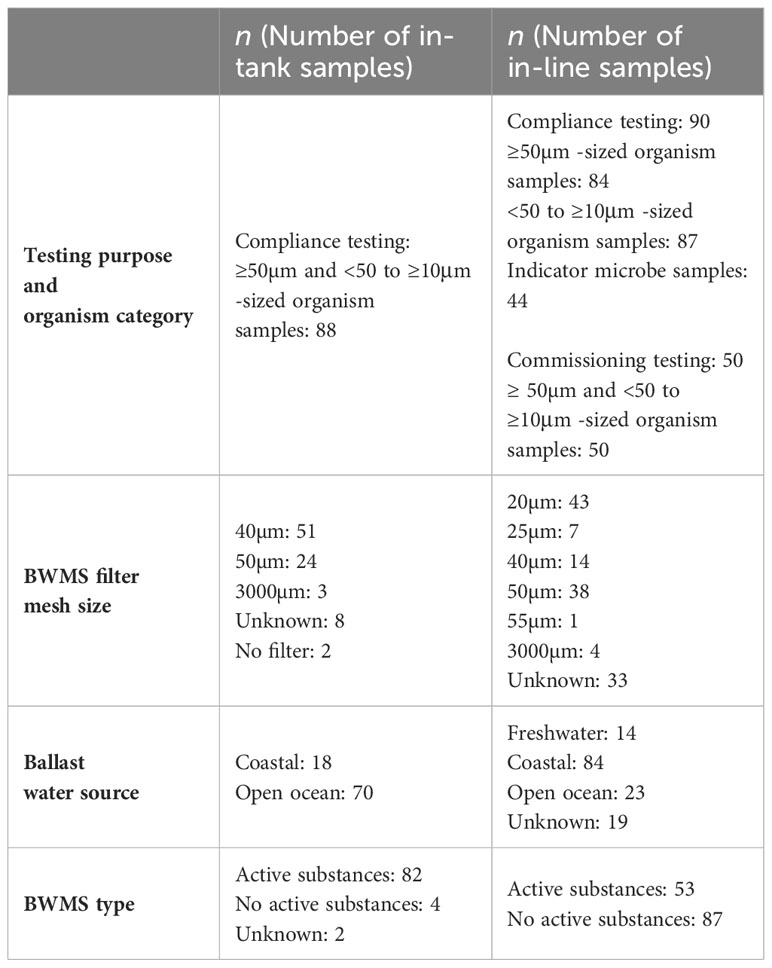
Table 2 Numerical representation of the ship-specific factors for the in-tank and in-line sampled ships.
In-line ballast water samples were collected following international standards, sampling guidance and protocols (First et al., 2012; Drake et al., 2014; ICES/IOC/IMO WGBOSV, 2017; ISO, 2022). Samples were taken using the ship-supplied sampling ports located either in the engine room, on deck, or in the pump room near the ballast discharge point (ISO, 2019; IMO, 2020a). In-line continuous ballast samples were collected at controlled flow rates within, or below, the recommended isokinetic range to minimize harm to organisms using a sample collection device typically consisting of different components (e.g., a flow meter, valves, filter mesh/plankton net, pipes or hoses) to concentrate larger organisms and direct water into sample containers.
Ballast water samples for ≥50μm -sized organisms were concentrated on 35μm mesh (~50μm in diagonal dimension), while samples for <50μm to ≥10μm-sized organisms and indicator microbes were collected either from the filtrate, or as an unfiltered whole water sample. Sample volumes ranged from 465 to 6240 liters (median: 1585 liters) and from one to 20 liters (median: 10 liters) for the ≥50μm and <50 to ≥10μm -sized organisms, respectively. Additional sample water was collected from the <50μm filtrate or directly by a seep sampler located upstream of the plankton net for analysis of indicator microbes and certain water quality parameters, such as total residual oxidants and salinity. After collection, samples were stored in dark insulated coolers at or below ambient ballast water temperatures to reduce organism mortality during transportation to a local laboratory for analysis. All sampling equipment and laboratory supplies were cleaned, rinsed and fully dried between each sampling event to prevent cross-contamination.
Ballast water samples were analyzed by microscopy within six hours of collection to enumerate living organisms. For ≥50μm -sized organisms, one ml subsamples of concentrated well-mixed ballast discharge sample were counted using a modified Bogorov counting chamber (Hydro-Bios Apparatebau GmbH, Germany). A 10µL aliquot of 50μm beads was added to the counting chamber as a size reference, and live organisms (based on movement and response to stimuli techniques, NSF International, 2010) were counted under a stereoscope using 10x to 80x magnification (e.g., Nikon SMz800N Zoom stereoscope). Multiple subsamples were processed within the time available (up to six hours following sample collection) and the number of live organisms m-3 calculated based on the concentration factor and fraction of sample counted.
The analysis of <50 to ≥10μm -sized organisms was conducted using vital markers such as fluorescein diacetate (FDA) or FDA combined with 5-Chloromethyl Fluorescein Diacetate (CMFDA) to enumerate living cells using epifluorescent microscopes equipped with appropriate filters (e.g., a Zeiss Axio Vert.A1 microscope, Carl Zeiss Canada, Ltd, ON, Canada). Ballast water discharge samples (the filtrate or whole water sample) were either unconcentrated or concentrated on a 10μm mesh size, and well mixed prior to analysis. Subsamples of three to five ml volume were stained with FDA or FDA+CMFDA (detailed methodological steps available in Adams et al., 2014; Casas-Monroy and Bailey, 2021) and incubated in the dark for ten minutes. After incubation, one ml of the subsample was transferred to a gridded Sedgewick-Rafter counting chamber (Wildlife Supply Company, Yulee, Florida, USA) along with one μL of 10μm and 50μm bead solution for size reference. All fluorescing organisms in the size range <50 to ≥10μm were counted, with the entire sample chamber, or half of the sample chamber, assessed within 20 minutes before the vital markers leak into the background sample fluid (Adams et al., 2014). In total, 3–6 one ml subsamples were counted. Concentrated ballast water sample counts were converted to live organism concentrations based on the concentration factor and the fraction of the sample counted.
Indicator microbe analyses included separate testing approaches for E. coli, intestinal enterococci and V. cholerae. Colilert and Enterolert Test Kits (IDEXX Australia) that utilize defined substrate technology were used to detect the most probable number of E. coli or enterococci (Gollasch and David, 2010). Both test kits involve dissolving relevant defined substrate technology media to 100 ml of sample water within sterile beakers, followed by an incubation period of 18 to 22, or 24 hours in sealed trays. The samples are examined post-incubation under an ultraviolet lamp to detect the number of fluorescing wells and estimate the number of E. coli and enterococci using the most probable number method (Gollasch and David, 2010). Samples for V. cholerae were assessed using ScanVIT test kits based on specific gene probe technology. This approach includes 100 ml sample filtration, and an eight-hour incubation on a plate with relevant media for the filter and assessment in a ScanVIT reactor. Further, this V. cholerae analysis requires an additional hybridization component and two, shorter incubation periods for the hybridization component and reactor. Sample handling is finalized with vacuum technology and placing the sample under an epifluorescent microscope, where fluorescing colonies are counted as viable V. cholerae colonies using 100x magnification.
In-tank ballast water samples were collected through opened manholes, such that the water was pumped from the mid-depth of the water column within the ballast tanks using a hand operated pump. The water was filtered and concentrated using plankton nets to obtain the samples for the <50 to ≥10μm and ≥50μm -sized organisms separately. For <50 to ≥10μm -sized organism analyses, each replicate sample was obtained by filtering ten liters of ballast water using a net with 10μm mesh and concentrating it to a half a liter volume for sample analysis. The <50 to ≥10µm samples were stained with neutral red and preserved using Lugol’s iodine. For analyses of ≥50μm -sized organisms, each replicate sample was obtained by filtering one hundred liters of ballast water using a net with 50μm mesh (in diagonal dimension) and concentrating it to one liter. The ≥50µm samples were stained with neutral red and preserved in 4% formalin (Elliott and Tang, 2009).
Stained and preserved samples were sent for processing and analysis by a taxonomic laboratory, APEM Ltd. The approach included handling and enumeration of zooplankton and phytoplankton organisms separately. The stained and preserved samples were sieved and washed to remove preservatives and standardize the size of zooplankton individuals recorded. The ≥50μm -sized zooplankton organisms were sorted with a stereomicroscope and a 39 ml Bogorov chamber. The <50 to ≥10μm -sized zooplankton organisms were sorted under a high-powered inverted microscope utilizing a Sedgewick Rafter chamber. A subsample of one ml was pipetted into the chamber and analyzed using the grid-pattern of the chamber in a systematic order. Collected biota were examined under microscopes (stereomicroscope for larger, inverted microscope for the <50 to ≥10μm -sized organisms) and, where necessary, the specimen or sub-sections of each specimen were mounted on slides for closer examination under a high-powered compound microscope. The methodological steps utilized by Elliott and Tang (2009) and Zetsche and Meysman (2012) were used to quantify zooplankton organisms that were considered live at the time of collection from the samples stained with Neutral Red.
Phytoplankton organisms of size <50 to ≥10μm and ≥50μm were combined at sample collection and differentiation to the two size classes of organisms was completed at a laboratory. The stained phytoplankton samples were assessed using the Utermöhl method for quantitative phytoplankton analysis (IOC UNESCO, 2010), and categorized into different size classes in situ within the sample chamber using a microscope graticule to reduce damage to the cells caused by sieving. After the acclimatization and homogenization stages, the red-fluorescing organisms (considered live at time of collection) and unstained organisms (considered dead at time of collection) were enumerated using settling chambers and high-quality inverted microscopes. The final organism counts for each sample were obtained by converting ‘live’ zooplankton and phytoplankton counts for both size classes of organisms based on the concentration factor and the fraction of the sample counted.
Descriptive statistics on all organism categories of the D-2 standard were compiled for the number of living organisms detected from the samples, as well as the proportion of non-compliant and compliant ships detected during compliance and commissioning testing. Statistical analyses were conducted only for the ≥50µm -sized organism compliance due to the large number of compliant outcomes for the smaller size class and indicator microbes (see Results); given the primary aim of these analyses was to detect underlying causes of non-compliant results. Temporal trends in compliance were analyzed with the chi-squared test to detect whether compliance (categorical variable for ≥50µm -sized organisms, compliant or non-compliant) depended on the sampling year (2017-2022 for in-line, 2018-2023 for in-tank compliance tests). This test was performed separately for in-line and in-tank compliance testing samples. Commissioning testing samples were excluded from the temporal trend analysis, since all of them were conducted in 2022 or early 2023.
The mean abundance of living ≥50µm -sized organisms, and compliance (binary categorical variable) were both initially utilized as potential response variables, and data were examined to identify missing values, outliers, and inconsistencies. The Akaike Information Criterion (AIC) was used to select the best-fitting model, with lower AIC values indicating a better-fitting model (Faraway, 2016). The logistic regression model with a categorical compliance outcome as the response variable was selected, as it had the lowest AIC score compared to models with organism abundance as the response variable. Eventually, logistic regression models were performed for in-tank and in-line samples, to examine the effects of various independent variables on the binary response variable (compliance). In logistic regression, the models estimate the odds of an event occurring, or not occurring with given conditions or variables, and the odds refer to the ratio of the probability of success to the probability of failure (Kleinbaum and Klein, 2010). Two separate models were applied for the data, one for the in-tank (Model 1) and another for the in-line samples (Model 2) to improve understanding and account for potential biases due to differences in sampling method. In-tank and in-line samples were not analyzed together since the sampling techniques, sample volumes and analysis methods were considerably different. Models 1 and 2 eventually utilized 78 and 94 datapoints, respectively, as missing values resulted in exclusion of some data points from final analyses.
The explanatory variables included in the models were BWMS filter mesh size, ballast water source, type of BWMS, BWMS age in years (only for the in-line samples), and ballast water holding time in hours. Testing purpose was added as an additional factor for model 2, since the in-line sampling method was utilized for both commissioning and compliance testing, whereas in-tank sampling was used only in association with compliance testing. In addition, the impact of ballast water source and filter mesh size on compliance was tested between the categories with most datapoints (open ocean and coastal sources for both models, and filter mesh sizes 40µm versus 50µm in model 1 and 20µm versus 40µm and 50µm in model 2). Contrast comparisons were derived as integral components of the model outcomes. All statistical analyses were performed using R software programming (4.2.2 version, R Core Team, 2022).
All but one of the 44 samples analyzed for indicator microbes were compliant with the limits of the D-2 standard, with the median number of colony forming units detected being 0, 1 and 0 for E. coli, intestinal enterococci and V. cholerae, respectively. The one sample in exceedance of the D-2 standard contained 223 colony forming units of intestinal enterococci. For the <50 to ≥10µm -sized organisms, 223 of 225 samples analyzed were compliant with the D-2 standard with the two non-compliant samples containing 55 and 69 living organisms ml-1. Considerably larger variation was observed for the living ≥50µm -sized organisms, with 49% of the 222 samples failing to meet the D-2 standard. The standard was exceeded by 10% of the commissioning tests (5 out of 50 samples), whereas for compliance testing, 44% of the in-line samples (37 out of 84 samples) and 76% (67 out of 88 samples) of the in-tank samples failed to meet the standard. Non-compliant samples under commissioning testing had a median abundance of 52 living organisms m-3, whereas the non-compliant in-line and in-tank compliance testing samples had median abundances of 150.5 and 4181.3 living organisms m-3, respectively.
Compliance to the D-2 standard (for the ≥50µm organism size class) did not significantly depend on the year of sampling (df = 5, p > 0.05, for both, in-tank and in-line samples) for the in-line, nor the in-tank sampled ships, hence compliance did not significantly improve, nor decline from 2017 to 2023 (Figure 3).
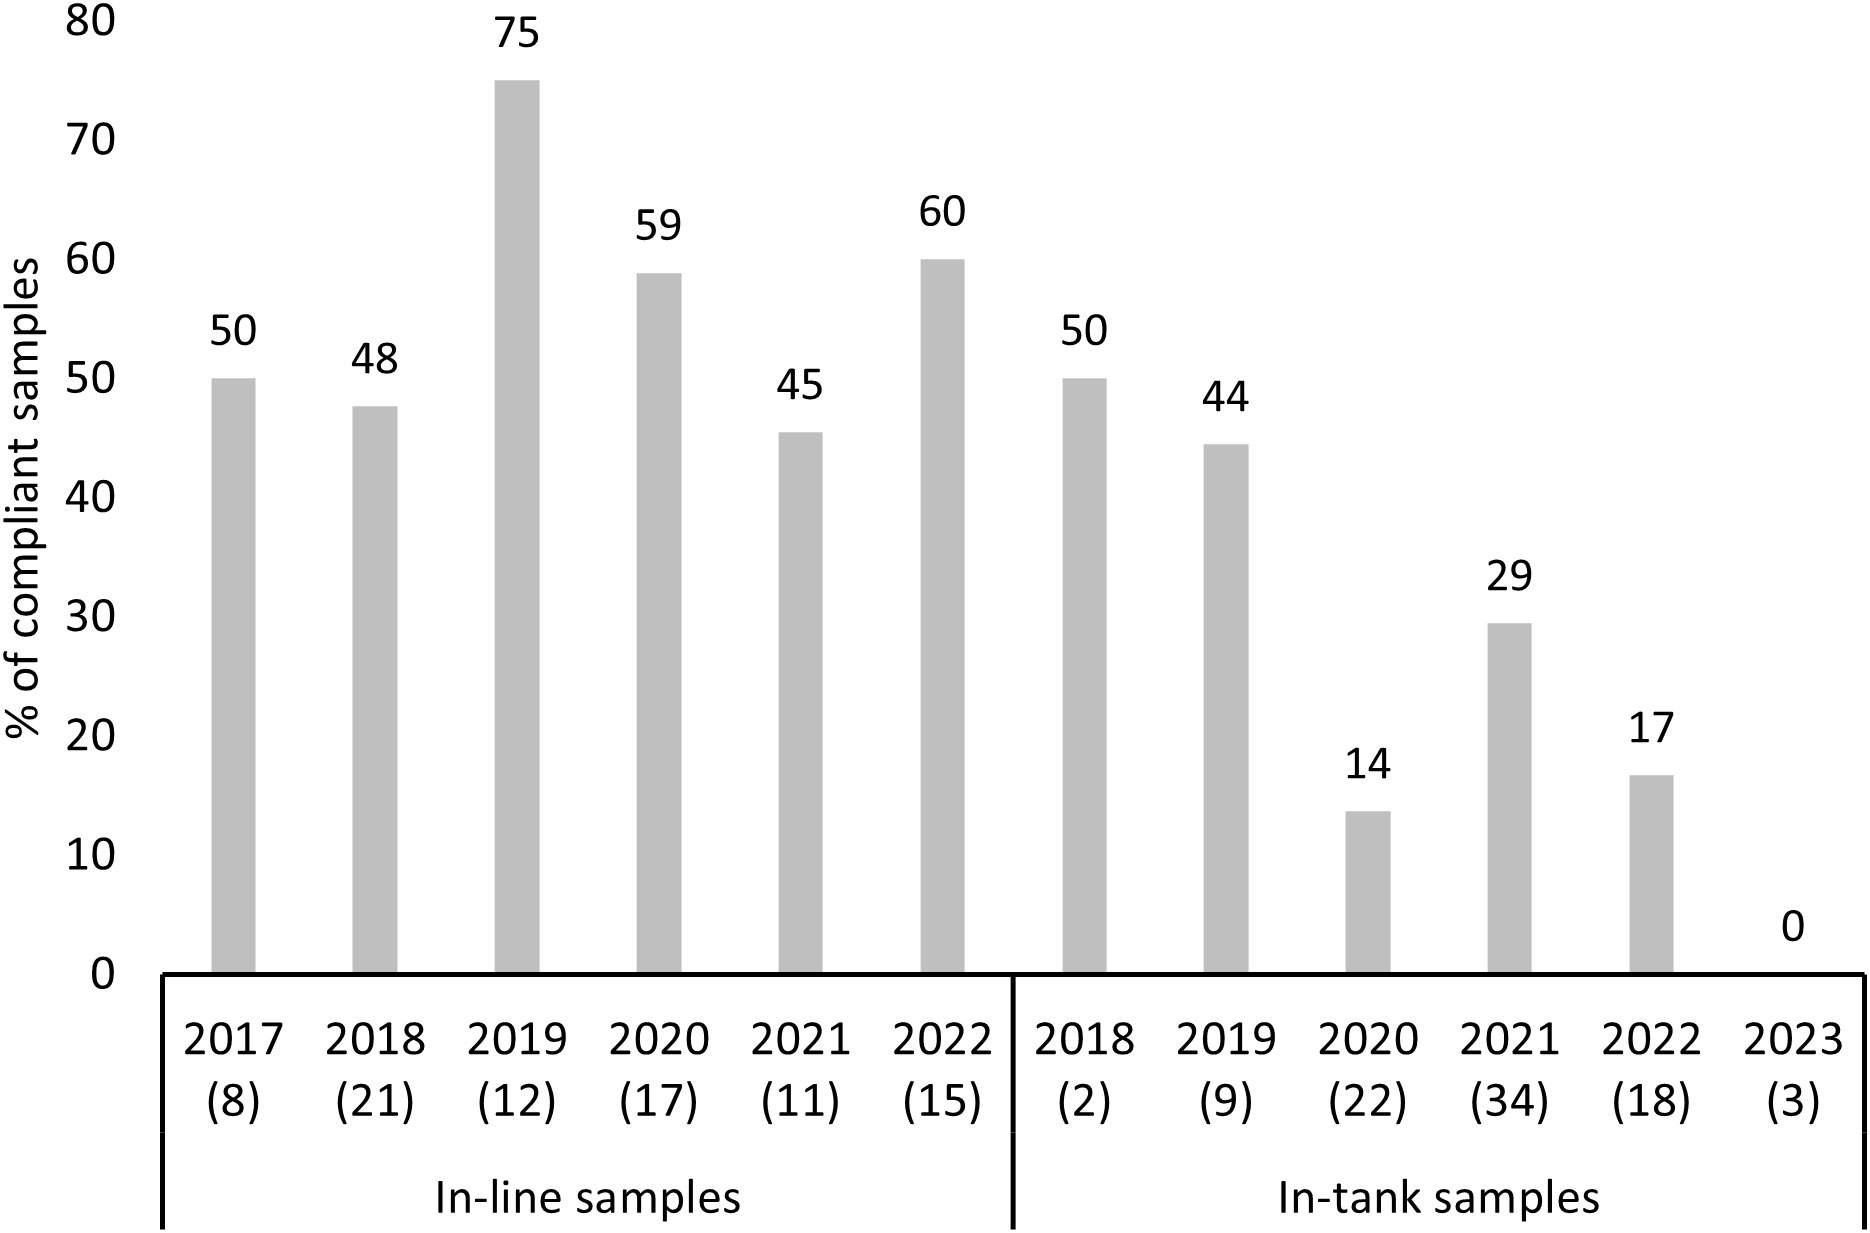
Figure 3 Percentage of compliant in-tank and in-line samples during compliance testing by year (D-2 standard, ≥50µm -sized organisms). Number of samples each year is provided in brackets.
Compliance to the D-2 standard varied between the sampled ships and ship-specific variables (Table 3). Both models revealed that compliance differentiated between the open ocean and coastal ballast water source categories (Figure 4). The probability of a ship being compliant was significantly greater for samples originating from coastal sources in comparison to open ocean for the in-tank samples. However, ballast water source had the opposite outcome between the same source categories for in-line sampled ships, although this outcome was not statistically significant. The probability of ships being either compliant, or non-compliant was not significant between the BWMS filter mesh sizes with most datapoints (40µm and 50µm) for the in-tank sampled ships. For in-line samples, model 2 showed that samples associated with 20µm filter mesh size were more likely compliant in comparison to samples, where BWMS utilized filter mesh sizes of 40 and 50µm (Figure 5). This probability was highly significant between 20µm and 50µm (p < 0.01) but less significant between 20µm and 40µm (p < 0.1). Model 2 showed that BWMS type significantly affected the compliance outcome (p < 0.05), as systems that did not utilize active substances had higher odds of being compliant than systems utilizing active substances (Figure 6). For in-tank samples (model 1), BWMS type variable was not significant and the comparison between the two types was not informative due to the high proportion of BWMS utilizing active substances. Ships sampled for compliance monitoring were more likely to be non-compliant in comparison to commissioning testing (Figure 7), although this factor was not significant in model 2. Finally, ballast water holding time did not prove to be a significant factor in either of the models, and the same was true for BWMS age in model 2.
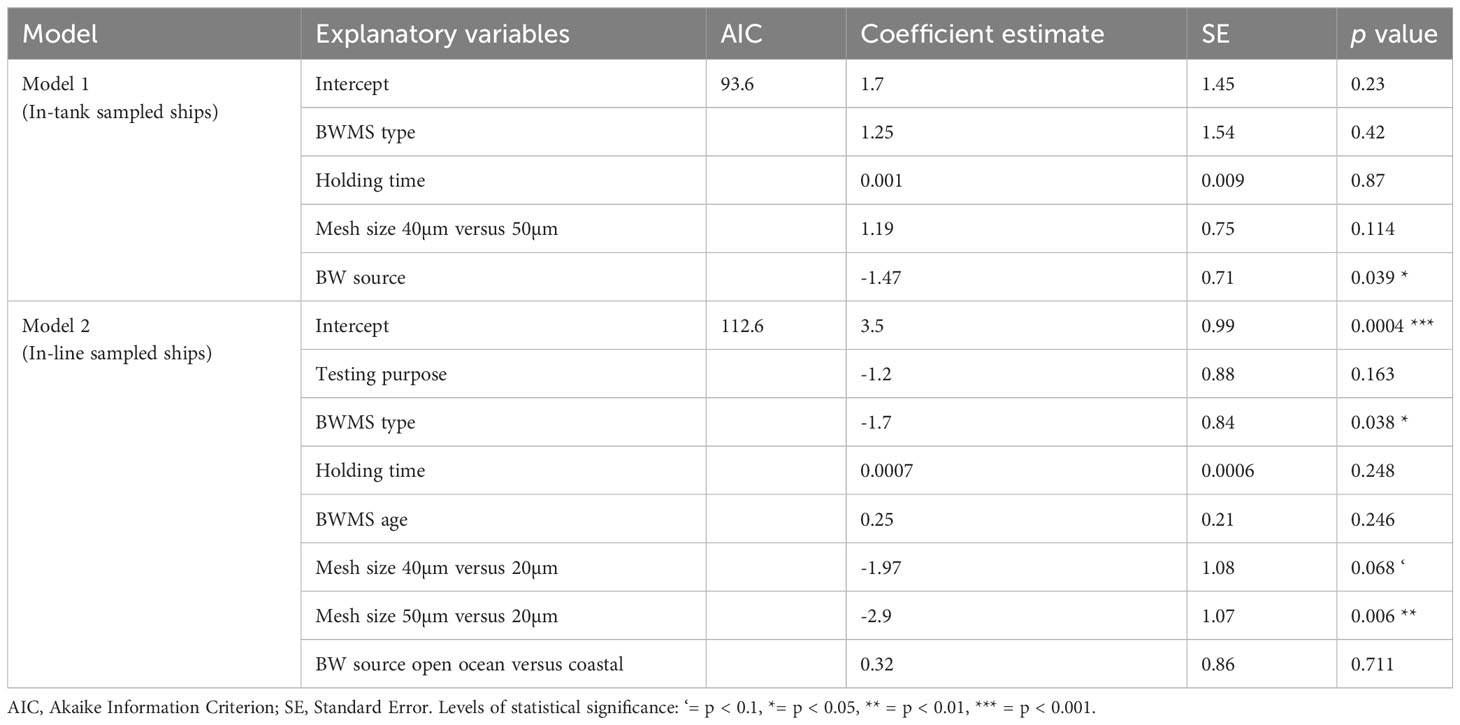
Table 3 Summary of the ship-specific factors associated with the two models.
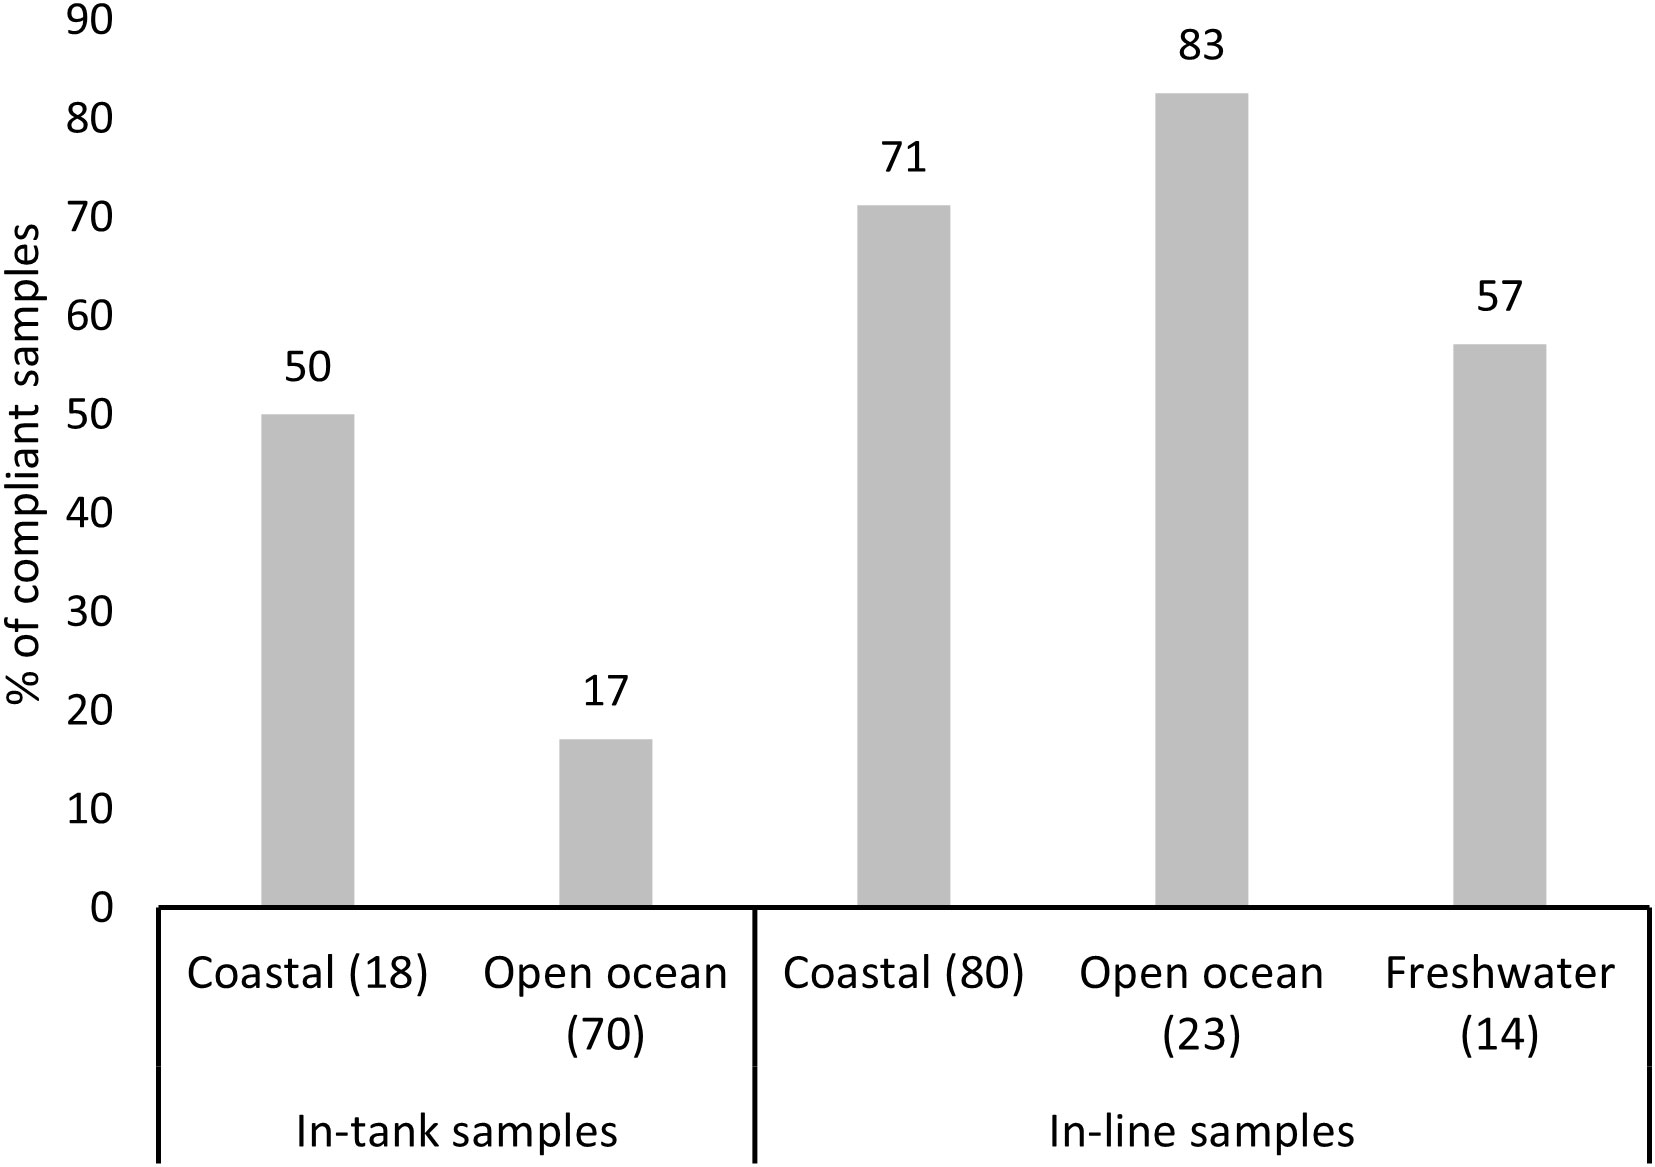
Figure 4 Percentage of compliant in-tank and in-line samples by ballast water source: freshwater, coastal and open ocean. Number of samples per ballast water source category is provided in brackets.
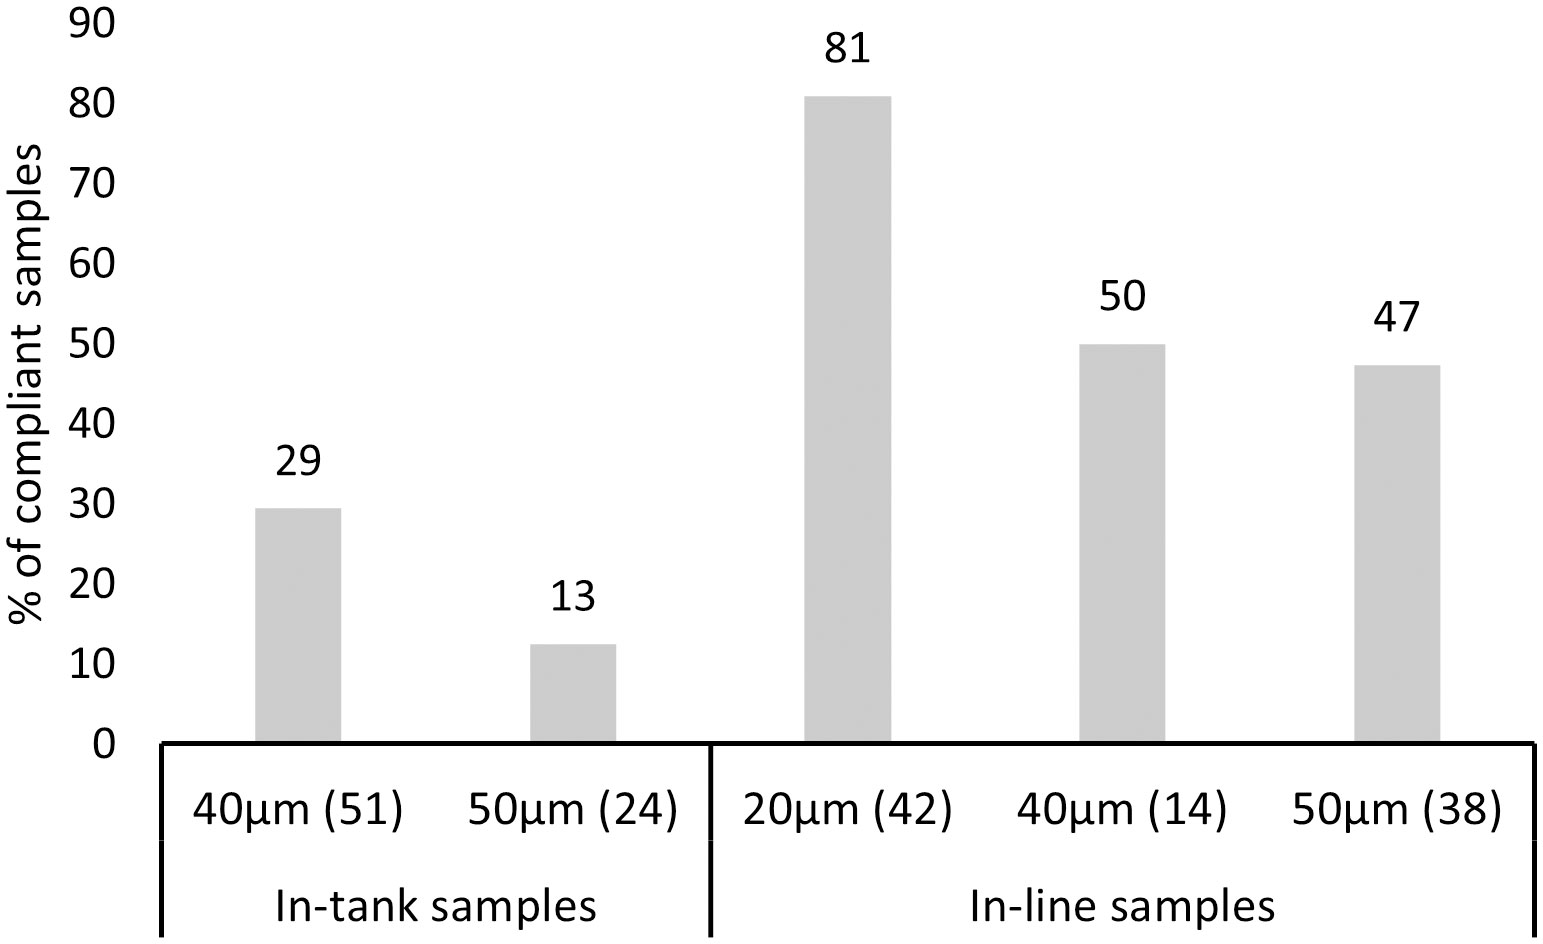
Figure 5 Percentage of compliant in-tank and in-line samples associated with the most frequently occurred filter mesh sizes within the BWMS of the tested ships. Number of samples per filter mesh size category is provided in brackets.
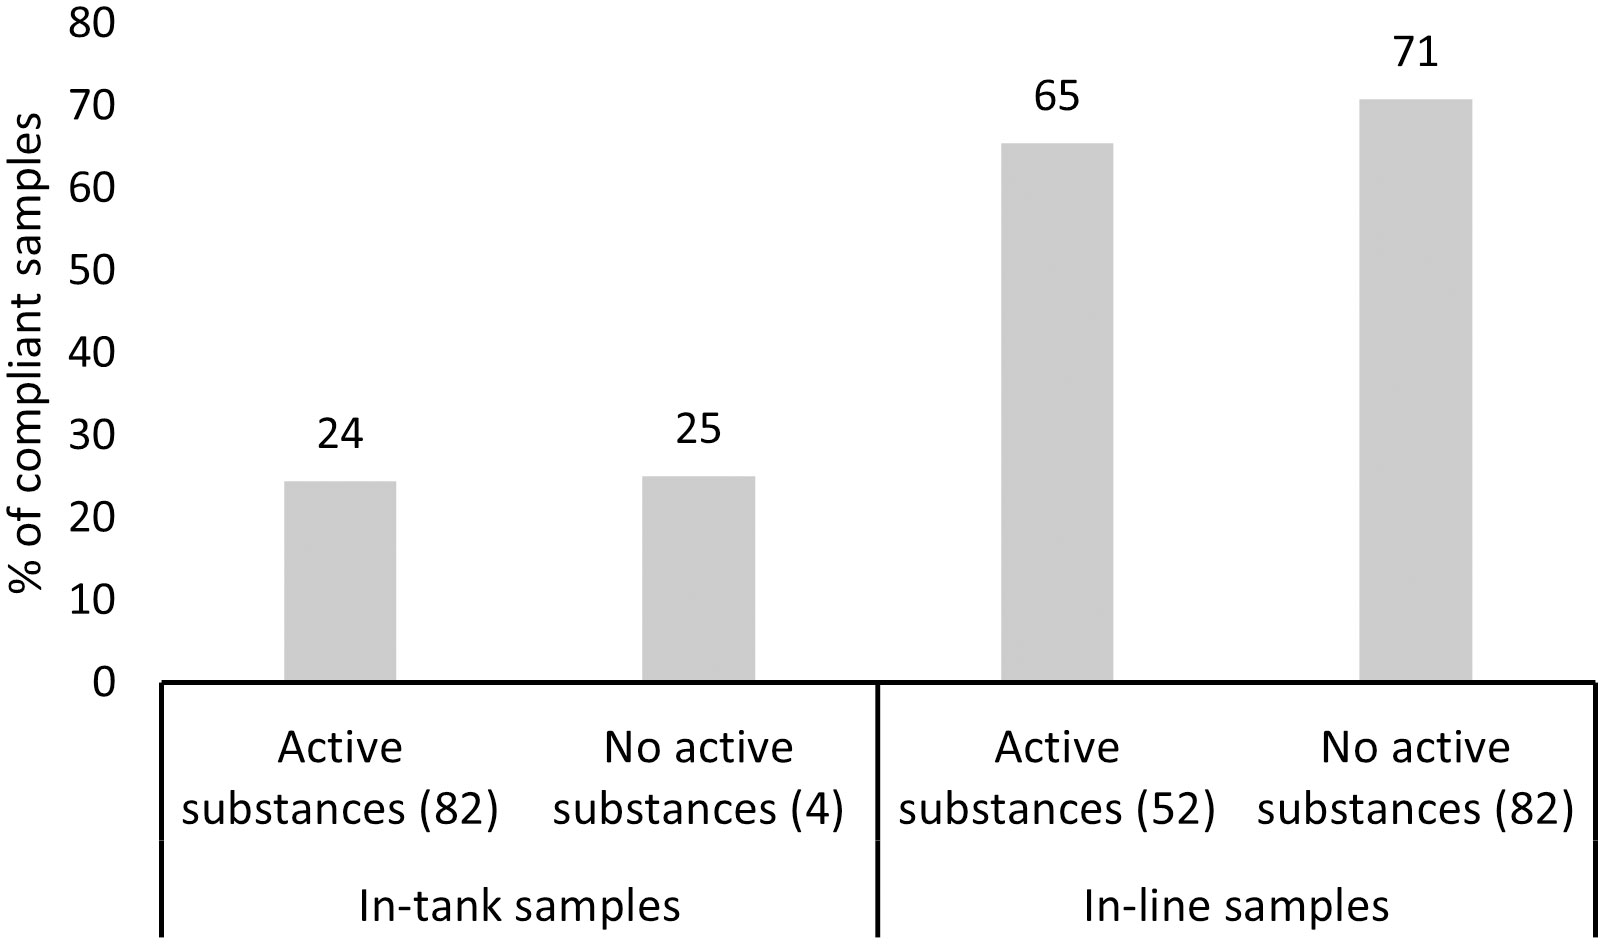
Figure 6 Percentage of compliant in-tank and in-line samples by BWMS type: with and without active substances. Number of samples per BWMS type is provided in brackets.
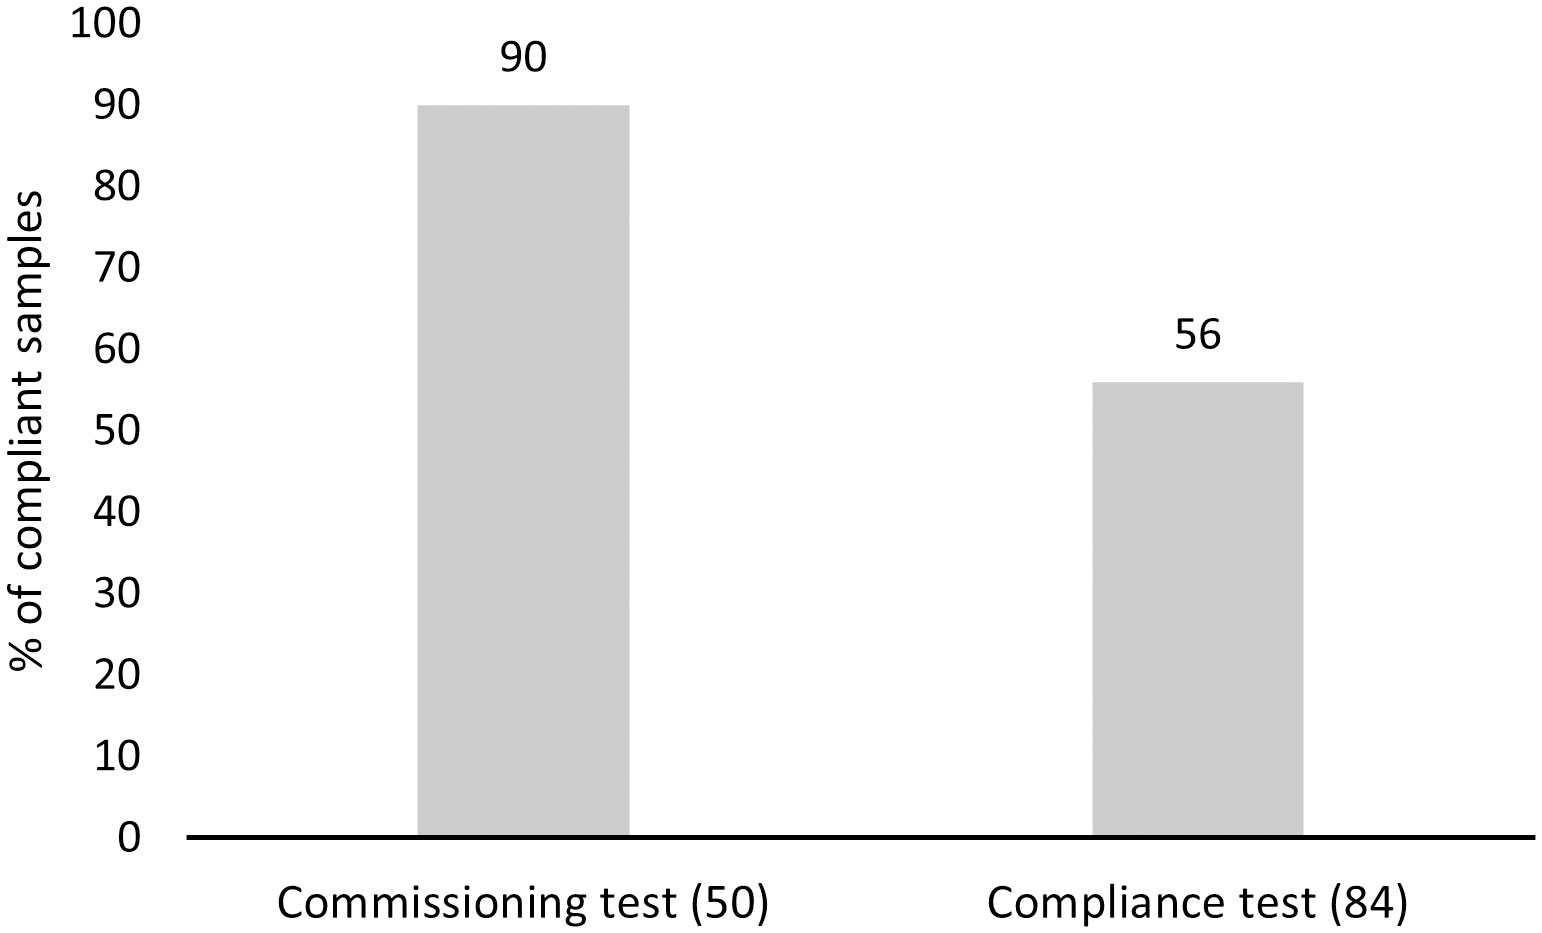
Figure 7 Percentage of compliant in-line samples collected under commissioning and compliance testing. Number of samples per testing purpose category is provided in brackets.
The results of the present study suggest that ships’ compliance to the D-2 standard should be primarily assessed based on the ≥50µm organism size class, since nearly all <50 to ≥10μm -sized organism, and indicator microbe samples were compliant, whereas almost half of the samples failed to meet the D-2 standard for the largest organisms. This finding aligns with a previous study by Drillet et al. (2023), where commissioning testing results revealed that non-compliance to the D-2 standard is nearly always due to excessive abundance of living ≥50µm -sized organisms.
In addition, the abundance of living ≥50µm -sized organisms in non-compliant samples reached thousands of organisms m-3 several times, indicating that living organisms in the largest organism category may have been more resilient to ballast water treatment. Alternatively, the observed non-compliances may be associated with tank contamination, potentially due to several factors, such as insufficient crew training in operating and maintaining the BWMS, issues with connecting pipework and valves of the ship (e.g., valves malfunctioning, or not completely closed), bypass of the BWMS pumping untreated water into the ballast tanks, or inadequate ballast tank cleaning to remove all sediments at the time of BWMS installation (Čampara et al., 2019; Gerhard et al., 2019; Bradie et al., 2023). In four out of five non-compliant commissioning tests included in the present study, non-compliance was due to tank contamination (presence of ≥50µm organisms living in the sediments) or malfunctioning ship valves allowing seepage of untreated ballast water from connected tanks (Stephanie Delacroix, unpublished data, September, 2023). Overall, there may be several reasons for the non-compliances and occasionally high abundances of the larger organisms, but it is important to note that high concentrations of living organisms in discharged ballast water are directly connected to increased propagule pressure and invasion, or establishment success of any potential non-native species present in ballast water (Casas-Monroy et al., 2016).
Bypassing the BWMS due to challenging water quality is a tricky problem currently faced by the shipping industry (Bradie et al., 2023). In short, ships operating in ports with challenging water quality, such as high level of total suspended solids or turbidity, may be unable to operate the BWMS to maintain ballasting rates required for optimum cargo operations leading to tradeoffs in environmental and economic impacts. Several alternatives have been discussed to manage challenging water quality, including bypassing the BWMS while water quality is poor and requiring ships to conduct ballast water exchange and treatment on high seas prior to the next port of call (IMO, 2021; IMO, 2022b, 2022c). While this option may keep BWMS units operational, bypassing the BWMS on multiple occasions may result in uptake of high volumes of sediment containing benthic organisms (Gollasch and David, 2021). While data were not available to include bypass as a factor in this study, it will be important to determine the effect of bypass on subsequent ballast discharges through compliance testing, following proposed guidelines to enhance recording and reporting of bypass activities (IMO, 2023a).
The most recent research by Drillet et al. (2023) on commissioning testing concluded that compliance under commissioning testing has significantly improved over time. However, similar trend for compliance testing was not found in the present study, and it may be because the testing conditions between commissioning and compliance testing are fundamentally different. Commissioning testing of BWMS can be considered as the most optimistic type of testing, since the systems are newly installed and tests commonly include personnel onboard that are familiar and well trained to run the system (Drillet et al., 2023). Most importantly, concerning BWMSs installed since 1st of June 2022, commissioning tests are mandatory and sources of BWMS failures are identified as thoroughly as possible to fix any emerging issues. In contrast, the reality regarding operational compliance testing is different. Ships undergoing compliance testing may have had an operational BWMS for several years, and various ballasting operations may have occurred during this time, including instances of system bypassing. The monitoring units of these systems may indicate no sign of failure, and there can be several reasons why the ship is not able to comply with the D-2 standard in operational service. In addition, previous research has indicated that testing requirements of the type approval guidance of the IMO (BWMS Code) do not necessarily represent water qualities that these systems encounter in all natural aquatic environments (Gollasch and David, 2021). Conversely, the implementation of BWMS Code is relatively recent (IMO, 2018b), and ships’ crews may be battling a steep learning curve such that compliance rates may yet improve with additional years of experience.
Since the BWMC entered into force, the IMO and its’ member States have worked on its’ implementation. Several priority issues were identified in 2023 during this process, including BWMS performance and reliability (IMO, 2023b). Even though the present study collated more than 200 ballast water samples to compile a large dataset, sample size (statistical power) remained a limitation of the study. Approximately 19% of the global fleet of ships above 100 gross tons were equipped with BWMS in 2021 (UNCTAD, 2021), and a minimal proportion of those ships have been tested. Therefore, the importance of compliance testing will increase even more in the future as more ships will become subject to the D-2 standard and begin to install BWMS.
At any rate, there is a need to continue and increase compliance testing globally for at least the next few years to better understand the effectiveness of the BWMC and the D-2 standard. As the age of the BWMS was not a significant factor in the present study, an evidence-based time interval between mandatory compliance testing events cannot be provided at this stage. However, mandatory testing could be an annual effort, or tied to the renewal survey schedule of the ship (IMO, 2018a). Further, the testing frequency could be increased if several consecutive non-compliant test results are reported. Any compliance testing should be conducted at least for the ≥50µm organism size class.
Overall, there were not many clear ship- or BWMS-specific variables that showed highly significant effects on D-2 standard compliance in the tested models. BWMS filter mesh size was the most significant factor affecting compliance for the in-line sampled ships. Although most BWMS technologies include a filtration unit (First et al., 2016; Hess-Erga et al., 2019; Lakshmi et al., 2021), there are various sizes of filtration units and filter screens, with different filtration technologies affecting the mechanical removal of larger organisms from ballast water (e.g., Tsolaki and Diamadopoulos, 2010; Sayinli et al., 2022). Therefore, filtration technology may impact the removal of larger organisms as much as the pore size of the filter screen utilized. The current study attempted to statistically assess whether filter mesh size had a significant impact on compliance for ≥50µm -sized organisms. The most frequently occurring BWMS filter mesh sizes did not significantly affect compliance for the in-tank sampled ships; however, there were significant variations in compliance probability among the filter mesh sizes of 20µm, 40µm, and 50µm for the in-line sampled ships, with the probability of compliance being significantly higher for BWMS using a 20µm mesh. Even though filtration units associated with a specific filter mesh size are supposed to mechanically remove larger organisms and inorganic material, the physical removal may partially fail when large volumes of ballast water are filtered at a high rate. In particular, previous research by Briski et al. (2014) has shown that there are differences in filtration efficiency between filter mesh sizes, as organisms are of different shapes and certain organisms may be flexible and pass larger filter screens. Smaller filter mesh sizes, in turn, may be more vulnerable to clogging of filters, though this aspect was not assessed in the present study. Nevertheless, the finding suggests that more research should be conducted on BWMS filtration units and technologies to determine which technical specifications result in best removal of ≥50µm organisms.
The rest of the tested factors were less significant than filter mesh size in the models. BWMS type was a significant factor among the in-line sampled ships. Samples collected from ships associated with a BWMS not utilizing active substances were more frequently compliant. Nearly all in-tank sampled ships had a BWMS that utilized active substances, hence the system comparison was not considered meaningful for these samples. Even though ships associated with a system not utilizing active substances were more often compliant in the present study, it cannot be concluded that those systems always perform better than systems utilizing active substances. As discussed under section 4.1.1., many factors in ships’ operating profile and ballast water management history may affect ships’ compliance, and samples in this study were not paired with uptake samples, which would have enabled comparing treatment efficiency directly. Previous literature by Tsolaki and Diamadopoulos (2010) and Lakshmi et al. (2021) summarize that there are numerous types and sizes of systems, utilizing various doses of active substances, or other secondary treatment methodologies often combined with filtration as the primary method of removal. Therefore, it is very likely that both types of systems can be functional under certain conditions.
A similar finding was made concerning the sample source, as the two models showed opposite compliance outcomes between open ocean and coastal sample sources, even though this variable was only statistically significant for the in-tank samples. This outcome may have been confounded with relatively large number of non-compliant in-tank samples overall, with a majority of the in-tank samples originating from open ocean. A relatively common ballast water management strategy is to combine ballast water treatment with ballast water exchange and additional treatment on high seas prior to arrival to the recipient port (Briski et al., 2015; Bradie et al., 2020). Such strategy appeared more successful for the in-line sampled ships in the present study, although the difference between open ocean and coastal samples on compliance was insignificant in model 2, and a much larger proportion of the in-line samples originated from coastal sources. However, the two models representing the results of the in-tank and in-line samples should be compared with caution, as testing conditions were different for the in-line and in-tank sampled ships, which potentially influenced the outcomes. All in-line sampled ships concerning compliance testing volunteered to be sampled, whereas compliance testing is compulsory for all ships calling at Scapa Flow, Orkney, where in-tank sampling approach was used.
The IMO has identified two primary ballast water sampling approaches, in-line and in-tank sampling (IMO, 2020a). While both methods have advantages and drawbacks, the choice of the approach may significantly impact the composition of collected organisms (Gollasch and David, 2017). Conducting a direct comparison of results from both sampling methods used in the present study was not appropriate since the methods were used under different conditions, hence separate models were utilized for the statistical analysis of in-line and in-tank testing results. While the rate of non-compliance was found to be higher for compliance test samples collected in-tank, all in-line compliance test samples were collected on a voluntary basis whereas in-tank sampling was conducted under a compulsory program at Scapa Flow, Orkney. It may be that compulsory testing provides an unbiased set of samples as ships with known BWMS operational or maintenance issues may not volunteer to be tested. Conversely, the in-tank sampling methods were paired with analysis after preservation, which may provide higher counts than live samples. Controlled comparison of samples from the same ballast tank(s) would be required to further understand the effect of different collection and analysis methods.
In-line sampling is expected to provide a more spatially representative sample of the discharged ballast water because organisms tend to be heterogeneously distributed in the ballast tanks and in-tank sampling may lead to under- or overestimation of organism abundance due to variations in tank conditions, including organism patchiness, sedimentation, vertical migration and other tank- and ship-specific processes (First et al., 2013; Gollasch and David, 2017). Further, a fundamental difference between in-tank and in-line sampling approach is the temporal aspect. In-line sampling allows a more representative, continuous or sequential sampling approach, but it requires collecting samples during the ballast water discharge. If a significant number of living organisms are detected from the sample, the discharge has already occurred (Gollasch and David, 2017). In contrast, in-tank sampling can be conducted prior to ballast water discharge, allowing (in theory) analysis before discharge and ability to prevent discharge if the sample fails to meet the D-2 standard. However, in-tank sampling will not be representative of the effect of BWMS that apply treatment on discharge, such as most ultraviolet-based systems (Casas-Monroy et al., 2018; Bradie et al., 2018a), or those using active substances that require neutralization. Previous studies have shown that in-line, time-integrated sampling conducted during the discharge of 20% to 60% of the ballast tank volume provide the most accurate and representative estimates of the average concentrations of ≥50µm -sized organisms, particularly for ballast tanks with connected side and double bottom tanks (Bailey and Rajakaruna, 2017). While collecting samples during the entire discharge is theoretically ideal, the suggested sampling window is a more feasible and effective approach.
In the present study, two methods were used to enumerate living organisms in the ≥50µm organism size class: microscopy combined with motility assessment and staining combined with preservation. Despite the limitations of microscopy assessments for detecting non-motile organisms, it is considered the standard method for enumerating live organisms in the ≥50µm size class with low rates of false positive outcomes (Bradie et al., 2018b; Gollasch and David, 2021; Bailey et al., 2022; Drillet et al., 2023). Staining combined with sample preservation was used by one of the research groups due to limited resources for immediate analysis of live organisms. Although Neutral Red can have false positive and false negative results (Elliott and Tang, 2009), it has been found more accurate than certain other dyes, such as SYTOX green and cell digestion assays (Zetsche and Meysman, 2012), and it is not outright selective between autotrophic and heterotrophic taxa, or motile and non-motile organisms. Nevertheless, staining methods are susceptible to false positive outcomes, especially after ultraviolet treatment when cell membrane integrity may not be damaged immediately (Olsen et al., 2016). One disadvantage of working with preserved samples is the time lag between sample collection and analysis, which negates the earlier-mentioned benefit of in-tank sampling (possible prevention of non-compliant discharges).
Even though clear ship- or BWMS-specific features that would have explained non-compliant or compliant outcomes better were not detected, a key finding of the present study was that compliance has not significantly improved over time. This finding suggests that regular compliance testing of ships’ BWMS should be undertaken to ensure that systems remain operational after commissioning and ships meet requirements of the D-2 standard.
As the samples were collected and analyzed using several methods, all parties concerned with compliance monitoring are encouraged to compare sampling and analysis methods to verify their representativeness and accuracy.
Finally, some of the non-compliant outcomes may have been due to tank contamination, improper system installation and insufficient crew training, hence better crew training for operation and maintenance of the entire system has the potential to further improve ballast water management success.
The original contributions presented in the study are included in the article/Supplementary Material. Further inquiries can be directed to the corresponding author.
The manuscript presents research on animals that do not require ethical approval for their study.
OO: Conceptualization, Data curation, Methodology, Supervision, Visualization, Writing – original draft, Writing – review & editing. SB: Conceptualization, Data curation, Funding acquisition, Investigation, Methodology, Writing – review & editing. OC: Formal analysis, Investigation, Methodology, Visualization, Writing – review & editing. SD: Data curation, Investigation, Methodology, Writing – review & editing. SG: Data curation, Funding acquisition, Investigation, Writing – review & editing. EG: Investigation, Writing – review & editing. JK: Data curation, Funding acquisition, Investigation, Methodology, Writing – review & editing. GS: Investigation, Methodology, Visualization, Writing – review & editing.
The author(s) declare that no financial support was received for the research, authorship, and/or publication of this article.
This manuscript resulted from collaboration facilitated by the International Council for the Exploration of the Sea (ICES), Intergovernmental Oceanographic Commission of UNESCO and International Maritime Organizations’ Working Group on Ballast and Other Ship Vectors. Finnish Transport and Communications agency and Finnish Marine Research Infrastructure (FINMARI) network supported Okko Outinen and partially facilitated this work. Greta Srėbalienė was supported by the European Social Fund, under project no 09.3.3- LMT-K-712, the “Development of Competences of Scientists, other Researchers and Students through Practical Research Activities” measure, grant agreement no. 09.3.3-LMT-K-712–19-0083. Sarah Bailey and Oscar Casas-Monroy were supported by funding from Transport Canada and Fisheries and Oceans Canada. The authors would like to thank Julio de la Cueva and the Spanish National Port Agency-Puertos del Estado for providing helpful insights to the study. The authors are grateful to all technicians in different laboratories that helped with various sampling and analysis procedures. The efforts of many staff members at Orkney Harbour Authority, Orcades Marine Management Consultants Ltd and APEM Ltd are appreciated for supporting in the ballast water sample collection, testing and analysis in Orkney, Scotland. The help of Greta Gyraitė and Toma Dabulevičienė with the sampling and analyses of a proportion of the ships is greatly appreciated.
The authors declare that the research was conducted in the absence of any commercial or financial relationships that could be construed as a potential conflict of interest.
All claims expressed in this article are solely those of the authors and do not necessarily represent those of their affiliated organizations, or those of the publisher, the editors and the reviewers. Any product that may be evaluated in this article, or claim that may be made by its manufacturer, is not guaranteed or endorsed by the publisher.
The Supplementary Material for this article can be found online at: https://www.frontiersin.org/articles/10.3389/fmars.2024.1334286/full#supplementary-material
Adams J. K., Briski E., Ram J. L., Bailey S. A. (2014). Evaluating the response of freshwater organisms to vital staining. Manage. Biol. Invasions. 5, 197–208. doi: 10.3391/mbi.2014.5.3.02
Bailey S. A., Brown L., Campbell M. L., Canning-Clode J., Carlton J. T., Castro N., et al. (2020). Trends in the detection of aquatic non-indigenous species across global marine, estuarine and freshwater ecosystems: A 50-year perspective. Divers. Distrib. 26, 1780–1797. doi: 10.1111/ddi.13167
Bailey S. A., Brydges T., Casas-Monroy O., Kydd J., Linley R. D., Rozon R. M., et al. (2022). First evaluation of ballast water management systems on operational ships for minimizing introductions of nonindigenous zooplankton. Mar. Pollut. Bull. 182, 113947. doi: 10.1016/j.marpolbul.2022.113947
Bailey S. A., Rajakaruna H. (2017). Optimizing methods to estimate zooplankton concentration based on generalized patterns of patchiness inside ballast tanks and ballast water discharges. Ecol. Evol. 7, 689–9698. doi: 10.1002/ece3.3498
Bradie J., Broeg K., Gianoli C., He J., Heitmüller S., Curto A. L., et al. (2018b). A shipboard comparison of analytic methods for ballast water compliance monitoring. J. Sea Res. 133, 11–19. doi: 10.1016/j.seares.2017.01.006
Bradie J. N., Bailey S. A. (2021). A decision support tool to prioritize ballast water compliance monitoring by ranking risk of non-indigenous species establishment. J. Appl. Ecol. 58, 587–595. doi: 10.1111/1365-2664.13822
Bradie J. N., Drake D. A. R., Ogilvie D., Casas-Monroy O., Bailey S. A. (2020). Ballast water exchange plus treatment lowers species invasion rate in freshwater ecosystems. Environ. Sci. Technol. 55, 82–89. doi: 10.1021/acs.est.0c05238
Bradie J., Gianoli C., He J., Curto A. L., Stehouwer P., Veldhuis M., et al. (2018a). Detection of UV-treatment effects on plankton by rapid analytic tools for ballast water compliance monitoring immediately following treatment. J. Sea Res. 133, 177–184. doi: 10.1016/j.seares.2017.09.002
Bradie J., Rolla M., Bailey S. A., MacIsaac H. J. (2023). Managing risk of non-indigenous species establishment associated with ballast water discharges from ships with bypassed or inoperable ballast water management systems. J. Appl. Ecol. 60, 193–204. doi: 10.1111/1365-2664.14321
Briski E., Gollasch S., David M., Linley R. D., Casas-Monroy O., Rajakaruna H., et al. (2015). Combining ballast water exchange and treatment to maximize prevention of species introductions to freshwater ecosystems. Environ. Sci. Technol. 49, 9566–9573. doi: 10.1021/acs.est.5b01795
Briski E., Linley R. D., Adams J., Bailey S. A. (2014). Evaluating efficacy of a ballast water filtration system for reducing spread of aquatic species in freshwater ecosystems. Manage. Biol. Invasions. 5, 245–253. doi: 10.3391/mbi.2014.5.3.08
Čampara L., Frančić V., Maglić L., Hasanspahić N. (2019). Overview and comparison of the IMO and the US Maritime Administration ballast water management regulations. J. Mar. Sci. Eng. 7, 283. doi: 10.3390/jmse7090283
Carney K. J., Basurko O. C., Pazouki K., Marsham S., Delany J. E., Desai D. V., et al. (2013). Difficulties in obtaining representative samples for compliance with the Ballast Water Management Convention. Mar. Pollut. Bull. 68, 99–105. doi: 10.1016/j.marpolbul.2012.12.016
Casas-Monroy O., Bailey S. A. (2021). Do ballast water management systems reduce phytoplankton introductions to Canadian waters? Front. Mar. Sci. 8. doi: 10.3389/fmars.2021.691723
Casas-Monroy O., Linley R. D., Chan P. S., Kydd J., Byllaardt J. V., Bailey S. A. (2018). Evaluating efficacy of filtration+ UV-C radiation for ballast water treatment at different temperatures. J. Sea Res. 133, 20–28. doi: 10.1016/j.seares.2017.02.001
Casas-Monroy O., Parenteau M., Drake D. A. R., Roy S., Rochon A. (2016). Absolute estimates of the propagule pressure of viable dinoflagellates across Canadian coasts: the variable influence of ballast water exchange. Mar. Biol. 163, 1–15. doi: 10.1007/s00227-016-2946-3
Drake L. A., Moser C. S., Robbins-Wamsley S. H., Riley S. C., Wier T. P., Grant J. F., et al. (2014). Validation trials of a shipboard filter skid (p3SFS) demonstrate its utility for collecting living zooplankton. Mar. Pollut. Bull. 79, 77–86. doi: 10.1016/j.marpolbul.2013.12.044
Drillet G., Gianoli C., Gang L., Zacharopoulou A., Schneider G., Stehouwer P., et al. (2023). Improvement in compliance of ships' ballast water discharges during commissioning tests. Mar. Pollut. Bull. 191, 114911. doi: 10.1016/j.marpolbul.2023.114911
Elliott D. T., Tang K. W. (2009). Simple staining method for differentiating live and dead marine zooplankton in field samples. Limnol. Oceanogr–Meth. 7, 585–594. doi: 10.4319/lom.2009.7.585
Faraway J. J. (2016). Generalized Linear Mixed Effects and Nonparametric Regression Models. (Second Edition. New York: Chapman & Hall/CRC).
Feng W., Chen Y., Zhang T., Xue J., Wu H. (2023). Evaluate the compliance of ballast water management system on various types of operational vessels based on the D-2 standard. Mar. Pollut. Bull. 194, 115381. doi: 10.1016/j.marpolbul.2023.115381
First M. R., Lemieux E. J., Hyland W. B., Grant J. F., Moser C. S., Riley S. C., et al. (2012). Validation of a closed-housing filter skid for in-line sampling of aquatic organisms. J. Plankton Res. 34, 321–331. doi: 10.1093/plankt/fbs007
First M. R., Robbins-Wamsley S. H., Riley S. C., Drake L. A. (2016). Towards minimizing transport of aquatic nuisance species in ballast water: Do organisms in different size classes respond uniformly to biocidal treatment? Biol. Invasions. 18, 647–660. doi: 10.1007/s10530-015-1036-7
First M. R., Robbins-Wamsley S. H., Riley S. C., Moser C. S., Smith G. E., Tamburri M. N., et al. (2013). Stratification of living organisms in ballast tanks: how do organism concentrations vary as ballast water is discharged? Environ. Sci. Technol. 47, 4442–4448. doi: 10.1021/es400033z
Gerhard W. A., Lundgreen K., Drillet G., Baumler R., Holbech H., Gunsch C. K. (2019). Installation and use of ballast water treatment systems–Implications for compliance and enforcement. Ocean Coast. Manage. 181, 104907. doi: 10.1016/j.ocecoaman.2019.104907
Gollasch S., David M. (2010). “Recommendations how to take a representative ballast water sample,” in Proceedings of the IMO-WMU Research and Development Forum.. Emerging Ballast Water Management Systems. (Malmö, Sweden: WMU Publications). 247.
Gollasch S., David M. (2017). Recommendations for representative ballast water sampling. J. Sea Res. 123, 1–15. doi: 10.1016/j.seares.2017.02.010
Gollasch S., David M. (2021). Abiotic and biological differences in ballast water uptake and discharge samples. Mar. Pollut. Bull. 164, 112046. doi: 10.1016/j.marpolbul.2021.112046
Hess-Erga O. K., Moreno-Andrés J., Enger Ø., Vadstein O. (2019). Microorganisms in ballast water: disinfection, community dynamics, and implications for management. Sci. Total Environ. 657, 704–716. doi: 10.1016/j.scitotenv.2018.12.004
ICES/IOC/IMO WGBOSV. (2017). Standard Operating Procedures Collection of Treated Ballast Water Samples Using an Inline Sample Port. (Copenhagen, Denmark: ICES). Available online at: https://www.ices.dk/community/Documents/Expert%20Groups/WGBOSV/SOP_inline%20ballast%20water%20sampling.pdf (Accessed November 1, 2023).
IMO. (2004). International Convention for the Control and Management of Ships’ Ballast Water and Sediment. (London, UK: International Maritime Organization).
IMO. (2008). Guidelines for approval of ballast water management systems (G8). (Resolution MEPC.174(58). London, UK: International Maritime Organization).
IMO. (2014). Guidelines for Port State Control under the BWM Convention. (London, UK: International Maritime Organization). Resolution MEPC.252(67).
IMO. (2017). The Experience-Building Phase associated with the BWM Convention. (London, UK: International Maritime Organization). Resolution MEPC.290(71).
IMO. (2018a). IMO MEPC.297/72. Amendments to regulation B-3. (London, UK: International Maritime Organization). MEPC.297(72).
IMO. (2018b). Code for Approval of Ballast Water Management Systems (BWMS CODE). (London, UK: International Maritime Organization). Resolution MEPC.300(72).
IMO. (2020a). 2020 Guidance on ballast water sampling and analysis for trial use in accordance with the BWM Convention and Guidelines (G2). (London, UK: International Maritime Organization). BWM.2/Circ.42/Rev.2.
IMO. (2020b). Guidance for the commissioning testing of ballast water management systems. (London, UK: International Maritime Organization). BWM.2/Circ.70/Rev.1.
IMO. (2021). Report of the Ballast Water Review Group. (London, UK: International Maritime Organization). MEPC 77/WP.10.
IMO. (2022a). Report on the experience-building phase associated with the Ballast Water Management Convention. (London, UK: International Maritime Organization). MEPC 78/4/1.
IMO. (2022b). Report of the Ballast Water Review Group. (London, UK: International Maritime Organization). MEPC 78/WP.8.
IMO. (2022c). “Next steps in the experience-building phase associated with the BWM Convention,” (International Maritime Organization, London, UK). MEPC 78/4/10.
IMO. (2023a). Interim guidance on the application of the BWM Convention to ships operating in challenging water quality conditions. (London, UK: International Maritime Organization). MEPC 81/4/4.
IMO (2023b). Report of the Ballast Water Review Group. (London, UK: International Maritime Organization). MEPC 80/WP.13.
IOC UNESCO. (2010). Microscopic and molecular methods for quantitative phytoplankton analysis. (Paris, France: UNESCO). Available online at: https://unesdoc.unesco.org/ark:/48223/pf0000187824 (Accessed November 1, 2023). IOC Manuals and Guides, IOC/2010/MG/55).
ISO. (2019). Ships and marine technology — Aquatic nuisance species — Part 1: Ballast water discharge sample port. (Geneva, Switzerland: International Organization for Standardization). ISO 11711-1:2019.
ISO. (2022). Ships and marine technology — Aquatic nuisance species — Part 2: Ballast water sample collection and handling. (Geneva, Switzerland: International Organization for Standardization). ISO 11711-2:2022.
Kleinbaum D. G., Klein M. (2010). Logistic Regression, Statistics for Biology and Health. Third edition. (New York: Springer Science + Business Media, LLC). doi: 10.1007/978-1-4419-1742-3
Lakshmi E., Priya M., Achari V. S. (2021). An overview on the treatment of ballast water in ships. Ocean Coast. Manage. 199, 105296. doi: 10.1016/j.ocecoaman.2020.105296
Lavoie D. M., Smith L. D., Ruiz G. M. (1999). The potential for intracoastal transfer of non-indigenous species in the ballast water of ships. Estuar. Coast. Shelf Sci. 48, 551–564. doi: 10.1006/ecss.1999.0467
NSF International (2010) Generic protocol for the verification of ballast water treatment technology. (Ann Arbor, Michigan, USA: NSF International). Available online at: https://www.dco.uscg.mil/Portals/9/ETV%20EPA%20Report.pdf?ver=2018-05-22-081043-607 (Accessed October 15, 2023).
Ojaveer H., Galil B. S., Minchin D., Olenin S., Amorim A., Canning-Clode J., et al. (2014). Ten recommendations for advancing the assessment and management of non-indigenous species in marine ecosystems. Mar. Policy. 44, 160–165. doi: 10.1016/j.marpol.2013.08.019
Olsen R. O., Hoffmann F., Hess-Erga O. K., Larsen A., Thuestad G., Hoell I. A. (2016). Ultraviolet radiation as a ballast water treatment strategy: Inactivation of phytoplankton measured with flow cytometry. Mar. Pollut. Bull. 103, 270–275. doi: 10.1016/j.marpolbul.2015.12.008
Paolucci E. M., Hernandez M. R., Potapov A., Lewis M. A., MacIsaac H. J. (2015). Hybrid system increases efficiency of ballast water treatment. J. Appl. Ecol. 52, 348–357. doi: 10.1111/1365-2664.12397
R Core Team. (2022). R: A language and environment for statistical computing.. Available online at: https://www.R-project.org/ (Accessed January 6, 2024).
Ruiz G. M., Carlton J. T., Grosholz E. D., Hines A. H. (1997). Global invasions of marine and estuarine habitats by non-indigenous species: mechanisms, extent, and consequences. Am. Zool. 37, 621–632. doi: 10.1093/icb/37.6.621
Sayinli B., Dong Y., Park Y., Bhatnagar A., Sillanpää M. (2022). Recent progress and challenges facing ballast water treatment–a review. Chemosphere. 291, 132776. doi: 10.1016/j.chemosphere.2021.132776
Tsolaki E., Diamadopoulos E. (2010). Technologies for ballast water treatment: a review. J. Chem. Technol. Biotechnol. 85, 19–32. doi: 10.1002/jctb.2276
UNCTAD. (2021). Review of Maritime Transport 2021. (New York: United Nations Publications). Available online at: https://unctad.org/system/files/official-document/rmt2021_en_0.pdf (Accessed November 1, 2023).
UNDP. (2023). Large Marine Ecosystems Hub.. Available online at: https://lmehub.net/ (Accessed May 18, 2023).
Wright D. A., Welschmeyer N. A., Peperzak L. (2015). Alternative, indirect measures of ballast water treatment efficacy during a shipboard trial: a case study. J. Mar. Eng. Technol. 14, 1–8. doi: 10.1080/20464177.2015.1022379
Keywords: ballast water treatment, Non-native species, Aquatic invasions, D-2 standard, ballast water management systems
Citation: Outinen O, Bailey SA, Casas-Monroy O, Delacroix S, Gorgula S, Griniene E, Kakkonen JE and Srebaliene G (2024) Biological testing of ships’ ballast water indicates challenges for the implementation of the Ballast Water Management Convention. Front. Mar. Sci. 11:1334286. doi: 10.3389/fmars.2024.1334286
Received: 06 November 2023; Accepted: 15 February 2024;
Published: 29 February 2024.
Edited by:
Ram Kumar, Central University of Bihar, IndiaReviewed by:
Devesh Kumar Yadav, Central University of South Bihar, IndiaCopyright © 2024 Outinen, Bailey, Casas-Monroy, Delacroix, Gorgula, Griniene, Kakkonen and Srebaliene. This is an open-access article distributed under the terms of the Creative Commons Attribution License (CC BY). The use, distribution or reproduction in other forums is permitted, provided the original author(s) and the copyright owner(s) are credited and that the original publication in this journal is cited, in accordance with accepted academic practice. No use, distribution or reproduction is permitted which does not comply with these terms.
*Correspondence: Okko Outinen, b2trby5vdXRpbmVuQHN5a2UuZmk=
Disclaimer: All claims expressed in this article are solely those of the authors and do not necessarily represent those of their affiliated organizations, or those of the publisher, the editors and the reviewers. Any product that may be evaluated in this article or claim that may be made by its manufacturer is not guaranteed or endorsed by the publisher.
Research integrity at Frontiers
Learn more about the work of our research integrity team to safeguard the quality of each article we publish.