 Sue Chen
 James A. Cummings
 Jayaram Veeramony3
95% of researchers rate our articles as excellent or good
Learn more about the work of our research integrity team to safeguard the quality of each article we publish.
Find out more
ORIGINAL RESEARCH article
Front. Mar. Sci. , 01 May 2024
Sec. Ocean Observation
Volume 11 - 2024 | https://doi.org/10.3389/fmars.2024.1332883
This article is part of the Research Topic Impact of Oceans on Extreme Weather Events (Tropical Cyclones) View all 8 articles
The impact of surface wave assimilation on hurricane track and intensity forecasts has been investigated using a fully coupled air-ocean-wave tropical cyclone data assimilation and forecast modeling system. A new 3DVAR wave assimilation method in the Navy Coupled Ocean Data Assimilation system (NCODA) maps the 1D wave energy spectra from buoys to 2D directional wave energy spectra using the maximum likelihood method (MLM) and corrects the wave model forecast component directional wave energy spectra. The Coupled Ocean/Atmosphere Mesoscale Prediction System for Tropical Cyclone Prediction (COAMPS-TC) is used to conduct three Hurricane Harvey (2017) air-ocean-wave coupled data assimilation and forecasting experiments with and without the wave data assimilation. Hurricane Harvey traversed through the Western Gulf of Mexico from 24 August to 1 September, 2017 and made landfall in the Texas and Louisiana coast. Validation of track, maximum wind speed, significant wave height, and mean absolute wave periods show wave assimilation of the 1D wave energy spectra from 13 National Data Buoy Center (NDBC) buoys reduced the forecast errors of these parameters compared to experiments without the wave assimilation. In spite of this positive outcome, the wave assimilation is unable to reduce Harvey’s 0-120 h forecast mean wave direction errors and correlation compared to the NDBC buoy time series
Tropical Cyclones (TC) are one of the most severe natural disasters that cause devastating damage on societies worldwide from the combination of winds, tornados, flood, and storm surge in both coastal and inland regions. The advancements of TC dynamic models in recent decade have made steady inroads to improve deterministic and probability forecasts of TC track, intensity, winds, and waves (Heming et al., 2019; Cangialosi et al., 2020). In particular, increased capabilities to observe the ocean wave energy spectra routinely by operational buoy observing system or by targeted sampling of TC provide an opportunity to investigate the wave spectra data assimilation impact on TC prediction. Inclusion of wave observations to improve operational forecasting of wave conditions has high impact in the coastal zones where a large population lives.
The fundamental concept underpinning spectral wave modeling is the energy balance equation. This states that the evolution of the wave spectrum is the sum of three source terms describing the input of energy from the wind, the nonlinear transfer of energy within the wave variance spectrum, and the dissipation of energy from wave breaking or shallow water processes (Komen et al., 1994). Wave models compute an explicit representation of all three source terms and the evolution of the wave spectrum, without a priori assumptions about the spectral shape. Even though various data assimilation techniques have been used to improve model predictions (see Bannister, 2017 for a review) in an operational environment, these techniques have been applied largely to the atmospheric and ocean circulation models. Wave model runs with assimilated data have been shown to significantly reduce errors in modeled wave parameters. Lionello et al. (1992) used an optimal interpolation technique (OI) to assimilate significant wave heights derived from satellite altimeter data to correct the total energy in the wave spectrum. A similar technique was used by Voorrips et al. (1997) to assimilate significant wave height data from wave buoys. Smit et al. (2021) took the OI technique further by assimilating bulk wave parameters including significant wave height and wave period from a large distributed buoy network, 129 free-drifting Sofar Spotters buoys, to analyze the potential impact on the total energy. They reported the forecast improvement from wave assimilation extends to 4 days. In all these cases, the aim was to improve the wave energy in the modeled domain. Veeramony et al. (2010) and Orzech et al. (2014) showed that for smaller domains focused on the nearshore region, a 4D variational assimilation (4DVar) system assimilating the wave spectrum to correct the wave boundary conditions provided significant improvements in reproducing the directional wave spectra in the domain. Compared to the 3DVAR data assimilation system, the added computation cost of using 4DVAR may not be feasible for operational implementation because of wall time constrain. Conversely, recent studies using a 3DVAR significant wave height assimilation show improvement of wave forecast up to 24 h (Saulter et al., 2020; Byrne et al., 2023). Using the most computational expansive ensemble-based assimilation of significant wave height method can further extend the wave forecast improvement out to 2.5 days (Houghton et al., 2023).
The success of data assimilation in atmospheric and oceanographic forecast systems is made possible by a considerable amount of routine observational data from a variety of sources. Data assimilation in atmospheric forecasts indirectly improve ocean and wave models through improved estimates of surface wind stresses, surface pressure, and air-sea fluxes (Sanabia et al., 2013; Chen et al., 2017). For wave models, specifically, improvements in the surface wind and pressure field will generally result in higher skill in the wave forecasts. However, direct improvement of wave forecasts using data assimilation is also possible, but the sparsity of real-time wave data is a core issue for wave assimilation systems, especially under tropical cyclone (TC) conditions. Buoy networks provide highly accurate estimates of wave spectrum statistics, but these data are sparse due to the cost of deployment and maintenance of the buoys. In the U.S., the National Buoy Data Center (NDBC) deploys fixed buoys near the coast that collect a variety of observations useful in the monitoring of Hurricane wave conditions. These measurements include accelerometers or inclinometers on board the buoys that measure the heave, acceleration, and the vertical displacement of the buoy hull (NDBC, 2009; Hall et al., 2022), as well as winds and ocean temperatures. The in situ wave observations complement the satellite remote sensing of surface waves from altimeters, which has been available since the 1980s and assimilated by many operational centers worldwide. The altimeter wave estimates are valuable but they carry considerable uncertainty and the spatial and temporal sampling characteristics of the altimeters limit their effectiveness (Wittmann and Cummings, 2004; Tran et al., 2010; Fan et al., 2012; Seemanth et al., 2021).
More fundamentally, wave forecasting is a forcing problem while numerical weather prediction is an initial value problem. A considerable part of the ocean wave field is formed directly by surface winds and near-surface pressure fluctuations in the atmosphere (i.e., wind sea components). As a result, errors in the forecasting of wind-sea wave conditions are reduced when the skill of the weather models is improved with data assimilation. The assimilation of wave observations correct wave model errors, but if the wave field is corrected without also correcting the atmospheric forcing field to match, the wave field will rapidly return to the state dictated by the forcing. In this regard, a coupled ocean, atmosphere, wave modeling system that includes data assimilation in all of the coupled system components would be expected to maintain forecast skill for much longer than an uncoupled system.
Building upon the previous aforementioned studies, this study investigates a wave model assimilation methodology that assimilate both routinely available observations of wave energy spectra from 13 NDBC buoys (Table 1; Kuik et al., 1988; Riley et al., 2019) and satellite altimeter derived altimeter significant wave height measurements in a fully coupled air-ocean-wave tropical cyclone data assimilation and forecast modeling system. Because there are many NDBC buoys in the Gulf of Mexico (GOM) region, the Hurricane Harvey (2017) case is ideally used to study the impact of the directional wave spectra assimilation.
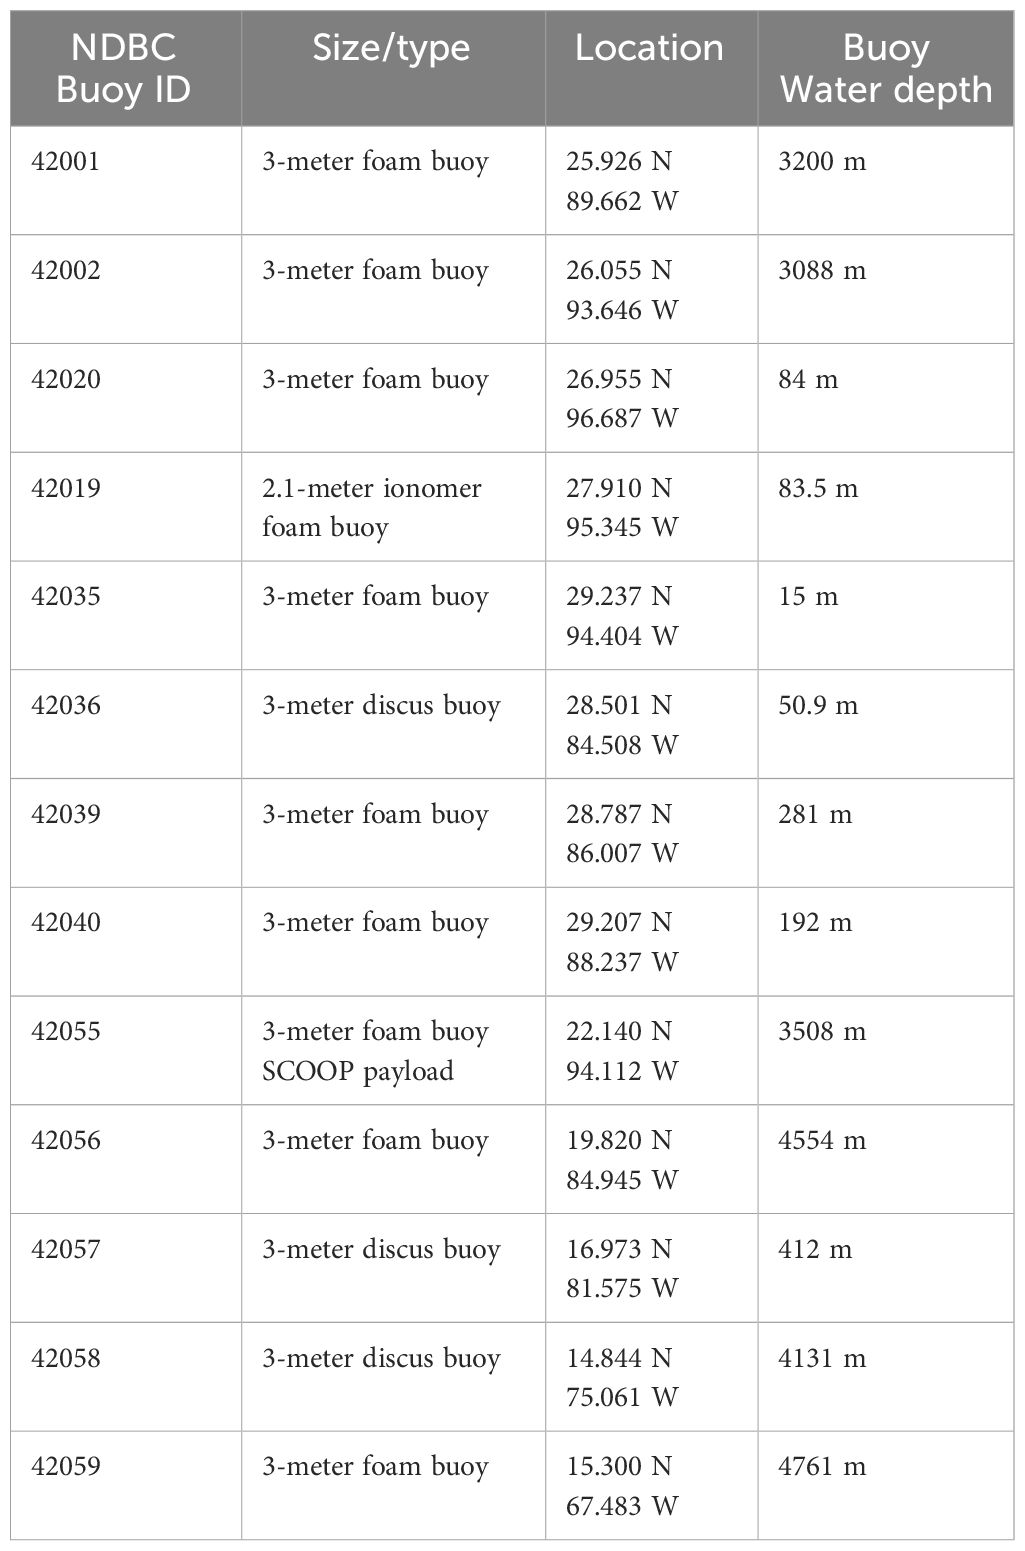
Table 1 A list of 13 NDBC SCOOP payload buoy attribute used in the COAMPS WW3 Hurricane Harvey wave assimilation experiment.
Hurricane Harvey entered the Gulf of Mexico on 23 August, rapidly intensified and made landfall near Port Aransas, Texas around 10 p.m. on 25 August (03 UTC 26 August) as a devastating Saffir-Simpson category (CAT) 4 TC (Saffir 1973; Simpson, 1974). Hurricane Harvey’s rapid intensification near landfall was due to a pre-existing very warm (~ 31°C), and well-mixed ocean temperature along the Texas Bight (Potter et al., 2019). They attributed the absence of cold ocean water in the shallow Texas Bight shelf enabled Hurricane Harvey to draw from this warm ocean energy source and rapidly intensified from CAT3 to CAT4 before landfall. The Harvey track moved back offshore on 29 August, and subsequently made a final landfall west of Cameron, Louisiana on 30 August while maintaining tropical storm strength (Figure 1). Harvey’s heavy precipitation caused wide spread severe flooding, especially in the Huston, Texas area. The extreme flooding was compounded by heavy precipitation, river overflow, and onshore ocean water surge (Valle-Levinson et al., 2020). In combination with Hurricane Harvey’s high winds and tornadoes (Wurman and Kosiba, 2018; Nowotarski et al., 2021), Harvey resulted in ~125 billion U.S. dollars of damage along the Texas and Louisiana coastal zone (National Hurricane Center, 2017).
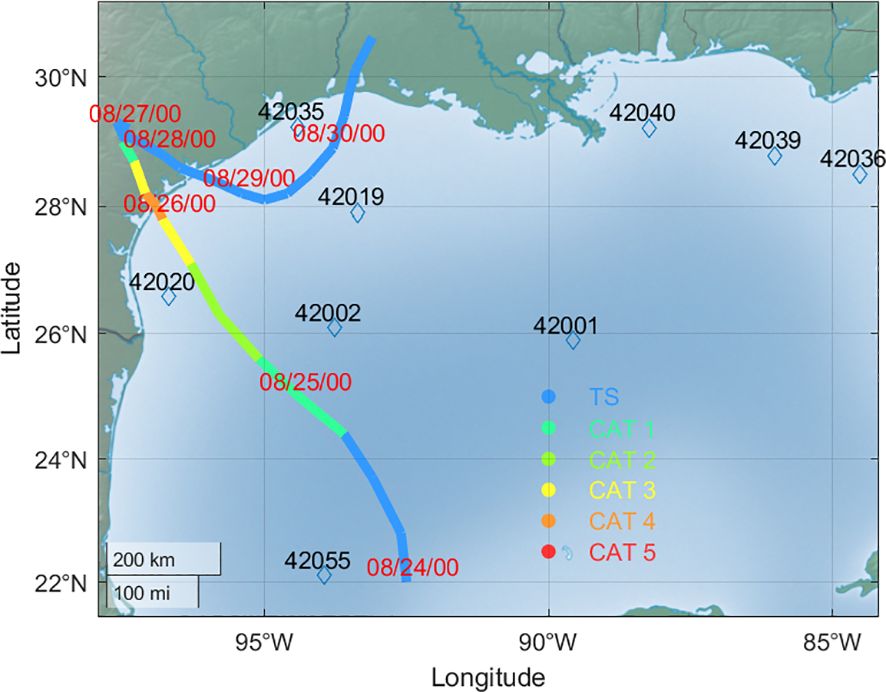
Figure 1 Hurricane Harvey’s best track from 00 UTC 24 August to 00 UTC 2 September 2017. The colors are Harvey’s intensities shown on the legend. Diamonds and 5-digit numbers are the NDBC buoy stations. The best track is from IBTrACS.
The coupled air-ocean-wave model used in this study is the Coupled Ocean/Atmosphere Mesoscale Prediction System (COAMPS, Chen et al., 2003; Chen et al., 2015; Allard et al., 2010). The coupled model configuration used in this study consists of the COAMPS atmospheric model for tropical cyclone (COAMPS-TC, Doyle et al., 2012), the Navy Coastal Ocean Model (NCOM, Martin et al., 2013), and the WAVEWATCH III (WW3) wave model (WW3DG, T.W.I.D.G, 2019). The coupling between the atmospheric model, NCOM, and WW3 is through the Earth System Modeling Framework NUOPC (Theurich et al., 2016) with a 12-minute coupling frequency.
COAMPS domains are configured focusing on the GOM region and the exchange of forcing and feedback are three-way, i.e., between air-ocean, air-wave, and ocean-wave, using exchange grids between each pair of component models (Campbell et al., 2010). The atmospheric model uses the COAMPS-TC physics suite but with three fixed domains with 36, 12, and 4 km horizontal grid spacing. The model forecast Harvey track and maximum wind speed (intensity) every 6 hours is determined by running a NOAA Geophysical Fluid Dynamics Laboratory (GFDL) tracker (Marchok, 2021). As for the ocean and wave forecast component models, NCOM is configured to use one domain with 6 km horizontal grid spacing and WW3 is also one domain with 12 km horizontal spacing. The WW3 model is setup to run with 34 frequencies from 0.0418 Hz with interval of 1.1 Hz and 48 directions.
Wave forcing to the atmospheric component model is by a sea-state dependent Charnock parameter (Charnock, 1955) which is computed in WW3 based on the Janssen (1991) wind-wave generation. Wave forcing to NCOM ocean model turbulent kinetic energy (TKE) includes, (a) in the coastal and offshore ocean region: Stokes drift currents from waves and the wave orbital motion near the ocean bottom (Allard et al., 2012; Smith et al., 2013), and (b) in the surf zone: the additional depth-dependent wave radiation stress to transfer the wave momentum from breaking waves to the ocean circulation (Martin et al., 2020). The atmospheric forcing in WW3 uses the 10 m wind speed, and NCOM forcing in WW3 are the sea surface height and surface currents (Allard et al., 2012; Chen et al., 2015). Atmospheric forcing to the ocean includes sea level pressure, 10 m wind stress, surface heat and moisture fluxes, and shortwave radiation. NCOM forcing to the atmosphere is by the sea surface temperature (Campbell et al., 2010).
Global model forecasts from the NOAA Global Forecasting System (GFS), NRL Global Ocean Forecasting System (GOFS 3.1; Metzger et al., 2010), and global WW3 provide the initial and lateral boundary conditions for COAMPS simulations. Additional to the GFS initial condition, a TC bogus is used to replace the GFS circulation in TC areas based on the JTWC warning message (Komaromi et al., 2021). Procedures to insert a TC bogus vortex into COAMPS-TC consist of several steps. Step 1 removes the GFS TC vortex winds. This is accomplished by removing the vorticity and divergence component of the GFS winds. Step 2 performs direct solver iteration to balance the pressure, non-divergent winds, and thermodynamics variables using a non-linear balancing equation and variational adjustment method (Barker, 1980). Step 3 computes a Rankin vortex (Holland et al., 2010) that uses the radius of maximum wind radius to build a sloping eyewall wind structure at the TC location from the JTWC warning message. The bogus vortex depth and structure of the secondary circulation are set empirically. Step 4 blends large-scale winds with the Rankin vortex. The final step 5 inserts the TC bogus vortex in nest 3 using a Barnes analysis scheme (Barnes, 1964).
Eight 5-day coupled COAMPS simulations for Hurricane Harvey are carried out from 12 UTC 24 to 00 UTC 30 August, 2017 cycling every 12-h using the Navy Coupled Ocean Data Assimilation (NCODA) for the ocean (Cummings and Smedstad, 2013) and wave component. NCODA assimilates ocean and wave observations from both satellite and in situ data sources.
Previous studies have shown assimilation of ocean observation improved air-ocean coupled COAMPS-TC intensity forecast (Sanabia et al., 2013; Chen et al., 2017). The current study uses a new wave assimilation method in NCODA. Three fully coupled air-ocean-wave COAMPS experiments are used to quantify wave assimilation impact on Harvey’s forecast. They include experiments without the ocean and wave assimilation (NDA), with the ocean assimilation only (ODA), and with the wave assimilation only (WDA). Experiment ODA assimilates surface and subsurface ocean temperature and salinity from buoys, floats, drifters, and satellite. The ODA also assimilates the Altimeter sea surface height observations. Experiment WDA only assimilates the 2D directional wave spectrum derived from buoys and altimeter significant wave height.
Two sources of wave field observations are assimilated in the COAMPS WW3 model and are described here:
Significant wave height (SWH) is defined as the average wave height (from trough to crest) of the highest third of the waves in a given sampling period. Satellite altimeters are the primary means of providing near-global measurements of SWH. The measurements are made at nadir along the satellite tracks with resolutions of 5 to 7 km. The standard algorithm for retrieving SWH from satellite altimeters fits a modeled shape to the radar echo waveforms from the sea surface and infers SWH from the shape and position of the leading edge of the waveform data. The altimeter SWH retrieval algorithms have difficulty deriving SWH in very low wave height environments and also near shore where radar reflections from land contaminate the signal. SWH is an integral wave parameter and can be derived from 2D directional wave spectra obtained from observations.
Spectral wave data are obtained from fixed buoys. For fixed buoys the wave measurements are inferred from the accelerometers or inclinometers on board the buoys that measure the heave acceleration or the vertical displacement of the buoy hull during the wave acquisition time. A Fast Fourier Transform (FFT) is applied to the data by the processor on board the buoy to transform the data from the temporal domain into the frequency domain. From this transformation wave energies with their associated frequencies are derived. A limitation of the fixed buoy network is that the buoys are primarily positioned in shelf and coastal areas and do not provide open-ocean directional wave observations. However, they provide valuable in situ observations to monitor and improve model initial ocean and wave conditions ahead and underneath the hurricanes. For the study, 13 NDBC buoys that observed sea surface temperature and wave spectrum are assimilated into NCODA (Figure 1).
NCODA uses a 3DVAR scheme to initialize the ocean model and a 2DVAR scheme to initialize the wave model. The implementation is based on a “weakly” coupled data assimilation approach whereby the coupled model is used to provide background information for separate ocean, atmosphere, and wave model analyses. The analysis increments generated from these separate analyses are then added back into the next cycle of coupled model background fields. The mismatch in time scales among the atmosphere, ocean, and wave models is a major difficulty as each of the models must use the same time window in the weakly coupled assimilation. We have taken the approach of using an appropriately short time window of 12 hours for all of the model components.
NCODA is an oceanographic implementation of the Navy Variational Atmospheric Data Assimilation System (NAVDAS), a 3DVAR technique developed for Navy numerical weather prediction systems (Daley and Barker, 2001). The 3DVAR analysis variables are temperature, salinity, geopotential (dynamic height), and u, v vector velocity components. All ocean variables are analyzed simultaneously in three dimensions. The horizontal correlations are multivariate in geopotential and velocity, thereby permitting adjustments to the mass fields to be correlated with adjustments to the flow fields. The velocity adjustments (or increments) are in geostrophic balance with the geopotential increments, which, in turn, are in hydrostatic agreement with the temperature and salinity increments. The NCODA 3DVAR problem is formulated in observation space as:
where xa is the analysis vector, xb is the background vector, Pb is the background error covariance matrix, H is the forward operator, R is the observation error covariance matrix, and y is the observation vector. HPbHT is approximated directly by the background error covariance between observation locations, and PbHT directly by the error covariance between observation and grid locations. The quantity [y-H(xb)] is referred to as the innovation vector, [y-H(xa)] is the residual vector, and xa-xb is the increment (or correction) vector.
The oceanographic error covariances in the 3DVAR are separated into a background error variance and a correlation. The correlation is further separated into a horizontal and a vertical component. Horizontal correlation length scales vary with location and vertical correlation length scales vary with location and depth. Flow-dependence is introduced by modifying the horizontal correlations with a tensor obtained from a model forecast background field that is used as a proxy for the circulation field. Example flow fields include sea surface height, sea surface temperature, and potential vorticity. The flow-dependent tensor spreads innovations along rather than across the flow field gradients, which is a desirable outcome in the analysis. The discontinuous and non-homogeneous influence of coastlines in the analysis uses a second tensor based on distance to land. Near the coast the tensor rotates and stretches the horizontal correlations along the coast while minimizing or removing correlations into the land. Error correlations are expected to be anisotropic near coastlines due to horizontal advection from coastal currents that flow parallel to the coast.
Assimilation of wave observations into the wave model component of the coupled system required several modifications to the 3DVAR. First, the wave model prognostic variable is wave energy as a function of location, direction, and frequency. As such, all analysis updates or corrections to the wave model must be done to the model forecast directional wave spectra at each model grid point. Second, the error covariances were modified to include not only correlations between observations and grid points but also correlations within wave spectra in terms of frequency and direction. Assimilation of integral measures of wave energy, such as altimeter SWH, is achieved in two steps. First, an analyzed SWH increment field is added to the WW3 SWH forecast (Hf) to produce a corrected SWH analysis field (Ha). The analyzed wave model spectrum (Fa) as a function of frequency (f) and direction (Θ) is then obtained from the ratio of analyzed and forecast SWH fields to produce an updated forecast spectrum (Ff) using a simple scaling strategy,
Assimilation of the NDBC buoy spectral wave data is more straightforward in that the observations measure the directional wave spectrum. However, the 2D wave data provided by the NDBC are in the form of the non-directional spectral wave density as a function of the frequency along with the normalized directional Fourier coefficients (r1, r2), the mean wave direction (alpha1) and the principal wave direction (alpha2) based on the Fourier series expansion originally developed by Longuet-Higgins et al. (1963). This required a modification to the H forward operator in the 3DVAR. For other data types, the forward operator is spatial interpolation performed in two or three dimensions by fitting a surface to a 4x4 or a 4x4x4 grid point target and evaluating the surface at the observation location.
Benoit (1992), (1994) describes the methods commonly used to reconstitute the directional wave spectra from the reported values. Of these, there are two main methods that are widely used: The maximum likelyhood method (MLM), which was developed and presented in detail by Oltman-Shay and Guza (1984), and the maximum entropy method (MEM) developed and presented in detail by Lygre and Krogstad (1986). Earle et al. (1999) show that while MEM provides better resolution, it produces artificially narrow directional spreading. For the purposes of this study, it was determined that the accuracy in directional spreading provided by MLM is more important than the resolution since the model resolution used is 7.5°, which is reasonable for this application, but not high enough to necessitate using MEL. Once the 2D spectral density is obtained from the values reported by the buoys, the observed spectra are compared to the model spectra using nearest neighbor. The differences in wave energy as a function of frequency and direction are computed which form the (y – H(xb)) innovations in the 3DVAR.
Buoys 42002, 42019, 42020, and 42035 have a minimum distance to Harvey’s track in GOM about 74, 57, 37, and 37 nm respectively during Harvey’s traverse toward Texas coast. Buoy 42002 and 42019 are located to the right of Harvey’s track and buoy 42020 is located to the left of the Harvey’s track (Figure 1). Interestingly because Harvey’s track moved back out to sea after the first landfall on 26 August, this movement put buoy 42035 to the right of Harvey’s track at this time before the first landfall, then switched to the left of the track after Harvey’s final landfall on 30 August. Buoys 42002, 42019, and 42020 all have high values of spectral wave density > 50 m2 Hz-1 around 25-26 August when these buoys were closest to the Harvey track. During this period, all three buoys exhibit a dominant wind-sea wave with range of wind speed (ms-1) of 10-27 ms-1 (1 ms-1 = 1.943844492 kt) mean wave period of 10-14s, and significant wave height of 3-7 m (top panel of Figures 2A–C). A research mooring south of Port Aransas at 20 m water depth recorded a 10 m significant wave height on 26 August, 2017 (Romero-Arteaga et al., 2022).
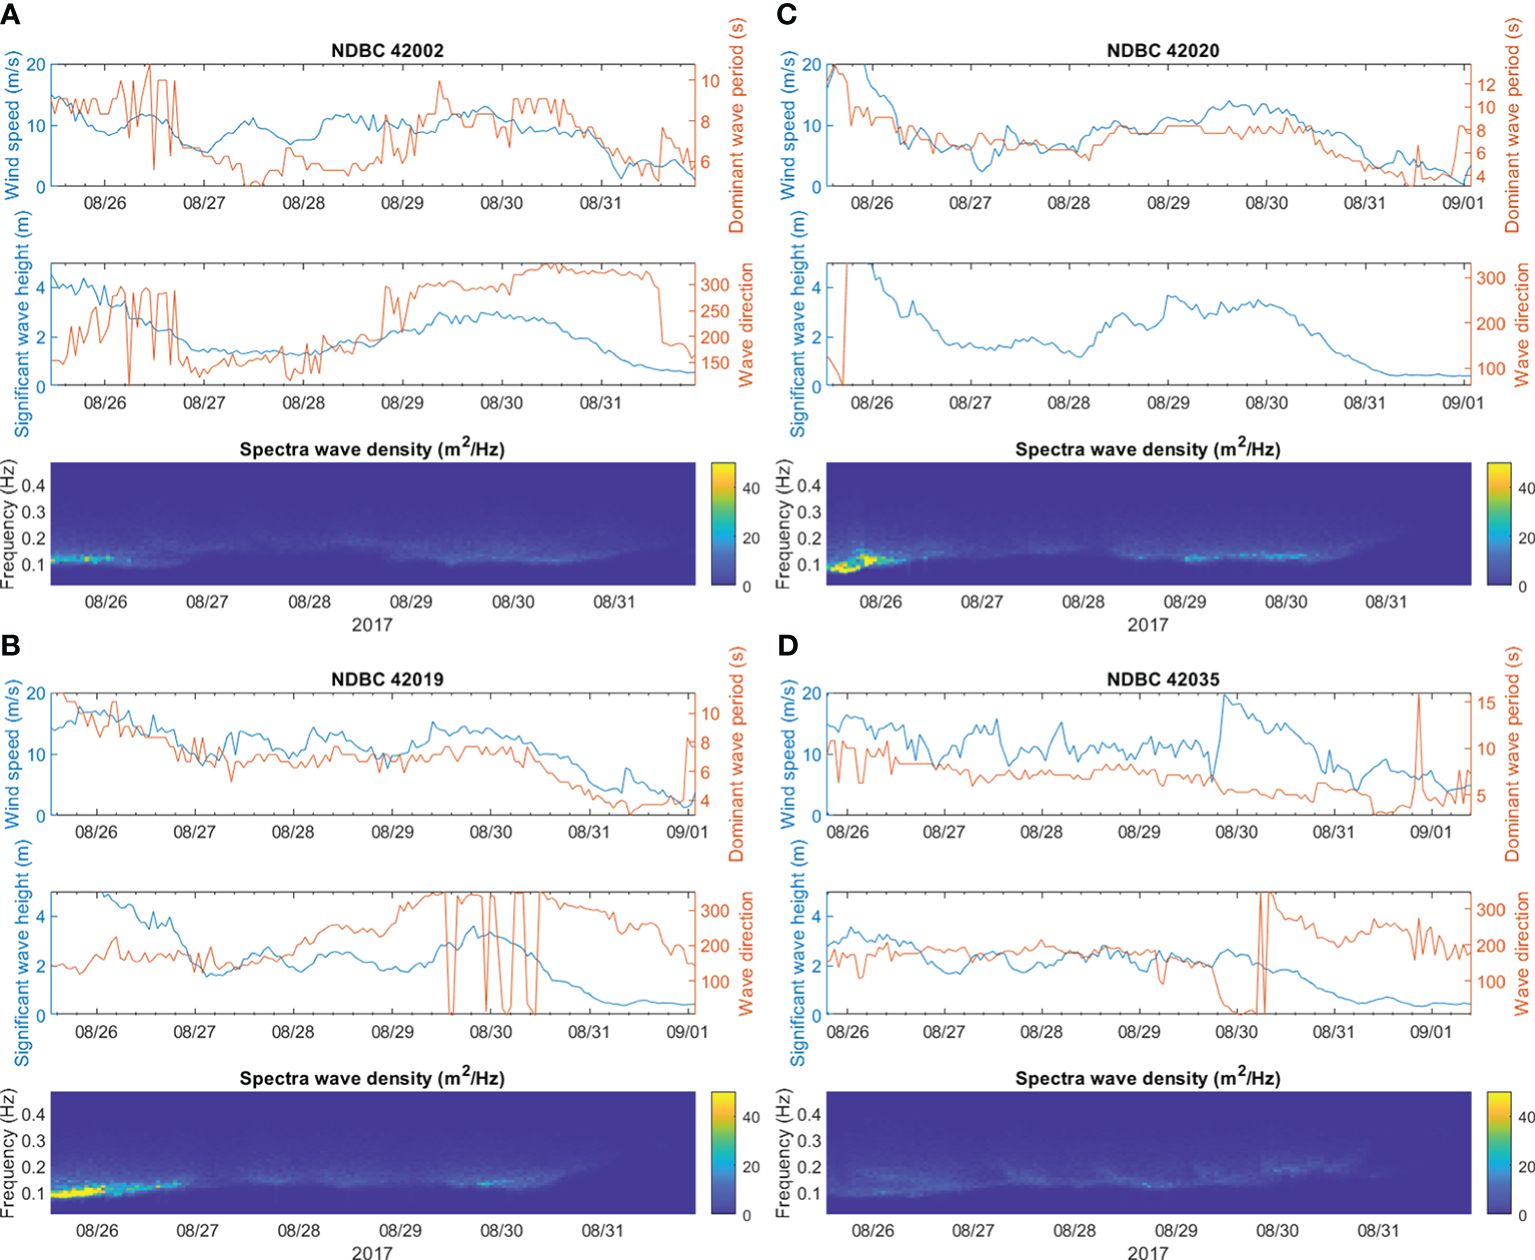
Figure 2 NDBC buoy observations from buoy (A) 42002, (B) 42019, (C) 42020, and (D) 42035. Top panel is the time series of buoy observed wind speed (m s-1, blue line), mean wave period (s-1, orange line), and significant wave height (m, black line). Bottom panel is the time series of spectra wave density (m2 Hz-1).
The significant wave height from buoy 42002 relaxes back down to around 5 m after the passage of Harvey between 27-28 August and has the signature of swell with mean wave period< 5 s. During this time, buoys 42019 and 42020 mean wave period are ~ 6-8 s, indicating a mixed wind and swell sea. All three buoys’ significant wave height and mean wave period increase again after Harvey’s track moved back out to the sea on 28 August. Compared to these three buoys, buoy 42035 experiences a lower wind speed range of 8-16 m s-1, mean wave period of 6-10 s, and 2-3 m significant wave height during 26-29 August (top panel of Figure 2D). The wind speed increases to 19 m s-1 but with receding significant wave height to 2 m and mean wave period ~ 7 s when Harvey’s track moved back out to sea. Buoy 42035 is located on the shallow Texas–Louisiana continental shelf and because the wind direction (middle panel of Figure 2D) during this time is northerly, prevents the high wave surge at this location. Buoy 42035 also has the lowest spectral wave density compared to the other three buoys (bottom panel of Figure 2D).
Figure 3 shows two 2D wave density spectra using MLM from buoys 42002 (3a) and 42020 (3b) at 05 UTC (mid night Texaslocal time) 25 August when Harvey reached a CAT 4 intensity. The maximum 2D wave spectra density are 0.36 and 0.68 m2 Hz-1, respectively and located on the front-right quadrant (0° points to north). The time series of mean 2D wave density spectra for all frequencies from these four buoys show four separate periods of 2D wave spectra density (m2 Hz-1 degree-1) on 25-26 August, 27-28 August, 28-29 August, and 30 August–1 September (Figure 4). All four buoys show a fully developed sea from all directions after 30 August and maximum 2D directional wave spectra density magnitudes at this time. They exhibit 1-3 2D directional wave spectra density maxima on the two front quadrants of Harvey before Harvey’s final landfall. The slow-down of Harvey’s track that turned back out to sea after the first landfall and subsequent landfalls reduced the wind intensity, hence the weaker 2D directional wave spectral density over two closest distance buoys 42019 and 42035. The furthest buoy from Harvey’s track is 42002, which has the largest 2D directional wave spectral density. For the earlier three time periods, waves from all four buoys show their maximum 2D directional wave spectral density rotate from Harvey’s front left quadrant to rear-right quadrant. Additionally, buoy 42035 (Figure 4D) has the smallest 2D directional wave spectral density compared to the other three buoys (Figures 4A–C).
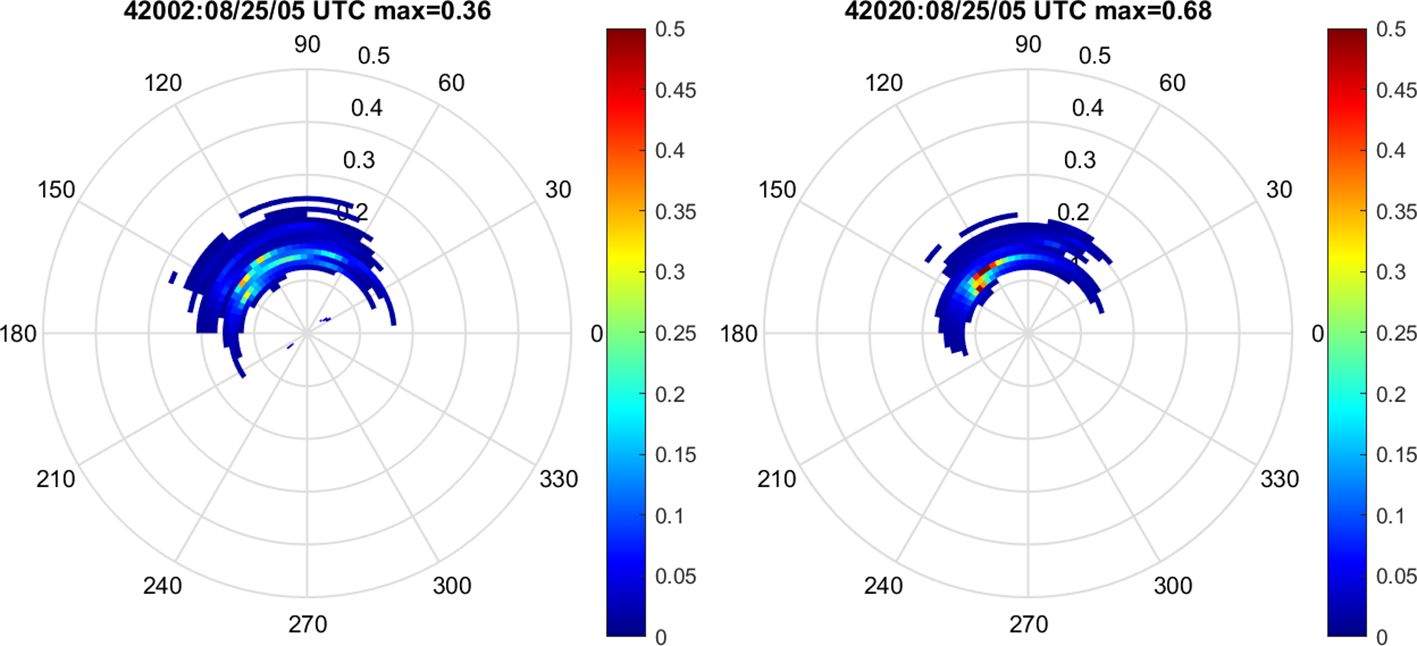
Figure 3 Buoy 42002 and 42020 2D directional wave spectral density (m2 Hz-1 degree-1) in polar coordinate on 05 UTC 25 August, 2017. At this time Hurricane Harvey reached a CAT 4 intensity. The 2D directional wave spectral density is derived from the buoy 1D spectral wave density using the MLM method.

Figure 4 Time series of mean spectral wave density (m2 Hz-1 degree-1) from buoy (A) 42002, (B) 42019), (C) 42020, and (D) 42035.
Three fully coupled air-ocean-wave COAMPS experiments are experiments without the ocean and wave assimilation (NDA), with the ocean assimilation only (ODA), and with wave assimilation only (WDA). Comparison of COAMPS forecast track from each experiment shows all three COAMPS experiments have a smaller track error over the ocean than after landfall (Figure 5). The best track is from the International Best Track Archive for Climate Stewardship (IBTrACS) version 4 (Knapp et al., 2018) which shows Harvey degraded to tropical storm after the last landfall and moved rapidly northeastward after 31 August. In contrast, the last 00 UTC 28 August COAMPS runs for all three experiments have a northward track and move much slower than the observation. The time series of mean absolute track error shows WDA (red line in Figure 6) is smaller for most of the forecast lead times. The 5-day mean absolute track error for experiments NDA, ODA, and WDA are 72.9, 73.2, and 69.1 nm, respectively. Assimilating wave data clearly improves COAMPS Harvey track forecast by a mean of ~ 3-4 nm compared to the no ocean and wave DA experiments (Table 2). The maximum reduction of absolute mean track error from WDA experiment is about ~ 9 nm (1 nm = 1.852 km), i.e., 50 nm compared to the NDA experiment’s 59 nm, at 66 h forecast time.
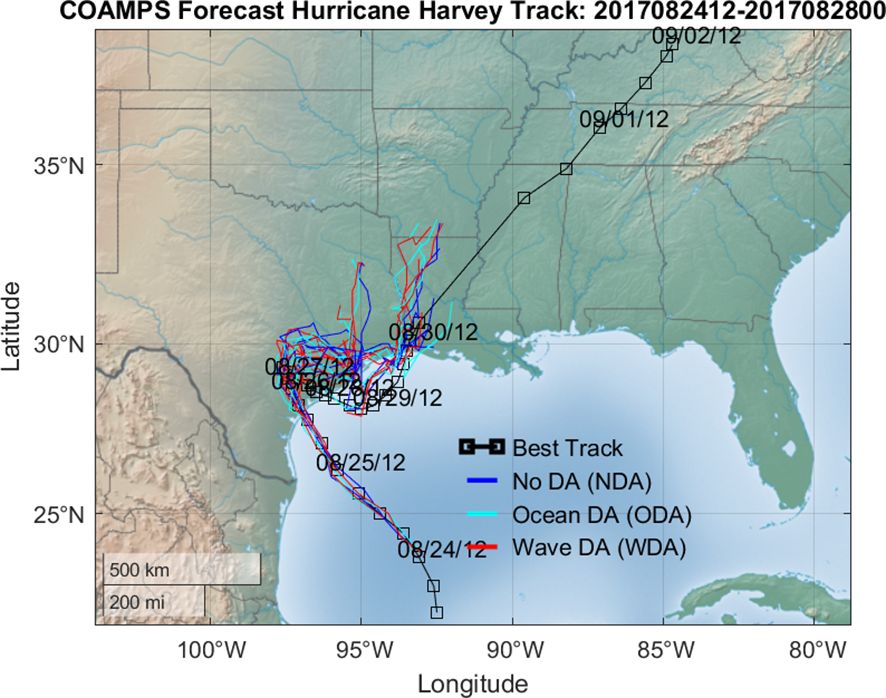
Figure 5 A spegettii plot of COAMPS Harvey forecast tracks from the NDA (blue lines), ODA (cyane lines), and OWDA (red lines) experiments. Harvey’s best track is shown in black line. The squares are the Harvey’s best track from IBTrACS maked at every 6 h interval.
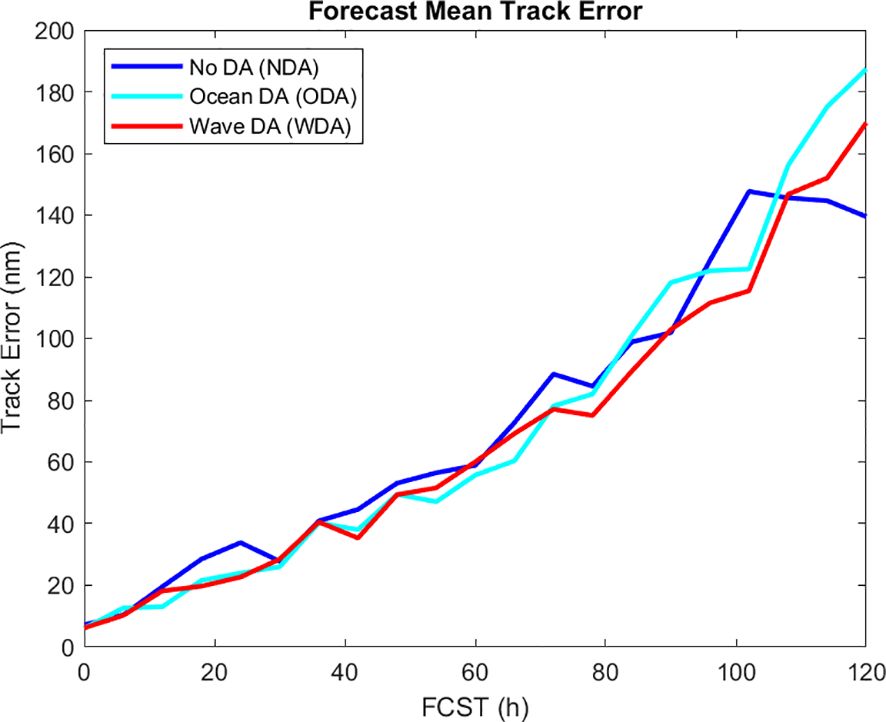
Figure 6 The 0-120 h time series of COAMPS forecast mean absolute track error (nm) from the NDA (blue line), ODA (cyan line), and WDA (red line) experiments. NDA is experiment without the ocean and wave assimilation, ODA is with the ocean assimilation only, and WDA is with the wave assimilation only.
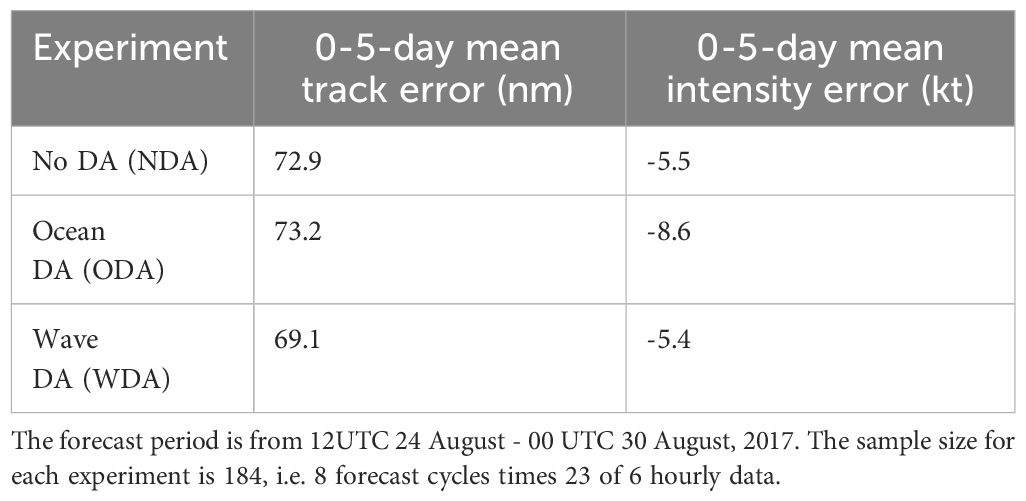
Table 2 COAMPS 0-5 day forecast mean track and intensity errors for each experiments.
Figure 7A is a spaghetti plot of forecast maximum wind speed (kt) that show all COAMPS experiments have a small low intensity bias compared to IBTrACS. The homogenous time series of mean intensity bias of WDA experiment is better than the NDA and ODA experiments except at the 20 h forecast lead time (Figure 7B). The WDA experiment also has the smallest mean 5-day intensity error of -5.4 kt compared to NDA and ODA experiments’ -5.5 and -8.6 kt, respectively (Table 2). Notably, the ODA experiment has the largest mean -18 kt low intensity bias for forecast lead time > 60 h after Harvey’s final landfall than the other two experiments. Assimilating the wave observations clearly improves the intensity forecast from assimilating ocean only observations for COAMPS Harvey forecast.
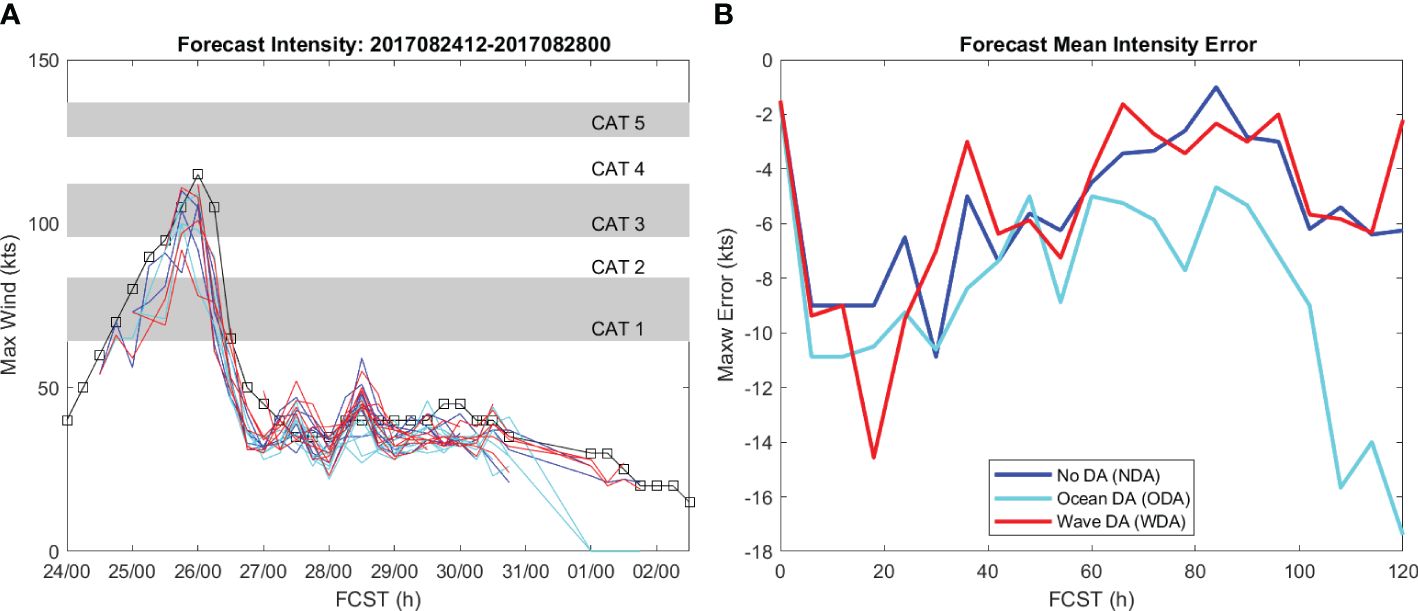
Figure 7 (A) A speghettii plot of COAMPS forecast maximum wind speed (kt) and (B) COAMPS forecast maximum wind speed bias compared to IBTtraACS.
Aside from the track position and intensity differences, the WDA minus NDA 10 m wind speed differences valid at Harvey’s first landfall on 03 UTC 26 August from four forecast cycles reveal alternate positive and negative difference patterns along forecast Harvey track (Figure 8 green and brown color shadings). These patterns are due to WDA having a slower translation speed than the NDA experiment. The significant wave height forecast differences show WDA with a persistently ~ 0.2 m higher wave height than NDA along the Mississippi Alabama coastal region. For longer lead time forecast cycles, WDA shows a larger/smaller wave height on the right/left of forecast track than NDA (Figures 8A–C). These along track forecast wave height difference patterns are due to slightly track differences and WDA possessing a larger right-asymmetry wind than NDA. However, for shorter forecast lead times (Figure 8D), the along track significant wave height is negligible.
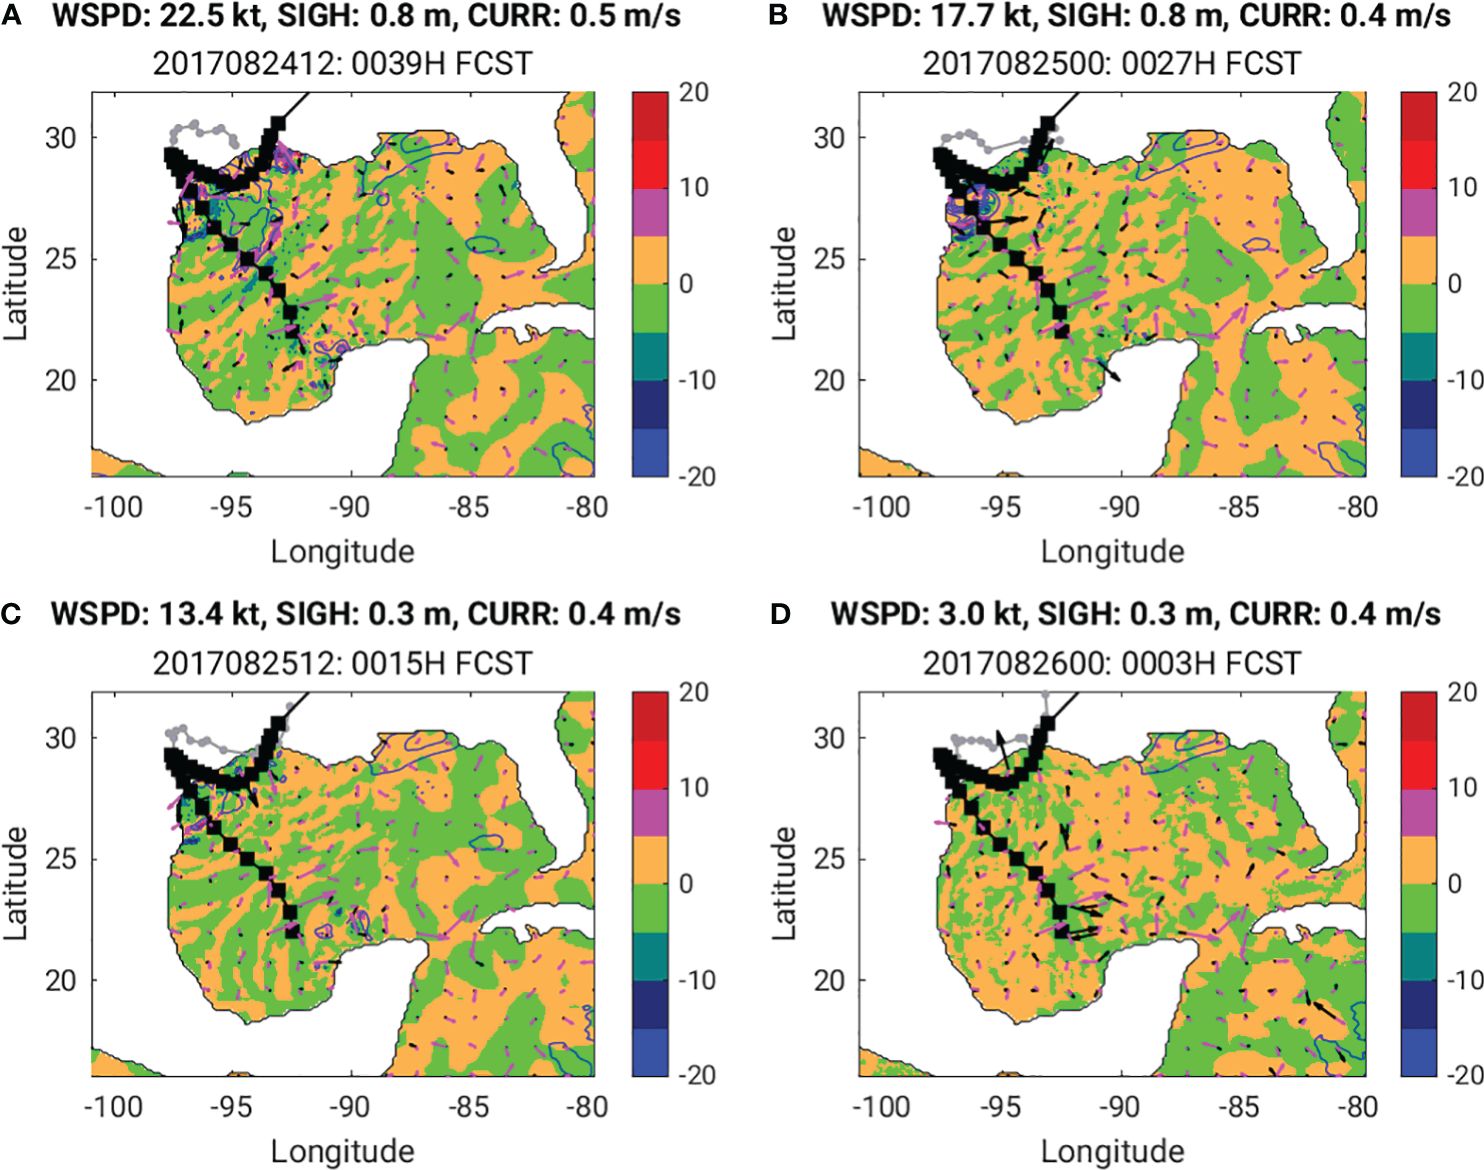
Figure 8 Maximum differences of COAMPS WDA minus NDA forecast validate at the Harvey’s first landfall time on 03 UTC 26 August, 2017. (A) 39 h forecast from the 12 UTC 24 August cycle, (B) 27 h forecast from the 00 UTC 25 August cycle, (C) 15 h forecast from the 12 UTC 25 August cycle, and (D) 3 h forecast from the 00 UTC 26 August cycle. Color shadings are the wind speed (WSPD) differences. Blue contours represent significant wave height (SIGH) differences with contour interval of 0.1 m. Solid blue lines are positive differences and dashed blue lines are negative differences. Black and magenta arrowers depict the maximum differences of COAMPS WDA minus NDA forecast wind speed and direction, and current speed (CURR) and direction, respectively. The maximum differences of wind & current vectors are shown on the title of each panel. Black-square line depicts Havey’s best track from IBTrACS and gray- dot line is the WDA forecast track.
The validation of COAMPS WW3 forecasts uses NDBC buoy observation of wave parameters that are not assimilated by NCODA. These are the significant wave height (m), mean wave direction (°) and absolute mean wave period (s). Note that NCODA uses buoy’s 2D directional wave spectral density to derive significant wave height for assimilation (see section 2.1). COAMPS WW3 0–120-hour forecasts of these three variables from each forecast cycle are first interpolated to the buoys 42002, 42019, 42020, and 42035 locations, then forecast bias error (forecast minus observation) and root mean square error (RMSE) are computed. COAMPS forecast time is valid at the observation time. The correlation is evaluated using each pair of forecast and observation time series at each buoy location. And lastly, The mean of the last 5 forecast cycles is computed to account for two DA cycling adjustment times for the NDA, ODA, and WDA experiments.
For the wave parameters evaluated, all experiments have a similar mean error trend and magnitude. The mean significant wave height bias for forecast lead times under 60 h is about -0.5 m and reduces to near 0 for longer lead forecast time greater than 60 h. By the end of 120 h, the mean bias becomes positive at about 0.2 m. The RMSE is less than 0.6 m for all forecast lead times (Figure 9). The mean wave direction bias oscillates between -20° to 20° with minimum and maximum RMSE of 10° and 90° (Figure 10). The mean absolute wave period bias is less than 0.5 s with RMSE between ~ 0.5-1.0 s (Figure 11). The mean absolute error difference between WDA minus NDA and WDA minus ODA experiments show the ODA experiment is as good as or better than the WDA assimilation. They both reduced the forecast error for all three wave variables evaluated here compared to the NDA experiment. However, the mean correlation of WDA is higher than ODA for significant wave height and absolute wave period but not for the wave direction (Figure 12). The mean correlation of significant wave height and mean wave period from all three experiments are larger than 0.5. But the mean wave direction correlation for all 3 experiments is lower than 0.5 with correlation of 0.34, 0.39, and 0.35 for the NDA, ODA, and WDA, respectively, A plausible cause of lower wave direction correlation of WDA than ODA may be due to MLM tendency to over broaden the 2D wave direction (Donelan et al., 2015).
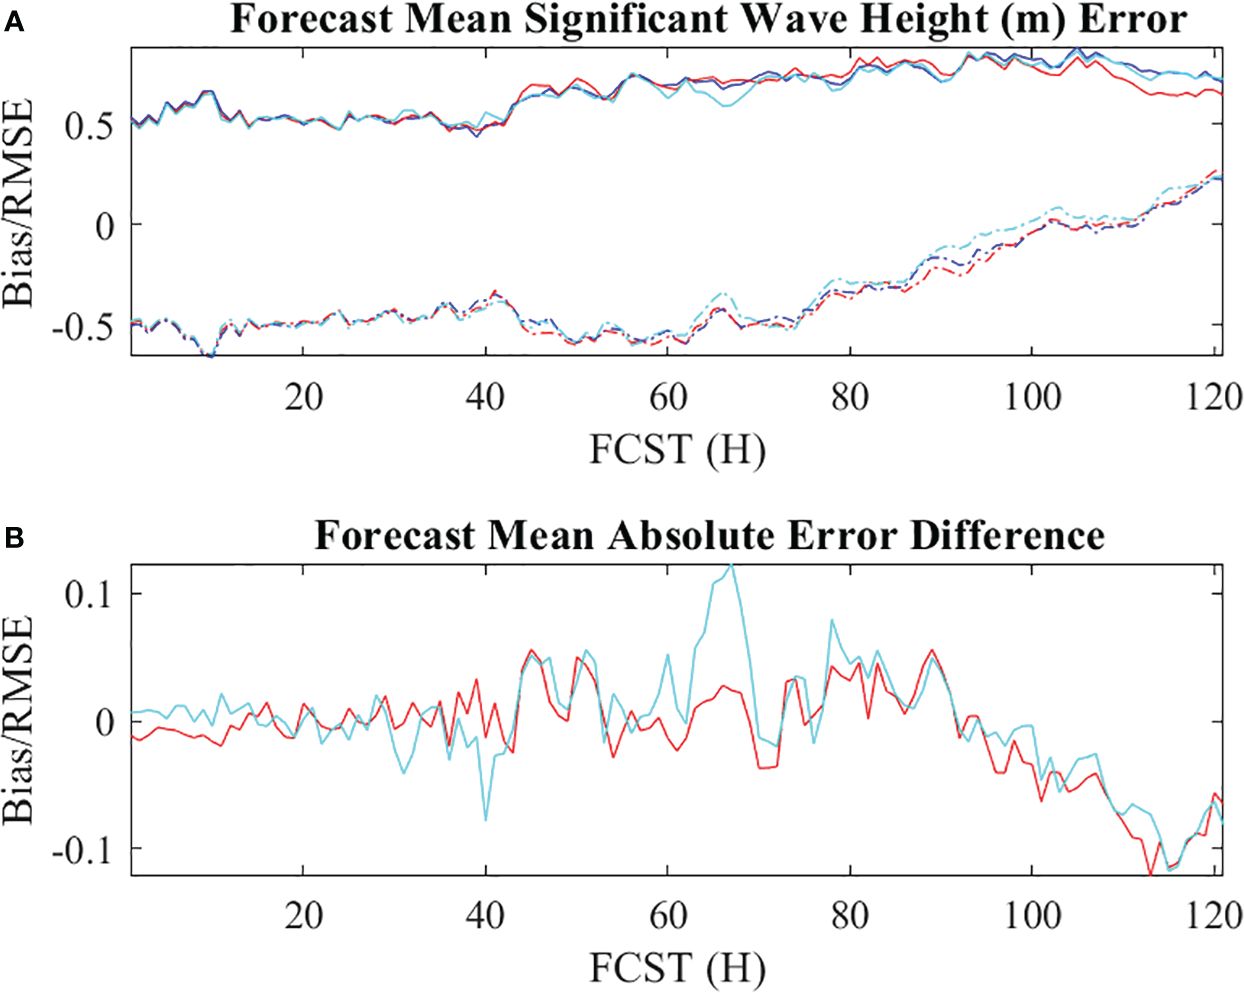
Figure 9 Time series of forecast mean (A) significant wave height (m) bias (dash lines) and RMSE (solid lines), and (B) mean absolute error differences between the WDA minus NDA (red line) and WDA minus ODA (cyne line) experiments. The blue, cyane, and red lines in (A) are from the NDA, ODA, and WDA experiments, respectively. The station and forecast cycles mean is computed at buoys 40002, 42019, 42020, and 42035 locations.
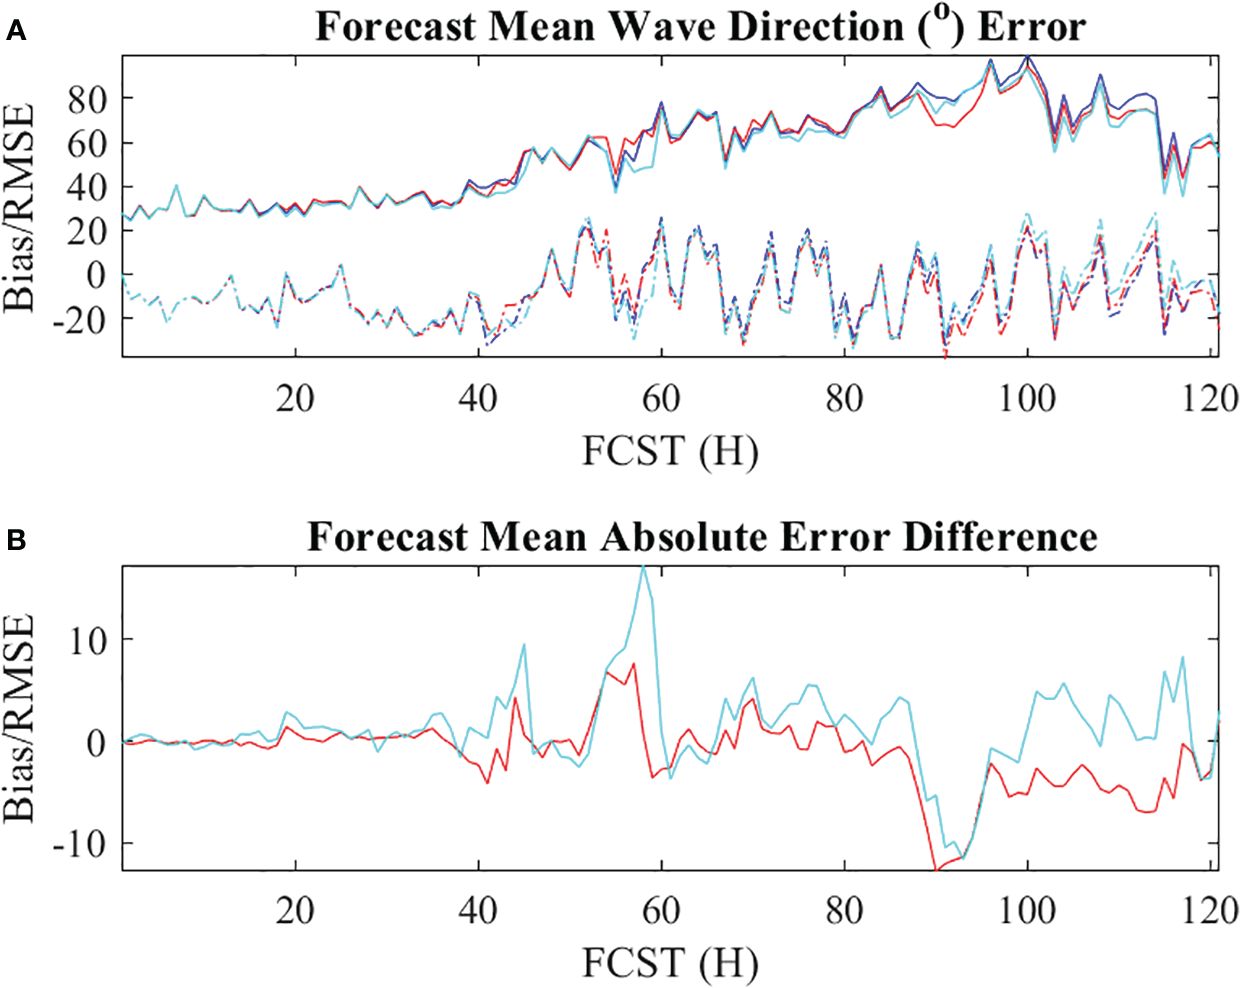
Figure 10 Time series of forecast mean (A) wave directional (°) bias (dash lines) and RMSE (solid lines), and (B) mean absolute error differences between the WDA minus NDA (red line) and WDA minus ODA (cyne line) experiments. The blue, cyane, and red lines in (A) are from the NDA, ODA, and WDA experiments, respectively. The station and forecast cycles mean is computed at buoys 40002, 42019, 42020, and 42035 locations.

Figure 11 Time series of forecast mean (A) absolute wave period (s) (dash lines) and RMSE (solid lines), and (B) mean absolute error differences between the WDA minus NDA (red line) and WDA minus ODA (cyne line) experiments. The blue, cyane, and red lines in (A) are from the NDA, ODA, and WDA experiments, respectively. The station and forecast cycles mean is computed at buoys 40002, 42019, 42020, and 42035 locations.
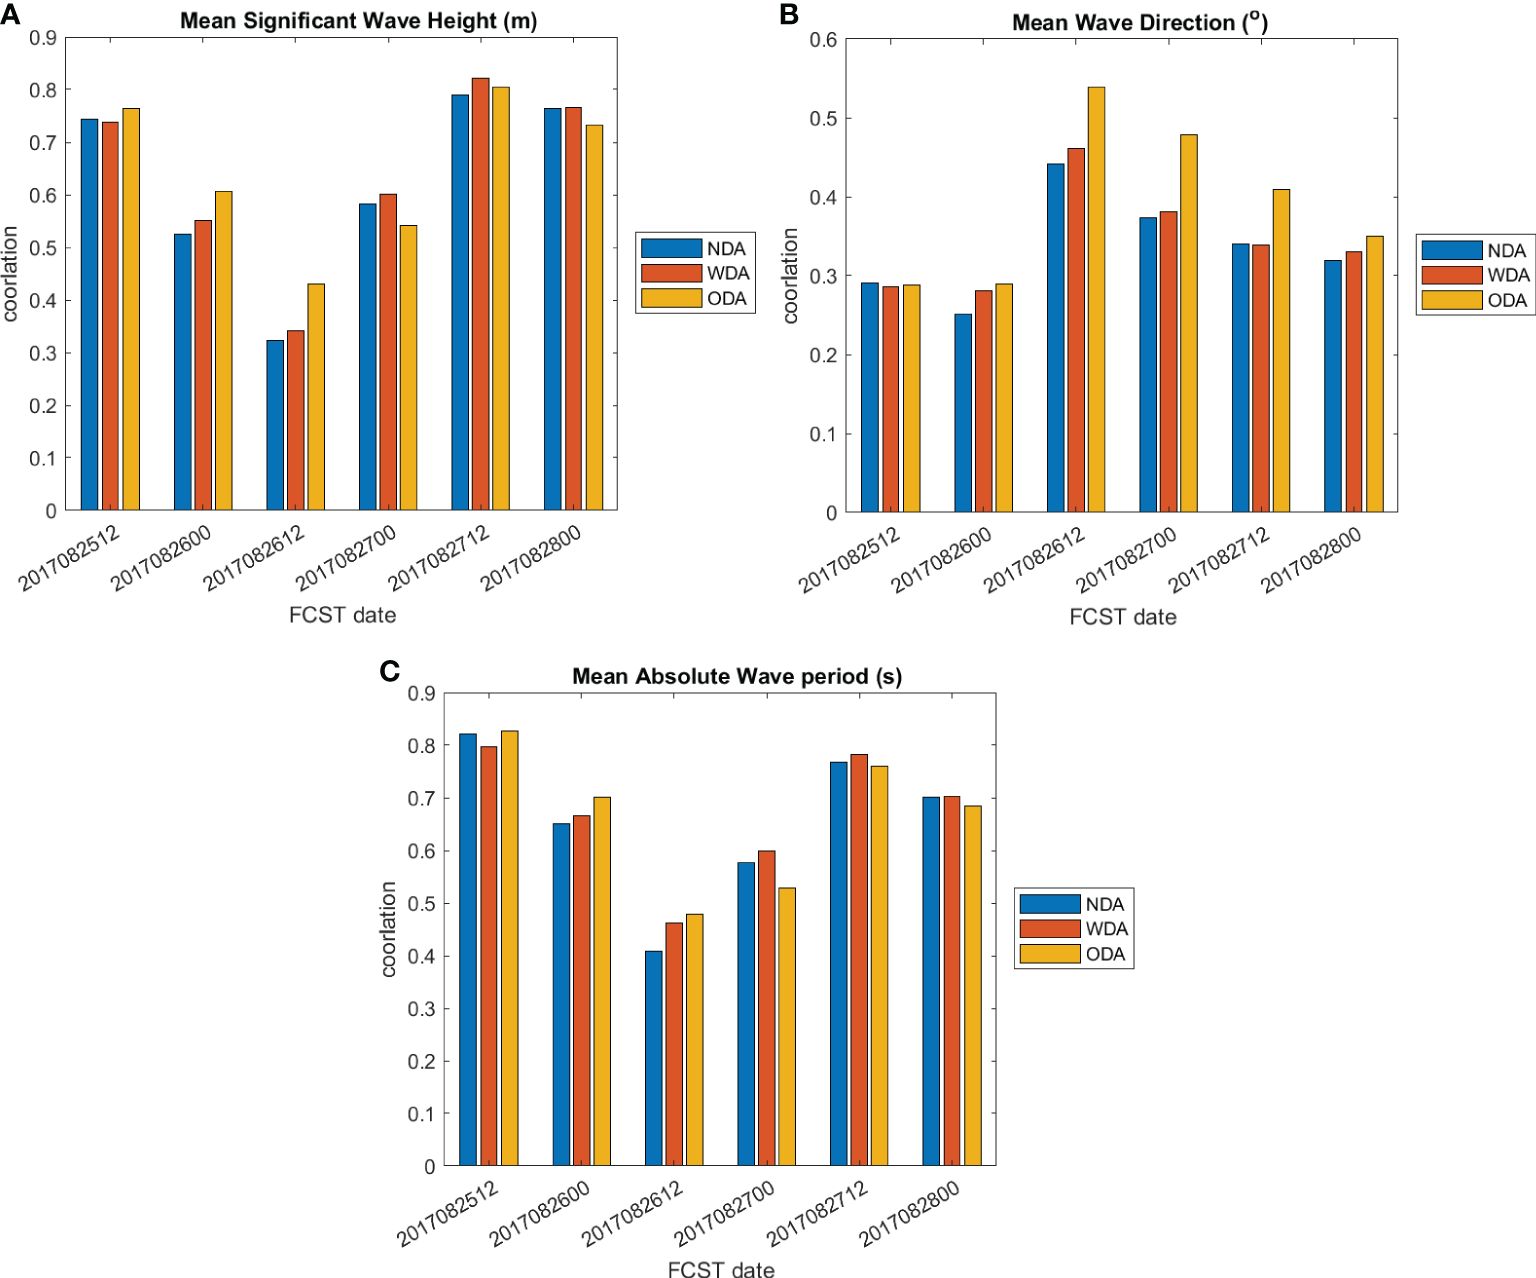
Figure 12 The mean correlation of forecast and buoy observed time series for (A) significant wave height (m), (B) mean wave direction (°), and (C) mean absolute wave period (s). The forecast cycle is from 12 UTC 25 August to 00 UTC 28 August, 2017.
The impact of 2D directional wave spectral density assimilation for Hurricane Harvey forecasts is quantified using a fully coupled air-ocean-wave tropical cyclone model COAMPS. A 3DVAR wave assimilation method is developed in COAMPS ocean data assimilation component NCODA that uses 1D wave spectral density observations from NOAA NDBC wave buoys and satellite altimeter significant wave height observation over GOM. The conversion from 1D to 2D directional wave spectral density is achieved using the MLM method. The NDBC buoy wave assimilation impact on the COAMPS Hurricane Harvey intensity, track, and wave forecasts sensitivity are quantified and validated using the IBTrACS and NDBC wave data for three air-ocean-wave coupled experiments with and without ocean or wave data assimilation.
Results show that over the ocean both the ocean only (ODA) and wave only (WDA) DA experiments improve the track forecast error for forecast lead times up to 4 days, compared to the no wave or ocean DA (NDA) experiment,. The 0-4 day mean absolute track error for NDA, ODA and WDA experiments are 56.1, 52.7, and 51.0 nm, respectively. The ocean DA or wave DA reduced the Harvey forecast absolute track bias by 3.4 and 5.1 nm, respectively. All three experiments have a low mean 0-120 h forecast lead time maximum wind speed errors ranging from ~ -2 to -18 m s-1. The ODA experiment has the highest mean maximum wind intensity error over land. Compared to NDA and ODA experiments, WDA experiment’s wave data assimilation has the smallest mean 0-5 day intensity bias of -5.4 kts but has the highest mean intensity bias while Harvey’s eye is over ocean. Between time periods of 12 UTC 24 August- 06 UTC 26 August and between 00 UTC 29 - 00UTC 30 August, the mean intensity errors from NDA, ODA, and OWDA experiments are -9.0, -9.3, and -15.3 kts respectively.
As for the mean wave forecast error validations at four NDBC buoy locations that are closest to the Harvey track, the mean significant wave height RMSE differences between ODA and WDA are less than 0.1 m. Compared to the 0-120 h COAMPS forecast time series with buoys, the mean 5-day forecast cycle correlations between forecast and buoy observations show that the ODA experiment has a slightly higher (0.01) correlation than the WDA experiment. All three experiments have significant wave height correlations greater than 0.5 with mean values of 0.62, 0.64, and 0.63 for the NDA, ODA, and WDA experiments, respectively. These COAMPS experiments also have mean correlations greater than 0.5 for the mean absolute wave period. The mean absolute wave period correlations for the NDA, ODA, and WDA experiments are 0.65, 0.66, and 0.67, respectively. However COAMPS forecast correlations of mean wave direction are low (< 0.5) for all three experiments. The mean wave direction correlations for the NDA, ODA, and WDA experiments are 0.34, 0.39, and 0.35, respectively.
Overall evaluation of wave DA impact on the fully air-ocean-wave coupled COAMPS Hurricane Harvey forecasts show that wave assimilation improved Harvey’s track and wind intensity forecasts compared to the NDA and ODA experiments. However, the wave DA experiment does not improve the correlation of mean wave direction suggesting possible limitation of using the MLM method to convert 1D wave spectral density observation from NDBC buoys to 2D directional wave spectral density. Donelan et al. (2015) shows MLM tends to broaden the wind direction compared to a wavelet method. To obtain a statistically significant evaluation of wave buoy assimilation impact on Hurricane track and intensity forecasts will require additional case studies to increase the sample size. However, it remains unclear how large a sample size is needed given fewer major hurricanes have made landfall along the U.S. Gulf coastal zone.
Recent advancements in Hurricane airborne targeted 2D directional wave spectral density observations such as from the Wide Swath Altimeter Radar (WSRA; Walsh et al., 2021), Directional Wave Spectra Drifter (DWSD; Centurioni et al., 2017), Surface Wave Instrument Float with Tracking (SWIFT; Thomson et al., 2019), and Air-Launched Autonomous Micro Observer (ALAMO; Sanabia and Jayne, 2020) float or satellite Synthetic Aperture Radar (SAR; Schuler et al., 2004) provide a new opportunity to directly assimilate the 2D directional wave spectral density and use a shorter wave data assimilation window for future hurricane wave research.
Improving the coastal landfall hurricane observation and forecast continue to be the forefront of several U.S. community efforts to strengthen the conduit between research and operation. These include the Coastal and Ocean Modeling Testbed program from the Integrated Ocean Observing System (IOOS; Joyce et al., 2019), the Southeastern Universities Research Association Coastal Ocean Observing and Predicting program (SCOOP; Nichols and Wright, 2020), NOAA Forecast Improvement Program (Gopalakishnan et al., 2021), and in situ observation of the tropical cyclone from the partnership of NOAA Advancing the Prediction of Hurricanes Experiment (APHEX) program and Office of the Naval Research Hurricane Rapid Intensification Departmental Research Initiative (Holbach et al., 2023). Further research on wave assimilation methods of 2D directional spectral wave density observations as well as forecast validation using a fully coupled air-ocean-wave tropical cyclone model such as COAMPS presented in this study are warranted to continue improving the coastal storm surge forecasts worldwide.
The raw data supporting the conclusions of this article will be made available by the authors, without undue reservation.
SC: Conceptualization, Data curation, Formal analysis, Funding acquisition, Investigation, Methodology, Project administration, Resources, Software, Supervision, Validation, Visualization, Writing – original draft, Writing – review & editing. JC: Data curation, Methodology, Software, Writing – review & editing. JV: Data curation, Methodology, Software, Writing – review & editing. JT: Formal analysis, Writing – review & editing.
The author(s) declare financial support was received for the research, authorship, and/or publication of this article. This research is supported by the Office of Navy Research (ONR) grant N0001417WX01401.
The computation resource is provided by the Department of Defense (DoD) High Performance Computing Modernization Program NRL-HPC 024 project. Dr. Tim Campbell is acknowledged for providing consultation on the selection of coupling extrapolation methods in COAMPS.
Author JC was employed by company Science Applications International Corporation.
The remaining authors declare that the research was conducted in the absence of any commercial or financial relationships that could be construed as a potential conflict of interest.
All claims expressed in this article are solely those of the authors and do not necessarily represent those of their affiliated organizations, or those of the publisher, the editors and the reviewers. Any product that may be evaluated in this article, or claim that may be made by its manufacturer, is not guaranteed or endorsed by the publisher.
Allard R. A., Campbell T. J., Smith T. S., Jensen T. G., Chen S., Cummings J. A., et al. (2010). Validation test report for the coupled ocean atmospheric mesoscale prediction system version 5.0 (Washington DC, U.S.A.: Naval Research Laboratory), 172. NRL/MR/7322-10-9283.
Allard R. A., Smith T., Jensen T. G., Chu P. Y., Rogers E., Campbell T., et al. (2012). Validation test report for the Coupled Ocean/Atmosphere Mesoscale Prediction System (COAMPS) version 5.0: ocean/wave component validation. (Washington DC, U.S.A.: Naval Research Laboratory), 91, NRL Memorandum Report NRL/MR/7320–12-9423.
Bannister R. N. (2017). A review of operational methods of variational and ensemble variational data assimilation. Q. J. R. Meteorol. Soc. 143 (703), 607–633. doi: 10.1002/qj.2982. ISSN: 1477870X.
Barker E. H. (1980). Solving for temperature using unnaturally latticed hydrostatic equations. Mon. Wea. Rev. 108, 1260–1268. doi: 10.1175/1520-0493(1980)108,1260:SFTUUL.2.0.CO;2
Barnes S. L. (1964). A technique for maximizing details in numerical weather map analysis. J. Appl. Meteorology Climatology 3, pp.396–pp.409. doi: 10.1175/1520-0450(1964)003<0396:ATFMDI>2.0.CO;2
Benoit M. (1994). Extensive comparison of directional wave analysis methods from gauge array data. In Proc. 2nd Int. Symp. on Ocean Wave Measurement and Analysis (ASCE), 740–754.
Benoit M. (1992). Practical comparative performance survey of methods used for estimating directional wave spectra from heave-pitch-roll data. Coast. Eng. 1992, 62–75. doi: 10.1061/9780872629332.005
Byrne D., Horsburgh K., Williams J. (2023). Variational data assimilation of sea surface height into a regional storm surge model: Benefits and limitations. J. Geo. Res. Ocean 16 (1), 1–14. doi: 10.1080/1755876X.2021.1884405
Campbell T., Allard R. R., Preller R., Smedstad L., Wallcraft A., Chen S., et al. (2010). Integrated modeling of the battlespace environment. Computing Sci. Eng. 12, 36–45. doi: 10.1109/MCSE.2010.78
Cangialosi J. P., Blake E., DeMaria M., Penny A., Latto A., Rappaport E., et al. (2020). Recent progress in tropical cyclone intensity forecasting at the National Hurricane Center. Weather Forecasting 35, 1913–1922. doi: 10.1175/WAF-D-20-0059.1
Centurioni L., Braasch L., Di Lauro E., Contestabile P., De Leo F., Casotti R., et al. (2017). A new strategic wave measurement station off Naples port main breakwater. Coast. Eng. Proc. 1, 36. doi: 10.9753/icce.v35.waves.36
Charnock H. (1955). Wind stress on a water surface. Quart. J. R. Meteor. Soc 81, 639–640. doi: 10.1002/qj.49708135027
Chen S., Cummings J., Doyle J. D., Hodur R. M., Holt T., Liou C. S., et al. (2003). COAMPS version 3 model description. (Washington DC, U.S.A.: Naval Research Laboratory), 143, NRL Report: NRL/PU/7500-04-448.
Chen S., Cummings J. A., Schmidt J. M., Sanabia E. R., Jayne S. R. (2017). Targeted ocean sampling guidance for tropical cyclones. J. Geo. Res. Ocean 122 (5), 3505–3518. doi: 10.1002/2017JC012727
Chen S., Gaberšek S., Doyle J. D., Cook J., Chu P., Allard P. R. A., et al. (2015). Validation test report for the Coupled Ocean/Atmosphere Mesoscale Prediction System (COAMPS) version 5.0: Air/Wave component validation (Washington DC, U.S.A.: Naval Research Laboratory), 68. NRL/MR/7322-10-9526.
Cummings J. A., Smedstad O. M. (2013). “Variational data assimilation for the global ocean,” in Data assimilation for atmospheric, oceanic and hydrologic applications, vol. II. (Springer Berlin Heidelberg, Berlin, Heidelberg), 303–343. Available at: https://link.springer.com/chapter/10.1007/978-3-642-35088-7_13.
Daley R., Barker E. (2001). NAVDAS: Formulation and diagnostics. Monthly Weather Rev. 129 (4), 869–883. doi: 10.1175/1520-0493(2001)129%3C0869:NFAD%3E2.0.CO;2"https://doi.org/10.1175/1520-0493(2001)129<0869:NFAD>2.0.CO;2
Donelan M. A., Babanin A., Sanina E., Chalikov D. (2015). A comparison of methods for estimating directional spectra of surface waves. J. Geophys. Res. Oceans 120, 5040–5053. doi: 10.1002/2015JC010808
Doyle J. D., Jin Y., Hodur R., Chen S., Jin H., Moskaitis J., et al. (2012). “Real-time tropical cyclone prediction using COAMPS-TC,” in Advances in geosciences, vol. 28 . Eds. Wu C.-C., Gan J. (World Scientific Publishing Company, Singapore), 15–28. doi: 10.1142/9789814405683_0002
Earle M. D., Steele K. E., Wang D. W. C. (1999). Use of advanced directional wave spectra analysis methods. Ocean Eng. 26, 1421–1434. doi: 10.1016/S0029-8018(99)00010-4
Fan Y., Lin S. J., Held I. M., Yu Z., Tolman H. L. (2012). Global ocean surface wave simulation using a coupled atmosphere–wave model. J. Climate 25, 6233–6252. doi: 10.1175/JCLI-D-11-00621.1
Gopalakishnan S., Upadhayay S., Jung Y., Marks F., Tallapragada V., Mehra A., et al. (2021). 2020 HFIP R&D activities summary: Recent results and operational implementation. doi: 10.25923/718e-6232
Hall C., Jensen R. E., Wang D. W. (2022). Performance evaluation of the newly operational NDBC 2.1-m hull. J. Atmospheric Oceanic Technol. 39, 861–880. doi: 10.1175/JTECH-D-21-0172.1
Heming J. T., Prates F., Bender M. A., Bowyer R., Cangialosi J., Caroff P., et al. (2019). Review of recent progress in tropical cyclone track forecasting and expression of uncertainties. Trop. Cyclone Res. Rev. 8 (4), 181–218. doi: 10.1016/j.tcrr.2020.01.001
Holbach H. M., Bousquet O., Bucci L., Chang P., Cione J., Ditchek S., et al. (2023). Recent advancements in aircraft and in situ observations of tropical cyclones. Trop. Cyclone Res. Rev. 12 (2), 81–99. doi: 10.1016/j.tcrr.2023.06.001
Holland G. J., Belanger J. I., Fritz A. (2010). A revised model for radial profiles of hurricane winds. Monthly weather Rev. 138, 4393–4401. doi: 10.1175/2010MWR3317.1
Houghton I. A., Penny S. G., Hegermiller C., Cesaretti M., Teicheira C., Smit P. B. (2023). Ensemble-based data assimilation of significant wave height from Sofar Spotters and satellite altimeters with a global operational wave model. Ocean Model. 183, 102200. doi: 10.1016/j.ocemod.2023.102200
Janssen P. A. (1991). Quasi-linear theory of wind-wave generation applied to wave forecasting. J. Phys. oceanography 21, 1631–1642. doi: 10.1175/1520-0485(1991)021%3C1631:QLTOWW%3E2.0.CO;2
Joyce B. R., Gonzalez-Lopez J., van der Westhuysen A. J., Yang D., Pringle W. J., Westerink J. J., et al. (2019). US IOOS coastal and ocean modeling testbed: Hurricane-induced winds, waves, and surge for deep ocean, reef-fringed islands in the Caribbean. J. Geophysical Research: Oceans 124, 2876–2907. doi: 10.1029/2018JC014687
Knapp K. R., Diamond H. J., Kossin J. P., Kruk M. C., Schreck C. J. (2018). International best track archive for climate stewardship (IBTrACS) project, version 4. [indicate subset used] (NOAA National Centers for Environmental Information). doi: 10.25921/82ty-9e16
Komaromi W. A., Reinecke P. A., Doyle J. D., Moskaitis J. R. (2021). The naval research laboratory’s coupled ocean–atmosphere mesoscale prediction system-tropical cyclone ensemble (COAMPS-TC ensemble). Weather Forecasting 36 (2), 499–517. doi: 10.1175/WAF-D-20-0038.1
Komen G. J., Cavaleri L., Donelan M., Hasselmann K., Hasselmann S., Janssen P., et al. (1994). Dynamics and modelling of ocean waves (Cambridge, UK: Cambridge University Press), 554. doi: 10.1017/CBO9780511628955
Kuik A. J., van Vledder G., Holthuijsen L. H. (1988). A method for the routine analysis of pitch-and-roll buoy wave data. J. Phys. Oceanogr. 18, 1020–1034. doi: 10.1175/1520-0485(1988)018,1020:AMFTRA.2.0.CO;2
Lionello P., Gunther H., Janssen P. A. (1992). Assimilation of altimeter data in a global third-generation wave model. J. Geophys. Res. Ocean 97 (C9), 14453–14474. doi: 10.1029/92jc01055
Longuet-Higgins M. S., Cartwright D. E., Smith N. D. (1963). “Observations of the directional spectrum of sea waves using the motions of a floating buoy,” in Ocean wave spectra (New Jersey, U.S.A.: Prentice-Hall), 111–136. Available at: http://www.jstor.org/stable/2414167.
Lygre A., Krogstad H. E. (1986). Maximum entropy estimation of the directional distribution in ocean wave spectra. J. Phys. Oceanography 16, 2052–2060. doi: 10.1175/1520-0485(1986)016<2052:MEEOTD>2.0.CO;2
Marchok T. (2021). Important factors in the tracking of tropical cyclones in operational models. J. Appl. Meteorology Climatology 60, 1265–1284. doi: 10.1175/JAMC-D-20-0175.1
Martin P. J., Edwards K. L., Veeramony J., Blain C. A., Campbell T. J. (2020). VTR for implementation of wave-ocean coupling in COAMPS in both the nearshore and offshore ocean. (Washington DC, U.S.A.: Naval Research Laboratory), 67. NRL Memorandum Report NRL/MR/7322–20-10176.
Martin P. J., Rogers E., Allard R. A., Dykes J. D., Hogan P. J. (2013). Tests of parameterized langmuir-circulation mixing in the ocean’s surface mixed layer. (Washington DC, U.S.A.: Naval Research Laboratory), 47. NRL Memorandum Report NRL/MR/7320–13-9444, Naval Research Laboratory, SSC, MS 39529.
Metzger E. J. H. E., Hurlburt X., Xu J. F., Shriver A. L., Gordon J., Sprintall R. D., et al. (2010). Simulated and observed circulation in the Indonesian Seas: 1/12 global HYCOM and the INSTANT observations. Dyn. Atmos. Ocean. 50, 275-300. doi: 10.1016/j.dynatmoce.2010.04.002
National Hurricane Center. (2017). Costliest U.S. tropical cyclone tables update. Available at: https://www.nhc.noaa.gov/news/UpdatedCostliest.pdf.
NDBC. (2009). Handbook of automated data quality control. Available at: https://www.ndbc.noaa.gov/publications/NDBCHandbookofAutomatedDataQualityControl2009.pdf.
Nichols C. R., Wright L. D. (2020). The evolution and outcomes of a collaborative testbed for predicting coastal threats. J. Mar. Sci. Eng. 8, 612. doi: 10.3390/jmse8080612
Nowotarski C. J., Spotts J., Edwards R., Overpeck S., Woodall G. R. (2021). Tornadoes in hurricane harvey. Weather Forecasting 36, 1589–1609. doi: 10.1175/WAF-D-20-0196.1
Oltman-Shay J., Guza R. T. (1984). A data-adaptive ocean wave directional-spectrum estimator for pitch and roll type measurements. J. Phys. Oceanography 14, 1800–1810. doi: 10.1175/1520-0485(1984)014<1800:ADAOWD>2.0.CO;2
Orzech M., Veeramony J., Flampouris S. (2014). Optimizing spectral wave estimates with adjoint-based sensitivity maps. Ocean Dynamics 64, 487–505. doi: 10.1007/s10236-014-0700-2
Potter H., DiMarco S. F., Knap A. H. (2019). Tropical cyclone heat potential and the rapid intensification of Hurricane Harvey in the Texas Bight. J. Geophysical Research: Oceans 124, 2440–2451. doi: 10.1029/2018JC014776
Riley R., Hall C., Stewart R., DiNapoli S., Wang D. W. (2019). “NDBC OWL wave system development,” in 2019 IEEE/OES twelfth current, waves and turbulence measurement (CWTM) (Virginia, U.S.A.: IEEE), 1–6. doi: 10.1109/CWTM43797.2019.8955248
Romero-Arteaga A., Ruiz de Alegría-Arzaburu A., Esquivel-Trava B. (2022). Spatial variability of surface waves and nearshore currents induced by hurricane harvey along the southern texas coast. J. Mar. Sci. Eng. 10, 1722. doi: 10.3390/jmse10111722
Saffir H. S. (1973). Hurricane wind and storm surge Vol. 65 (Virginia, U.S.A: The Military Engineer), 4–5.
Sanabia E. R., Barrett B., Black P. G., Chen S., Cummings J. A. (2013). Real-Time upper-ocean temperature observations from aircraft during operational hurricane reconnaissance missions: AXBT demonstration project year one results. Weather Forecasting 28, 1404–1422. doi: 10.1175/WAF-D-12-00107.1
Sanabia E. R., Jayne S. R. (2020). Ocean observations under two major hurricanes: Evolution of the response across the storm wakes. AGU Adv. 1, e2019AV000161. doi: 10.1029/2019AV000161
Saulter A. N., Bunney C., King R. R., Waters J. (2020). An application of NEMOVAR for regional wave model data assimilation. Front. Mar. Sci. 7. doi: 10.3389/fmars.2020.579834
Schuler D. L., Lee J. S., Kasilingam D., Pottier E. (2004). Measurement of ocean surface slopes and wave spectra using polarimetric SAR image data. Remote Sens. Environ. 91, 198–211. doi: 10.1016/j.rse.2004.03.008
Seemanth M., Remya P. G., Bhowmick S. A., Sharma R., Nair T. B., Kumar R., et al. (2021). Implementation of altimeter data assimilation on a regional wave forecasting system and its impact on wave and swell surge forecast in the Indian Ocean. Ocean Eng. 237, 109585. doi: 10.1016/j.oceaneng.2021.109585
Simpson R. H. (1974). The hurricane disaster—Potential scale. Weatherwise 27, 169–186. doi: 10.1080/00431672.1974.9931702
Smit P. B., Houghton I. A., Jordanova K., Portwood T., Shapiro E., Clark D., et al. (2021). Assimilation of significant wave height from distributed ocean wave sensors. Ocean Model. 159, 101738. doi: 10.1016/j.ocemod.2020.101738
Smith T. A., Chen S., Campbell T., Martin P., Rogers W. E., Gaberšek S., et al. (2013). Ocean-wave coupled modeling in COAMPS-TC: A study of hurricane ivan, (2004). Ocean Modelling 69, 181–194. doi: 10.1016/j.ocemod.2013.06.003
Theurich G., DeLuca C., Campbell T., Liu F., Saint K., Vertenstein M., et al. (2016). The earth system prediction suite: Toward a coordinated US modeling capability. Bull. Am. Meteorological Soc. 97, 1229–1247. doi: 10.1175/BAMS-D-14-00164.1
Thomson J., Moulton M., de Klerk A., Talbert J., Guerra M., Kastner S., et al. (2019). “A new version of the SWIFT platform for waves, currents, and turbulence in the ocean surface layer,” in 2019 IEEE/OES twelfth current, waves and turbulence measurement (CWTM) (New Jersey, U.S.A.: IEEE), 1–7. doi: 10.1109/CWTM43797.2019.8955299
Tran N., Vandemark D., Labroue S., Feng H., Chapron B., Tolman H. L., et al. (2010). Sea state biasin altimeter sea level estimates determined by combining wave model and satellite data. J. Geophys. Res. 115, C03020. doi: 10.1029/2009JC005534
Valle-Levinson A., Olabarrieta M., Heilman L. (2020). Compound flooding in Houston-Galveston Bay during Hurricane Harvey. Sci. Total Environ. 747, 141272. doi: 10.1016/j.scitotenv.2020.141272
Veeramony J., Walker D., Hsu L. (2010). A variational data assimilation system for nearshore applications of SWAN. Ocean Model. 35, 206–214. doi: 10.1016/j.ocemod.2010.07.008
Voorrips A. C., Makin V. K., Hasselmann S. (1997). Assimilation of wave spectra from pitch-and-roll buoys in a north sea wave model. J. Geophys. Res. C: Oceans 102 (C3), 5829–5849. doi: 10.1029/96JC03242. ISSN: 01480227
Walsh E. J., Fairall C. W., PopStefanija I. (2021). In the eye of the storm. J. Phys. Oceanography 51, 1835–1842. doi: 10.1175/JPO-D-20-0219.1
Wittmann P. A., Cummings J. A. (2004). “November. Assimilation of altimeter wave measurements into WAVEWATCH III,” in 8th international workshop on wave hindcasting and forecasting(Virginia, U.S.A.: U.S. Defense Technical Information Center), 14–19. Available at: https://apps.dtic.mil/sti/pdfs/ADA436548.pdf.
Wurman J., Kosiba K. (2018). The role of small-scale vortices in enhancing surface winds and damage in Hurricane Harvey, (2017). Monthly Weather Rev. 146, 713–722. doi: 10.1175/MWR-D-17-0327.1
WW3DG, T.W.I.D.G (2019). User manual and system documentation of Wavewatch III version 6.07. Available at: https://polar.ncep.noaa.gov/mmab/papers/tn276/MMAB_276.pdf.
Keywords: tropical cyclone, hurricane, wave data assimilation, coupled model prediction, air-sea interaction
Citation: Chen S, Cummings JA, Veeramony J and Tsu JS (2024) Tropical cyclone wave data assimilation impact on air-ocean-wave coupled Hurricane Harvey (2017) forecast. Front. Mar. Sci. 11:1332883. doi: 10.3389/fmars.2024.1332883
Received: 03 November 2023; Accepted: 02 April 2024;
Published: 01 May 2024.
Edited by:
Sudheer Joseph, Indian National Centre for Ocean Information Services, IndiaReviewed by:
Charles Reid Nichols, Marine Information Resources Corporation, United StatesCopyright © 2024 Chen, Cummings, Veeramony and Tsu. This is an open-access article distributed under the terms of the Creative Commons Attribution License (CC BY). The use, distribution or reproduction in other forums is permitted, provided the original author(s) and the copyright owner(s) are credited and that the original publication in this journal is cited, in accordance with accepted academic practice. No use, distribution or reproduction is permitted which does not comply with these terms.
*Correspondence: Sue Chen, c3VlLmNoZW5AbnJsbXJ5Lm5hdnkubWls
Disclaimer: All claims expressed in this article are solely those of the authors and do not necessarily represent those of their affiliated organizations, or those of the publisher, the editors and the reviewers. Any product that may be evaluated in this article or claim that may be made by its manufacturer is not guaranteed or endorsed by the publisher.
Research integrity at Frontiers
Learn more about the work of our research integrity team to safeguard the quality of each article we publish.