 Zhongming Huo
 Zixuan Wang1,2†
 Lei Fang
- 1College of Fisheries and Life Science, Dalian Ocean University, Dalian, China
- 2Engineering Research Center of Shellfish Culture and Breeding, College of Fisheries and Life Science, Dalian Ocean University, Dalian, China
- 3College of Marine Science and Environment, Dalian Ocean University, Dalian, China
Morphology of bivalves, a kind of quantitative character, is closely connected with the ecological and physiological behaviors of bivalves, including growth, survival, metabolism and reproduction. In this study, a multivariate statistical method was used to analyze seven indices for shell shape evaluation of Ruditaps philippinarum (R. philippinarum). Polymorphism of R. philippinarum shell shape across seven geographical populations from the southern and northern regions of China was revealed, and decisive effect of shell shape in determining the trait of weight was discussed. In total, three types of R. philippinarum shell shape were observed: globular, flat, and lateral-view round. The Laizhou (LZ) population from the north of China displayed an approximately globular shell shape, with a shell-width-to-shell-length ratio of 0.5496 and an ellipse index ventral view (EIV) value of 0.9543. The Lianjiang (LJ) population from the south of China displayed a flat shell shape, with a shell-width-to-shell-length ratio of 0.4044, an ellipse index lateral view (EIL) value of 1.2518, and an EIV value of 0.7063. The Zhangzidao (ZZD) population from the north of China displayed a lateral view round shell shape, with a shell-width-to-shell-length ratio of 0.7476 and a circle index lateral view (CIL) value of 0.7195. According to the results of principal component analysis (PCA), discriminant analysis and cluster analysis on shell shape parameters, LJ population and LZ population could be grouped separately. However, despite the long geographical distance, Rongcheng (RC) population was highly similar with ZZD population in terms of shell shape traits, implying that these two populations might be more closely related. Lowest degree of divergence in shell shape was observed in Beihai (BH) population and Yingkou (YK) population, both of which belonged to Zuidong (ZD) population. Weight of globular Manila clams was significantly higher than that of flat clams (P < 0.05). This study not only lays a foundation for conservation of R. philippinarum germplasm resources, but also highlights the importance of considering shell morphology in the breeding and culture of R. philippinarum.
1 Introduction
Morphology and size of organisms significantly influence their fitness attributes, including biomechanics, physiology, reproductive success, and behavioral patterns (Stanley, 1970; Gosling, 2003). These attributes have been extensively utilized in ecological and evolutionary research. In the context of bivalves, shell morphology has a notable diversity and complexity, which has been identified as a consequence of adaptive evolutionary processes (Lande and Arnold, 1983; Belonsky and Kennedy, 1988; Hamilton et al., 2020).
Development of statistical analysis methods and geometric morphometrics makes it possible to conveniently and effectively analyze the interrelationships as well as geometric characteristics between target independent and dependent variables (Adams et al., 2004; Morán et al., 2022). This statistical method has been widely used in aquaculture. Wu et al. (2011) used a multivariate analysis to investigate the shell morphology of Meretrix Linnaeus (distributed in China) and Meretrix lamarckii Deshayes (distributed in China and Japan), with an attempt to find the morphological divergence of the two species in China as well as to verify the species validities of M. lamarckii Deshayes in Japan. In addition, Costa et al. (2008) compared the morphological difference between Ruditapes philippinarum and Ruditapes decussatus coming from different geographical groups using elliptic Fourier analysis, and the results showed that there was an apparent morphological divergence between these two species. Moreover, Rufino et al. (2013) performed geometric morphometric methods (both landmark- and contour-based) to analyze the shell morphology of seven populations of the pod razor (Ensis siliqua) shell from Portugal, Spain, and Ireland, which confirmed the usefulness of geometric morphometric analyses for discerning differences in shell shape among populations of E. siliqua.
The Manila clam R. philippinarum belongs to the traditional group of four cultured bivalves. Being the most important artificially cultured shellfish in shallow tidal flats, its annual production reaches three million tons in China. The output of R. philippinarum accounts for more than 90% of the global production of cultured R. philippinarum and 20.9% of the output of cultured bivalves in China (Bureau of Fisheries, National Fisheries Technology Extension Center and China Society of Fisheries, 2023). It is the most commercialized shellfish in the world, and its production is the highest among all cultivated single bivalve species in China. However, R. philippinarum in China has suffered from overfishing and environmental damage, and their germplasm resources are in danger of being reduced or even extinct. Specifically, in the North Yellow Sea, certain native species of Manila clams have disappeared as biodiversity declines. Lacking a comprehensive investigation of native germplasm resources, the protection of R. philippinarum germplasm resources has become the bottleneck restricting the healthy and sustainable development of the Manila clam industry.
In China, the long and winding coastline provides ample germplasm resources and makes the largest globally native germplasm repository of R. philippinarum. Nevertheless, research on the genetic traits of R. philippinarum from different geographical populations is relatively rare. The morphological characteristics of the shell are essential indices for evaluating the R. philippinarum germplasm. Liu et al. (2021) summarized the research progress on the shell morphology diversity of shell populations in recent years. Zhang and Yan (2010) reported that, for R. philippinarum, perennial geographical isolation and adaptation to a local environment generated different geographical populations with distinct biological properties and shell shape. Moreover, Wang et al. (2022) analyzed the correlation between the shell morphology and weight traits of R. philippinarum from different geographical populations in Shandong Province of China.
This study selected prominent native R. philippinarum populations distributed in Southern China and Northern China as subjects for experimental investigation. Multivariate statistical analyses and path coefficient analyses were utilized to investigate the shell shape polymorphism among seven geographical populations as well as the correlation between shell shape and weight traits. The findings of this investigation contribute to the foundational knowledge necessary for the conservation of R. philippinarum germplasm resources conservation and the selective breeding of new varieties.
2 Materials and methods
2.1 Ethics statement
The Manila clams used in the present study were commercially cultured animals. All experiments were conducted following the recommendations in the Guide for the Care and Use of Laboratory Animals of the National Institutes of Health. All study protocols were approved by the Animal Ethics Committee of Dalian Ocean University (permit no.: DLOU2023008).
2.2 Sampling of the Manila clams from different geographical populations
Sampling of the Manila clams from seven geographical populations was performed from May 2016 to June 2016, and the sampling sites included Zhangzidao (Dalian, Liaoning), Yingkou (Liaoning), Zuidong (Luannan, Hebei), Laizhou (Yantai, Shandong), Rongcheng (Weihai, Shandong), Lianjiang (Fuzhou, Fujian), and Beihai (Guangxi), which are shown in Figure 1 and Table 1. A total of 250 Manila clams were collected from the subtidal zone covered with mud and sand (to ensure the accuracy of the experiment, all samples were natural populations and collected from areas which are not affected by the aquaculture of Manila clams). To minimize the geographical environment-conferred effects on shell shape and weight traits, all clams collected from different sites were then temporarily cultured on a floating raft in the same sea area for another 2 months. For each geographical population, 90 individuals with a shell length varying from 3 to 4 cm were randomly selected as the experimental materials. More detailed information for the sampling is listed in Table 1.
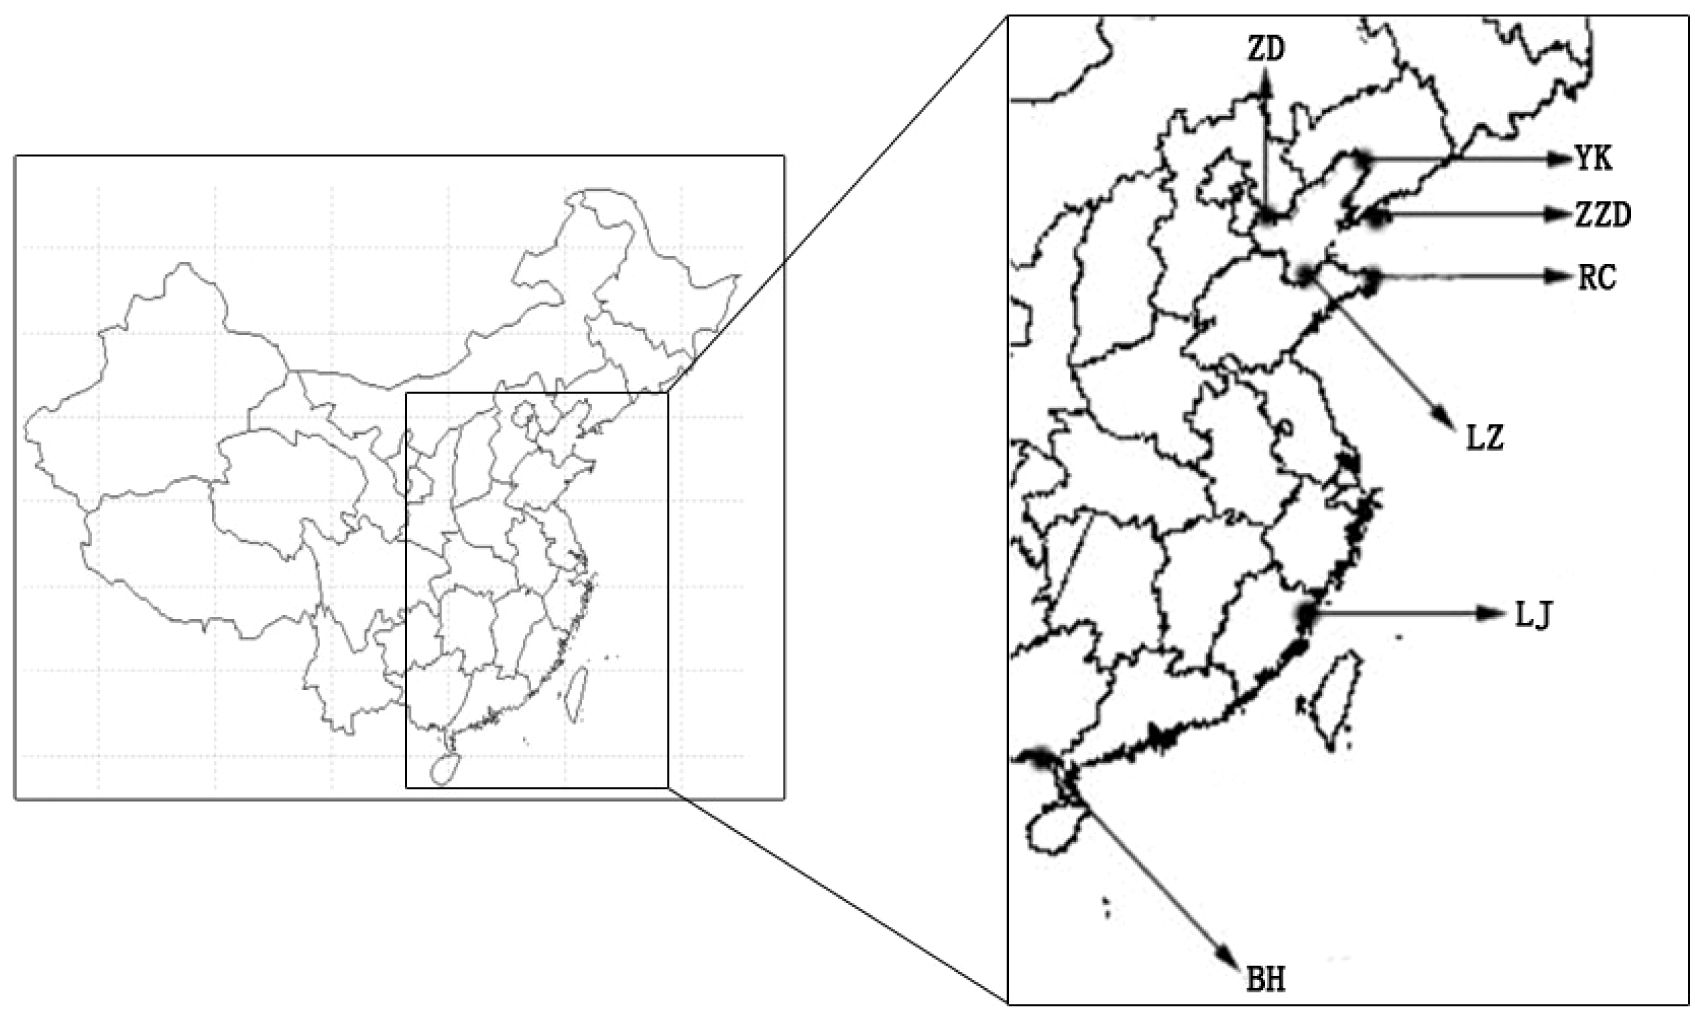
Figure 1 Geographic distribution of Ruditapes philippinarum (R. philippinarum) populations. This figure maps the locations of seven distinct geographical populations for investigation, highlighting the diverse habitats across which the species is spread.
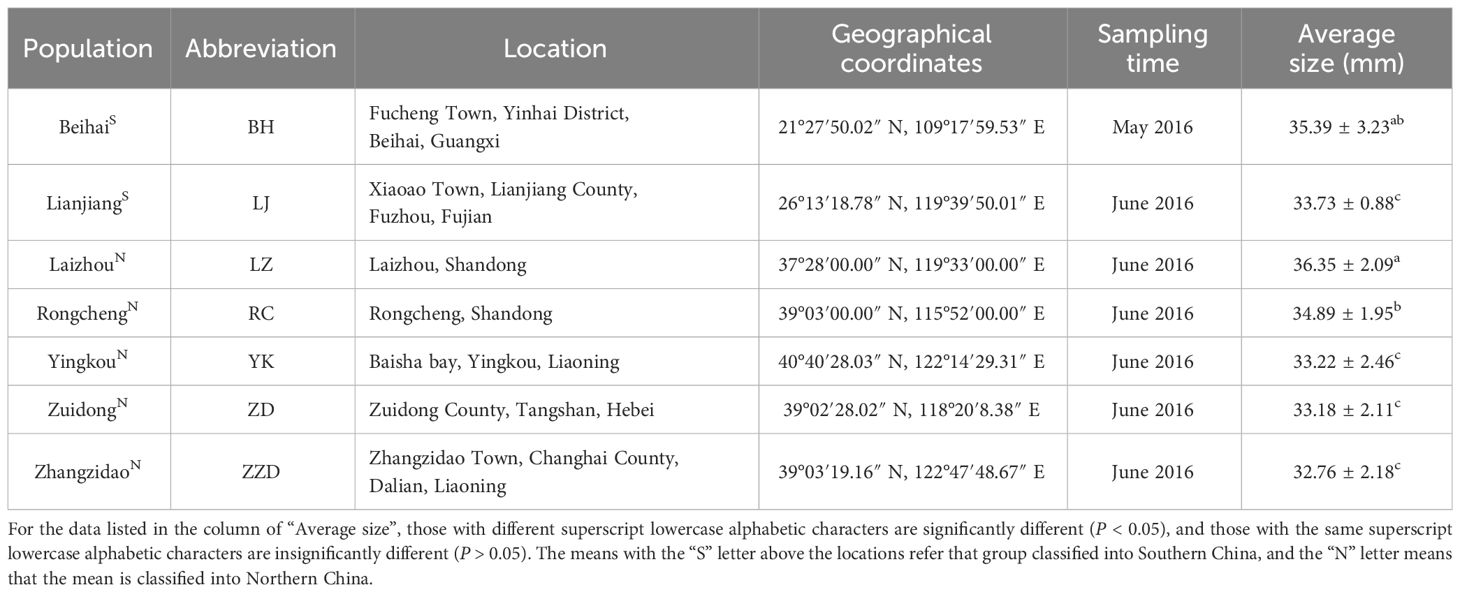
Table 1 Information on the seven populations of R. philippinarum sampled.
2.3 Methods of measurement and index calculation
The values of shell length (L), shell height (H), and shell width (W) were measured using an electrical Vernier caliper with an accuracy of 0.01 mm. The clams were placed on top of a white background to optimize the shell outline, and photographs of the left shell’s lateral and ventral sides were taken. For the above-mentioned photographs of the left shell, the two-dimensional projection area (AL) and circumference of the lateral side, two-dimensional projection area (AV) and circumference of the ventral side, as well as the length of the ventral side (LVent) were measured using Photoshop CC, with an accuracy up to 0.01 mm2 for the area and 0.01 mm for the length. The number of convex radial ribs on the left shell was regarded as the total number of radial ribs. To minimize size-related influences on morphological features, the measured size values were standardized using corresponding shell morphological indices (Palmer et al., 2004).
After drying the exterior surface of the clams with a filter paper, each clam’s live weight (TW) was determined using an electrical balance. Following the dissection of the surface-dried clams, the liquid contained within the pallial chamber was extracted. The weights of soft tissues (SOW) and shell (SW) were independently determined using an electrical balance with a precision of 0.01 g. For each clam, total volume (TV), shell volume (SV), and shell chamber volume (SCV) were examined according to the drainage method reported by Xu et al. (2007), with an accuracy of 0.01 mL. For the measurement of total volume and shell volume, an initial volume of fresh seawater was first injected into a measuring cylinder. The initial volume of seawater was adequate to submerge the clams or the shells, while the total volume of seawater containing clams or shells did not exceed the cylinder’s maximum capacity. Individual clams or shells were then put into the cylinder containing the initial volume of seawater, and the increment of the water volume was recorded as the clam’s total volume or shell volume, respectively. Shell chamber volume was the difference between the total volume and the shell volume.
The shell morphological indices used in this study included the compacity index (CPI), elongation index (EI), convexity index (CVI), circle index lateral view (CIL), circle index ventral view (CIV), reference ellipse index lateral view (EIL), and reference ellipse index ventral view (EIV). The calculation formulas for these indices are listed in Table 2. The ratio of shell width to shell length (W/L), the ratio of shell height to shell length (H/L), and the ratio of shell width to shell height (W/H) were used to represent the compacity index, elongation index, and convexity index, respectively. The circle index lateral view (CIL) and circle index ventral view (CIV) were also calculated as supplements to EI and CPI, respectively. The shell shape of different geological populations was determined by comparison. The closer the values of CIL and CIV are to 1, the closer the shell shape is to a sphere. The other two supplementary indices were the ellipse index lateral view (EIL) and the reference ellipse index ventral view (EIV), which served as a flat shell shape indicator. The smaller the values of EIL and EIV are, the closer the shell shape is to flat. Shells with the highest values of EI and CIL are defined with lateral view round.
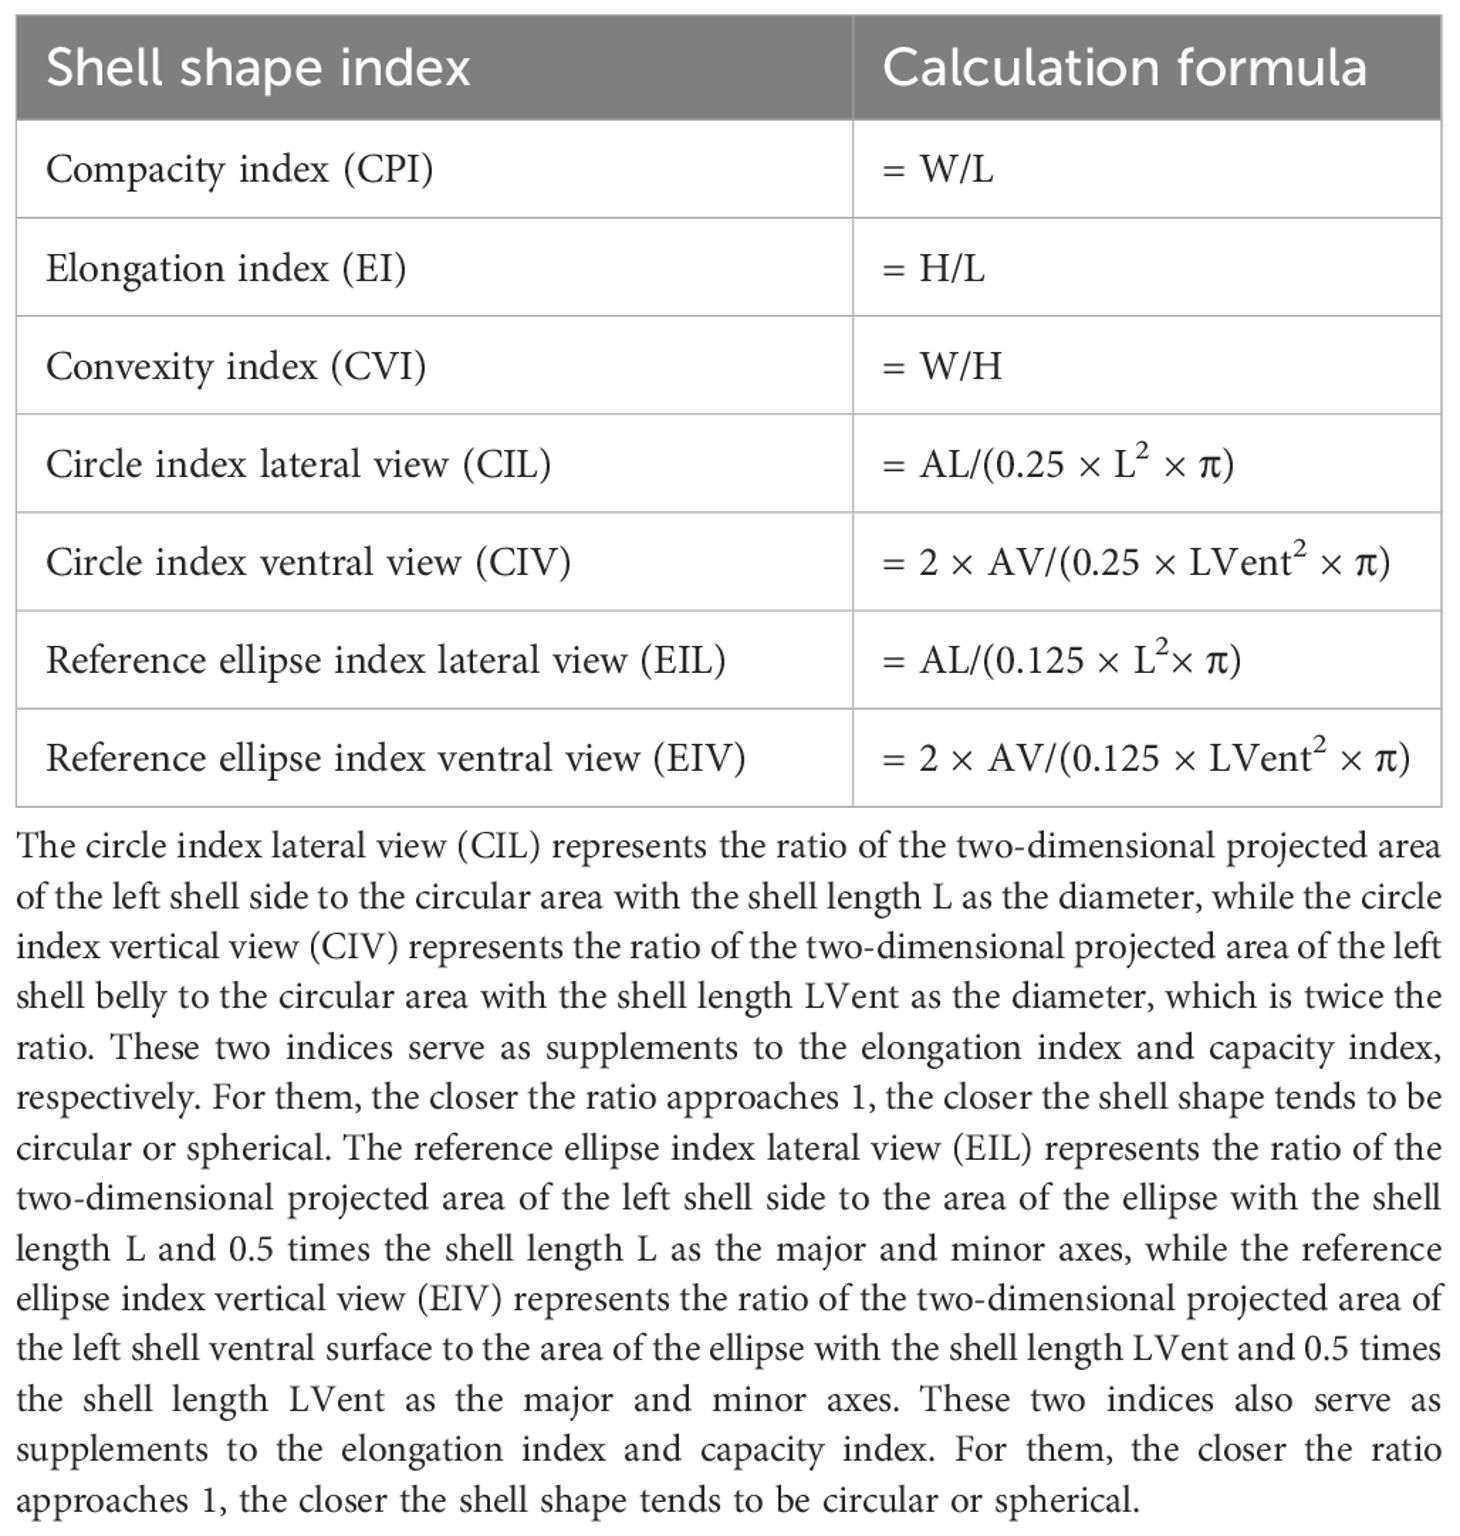
Table 2 Calculation formula for R. Philippinarum shell morphological indexes.
2.4 Data statistics and analysis
The shell morphological characters among different geographical populations of R. philippinarum were compared by analyzing the above-mentioned shell morphological indices listed in Table 2 using a multivariate analysis method. Principal component analysis (PCA) on the R. philippinarum populations was performed using the R software. The characteristic value (square of the standard error for each variable), the variance contribution rate, and the accumulative contribution rate were obtained for each principal component. Subsequently, a scatter plot was constructed based on the scores of each principal component to visualize the data distribution. Cluster analysis on the R. philippinarum populations was also conducted by utilizing the R software, and the Euclidean distances were calculated. The resulting Euclidean distance matrices were utilized to generate a heat map, and inter-cluster distances were calculated using Ward’s method. This analysis culminated in the construction of a dendrogram to illustrate the hierarchical relationships among populations. Discriminant analysis on the R. philippinarum populations was performed using the Fisher method. The function values derived from the first two discriminants were plotted on a scatter diagram for a visual interpretation of the discriminant analysis. Excel software was employed for a comprehensive statistical analysis of all experimental data. The R software was used to compute the mean values and standard deviations for each trait. The collected data were then analyzed for normal distribution using the Shapiro–Wilk test, followed by Tukey’s HSD for multiple comparisons and correlation analysis for exploring relationships between traits.
3 Results
3.1 Shell morphology and radial ribs number of R. philippinarum across different geographical populations
Based on the analysis of seven shell morphological indices, three distinct types of shell shapes were observed across the different geographical populations of R. philippinarum: flat, globular, and lateral-view round (Figure 2 and Table 3). In terms of the seven shell morphological indices, values of the Lianjiang (LJ) population were lower than those of the other six populations. The clams of the LJ population displayed a flat shell shape with CPI (W/L) of 0.4044, EIL of 1.2518, and EIV of 0.7063. In contrast, the Laizhou (LZ) population exhibited the highest values in terms of CPI, CVI, CIV, and EIV, with values of 0.55 ± 0.04, 0.75 ± 0.03, 0.48 ± 0.04, and 0.95 ± 0.10, respectively. These measurements suggest a globular shell shape for the LZ clams, as indicated by the maximal shell width. Similar shell morphology was noted in the Rongcheng (RC) population, with CPI (width/length) of 0.5060 and EIV of 0.9168, conforming to a globular shape as well. For the EI, CIL, and EIL values, the Zhangzidao (ZZD) population was the highest among the seven geographical populations, and all three values were close to 1. In a lateral view, the shell shape of the ZZD population was approximately round, with EI (H/L) of 0.75 and CIL of 0.72.
Figure 2 Variability in the shell morphology of R. philippinarum. The variation in shell shapes among R. philippinarum specimens is displayed, underscoring the phenotypic diversity within this species. R. philippinarum with globular (A), flat (B), lateral-view round (C) and elliptic (D) shapes of shell.
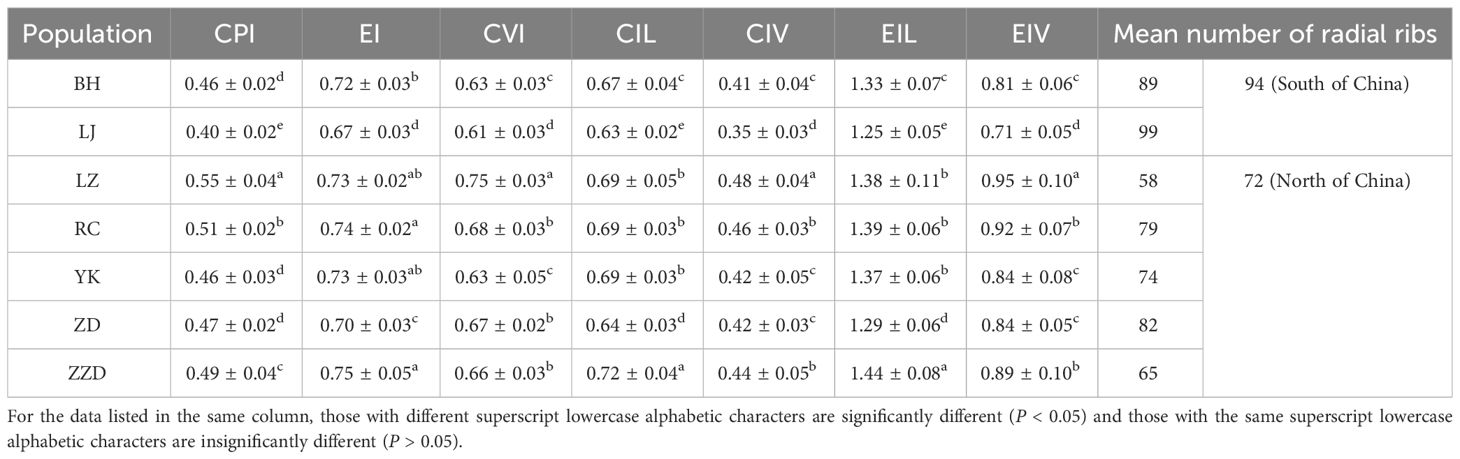
Table 3 R. philippinarum shell morphological indexes of different geographical populations.
A quantitative study of radial rib counts found that the average numbers observed in populations from Southern China were higher than those recorded in populations from Northern China. Notably, the LJ population had the highest mean radial rib count at 99, whereas the LZ group had the lowest mean count at 58 (Table 3).
3.2 Principal component analysis of shell morphological indices
According to the Scree plot, the criterion of eigenvalue greater than 1 and the cliff parallel analysis of 100 times of simulation (shown in the broken line), retaining the first two principal components could retain most information of the dataset (Figure 3). Therefore, for the PCA of the seven shell morphological indices of R. philippinarum, the first two principal components were selectively retained, whose contribution rates of variance were 70.46% and 16.17%, respectively (Table 4). With an accumulative contribution rate of variance of 86.63%, the first two principal components represent 86.63% of the shell morphological variance among the seven geographical populations of R. philippinarum. The first principal component could be mainly interpreted by CPI, CIV, and EIV, which reflect the correlation between shell width growth and shell length growth, the difference in the width of the ventral side of the shell, and whether the shell shape approaches globular, respectively. The second principal component could be mainly interpreted by EI, CIL, and EIL, which reflect the correlation between shell height growth and shell length elongation as well as the roundness of the lateral side of the shell.
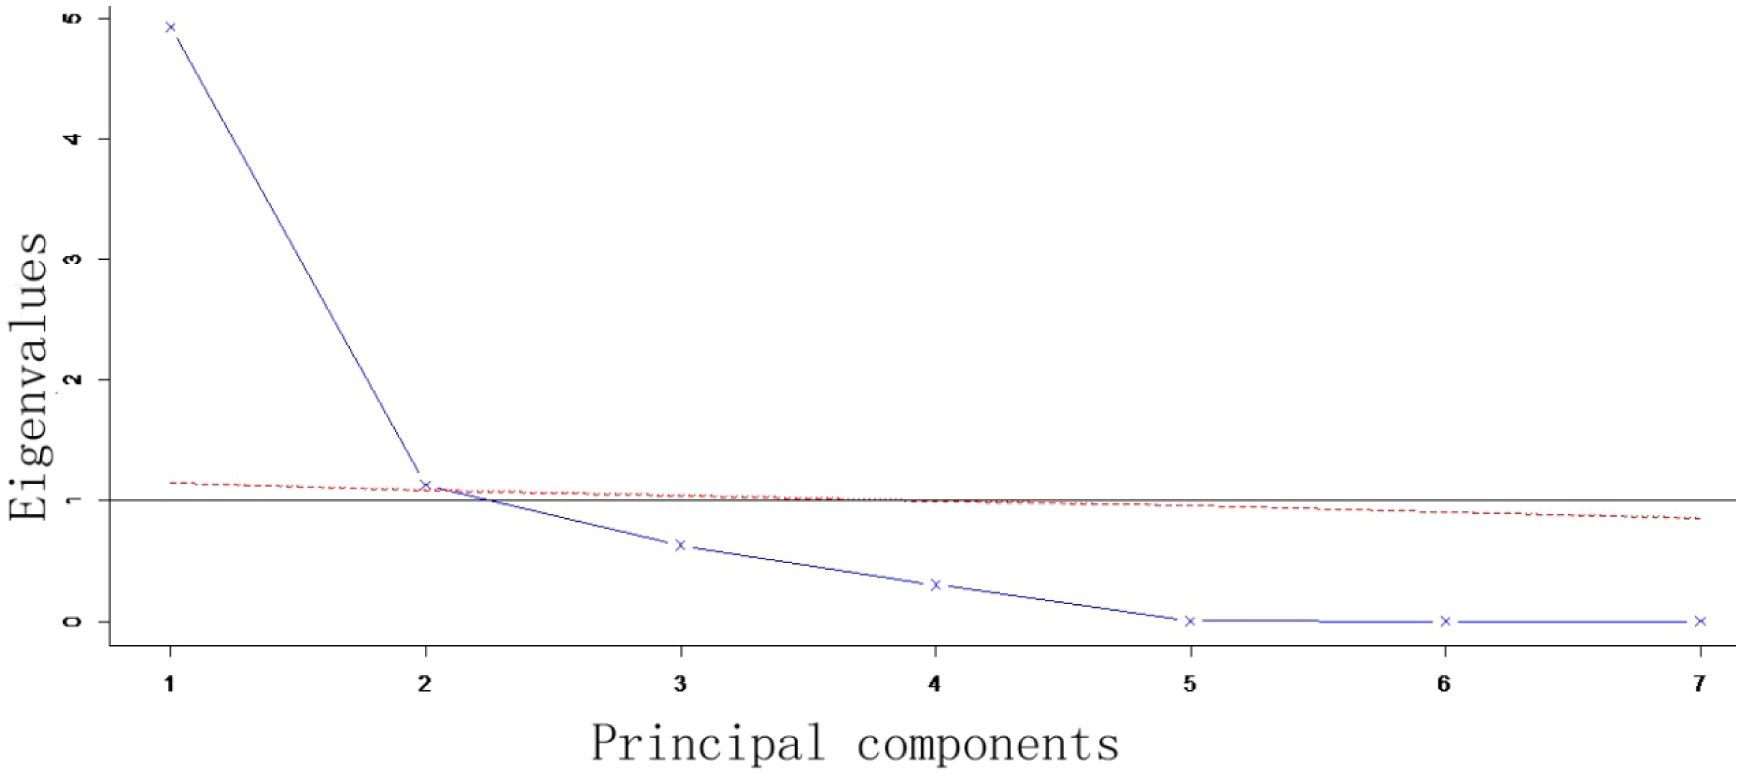
Figure 3 Scree plot from the principal component analysis of shell morphological indices. The results of a cliff parallel analysis is illustrated, depicting the variance explained by each principal component to assess the dimensionality of R. philippinarum shell morphology data.
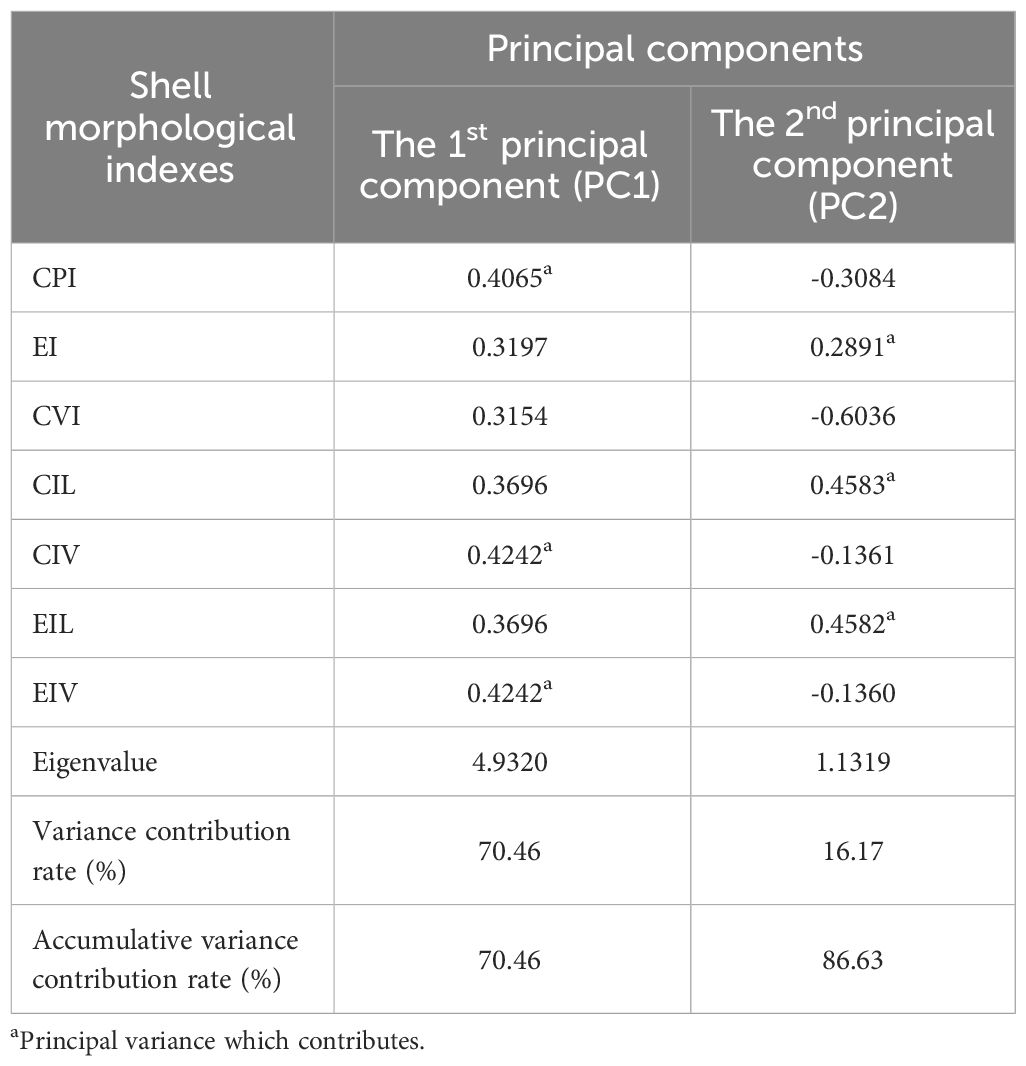
Table 4 Loadings and eigenvalues of the first two principal components of the shell morphological indexes of R. philippinarum populations.
A two-dimensional scatter diagram was plotted according to the data generated from the first two principal components of the R. philippinarum shell morphological indices, as shown in Figure 4. Among the seven geographical populations, the LJ population and the LZ population were relatively independent of the other populations and could be grouped separately, showing that these two populations were morphologically distinct. The RC population overlapped with part of the ZZD population as well as a small part of the LZ population, indicating that these three populations were morphologically similar. Such overlapping was also observed in the Beihai (BH) population, the Yingkou (YK) population, half of the Zuidong (ZD) population, and part of the ZZD population, making it impossible to sort these populations separately.
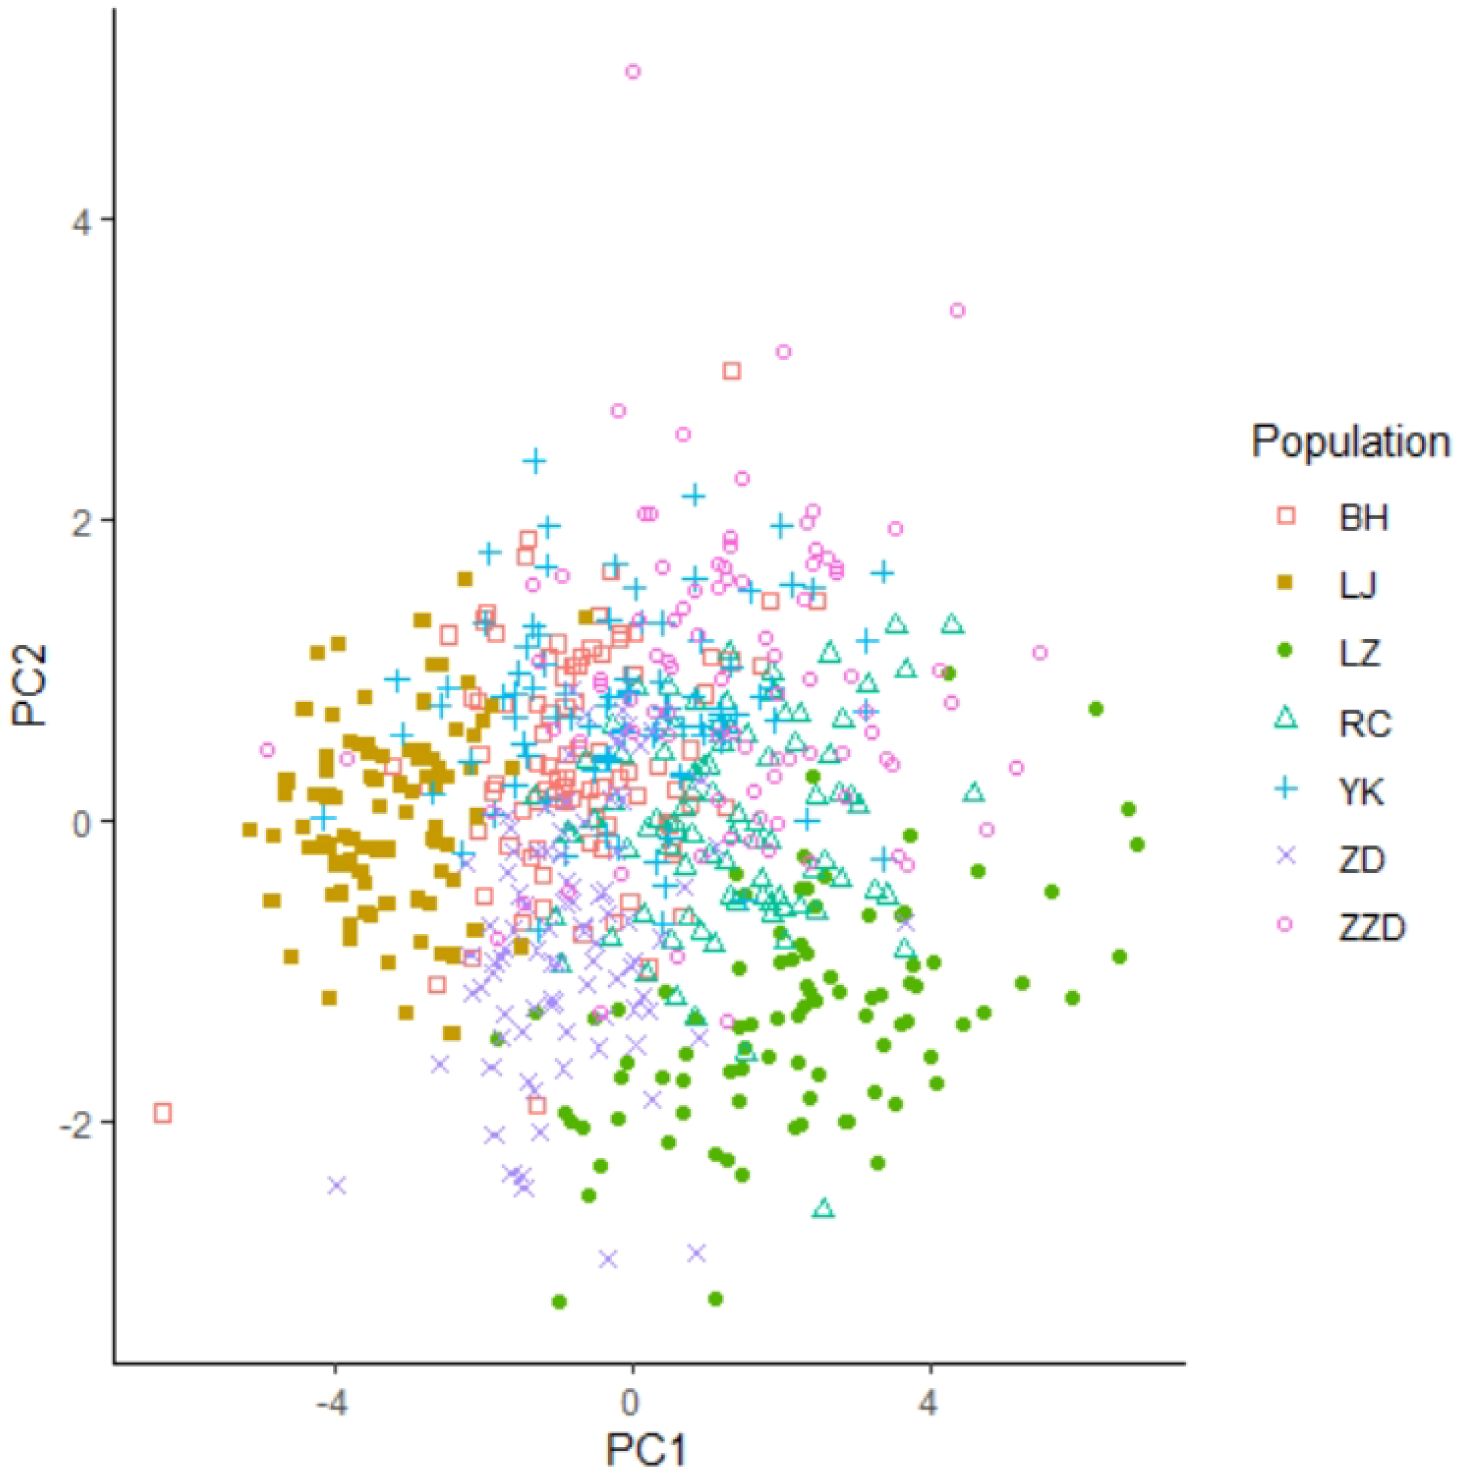
Figure 4 Principal component analysis scatter plot for shell morphological indices. This scatter diagram visualizes the distribution of R. philippinarum specimens along the first two principal components (PC1 and PC2) derived from shell morphological indices, facilitating the identification of patterns and clusters.
3.3 Cluster analysis of the seven geographical populations of R. philippinarum
Hierarchical clustering was used to calculate the Euclidean distance matrices, based on which the heat map was plotted (Figure 5). The squares with a lighter shade of red have a lesser Euclidean distance, indicating a higher similarity in the shell shapes. The squares that were closer to light green had a higher Euclidean distance, indicating a reduced resemblance between the shell morphologies. Among the seven geographical populations, the highest similarity in shell shape was found in the BH and the YK populations, which could be grouped into one cluster and then grouped together with the ZD population into a super-cluster. The RC and ZZD populations shared the second highest similarity in shell morphology. These two populations could likewise be grouped into one cluster, which could be grouped together with the LZ population into a super-cluster. The LJ population showed the highest degree of divergence and was morphologically different from the other six populations. Therefore, it was grouped into an individual cluster.
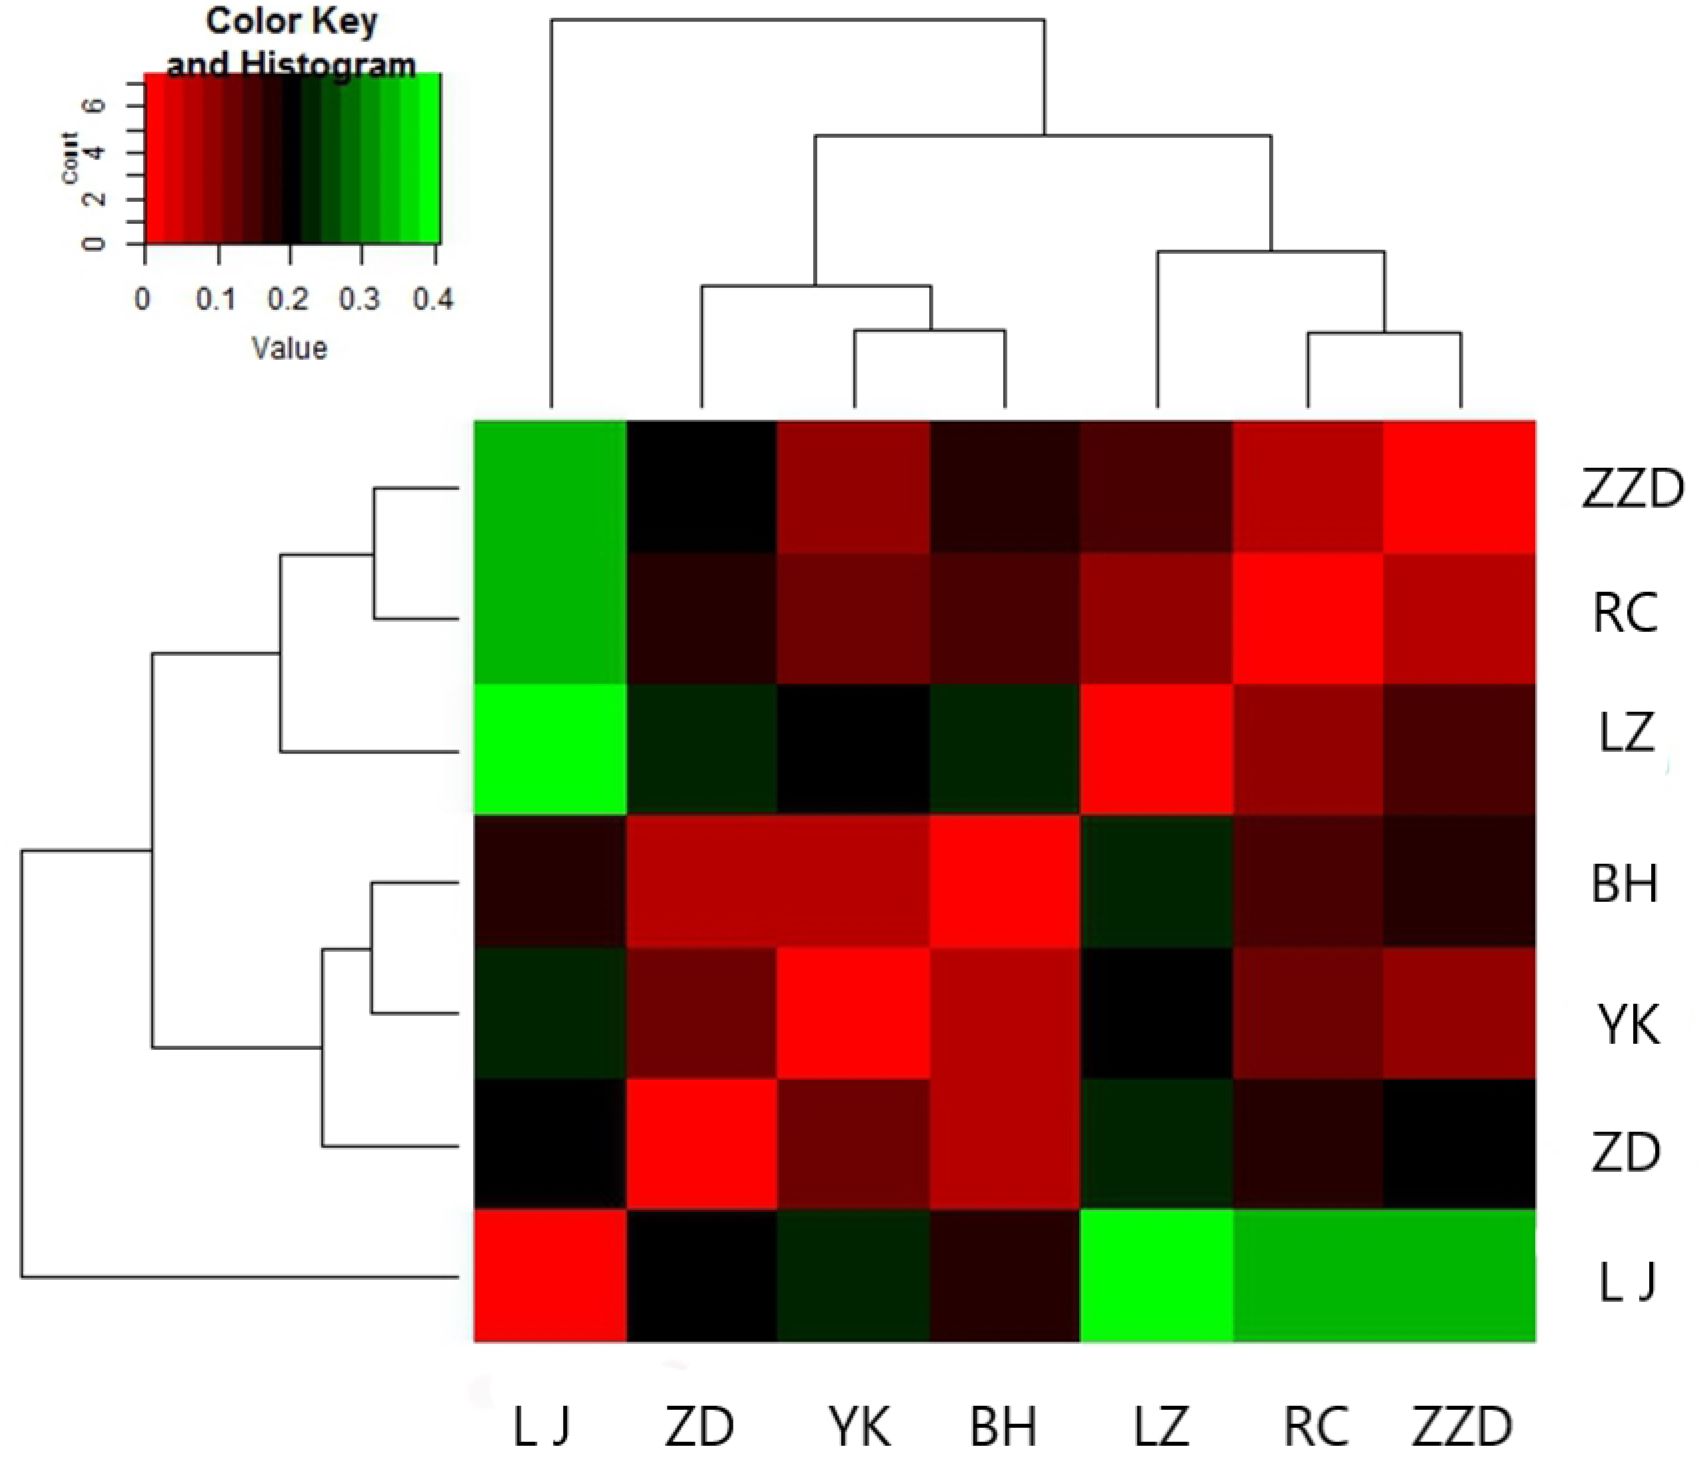
Figure 5 Heat map of a cluster analysis on shell morphological indices. A heatmap visualizing the results of a cluster analysis is presented, which categorizes R. philippinarum specimens based on similarities in shell morphological indices, revealing distinct groupings.
3.4 Discriminant analysis of the seven geographical populations of R. philippinarum
Discriminant analysis is a multivariate statistical analysis method that categorizes specimens based on numerous known variables. The R software was utilized to perform Fisher discriminative analysis, also known as linear discriminative analysis, in order to categorize the regional populations of R. philippinarum with a comprehensive diagnostic accuracy of 63.17%, as shown in Table 5. The highest diagnostic accuracy was found in the LJ population, the LZ population, and the ZD population, with values of 97.78%, 86.67%, and 71.11%, respectively. On the other hand, a lower diagnostic accuracy was found in the BH population, the YK population, the ZZD population, and the RC population, with values of 46.67%, 36.67%, 50.00%, and 53.33%, respectively. A scatter diagram was plotted according to the output of the first two linear discriminants, as shown in Figure 6. The results of the discriminant analysis were consistent with those of the PCA. The LZ and LJ populations showed considerable morphological divergence from the other populations, with both being identifiable as distinct clusters. Some individuals from the RC population and the ZZD population shared overlapping morphological properties. The BH population, the YK population, and half of the ZD population were morphologically overlapped and could not be separated from each other.
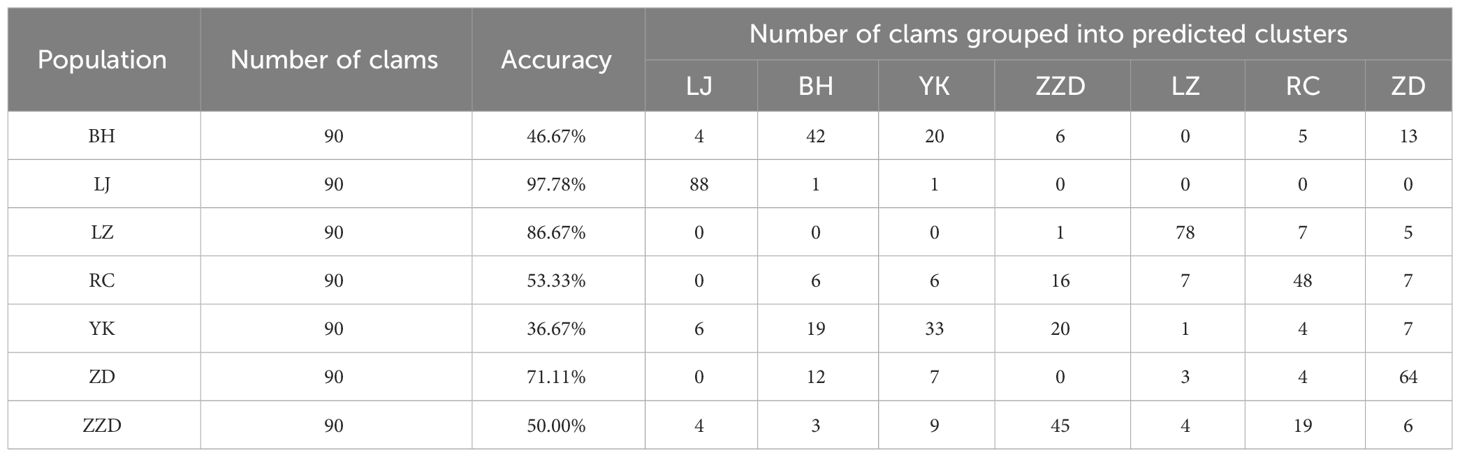
Table 5 Discriminant analysis of the seven geographical populations of Ruditapes Philippinarum.
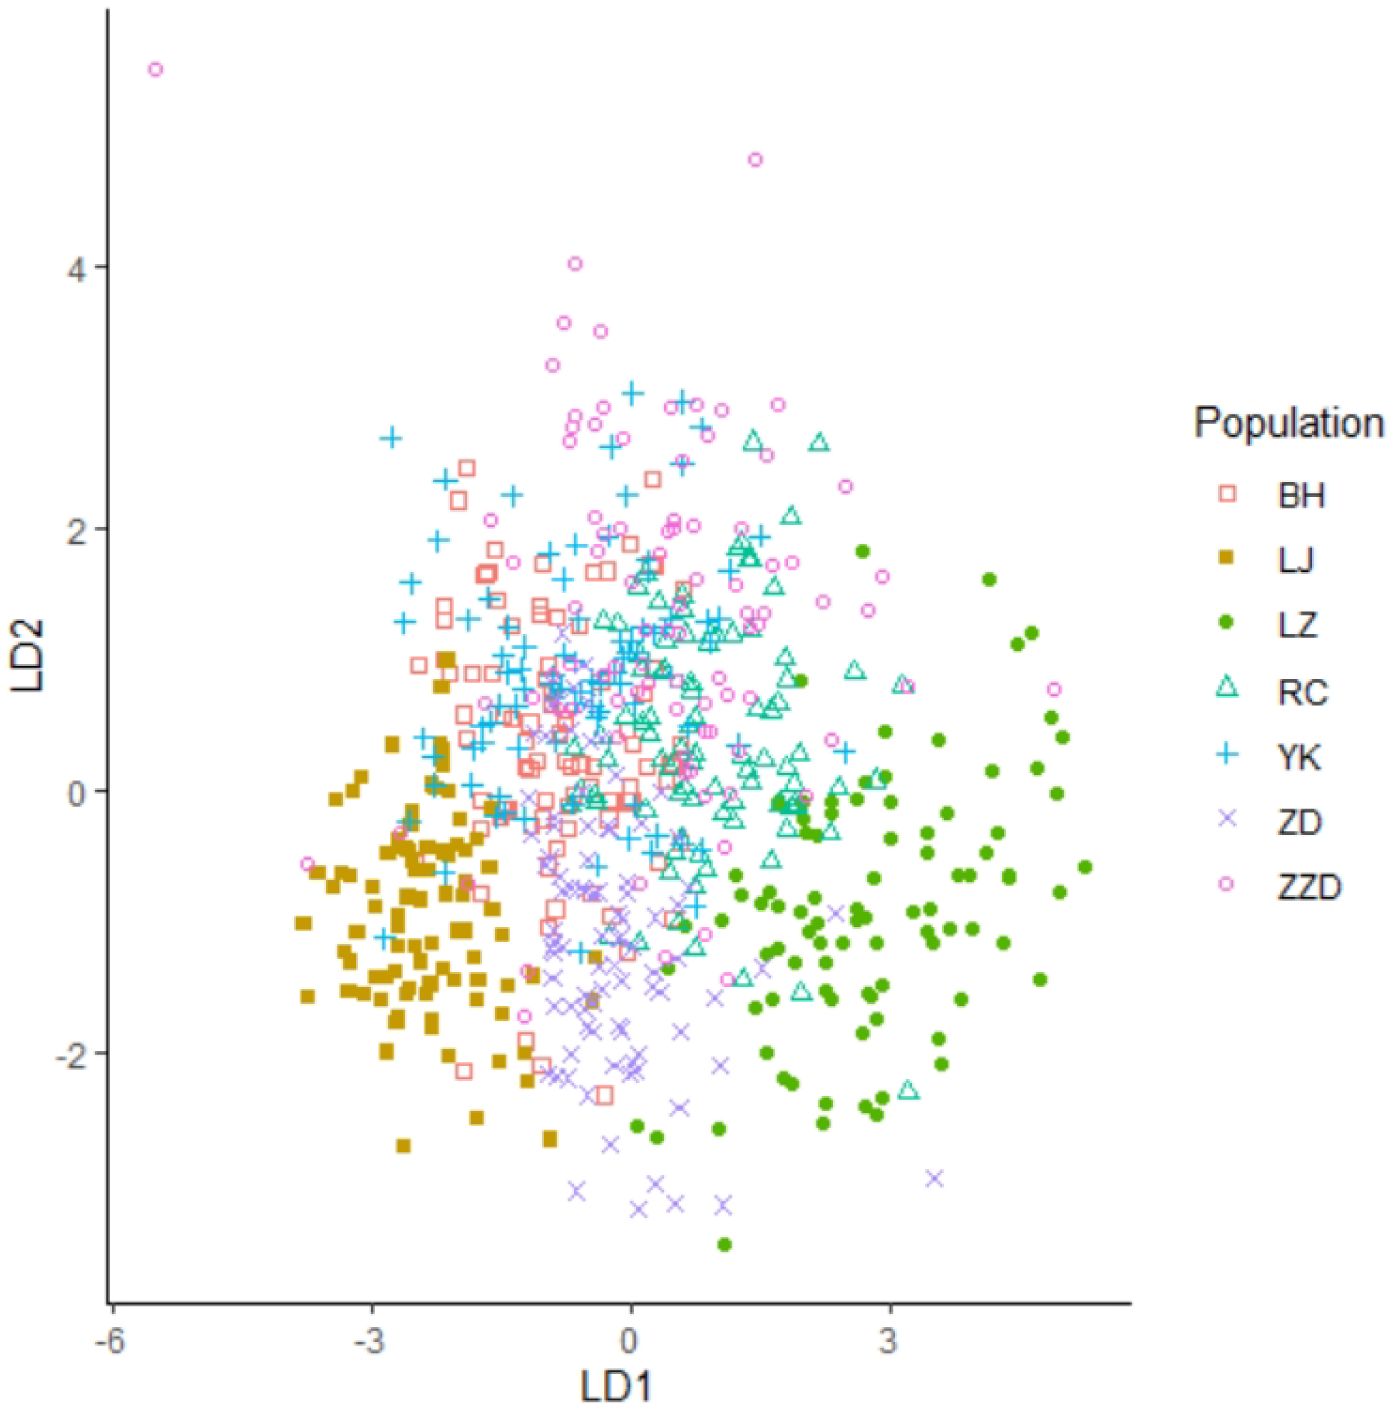
Figure 6 Scatter diagram plotted using the function values of the first two linear discriminants.
3.5 Shell volume comparisons of R. philippinarum from different geographical populations
Multiple comparisons were performed on the seven geographical populations of R. philippinarum to assess total volume (TV), shell volume (SV), and shell chamber volume (SCV) in the case that the shell lengths of clams were insignificantly different (P > 0.05). The results showed that, with total volumes (TV) from the biggest to the smallest, the sequencing of the seven geographical populations of R. philippinarum was LZ, RC, ZZD, BH, ZD, YK, and LJ (Figure 7A). In terms of total volumes, the LZ population was significantly different from the RC population (P < 0.05), and the other five populations were highly significantly different from each other (P < 0.01). With shell volumes (SV) from the biggest to the smallest, the ranking of the seven populations of R. philippinarum was LZ, RC, BH, ZZD, ZD, YK, and LJ (Figure 7B). The shell volume of the LZ population was highly significantly different from the other six populations (P < 0.01), whereas the shell volumes of the BH population, the ZD population, and the ZZD population were insignificantly different from each other (P > 0.05). The YK population and the LJ population had the smallest shell volume, and they were not significantly different from each other in terms of SV values. With shell chamber volumes (SCV) from the biggest to the smallest, the seven geographical populations could be ordered as LZ, RC, ZZD, BH, YK, ZD, and LJ (Figure 7C). In terms of shell chamber volumes, the first two populations (LZ and RC) were highly significantly different from the other five populations (P < 0.01), and the last population LJ was highly significantly different from the other six populations. The shell chamber volume difference among the BH population, the YK population, the ZD population, and the ZZD population was insignificant (P > 0.05).
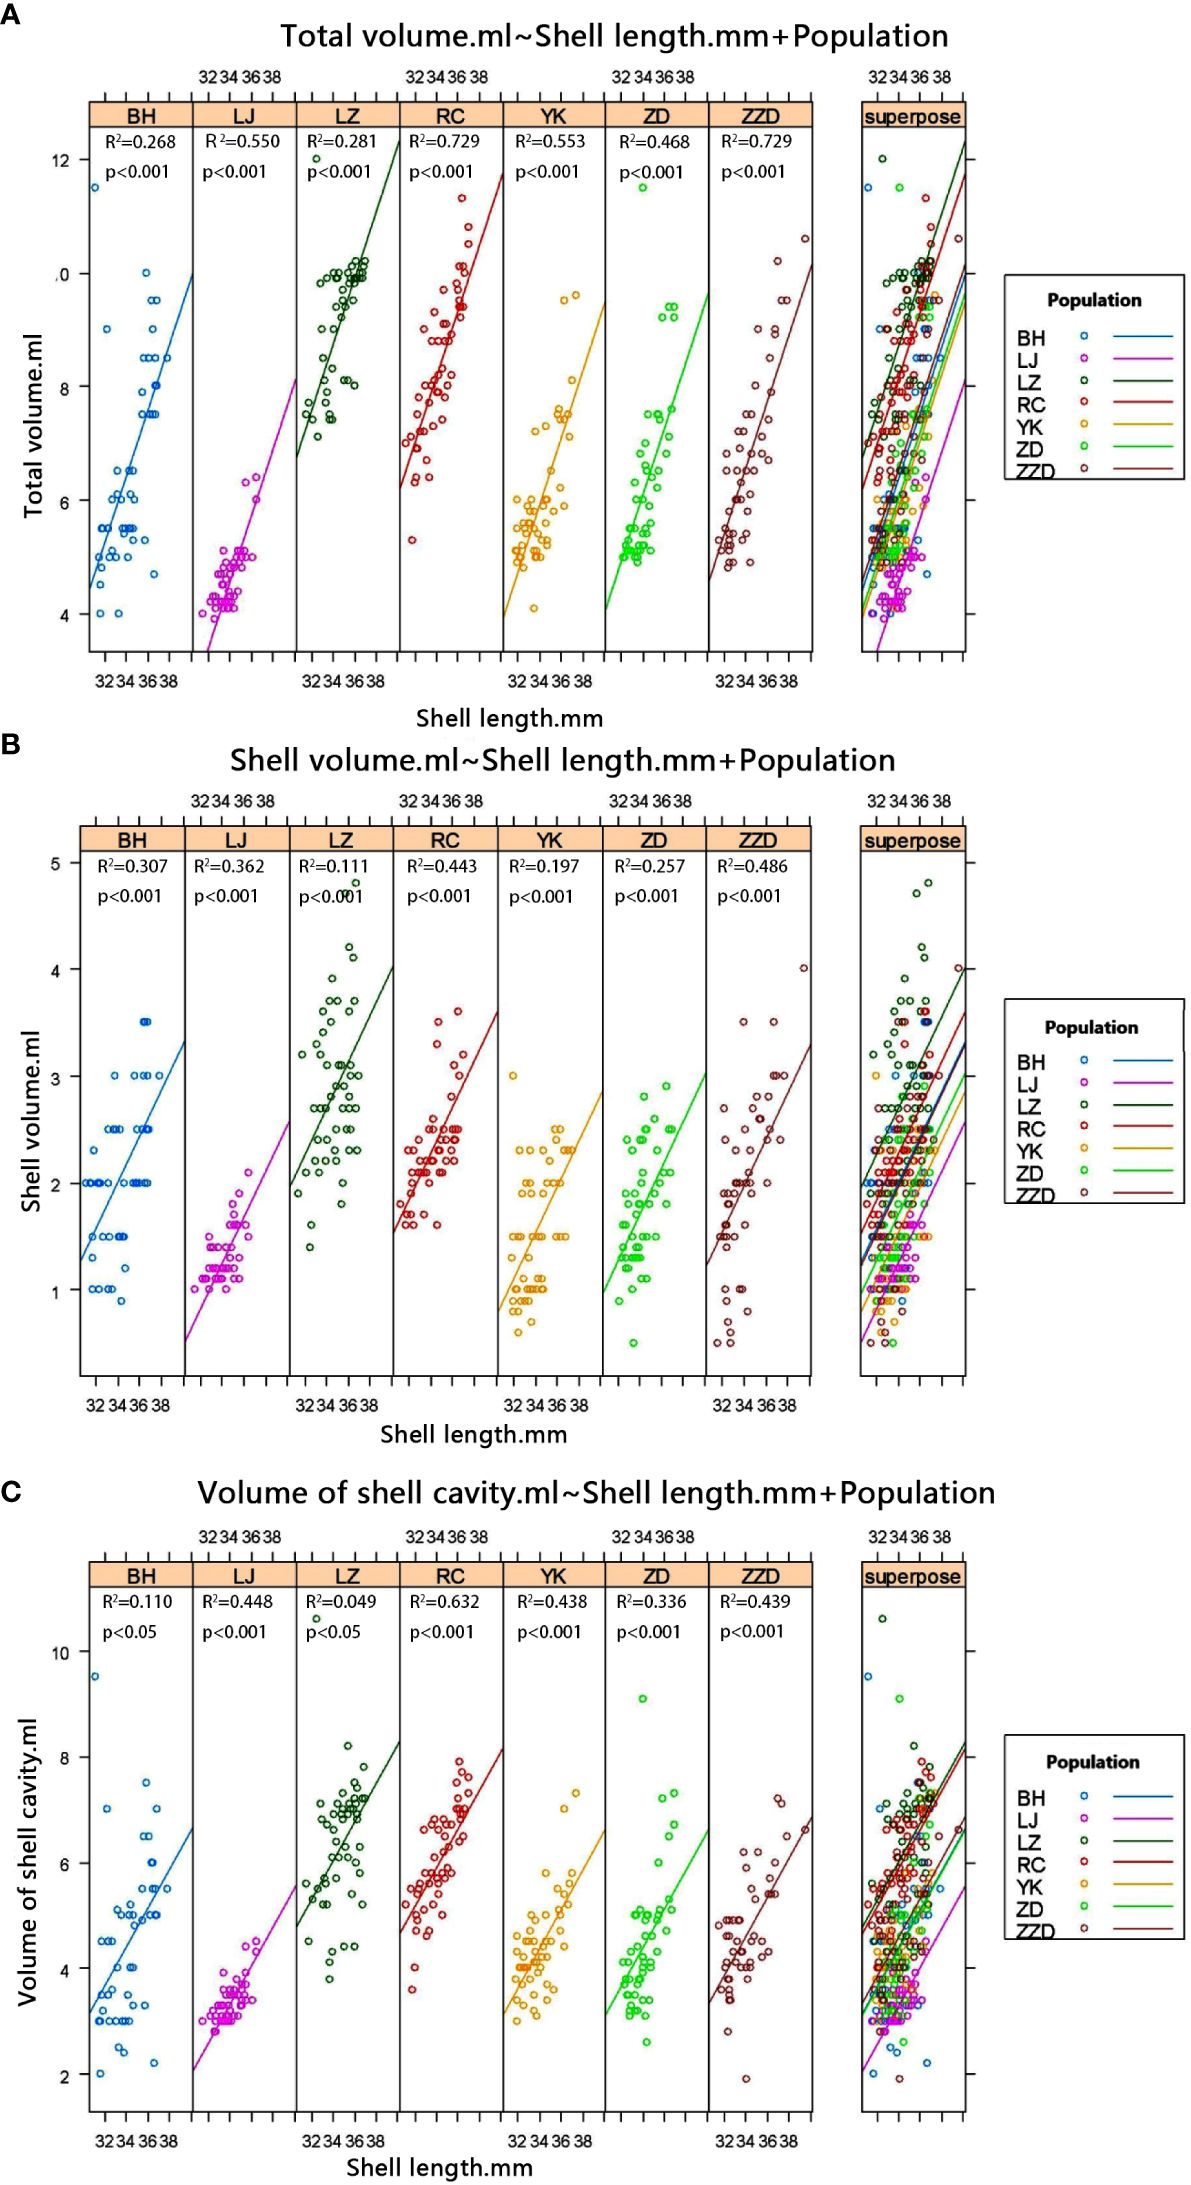
Figure 7 Correlation between shell length and volume features (total volume, shell volume, and shell chamber volume) of R. philippinarum from different geographical populations. (A) Correlation between shell length (SL) and total volume of R. philippinarum from different geographical populations. (B) Correlation between SL and shell volume of R. philippinarum from different geographical populations. (C) Correlation between SL and shell chamber volume of R. philippinarum from different geographical populations.
3.6 Multiple comparisons of weight traits among different geographical populations of R. philippinarum
Additional comparisons were conducted regarding total live weight (TW), soft tissue weight (SOW), and shell weight (SW) of R. philippinarum from the seven geographical populations, in the case that the shell length values of clams were insignificantly different (P > 0.05). The results showed that with TW from the highest to the lowest, sequencing of the seven populations of R. philippinarum was LZ, RC, ZZD, BH, YK, ZD, and LJ (Figure 8A). The LZ population exhibited a considerably greater total live weight (TW) in comparison to the remaining six populations (P < 0.01). Moreover, the TW values of the ZD and LJ populations were not substantially dissimilar (P > 0.05). The classification of the seven populations according to SOW was as follows: LZ, RC, ZZD, YK, BH, ZD, and LJ (Figure 8B). Similarly, the SOW of the LZ population was significantly higher than that of the other six populations (P < 0.01). The RC population and the ZZD population shared similar SOW (P > 0.05), which was significantly higher than the four populations listed behind these two populations (P < 0.01). The arrangement of the seven populations, in ascending SW value order, was as follows: LZ, RC, ZZD, BH, YK, ZD, and LJ. This result was consistent with the sequencing that was generated utilizing the TW values (Figure 8C). However, there was no significant difference in the SW values of the first two populations (the LZ population and the RC population) (P > 0.05), yet they were highly significantly higher than the SW values of the other five populations (P <0.01). Furthermore, there are no significant differences in the ZD and LJ populations in terms of SW (P > 0.05).
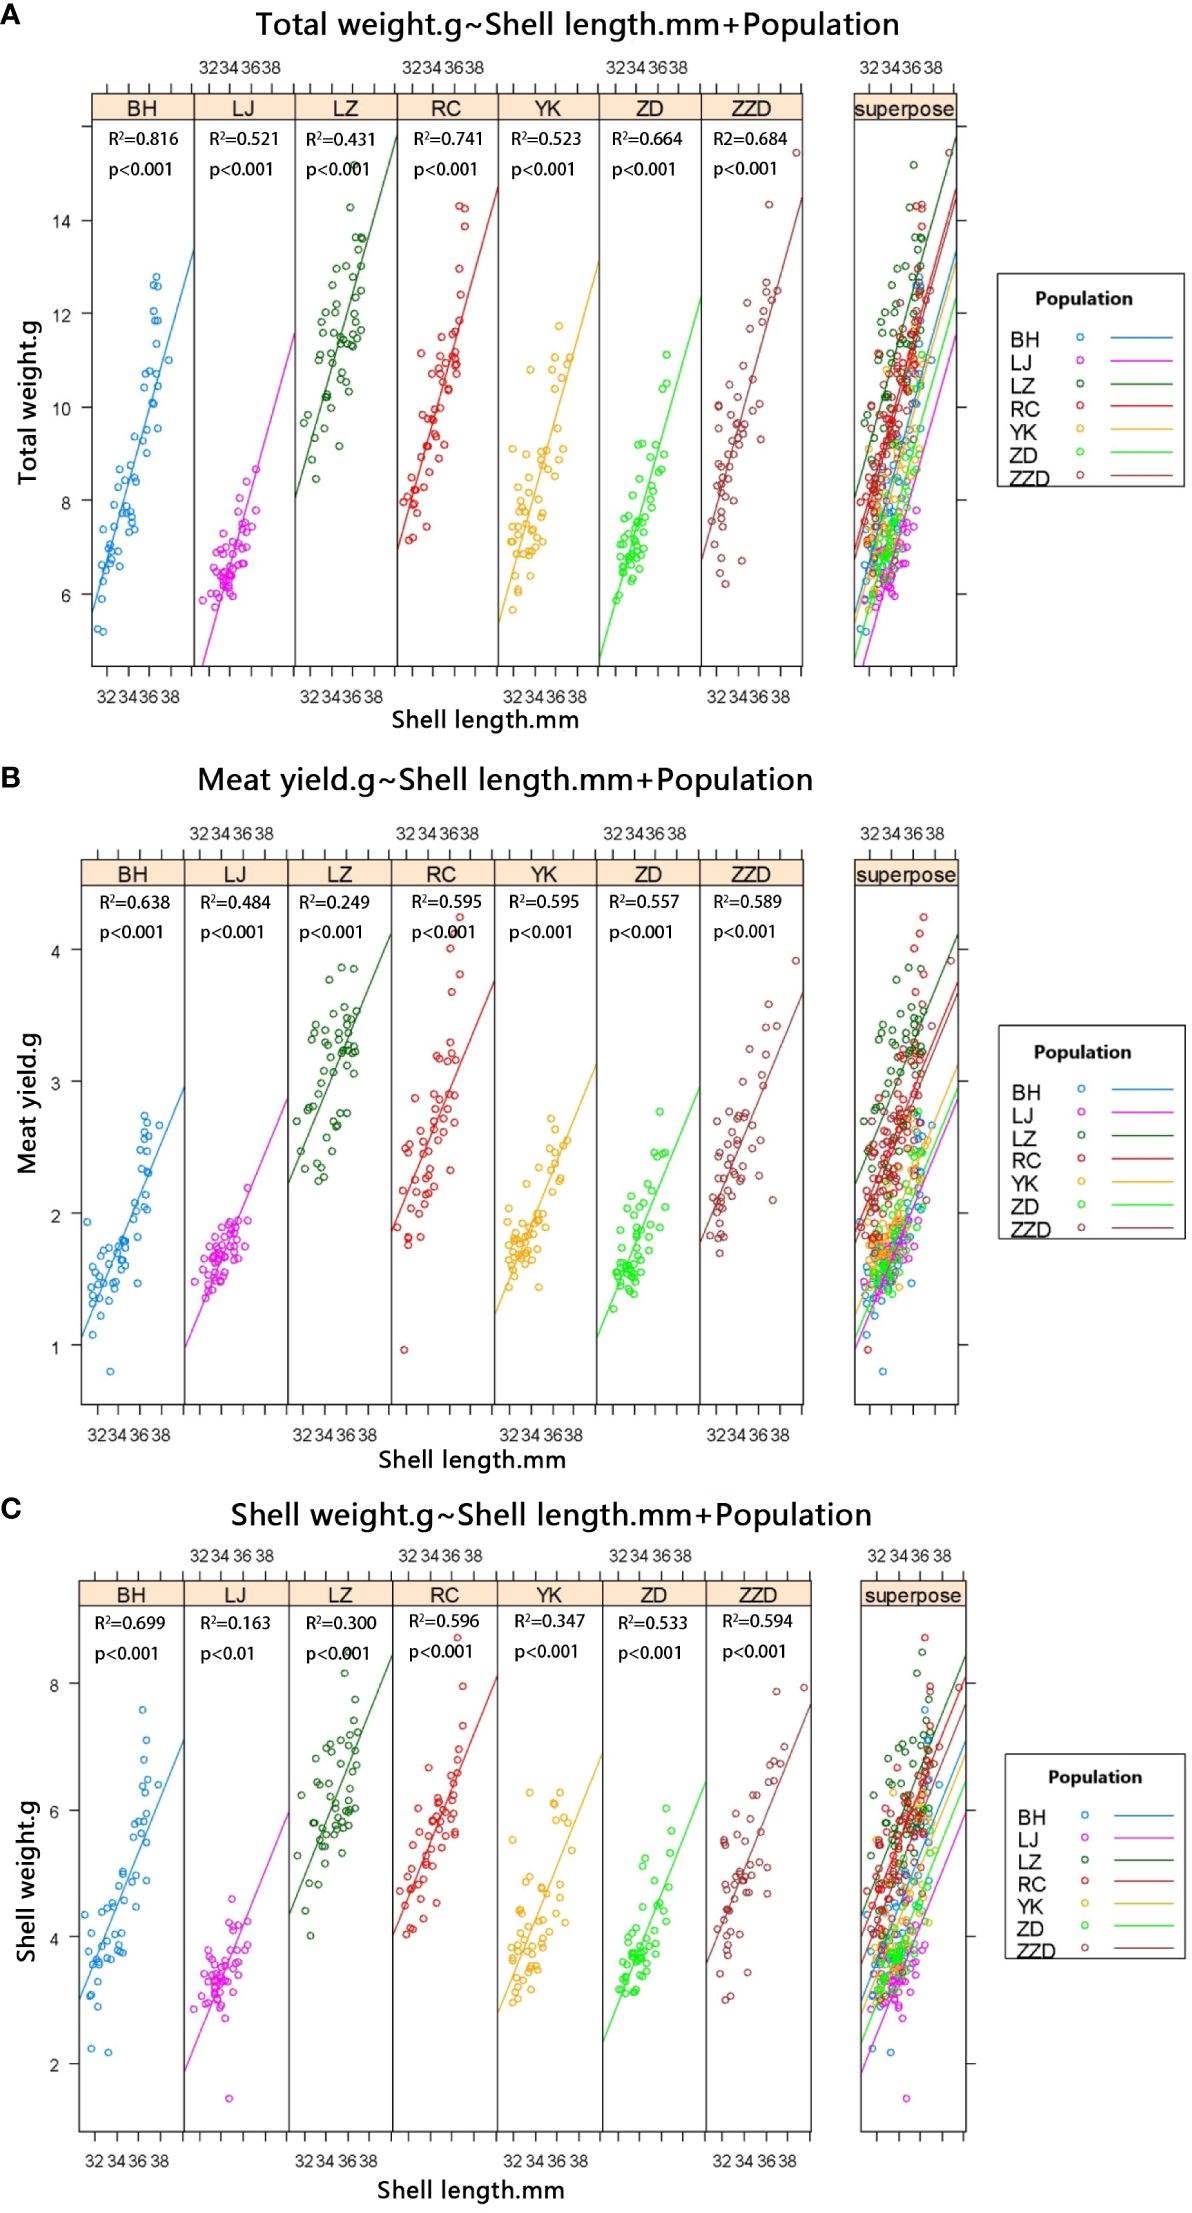
Figure 8 Correlation between shell length and weight traits (total live weight, soft tissue weight, and shell weight) of R. philippinarum from different geographical populations. (A) Correlation between shell length (SL) and total live weight of R. philippinarum from different geographical populations. (B) Correlation between SL and soft tissue weight of R. philippinarum from different geographical populations. (C) Correlation between SL and shell weight of R. philippinarum from different geographical populations.
3.7 Correlation analysis of volume features and weight traits across different geographical populations of R. philippinarum
Correlation analysis was performed using the volume features (total volume, shell volume, and shell chamber volume) and the weight traits (total live weight, soft tissue weight, and shell weight) of different geographical populations of R. philippinarum. The covariance obtained showed that the volume features and the weight traits were significantly correlated (Figures 9A–F).
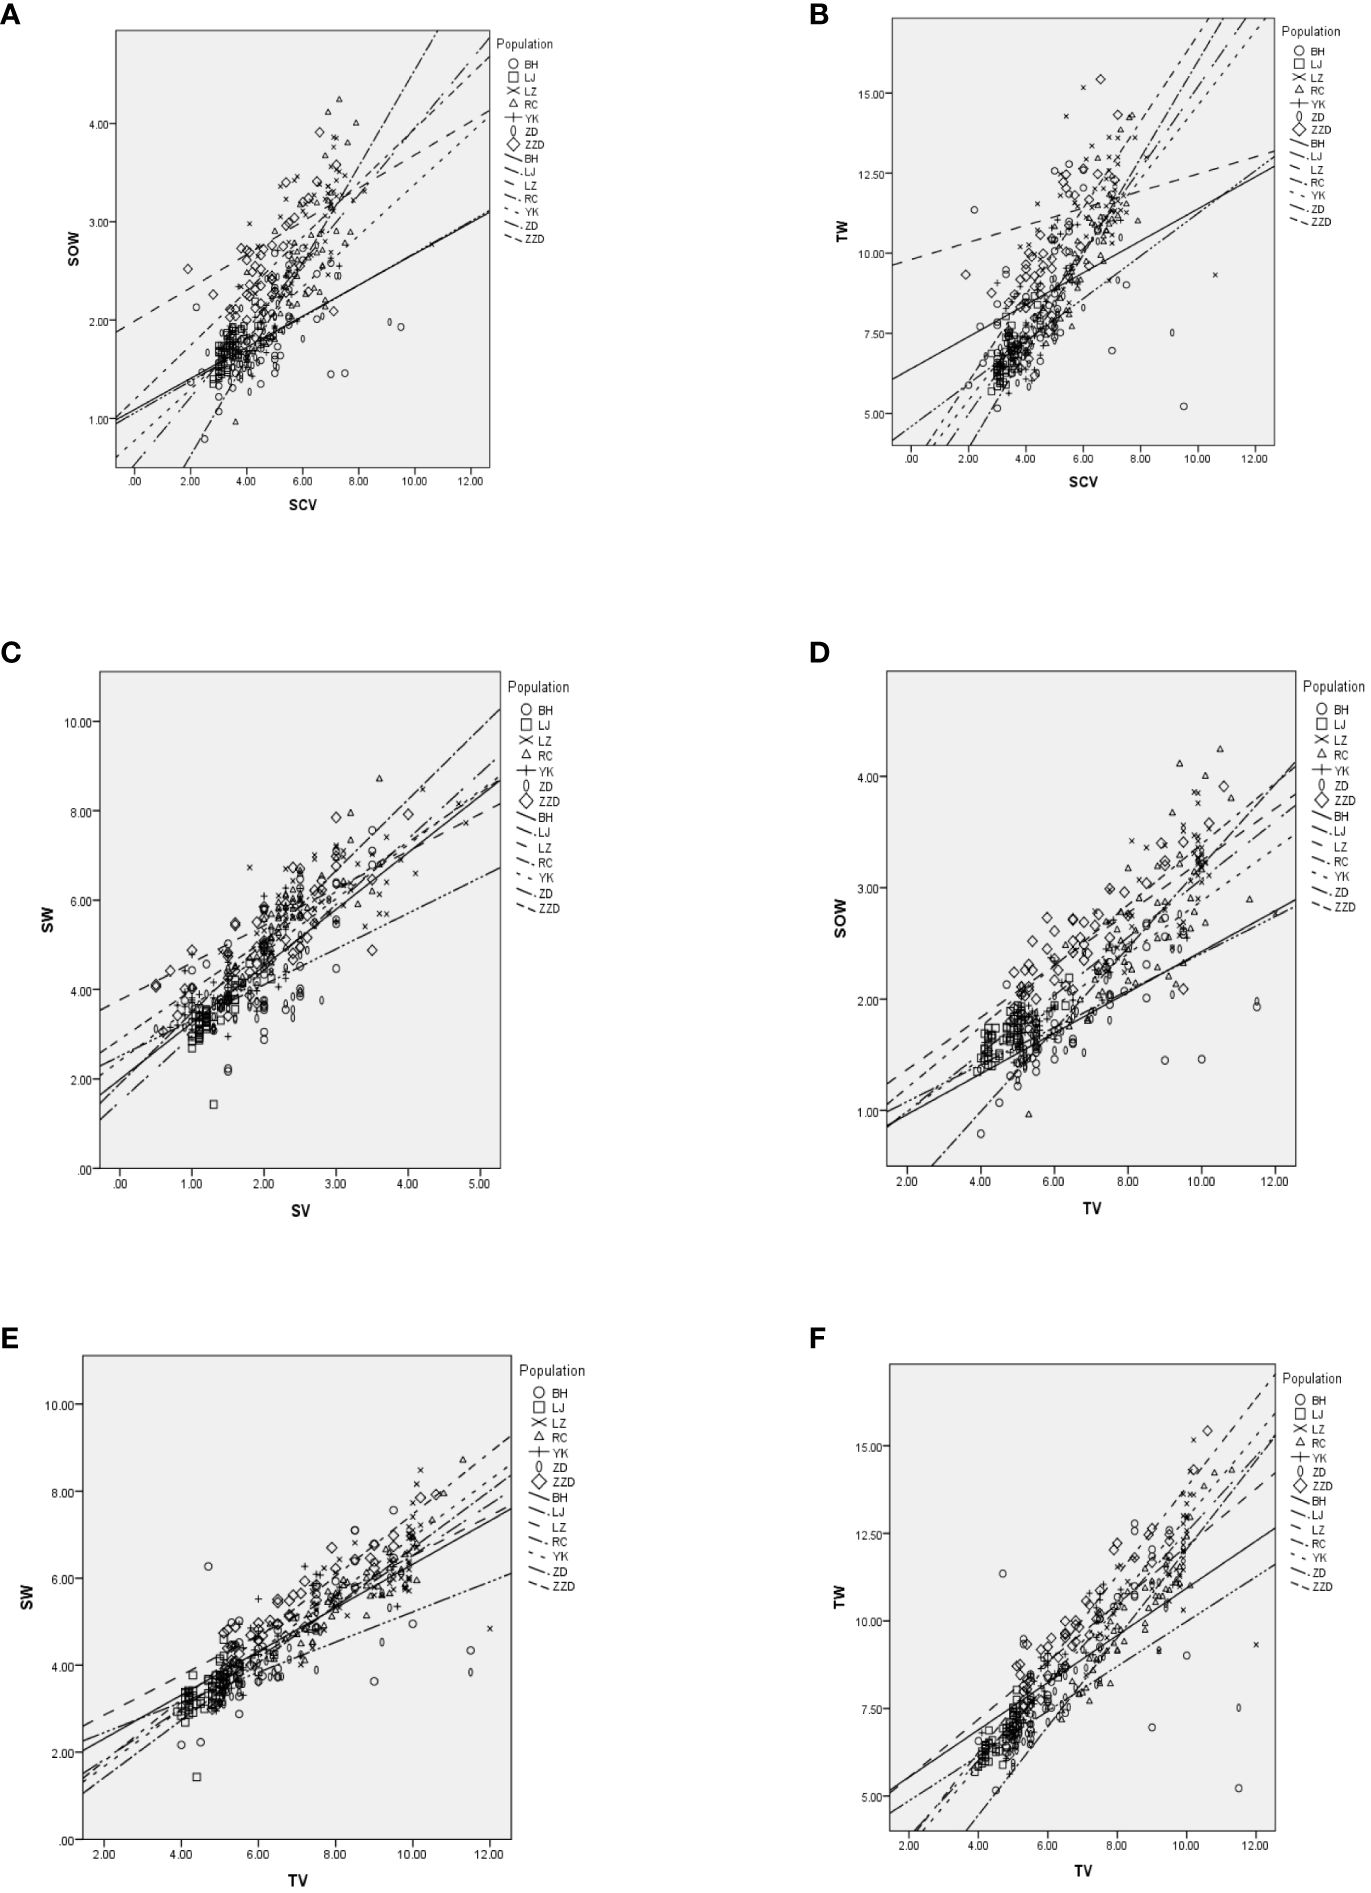
Figure 9 Correlation analysis between volume features (total volume, shell volume, and shell chamber volume) and weight traits (total live weight, soft tissues weight, and shell weight) of different geographical populations of R. philippinarum. In each individual graph, the shapes represent different volume features, while the lines represent different weight traits. (A) Correlation analysis between shell chamber volume and soft tissue weight (SOW) of different geographical populations of R philippinarum. (B) Correlation analysis between total volume (TV) and SOW of different geographical populations of R philippinarum. (C) Correlation analysis between shell volume and shell weight (SW) of different geographical populations of R philippinarum. (D) Correlation analysis between TV and SOW of different geographical populations of R philippinarum. (E) Correlation analysis between TV and SW of different geographical populations of R philippinarum. (F) Correlation analysis between TV and total TW of different geographical populations of R philippinarum.
4 Discussion
4.1 Shell morphology varied across different geographical populations of R. philippinarum
Significant variations in shell morphology have been documented in several geographical populations of R. philippinarum, including the Awazu population (Japan), the Dalian population (China), the Tonkin Gulf population (Japan), and the Arcachon Bay population (France). Yokagawa (1998) reported that for R. philippinarum in Japan, shell shape of the Awazu population was significantly globular than that of the Yashima population. Zhang et al. (2008) and Satoshi and Satoshi (2010) both reported that a flat shell shape was found in R. philippinarum from the Dalian population (China) and the Tonkin Gulf population (Japan), respectively. Through multivariate analysis, Caill-Milly et al. (2012) described the shell shape of R. philippinarum from the Arcachon Bay population (France) as round or globular, with a SH (shell height)/SL (shell length) value of 0.75, a CIL value of 0.73, a SW (shell width)/SL value of 0.28, and an EIV value of 0.95. Yu (2022) collected R. philippinarum from three local populations in Shandong Province and found that there were differences in convexity index, elongation index, thickness, and other indicators among different populations. Similarly, in our study, shell morphological polymorphism was observed across different geographical populations of R. philippinarum. Multivariate analysis on the collected shell morphological indices revealed three kinds of shell shape and three clusters from the seven geographical populations of R. philippinarum investigated. The LZ population had an approximately globular shell shape. The LJ population displayed a flat shell shape. The ZZD population exhibited a round shell shape in lateral view. Our results were consistent with previous findings.
4.2 Genetic variance leads to shell morphological divergence within the same geographical population of R. philippinarum
The genetic studies on R. philippinarum from different populations were conducted by using morphological parameters (Liu et al., 1999), amplified fragment length polymorphism (AFLP) markers (Zou et al., 2014), isoenzymes (Ge et al., 2008), simple sequence repeats (SSR) markers (Nie et al., 2015), mitochondrial DNA (mtDNA), and internal transcribed spacer 1 (ITS1) (Gharbi et al., 2010). In our study, although the ZD, YK, and ZZD populations are distributed in the same sea area, their shell shapes are obviously different. The ZD population has a globular shape, the YK population has a flat shape, and the ZZD population has a round side view. This phenomenon may be due to two reasons: (1) genetics (Zhuang, 2001) and (2) the long-term introduction of parents and young clams from south to north. According to the cluster analysis and principal component analysis of our study, for the YK population and the ZD population, some individuals were morphologically similar to those of the two southern populations (LJ and BH), and some were similar to those of the RC population and the LZ population. In the analyses using the mtCOI and 16S rRNA gene sequences as the genetic marker, we found that some individuals of the YK population and the ZD population shared the same haplotype with those of the BH population and the LJ population (Tan et al., 2020, 2021), indicating that anthropogenic introduction of the Manila clams from south to north resulted in a mixture of both native and exotic clams distributed in YK and ZD, which could explain the reason why intra-population morphological variance was observed in the YK population and the ZD population.
Furthermore, the PCA showed that around 12% of the individuals of the ZZD population were morphologically overlapped with those of the LJ population in this study. Consistently, the phylogenetic tree analysis of different geographical populations of R. philippinarum using site-specific amplified fragment sequencing (SLAF-seq) also showed that about 30% of individuals in the ZZD population clustered into the LJ population (Tan, 2020). This may be due to the introduction of parents and young generations of Manila clams from the southern areas to the northern area near Zhangzidao in the past decade. Zhuanghe and Dandong are two Manila clam-producing areas in the North Yellow Sea, with a total annual output of about one million tons (2003). A study conducted by Liu et al. (2007) examined the genetic diversity of four natural populations in Dalian, Qingdao, Hangzhou, and Xiamen using AFLP markers. They found that the genetic distance between the Qingdao and Xiamen populations was relatively close, indicating that the genetic structure of the natural population of Filipino clams in China has changed. Nearly 90% of the parents and juveniles of Manila clams in these two areas were introduced from Fujian in the south. As a result, sustained culture over the past decade has produced nearly 10 million tons of Manila clams, mostly from the south. These southern Manila clams were cultured in the northern Yellow Sea, producing highly dispersed larvae (Yan et al., 2005). Some southern larvae may eventually settle in the Zhangzidao area and mix with native Manila clams, establishing a “mainland–island effect” to a certain extent. Therefore, there are differences in the shell morphology of the R. philippinarum population in ZZD, which affects the evaluation of the shell morphological characteristics of this population.
4.3 Volume characters and weight traits comparison of R. philippinarum from different geographical populations
Total live weight and soft tissue weight are significant economic indicators utilized frequently in shellfish aquaculture to assess shellfish production. Furthermore, the capacity of bivalves to sequester carbon is indicated by their shell weight (Zhang et al., 2005; Liu and Tang, 2011). This study found a significant correlation between volume traits and weight traits of R. philippinarum from different geographical populations. Shell lengths were comparable across all seven populations; however, the clams from LZ population exhibited the greatest volume and weight. The clams from the LJ population are the smallest in size and weight. In terms of volume and weight, the RC population and the ZZD population, which belong to the same cluster as the LZ population, are higher than the four populations: the LJ population, the BH population, the YK population, and the ZD population. Our results are consistent with previous findings. Caill-Milly et al. (2012) reported that, for the R. philippinarum population distributed in Arcachon Bay of France, individuals with a globular shell shape (the ratio of shell width to shell length was relatively higher) were heavier than those with a round shell shape (the ratio of shell width to shell length was relatively low). Kemp and Bertnerss (1984) reported that, for Littotinalittorea, globular individuals with a thin shell contained more body mass in comparing with elliptic individuals with a thick shell.
Within the context of commercial cultivation and selective breeding practices of R. philippinarum, shell length has traditionally served as a primary criterion for assessing quality. In addition, morphology of the shell has been proposed as an essential metric for evaluating the quality of Manila clams (Costa et al., 2008). Notably, shell morphology variations are observed across individuals from different populations and within individuals of the same population (Zhuang, 2001; Zhang and Yan, 2010). Consequently, an economic incentive exists to breed and culture Manila clams selectively with a globular shell shape, as this may enhance the likelihood of achieving higher yields of desirable soft tissue weight and total live weight.
5 Conclusion
China’s extensive and serpentine coastline establishes it as a prime repository for the native germplasm resources of R. philippinarum. An investigation on the shell morphological characteristics of R. philippinarum across various geographical populations in Southern and Northern China has yielded two key findings. Firstly, three distinct shell shapes—globular, flat, and round—were identified across all studied populations, underscoring the diversity within this species. Secondly, the study suggests that shell morphological traits, particularly the globular shape, serve as valuable metrics for assessing the quality of R. philippinarum in commercial culture, given their superior size and weight compared to flat clams. These insights highlight the importance of considering shell morphology in the breeding and culture strategies for R. philippinarum, aiming to optimize yield and quality.
Data availability statement
The original contributions presented in the study are included in the article/supplementary material. Further inquiries can be directed to the corresponding author.
Ethics statement
The manila clam used in the present study were commercially cultured animals. All experiments were conducted in accordance with the recommendations in the Guide for the Care and Use of Laboratory Animals of the National Institutes of Health. All study protocols were approved by the Animal Ethics Committee of Dalian ocean university. The study was conducted in accordance with the local legislation and institutional requirements.
Author contributions
ZH: Writing – review & editing, Writing – original draft. ZW: Writing – original draft, Writing – review & editing. DL: Formal analysis, Writing – review & editing. KL: Data curation, Formal analysis, Investigation, Writing – review & editing. XL: Data curation, Formal analysis, Investigation, Writing – review & editing. LF: Data curation, Investigation, Project administration, Supervision, Writing – review & editing. XY: Project administration, Writing – review & editing.
Funding
The author(s) declare financial support was received for the research, authorship, and/or publication of this article. This research was supported by a grant from the Outstanding Young Scientific and Technological Talents Foundation of Dalian (2021RJ09), Key R&D program of Shandong Province (2023LZGCQY001), Liaoning Revitalization Talents Program (XLYC1807271), the Central Government Subsidy Project for Liaoning Fisheries (2024), and funds earmarked for Modern Agro-industry Technology Research System (CARS-49).
Acknowledgments
We thank the reviewers for their helpful comments on this work.
Conflict of interest
The authors declare that the research was conducted in the absence of any commercial or financial relationships that could be construed as a potential conflict of interest.
Publisher’s note
All claims expressed in this article are solely those of the authors and do not necessarily represent those of their affiliated organizations, or those of the publisher, the editors and the reviewers. Any product that may be evaluated in this article, or claim that may be made by its manufacturer, is not guaranteed or endorsed by the publisher.
References
Adams D. C., Rohlf F. J., Slice D. E. (2004). Geometric morphometrics: ten years of progress following the “revolution”. Ital. J. Zool. 71, 5–16. doi: 10.1080/11250000409356545
Belonsky G. M., Kennedy B. W. (1988). Selection on individual pheno-type and best linear unbiased predictor of breeding value in a closed swine herd. J. Anim. Sci. 66, 1124–1131. doi: 10.2527/jas1988.6651124x
Bureau of Fisheries, National Fisheries Technology Extension Center, China Society of Fisheries (2023). China fishery Statistical Yearbook 2023 (Beijing: China Agriculture Press).
Caill-Milly N., Bru N., Mahé K., Borie C., D'Amico F. (2012). Shell Shape Analysis and Spatial Allometry Patterns of Manila Clam (Ruditapes philippinarum) in a Mesotidal Coastal Lagoon. J. Mar. Biol. 2012, 281206. doi: 10.1155/2012/281206
Costa C., Aguzzi J., Menesatti P., Antonucci F., Rimatori V., Mattoccia M. (2008). Shape analysis of different populations of clams in relation to their geographical structure. Proc. Zoological Soc. London. 276, 71–80. doi: 10.1111/j.1469-7998.2008.00469.x
Ge J. Y., Liu P., Gao T. X. (2008). Isozyme polymorphism in Ruditapes philippinarum from four wild populations. Mar. Fisheries Res. 29, 63–70. doi: 10.3969/j.issn.1000-7075.2008.06.010
Gharbi A., Chatti N., Said K., Wormhoudt A. V. (2010). Genetic variation and population structure of the carpet shell clam Ruditapes decussatus along the Tunisian coast inferred from mtDNA and ITS1 sequence analysis. Biologia 65, 688–696. doi: 10.2478/s11756-010-0069-8
Gosling E. (2003). Bivalve Molluscs: Biology, Ecology and Culture. Oxford: Blackwell Publishing Ltd. doi: 10.1002/9780470995532
Hamilton A. M., Selwyn J. D., Hamner R. M., Johnson H. K., Brown T., Springer S. K., et al. (2020). Biogeography of shell morphology in over-exploited shellfish reveals adaptive trade-offs on human-inhabited islands and incipient selectively driven lineage bifurcation. J. Biogeogr, 47, 1494–1509. doi: 10.1111/jbi.13845
Kemp P., Bertnerss M. D. (1984). Snail shape and growth rates: evidence for plastic shell allometry in Littorina littorea. Proc. Natl. Acad. Sci. U.S.A. 81, 811–813. doi: 10.1073/pnas.81.3.811
Lande R., Arnold S. J. (1983). The measurement of selection on correlated characters. Evolution 37, 1210–1226. doi: 10.1111/j.1558-5646.1983.tb00236.x
Liu K., Li X. D., Che Z. H., Liang T., Fang L. (2021). Current trends in population research on shell morphological polymorphism of mollusks. Mar. Sci. 45, 213–221. doi: 10.11759/hykx20201018001
Liu H., Tang Q. S. (2011). Review on worldwide study of ocean biological carbon sink. J. Fishery Sci. China. 18, 215–222. doi: 10.3724/SP.J.1118.2011.00695
Liu R. Y., Zhang X. C., Ma C. D., Liang Y. B. (1999). Study on the correlation between morphological characters and genetic variation of R. philippinarum. Mar. Environ. Science. 18, 6–10. doi: 10.3969/j.issn.1007-6336.1999.02.002
Liu X. Q., Bao Z. M., Hu J. J., Wang S., Zhan A. B., Liu H., et al. (2007). AFLP analysis revealed differences in genetic diversity of four natural populations of Manila clam (Ruditapes philippinarum) in China. Acta Oceanol. Sin. 1, 150–158.
Morán G. A., Martínez J. J., Reyna P. B., Martín J., Malits A., Gordillo S. (2022). Identifying environmental drivers of shell shape and size variation in a widely distributed marine bivalve along the Atlantic Patagonian coast. Zool. Lanz. 299, 49–61. doi: 10.1016/j.jcz.2022.05.003
Nie H. T., Niu H. B., Zhao L. Q., Yang F., Yan X. W., Zhang G. F. (2015). Genetic diversity and structure of Manila clam (Ruditapes philippinarum) populations from Liaodong peninsula revealed by SSR markers. Biochem. Syst. Ecol. 29, 116–125. doi: 10.1016/j.bse.2014.12.029
Palmer M., Pons G. X., Linde M. (2004). Discriminating between geographical groups of a mediterranean commercial clam (Chamelea gallina (L.): Veneridae) by shape analysis. Fish. Res. 67, 93–98. doi: 10.1016/j.fishres.2003.07.006
Rufino M. M., Vasconcelos P., Pereira F., Fernández-Tajes J., Darriba S., Méndez J., et al. (2013). Geographical variation in shell shape of the pod razor shell Ensis siliqua (Bivalvia: Pharidae). Helgoland Mar. Res. 67, 49–58. doi: 10.1007/s10152-012-0303-6
Satoshi W., Satoshi K. (2010). Relationships among shell shape, shell growth rate, and nutritional condition in the manila clam (Ruditapes philippinarum) in Japan. J. Shellfish. Res. 29, 353–359. doi: 10.2983/035.029.0210
Stanley S. (1970). Relation of shell form to life habits of the bivalvia (Mollusca). Geological Soc. Am. 125, 7-13. doi: 10.1130/MEM125-p1
Tan Y., Fang L., Qiu M., Huo. Z. M., Yan X. W. (2020). Population genetics of the Manila clam (Ruditapes philippinarum) in East Asia. Sci. Rep. 10, 21890. doi: 10.1038/s41598-020-78923-w
Tan Y., Qiu M., Li J. L., Zuo L. Y., Wu W. T., Huo Z. M., et al. (2021). Genetic diversity analysis of wild populations of Manila clam Ruditapes philippinarum from China, Japan and Democratic People’s Republic of Korea based on mitochondrial 16S rRNA gene sequence. J. Dalian Ocean University. 36, 127–134. doi: 10.16535/j.cnki.dlhyxb.2020-015
Wang S. L., Xu X. H., Tu K., Liu Z. H., Zhang T. S., Wu B., et al. (2022). Effects of shell morphology on the weight traits of manila clam (Ruditapes philippinarum) in different geographical populations. Prog. Fishery Science. 44, 142–154. doi: 10.19663/j.issn2095-9869.20220412001
Wu Y. P., Yao G. X., Chen A. H., Zhang Z. W. (2011). Multivariate morphometric analysis of two species of Meretrix, with notes on Japanese Meretrix lusoria’s validity. J. Fisheries China. 35, 1410–1418. doi: 10.3724/SP.J.1231.2011.17435
Xu F., Liu X., Zhang G. F. (2007). Comparison of two methods to measure the internal shell cavity volume of oyster. Mar. Sci. 31, 15–19. doi: 10.3969/j.issn.1000-3096.2007.07.004
Yan X. W., Zhang G. F., Yang F., Liang J. (2005). Biological comparisons between Putian population and Dalian population of manila clams Ruditapes philippinarum. Acta Ecologica Sinica. 25, 3329–3334. doi: 10.3321/j.issn:1000-0933.2005.12.031
Yokogawa K. (1998). Morphological variabilities and genetic features in Japanese common clam Ruditapes philippinarum. Japanese J. Malacology. 57, 121–132.
Yu W. H. (2022). Analysis of the shell characteristics of Ruditapes philippinarum in different geographical regions along the coast of Shandong Province. Shanghai Ocean University. Master’s dissertation.
Zhang J. H., Fang J. G., Tang Q. S. (2005). The contribution of shellfish and seaweed mariculture in China to the carbon cycle of coastal ecosystem. Adv. Earth science. 20, 359–365. doi: 10.3321/j.issn:1001-8166.2005.03.014
Zhang Y. H., Yan X. W., Yang F., Zhang G. F. (2008). Comparison of growth and development of two shell shape lines of Dalian population Manila clam. Acta Ecologica Sinica. 9, 191–197. doi: 10.3321/j.issn:1000-0933.2008.09.022
Keywords: Ruditapes philippinarum, geographical population, shell shape, polymorphism, germplasm
Citation: Huo Z, Wang Z, Li D, Liu K, Li X, Fang L and Yan X (2024) Shell shape polymorphism analysis of the Manila clam Ruditapes philippinarum across different geographical populations in China. Front. Mar. Sci. 11:1328752. doi: 10.3389/fmars.2024.1328752
Received: 16 January 2024; Accepted: 19 March 2024;
Published: 22 April 2024.
Edited by:
Jinghui Fang, Chinese Academy of Fishery Sciences (CAFS), ChinaReviewed by:
Xiaoting Huang, Ocean University of China, ChinaLiqiang Zhao, Guangdong Ocean University, China
Copyright © 2024 Huo, Wang, Li, Liu, Li, Fang and Yan. This is an open-access article distributed under the terms of the Creative Commons Attribution License (CC BY). The use, distribution or reproduction in other forums is permitted, provided the original author(s) and the copyright owner(s) are credited and that the original publication in this journal is cited, in accordance with accepted academic practice. No use, distribution or reproduction is permitted which does not comply with these terms.
*Correspondence: Lei Fang, ZmFuZ2xlaTIwMTRAZGxvdS5lZHUuY24=
†These authors have contributed equally to this work and share first authorship