 Thomas Tothill
 Jessica J. Meeuwig
 Sean van Elden
- 1Marine Futures Lab, School of Biological Sciences, University of Western Australia, Crawley, WA, Australia
- 2Oceans Institute, University of Western Australia, Crawley, WA, Australia
Knowledge of platform ecology is necessary to best inform decommissioning practice. Remotely operated vehicle (ROV) video is often collected during standard industry operations and may provide insight into the marine life associating with offshore platforms, however, the utility of this video for ecological assessments remains unclear. Archival ROV video surveys at the Wandoo oil platforms on Australia’s North West Shelf was evaluated for its utility, with only 4.9% of imagery usable for standardised ecological studies. Based on the subset of usable ROV video, the influence of depth and structural complexity on attributes of the fish assemblage on the Wandoo oil platforms was examined. Vertical ROV transects on three vertical shafts on the Wandoo platforms were stratified into 10 m depth strata from 0 to 50 m, with 111 fish taxa from 25 families identified and counted across all depth strata. At both platforms, taxonomic richness and abundance was significantly highest in shallow regions and declined with depth. Small reef fish were predominantly associated with structurally complex habitat in shallow regions (<22 m), whilst large demersal species dominated below 32 m. Future decommissioning policy in Australia should consider the vertical fish distributions and the importance of shallow sections of platforms. Finally, the dearth of usable video was due to the haphazard method of collection and it is recommended that future surveys should be conducted according to scientific standards to ensure greater utility of the video for both industry use and scientific research.
1 Introduction
The decommissioning of more than 12,000 existing offshore oil and gas platforms (Ars and Rios, 2017) in the coming decades is inevitable. International guidelines set by the 1982 United Nations Convention on the Law of the Sea (UNCLOS) and the 1996 Protocol to the London Dumping Convention (London Protocol) regulate the disposal and dumping of artificial structures at sea and favour the complete removal of offshore platforms and their supporting infrastructure. There is, however, a growing interest in alternative decommissioning methods, as the addition of such large-scale marine infrastructure on ocean seabeds may have both positive and negative impacts on the local and regional marine ecology. Understanding the potential effects of various decommissioning scenarios on the marine life that inhabits these structures is therefore an important consideration in the decision-making process.
The effectiveness of offshore platforms acting as artificial habitats is an area of ongoing discussion. A range of sessile marine organisms, such as algae, coral, anemones and sponges, colonise the sub-surface infrastructure of offshore platforms over their decades-long lifespan and provide habitat and food for a variety of marine fauna (Forteath et al., 1982; Todd et al., 2019; Todd et al., 2021). The degree to which offshore artificial structures enhance ecosystem function, primarily secondary (fish) production rather than simply attracting fish from nearby natural reefs, remains a key unresolved issue. It is likely that most artificial reefs both attract and produce fishes (Love et al., 2006), with some Californian oil and gas platforms being shown to be among the most productive marine fish habitats globally (Claisse et al., 2014). The high vertical relief of offshore platforms creates a complex midwater habitat distinct from that of many natural reef systems, providing a large amount of habitat for juvenile and adult demersal fishes over a relatively small footprint of seafloor (Love et al., 2006; Love et al., 2012; Claisse et al., 2014). Knowledge on the degree to which offshore platforms enhance ecosystem function in other locations remains in its infancy and may require assessment on a case-by-case basis.
Some nations recognise the potential positive ecological impacts of active offshore platforms and practice in situ decommissioning. The rigs-to-reef (RTR) program in the United States is a commonly cited example of in situ decommissioning, whereby obsolete structures are repurposed as artificial reefs to create benthic habitat, enhance biological activity, and avoid the loss of habitat that has accrued on the structures over the decades they were in place (Macreadie et al., 2011; Claisse et al., 2014; Fowler et al., 2015). The most common RTR technique is partial removal or ‘topping’, whereby the top 26 m of structure is removed for navigational safety (Claisse et al., 2015). Other RTR options, such as leaving the rig in place, ‘toppling’ the structure on its side, or relocation of the entire structure to another location, are also considered (Schroeder and Love, 2004; Macreadie et al., 2011). ‘Topping’ of Californian oil platforms can retain over 80% of the existing biomass and secondary production (Claisse et al., 2015) and is therefore considered a viable alternative. The vertical distribution of fishes on offshore platforms and potential effects of differing decommissioning scenarios in other locations is relatively unknown.
A challenge in understanding the ecological function of offshore platforms is the lack of data. Targeted research can be expensive, however routine data collection during industry operations may contribute relevant information with regard to platform ecology. A wealth of video footage is collected by remotely operated vehicles (ROV) during industry-related operations, such as cleaning protocols, conductivity assessments and targeted maintenance inspections. The ecological value of ROV video, which is often collected haphazardly, remains unclear (Macreadie et al., 2018; McLean et al., 2020). Several studies have opportunistically harnessed ROV footage used in routine oil and gas platform inspections for scientific purposes, both for determining marine growth (Gass and Roberts, 2006; van der Stap et al., 2016; Thomson et al., 2018) and examining fish assemblages on and around offshore platforms (Pradella et al., 2014; Sih et al., 2022) and pipelines (McLean et al., 2017; Bond et al., 2018; McLean et al., 2022b; Ierodiaconou et al., 2023). Challenges with haphazard data collection and poor video quality were common among studies, however scientific advances were made in each case. Nevertheless, there is a need to systematically evaluate the utility of video archives collected by oil and gas companies with respect to their potential value as a resource for ecological studies.
Australia has a large offshore oil and gas sector with approximately 136 fixed facilities (Department of Industry Innovation and Science, 2018). The North West Shelf (NWS) of Western Australia is the nation’s largest oil and gas precinct, contributing ~70% of Australia’s petroleum production (Department of Industry Innovation and Science, 2017). Offshore oil and gas production in Australia is relatively ‘young’ compared to that in the northern hemisphere, however production has been declining and the nations decommissioning liability predicted to reach USD $40.5 billion over the next 30 years (National Energy Resources Australia, 2021). Complete removal of all supporting structures is favoured in Australia (National Offshore Petroleum Safety and Environmental Management Authority, 2017), however policy on in situ decommissioning is under consideration (Taylor, 2020). Given the scale of decommissioning required in Australia in coming decades, understanding the ecological role of offshore platforms is necessary to best inform future decommissioning policy. In particular, understanding the vertical ecology of active platforms is of critical importance given that in situ methods often involve the removal of a substantial portion of the platform’s depth profile.
This study utilised data from two oil platforms to (1) evaluate the utility of industry collected ROV video to ecological studies and (2) determine how taxonomic richness, abundance, fish sizes and assemblage structure of fish populations vary with depth and structural complexity on two oil platforms. The two platforms are situated on Australia’s NWS and are used as a case study for determining the vertical distributions of fish and spatial heterogeneity between platforms in close proximity. A stringent scoring system is used to test the ecological value of industry ROV video and recommendations are made to improve future video collection methods. Using industry-derived vertical ROV video transects, the effect of depth and structural complexity on fish assemblages associated with platforms on the NWS is assessed.
2 Methods
2.1 Site description
The platforms for this study operate within the Wandoo oilfield, located on the NWS approximately 75 km north-west of Dampier, Western Australia (Figure 1). Mean water depth in the Wandoo oilfield is 54 m and the surrounding benthic environment is comprised of predominantly soft sand and clay sediments, with the nearest natural reef being ~23 km west of Wandoo (McLean et al., 2017; van Elden et al., 2022). Production is via two separate platforms, Wandoo A and Wandoo B, located 1.7 km apart (Figure 2). Wandoo A was installed in 1993 and is an unmanned monopod wellhead platform with a single vertical shaft 2.5 m in diameter that supports a helideck and five production wells. The Wandoo B processing facility was installed in 1997 and consists of four shafts supported on a concrete gravity structure (CGS). The CGS is comprised of a rectangular base caisson that rises 17 m from the seafloor and is 114 m x 69 m in length and width. Each of the four shafts is 11 m in diameter and extends 37 m above the caisson roof to the sea surface. Oil produced from Wandoo A is piped to the CGS storage facilities supporting Wandoo B, then offloaded via a flexible pipeline to a catenary anchor leg mooring (CALM Buoy) 1.2 km north of Wandoo B. Oil is transferred to export tankers via a floating hose connected to the CALM Buoy rather than making contact with the platforms. Following national regulations, a 500 m vessel exclusion zone surrounds all structures (Kashubsky and Morrison, 2013).
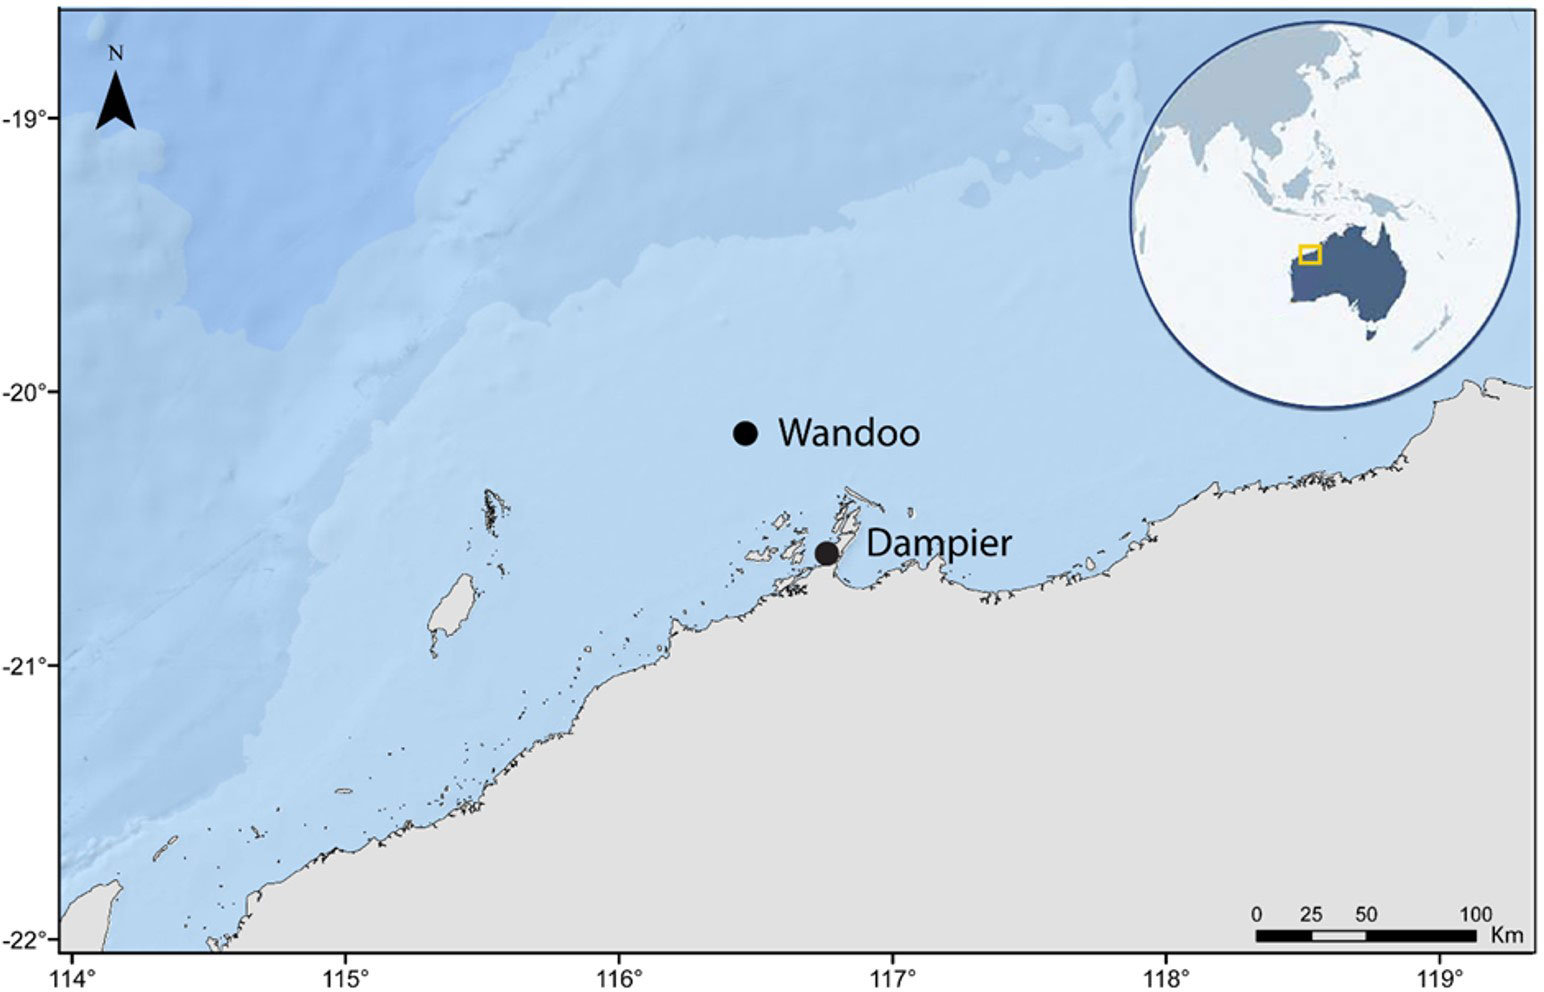
Figure 1 Location of the Wandoo oilfield on the North West Shelf of Western Australia.
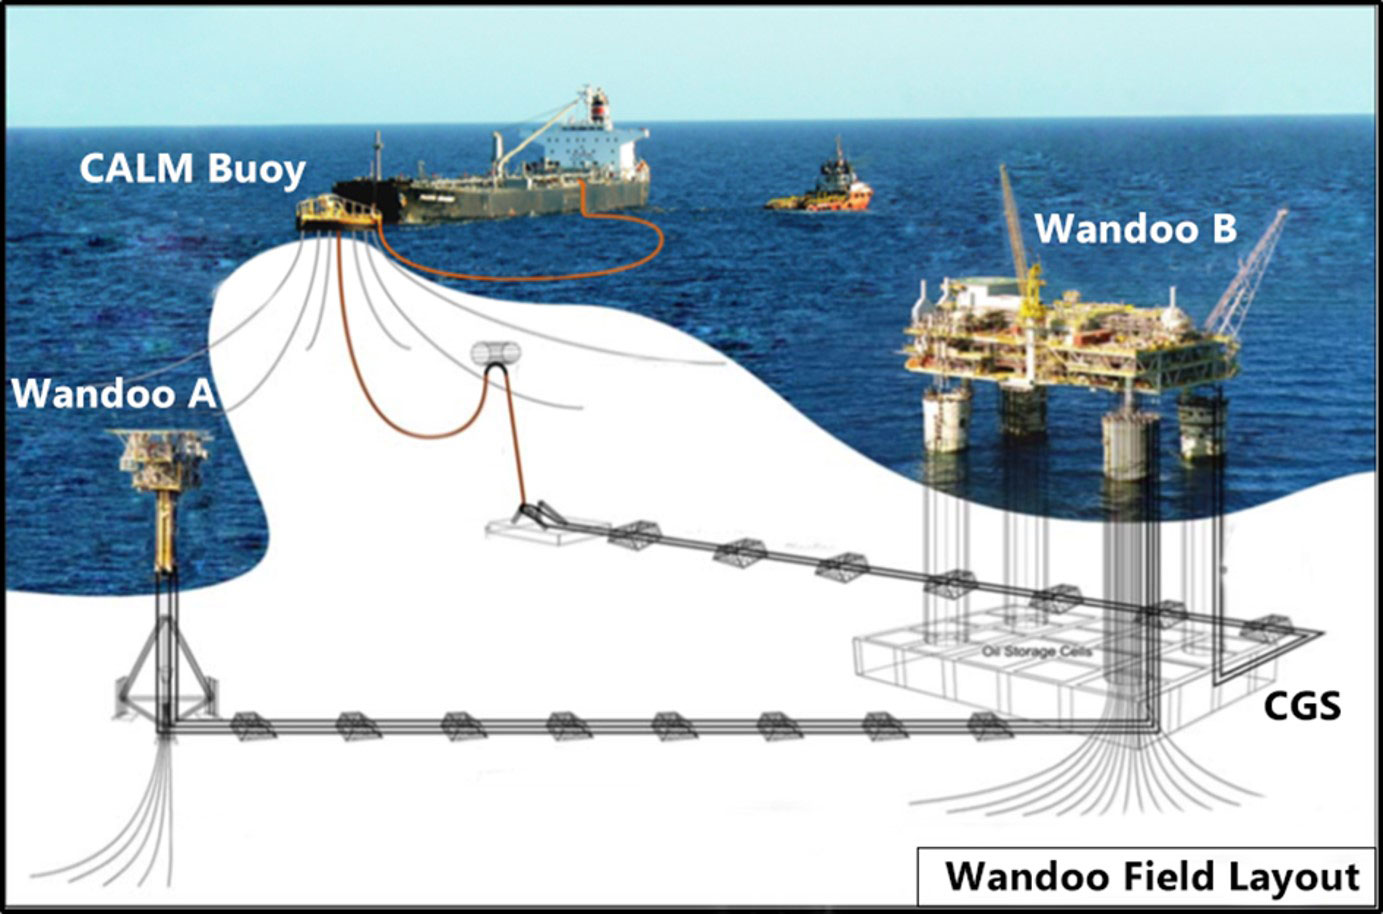
Figure 2 Wandoo oilfield schematic adapted from Vermilion Energy (2019). Wandoo A is a single shaft monopod and Wandoo B is a four-shaft facility supported on a concrete gravity structure (CGS). Oil is offloaded from Wandoo B to export tankers via the CALM Buoy. Not to scale.
2.2 ROV video selection and utility
ROV video from routine surveys conducted in 2007, 2008, 2011 and 2015 was made available for analysis by Vermilion Oil and Gas Australia (VOGA, Table 1). Surveys varied within each year depending on the task, ranging from cleaning protocols and conductivity assessments to targeted structural inspections and general environmental surveys. A total of 1521.16 gigabytes (GB) of video targeting structures on Wandoo A and Wandoo B was provided, excluding all surveys of the caisson walls, caisson roof and CALM Buoy (Table 1). The ROV video interface included the date and time of recording, information on orientation, pitch and roll of the ROV and a live depth reading in metres to one decimal place. White lights were used consistently across surveys and a 50 mm dual-beam laser scale was intermittently used in some videos.
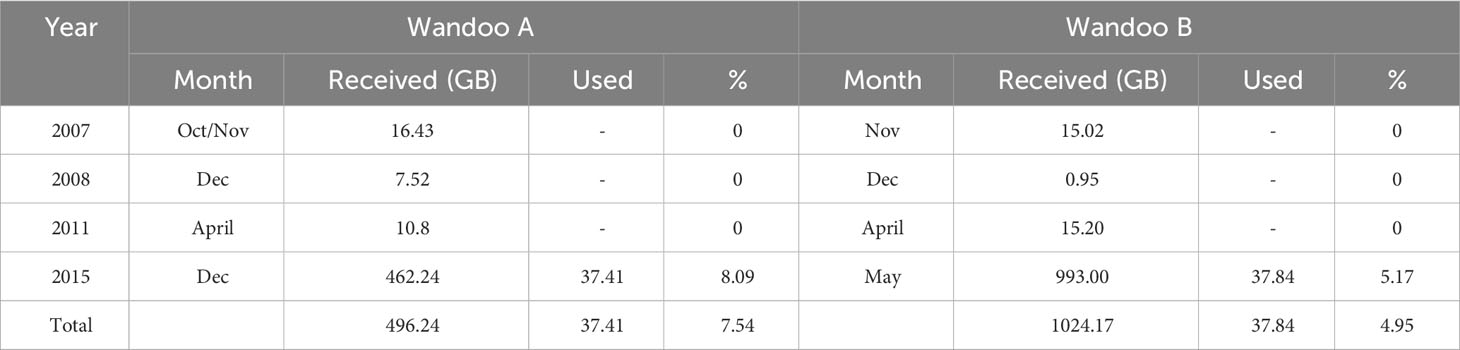
Table 1 The years of ROV surveys relevant to structures at Wandoo A and Wandoo B, with the month the survey took place and the amount of ROV video received and used in gigabytes (GB) from each year and the percentage (%) totals.
The ROV videos were reviewed following the scoring system outlined in van Elden et al. (2020) to standardise the evaluation of the non-scientifically collected footage. Videos assessed as useful for analysis must (1) follow the shaft or structure of interest in a distinct vertical transect, either descending or ascending, (2) have ≥ 5 m visibility, (3) be slow moving (< 0.5 m/s, McLean et al., 2019) to allow identification of fish species at each depth frame with no speed-blur and (4) have the shaft/structure take up between 60-80% of the field of view (FOV). Gass and Roberts (2006) noted differences in ROV footage that was collected in a spiralling fashion down the shafts to those that were surveyed on only one side, thus all video transects must maintain a consistent orientation and not vary from the original orientation by more than 90° either side. All footage should also be collected during daylight hours to limit diel influences on fish assemblages (Bond et al., 2018).
The utility of industry collected ROV video for scientific purposes was assessed by comparing the amount of video received in GB to the amount assessed as usable for analysis following the scoring system. The amount of video that passed each step of the scoring system was calculated to determine the primary reasons for lack of usability and what can be improved in future surveys, with results presented in a flow chart. The time taken to analyse the ROV video archives was also calculated, from the data mining stage to the video analysis stage.
2.3 Ecological analysis of useful video
A preliminary assessment indicated that only videos from 2015 surveys met the requirements of the scoring system. Consequently, ROV video records from three separate shafts, Wandoo A (WNA), Wandoo B shaft 1 (WNB1) and Wandoo B shaft 3 (WNB3), were selected for analysis of fish assemblages. All shafts had three replicate video transects available in the ROV archives. Vertical transects at WNA extended the full 54 m depth profile from surface to seafloor, whilst transects at WNB1 and WNB3 extended to 37 m from the surface to the caisson roof. The bottom 17 m that encompassed the walls of the caisson were excluded from analysis due to the absence of vertical ROV surveys of this structure.
Following van Elden et al. (2020), each transect was stratified into 10 m depth strata along the shaft (2-11.9 m, 12-21.9 m, 22-31.9 m, 32-41.9 m, 42-51.9 m) and sampled in a vertical video transect. Within each 10 m depth strata, 20 individual frames at random depth points at which the video was paused was selected and formally analysed to identify fish species. Subsampling by frame reduced the risk of speed bias, whereby transects conducted at slower speeds may have a greater number of fish visible. All videos were converted to .mp4 format in the highest possible resolution (1920 x 1080 pixels and 24 frames per second) using Adobe Media Encoder (Adobe, 2019). Video analysis was completed using EventMeasureTM (SeaGIS Pty Ltd, 2017). Fish were identified to the lowest taxonomic level possible. Where individuals could not reliably be identified to species they were identified to genus or family. When clear morphological differences were present between adults and juveniles, individuals were appropriately classified to life history stage. Abundance was estimated for each taxon as the maximum number observed in a frame across each depth stratum.
Habitat was characterised by the structural complexity of hard substrate provided by the platform shafts. Access ladders, production pipelines, export risers, firewater pumps, conductors and substructure base supports were present across all three shafts and added varying degrees of structural complexity at different depths. An ordinal scale of increasing structural complexity was established, ranging from 0 being the least complex to 3 being the most complex. The scale included: 0 = bare shaft with no parallel or horizontal support structures; 1 = bare shaft with a parallel riser, pipeline or conductor, but no horizontal supports in the field of view; 2 = shaft with a small-moderate sized refuge attached, such as a hollow flange or dished conductor guide, but no parallel structures; 3 = shaft with a parallel riser and horizontal support structure or small-moderate refuge. A complexity score was assigned to each frame.
2.4 Data preparation
A number of fish assemblage attributes were calculated from the data generated by the image analysis. Taxonomic richness and total abundance were calculated as the sum of all taxa and individuals on a given frame respectively, with the means per strata then calculated.
Length measurements were not directly available from the video analysis as the single camera on the ROVs meant that stereo length measurements could not be taken and the dual-beam laser was used infrequently. The common length for each species or genus as reported in FishBase (Froese and Pauly, 2019) was thus used as a proxy for in situ lengths to determine variation in the size of species, rather than individuals (Supplementary Table 2). Common lengths for each family were calculated as 75% of the maximum length for the family listed in Kulbicki et al. (2005), based on the ratio of common length to total length of ~75% (Meeuwig, Unpublished Data). Juveniles were excluded from the length data.
Mean values were calculated for taxonomic richness, abundance, length, depth and structural complexity for each 10 m depth strata for each transect.
2.5 Statistical analysis
All univariate analyses were conducted in the R language for statistical computing (R Core Team, 2015) using the packages AER (Kleiber and Zeileis, 2008), nlme (Pinheiro et al., 2019) and multcomp (Horthorn et al., 2008). Mean abundance was log10 transformed to stabilise variance (Zar, 1999). Linear regression models predicting either mean taxonomic richness, abundance or length included depth, structural complexity and dummy variables distinguishing the three shafts, including all interactions, as predictor variables. Model reduction was conducted by first considering interactions between the dummy variable and either depth or structural complexity. The interaction with the highest p-value greater than 0.05 was then removed and the model was rerun. Consideration was then given to the remaining interaction and the continuous variable associated with the removed interaction, with the term with the highest p-value greater than 0.05 also removed. This process was repeated until only significant variables or variables associated with significant interactions were retained. Following the development of results of the full model, individual regressions predicting either mean taxonomic richness, abundance or length were run on each shaft and included depth as the only predictor variable as this was the variable of primary interest. Depth distributions were plotted and trend lines were fitted to those that returned significant regression results. Quadratic and cubic terms were also considered.
Taxonomic assemblage data were analysed using a distance-based linear model (DistLM; Anderson et al., 2008) in the PRIMER v6 statistical software package (Clarke and Gorley, 2006) using the PERMANOVA + add-on (Anderson et al., 2008). Assemblage data were first square root transformed and the Bray-Curtis dissimilarities calculated. The same predictor variables and model reduction method as used in the univariate models were applied to the development of the most parsimonious model to predict assemblage composition. A distance-based redundancy analysis (dbRDA) plot was used to visualise a constrained ordination of the assemblage data. Species vectors were overlayed on the dbRDA plots with a Pearson’s correlation >0.4.
3 Results
3.1 ROV utility
Only 4.9% (75.25 GB) of the total 1521.16 GB of video was assessed as useful for the analysis of vertical distributions of fish. All the usable video was from the high definition 2015 ROV surveys (Table 1). The method of ROV video collection across all years was variable due to the primary purpose being standard industry operations, with the majority of videos (88.7%, 1350.16 GB) not following the platform shafts in a distinct vertical transect (Figure 3). For example, 100% of ROV surveys in 2008 and 2011 did not follow a distinct transect. Visibility was rarely an issue as water clarity was generally good, however ROV surveys in 2007 and 2008 were hampered by poor visibility in low light conditions at >40 m depth (Figure 3). Early ROV video archives (pre-2015) exhibited low resolution, usually 720 x 576 pixels, overexposure in sunlit regions, underexposure in shaded regions and high contrasts, a combination of which often created speed blur and limited visibility, even at low speeds. The FOV requirement of video also limited the use of video transects (19 GB), with some being too far or too close to the shaft (Figure 3). Nevertheless, the comparatively small amount of usable ROV video was sufficient for ecological analysis: the usable video provided full coverage (2 m below surface to the seabed) of the Wandoo A shaft, as well as full coverage (2 m below surface to the caisson roof) of two of the four Wandoo B shafts.
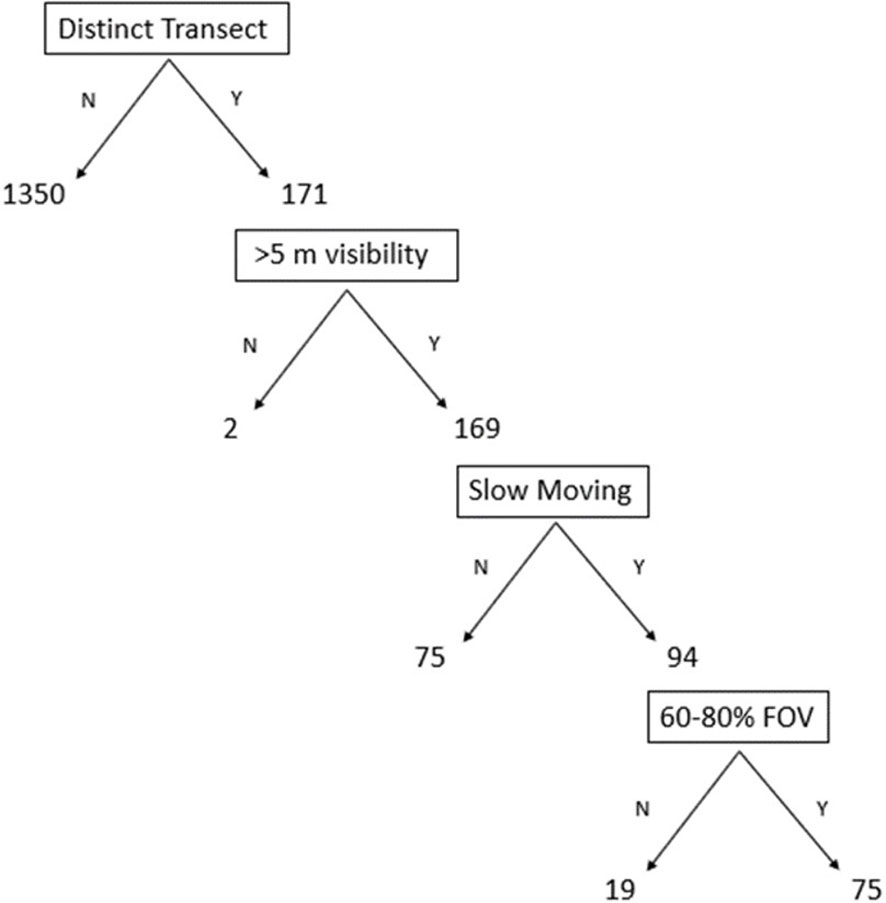
Figure 3 Flow chart of the amount of ROV video in gigabytes that was assessed as usable/unusable (Y/N) at each stage of the video scoring system. FOV, Field of view.
3.2 Attributes of the fish assemblage
A total of 111 taxa of fish from 25 families was recorded from the vertical ROV transects across all shafts in 2015. Unidentified clear larvae were also recorded at WNA. The most abundant taxa across all shafts and depths were herring (Clupeidae sp.) and damselfish (Pomacentridae spp.), comprising 39.7% and 28% of all individuals respectively. Herring scad (Alepes vari; 5.6%), luminous cardinalfish (Rhabdamia gracilis; 5.3%), regal demoiselle (Neopomacentrus cyanomos; 3.8%), ninespine batfish (Zabidius novemaculeatus; 3%) and threespot humbugs (Dascyllus trimaculatus; 2.6%) were also commonly seen on all transects.
Secondary level predators (trophic level 3-3.9) comprised 57% of the total taxa observed, whilst herbivorous fish (trophic level 2-2.9) and tertiary predators (trophic level 4-4.9) comprised 24% and 19% of observed taxa respectively (Supplementary Table 2). Two observed species, rankin cod (Epinephelus multinotatus) and crimson snapper (Lutjanus erythropterus), are listed as commercially targeted and directly reported on in the North Coast Demersal Scalefish Fishery (Newman et al., 2023). Both species were observed across all depth strata and were present at WNA and WNB3, whilst only the rankin cod was observed at WNB1. Only two species observed, the golden trevally (Gnathanodon speciosus) and rankin cod (E. multinotatus), are reported as recreational boat-based target species (Ryan et al., 2022). The frostback rockcod (Epinephelus bilobatus) and West Australian chromis (Chromis westaustralis) are endemic to northwestern Australia (Froese and Pauly, 2019) and were observed on all shafts except WNA at depths <20 m, except for a single frostback rockcod at 34.2 m. The tawny nurse shark (Nebrius ferrugineus) was the only observed taxa listed as ‘Vulnerable’ on the IUCN Red List (Supplementary Table 2), observed at 14.7 m on WNB1.
Mean taxonomic richness per frame across all depth strata at WNA was 6.41 ± 0.52 SE, whilst WNB1 and WNB3 observed an average of 6.66 ± 0.52 SE and 2.59 ± 0.3 SE taxa per frame across all depths respectively. Over 73.4% of variation in observed mean taxonomic richness was explained by predictor variables in the regression model (Table 2). Mean taxonomic richness was greatest at shallow portions of both platforms and declined significantly with depth (P < 0.001), however, the rate of this decline was dependent on the shaft and the level of structural complexity (Table 2). Individual regressions predicting mean taxonomic richness with depth as the only predictor variable demonstrate that the decline in richness was only significant at WNA (P = 0.001, Supplementary Table 1). Regions of high structural complexity harboured more species (P = 0.028, Table 2), driven primarily by high numbers of small fish seeking refuge in sections with multiple risers and supports. The significantly lower richness observed at WNB3 is likely due to the lack of complex structure attached the shaft when compared to WNA and WNB1.
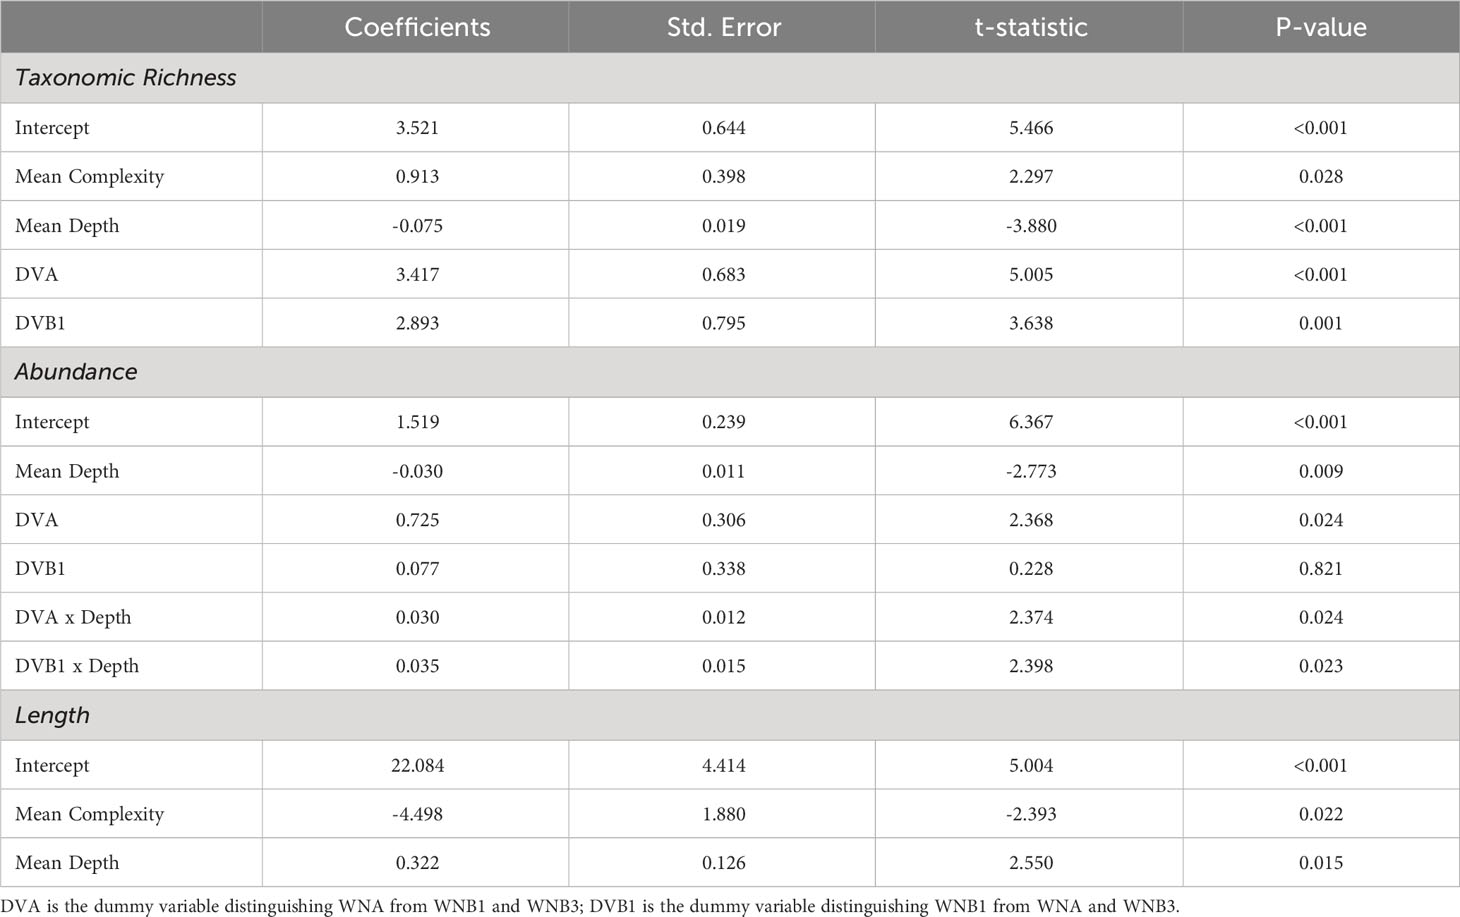
Table 2 Regression results based on the most parsimonious model predicting mean taxonomic richness, mean log abundance and mean length (cm).
Mean fish abundance per frame across all depth strata at WNA was 320.11 ± 86.73 SE, whilst WNB1 and WNB3 observed an average of 68.31 ± 10.23 SE 19.18 ± 4.69 SE individuals per frame across all depths. Over 76% of variation in observed mean abundance was explained by predictor variables in the regression model (Table 2). Overall, abundance significantly declined with depth (P = 0.009), however the extent of decline varied between shafts (Table 2). Both WNA and WNB3 demonstrated significant declines in abundance with depth until ~40 m (P = 0.021 and 0.005 respectively, Supplementary Table 1), although there is a considerable spike in abundance at deep sections of WNA (Figure 4). This late spike is attributed to the high numbers of herring at depths below 42 m that were observed in all replicate transects. There was no significant change in fish abundance with depth at WNB1. Complexity had no detectable effect on abundance, likely due to a high number of mobile reef-associated species (e.g. Caranx sexfasciatus, Zabidius novemaculeatus) and pelagic species (e.g. Alepes vari, Clupeidae sp) being visible behind the shafts which did not appear to be influenced by small-scale structural complexity.
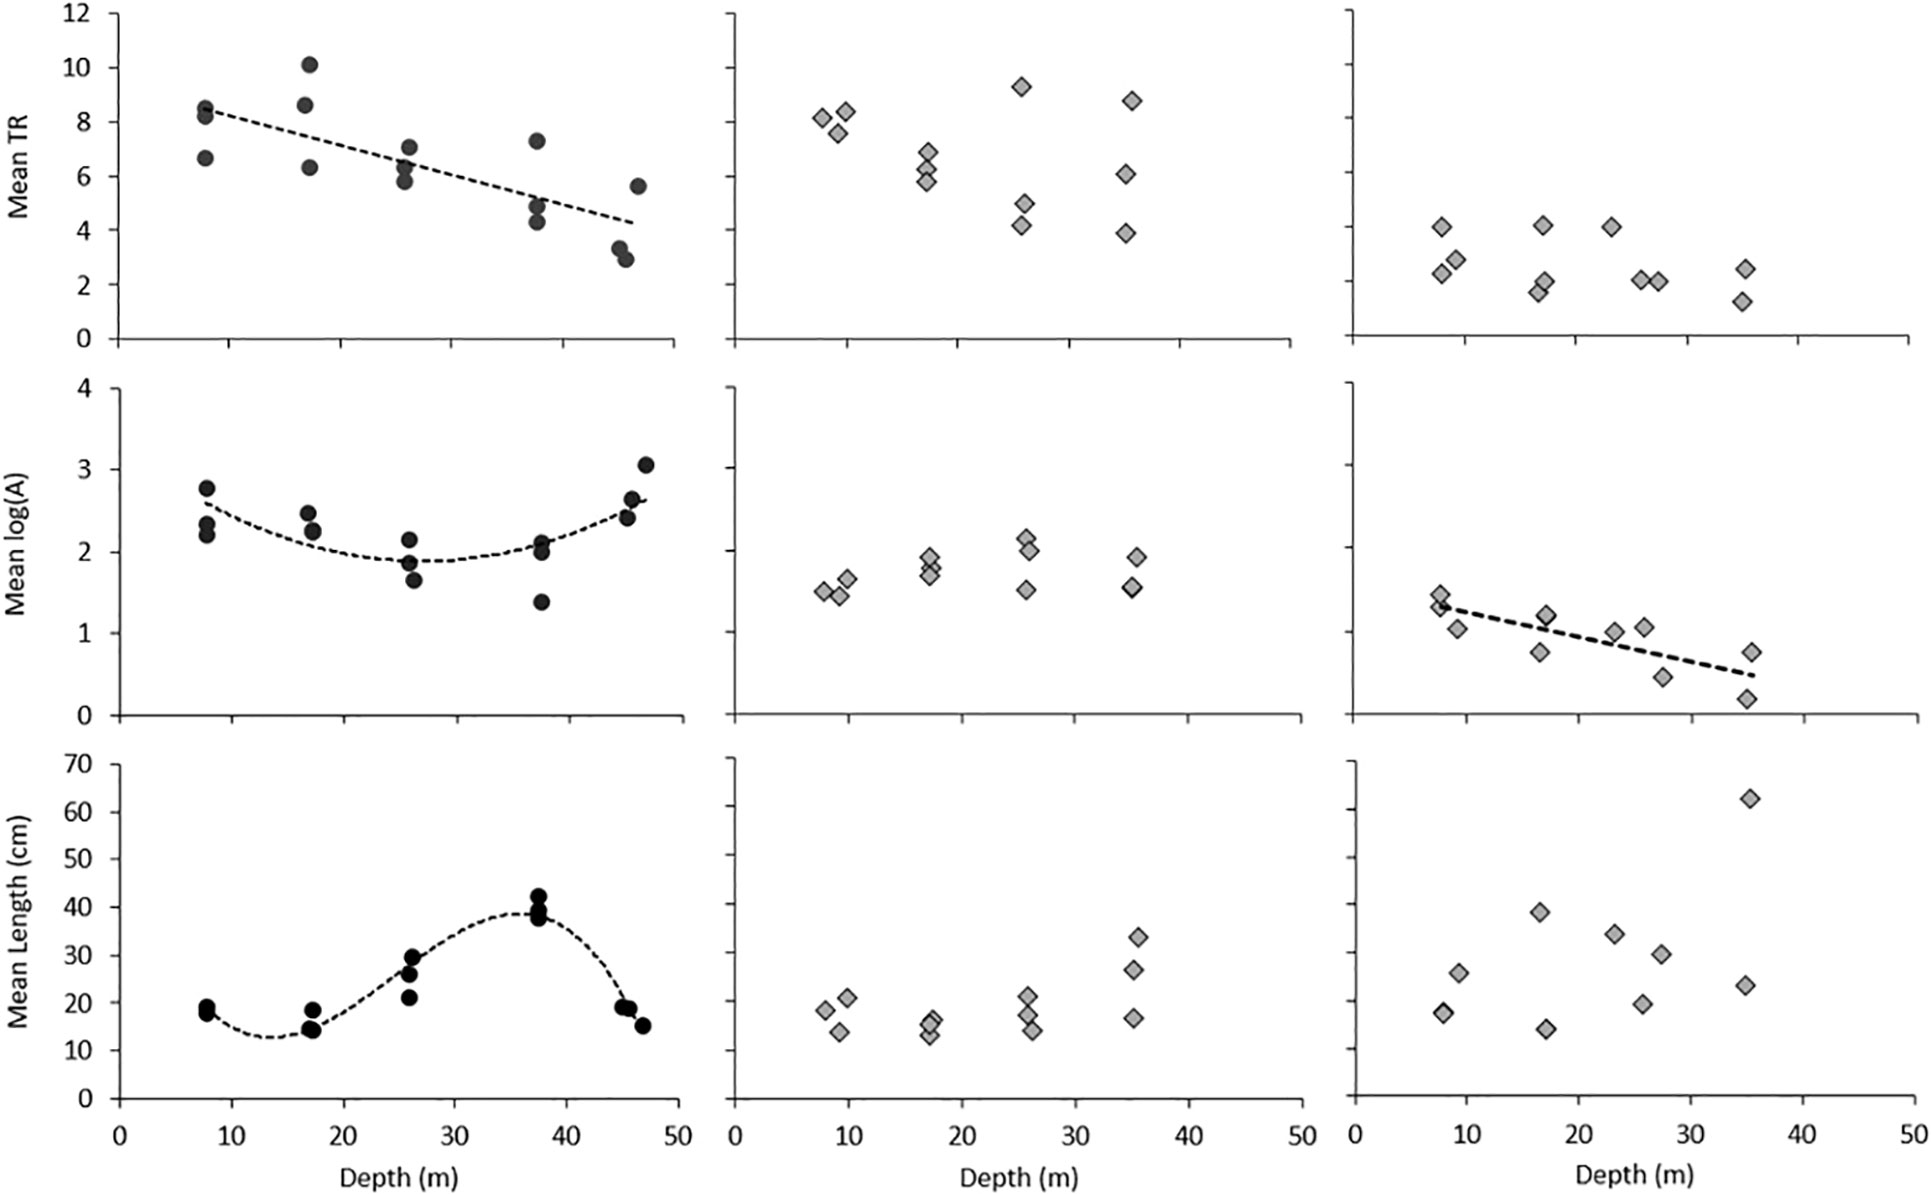
Figure 4 Trends in mean taxonomic richness (TR), mean log abundance (A) and mean estimated fish length (cm) with depth across shafts. Wandoo A = WNA, Wandoo B shaft 1 = WNB1 and Wandoo B shaft 3 = WNB3. Trend lines are displayed for all significant results.
Mean fish size significantly increased with depth (P = 0.015, Table 2), with larger-bodied predatory fish prevalent at deep sections of the platform. Individual regressions predicting fish size with depth shows that lengths at WNA follow a cubic polynomial form (P = <0.001, R2 = 0.93; Supplementary Table 1), with lengths peaking at ~40 m before dropping considerably at the base of the shaft (Figure 4). The drop in mean fish length at depths below 42 m is attributed the high numbers of herring represented in the late spike in abundance at WNA. Mean fish length at WNB1 and WNB3 demonstrated no significant change, however lengths did increase with depth. By contrast, fish lengths were significantly smaller with increased structural complexity (P = 0.022, Table 2), due to high numbers of small reef-associated fish seeking refuge in and around pipeline risers, support beams and flanges.
3.3 Taxonomic composition
The species assemblage structure was explained by a number of variables in the most parsimonious DistLM model (Table 3). Both depth and structural complexity had a significant effect (P = 0.001, Table 3) on the taxa present, however the effect depends on the shaft. Differences between shafts explained the greatest proportion of difference in assemblage structure, particularly between WNA and both Wandoo B shafts (WNB1 and WNB3, 15.4% of explained variation; Table 3). This effect is visible in the dbRDA ordination (Figure 5A), whereby distinct spatial separation between the shaft at Wandoo A (WNA) and those at Wandoo B (WNB1 and WNB3) are present. The first axis, dbRDA1, explains differences between shafts, whilst depth increases with positive values of dbRDA2 and complexity increases with negative values of dbRDA2 (Figure 5A). Depth and complexity were not correlated (R2 = -0.05).
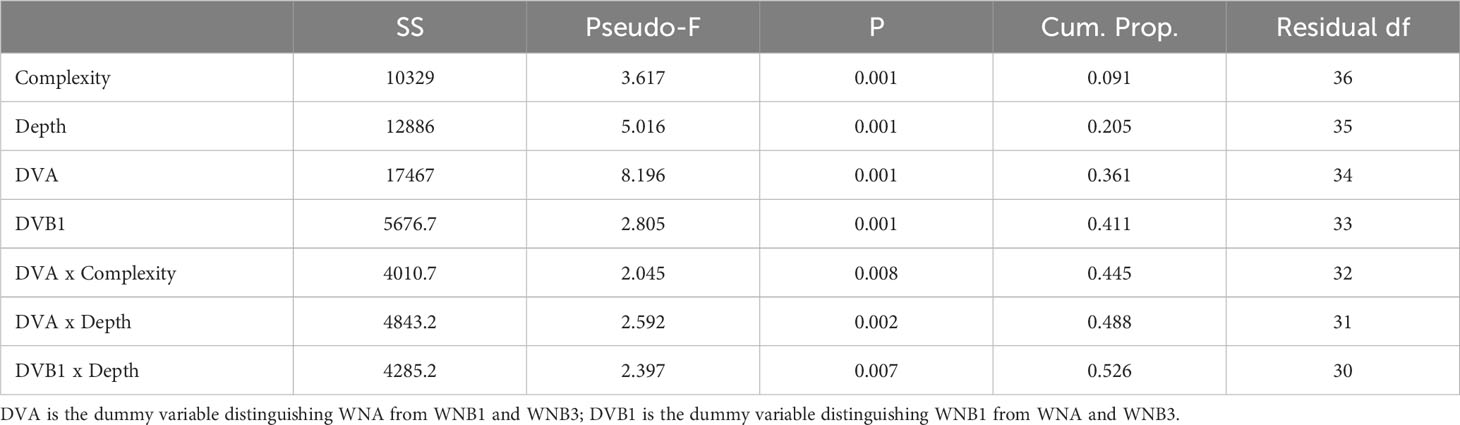
Table 3 DistLM results based on the most parsimonious model predicting species assemblage structure.
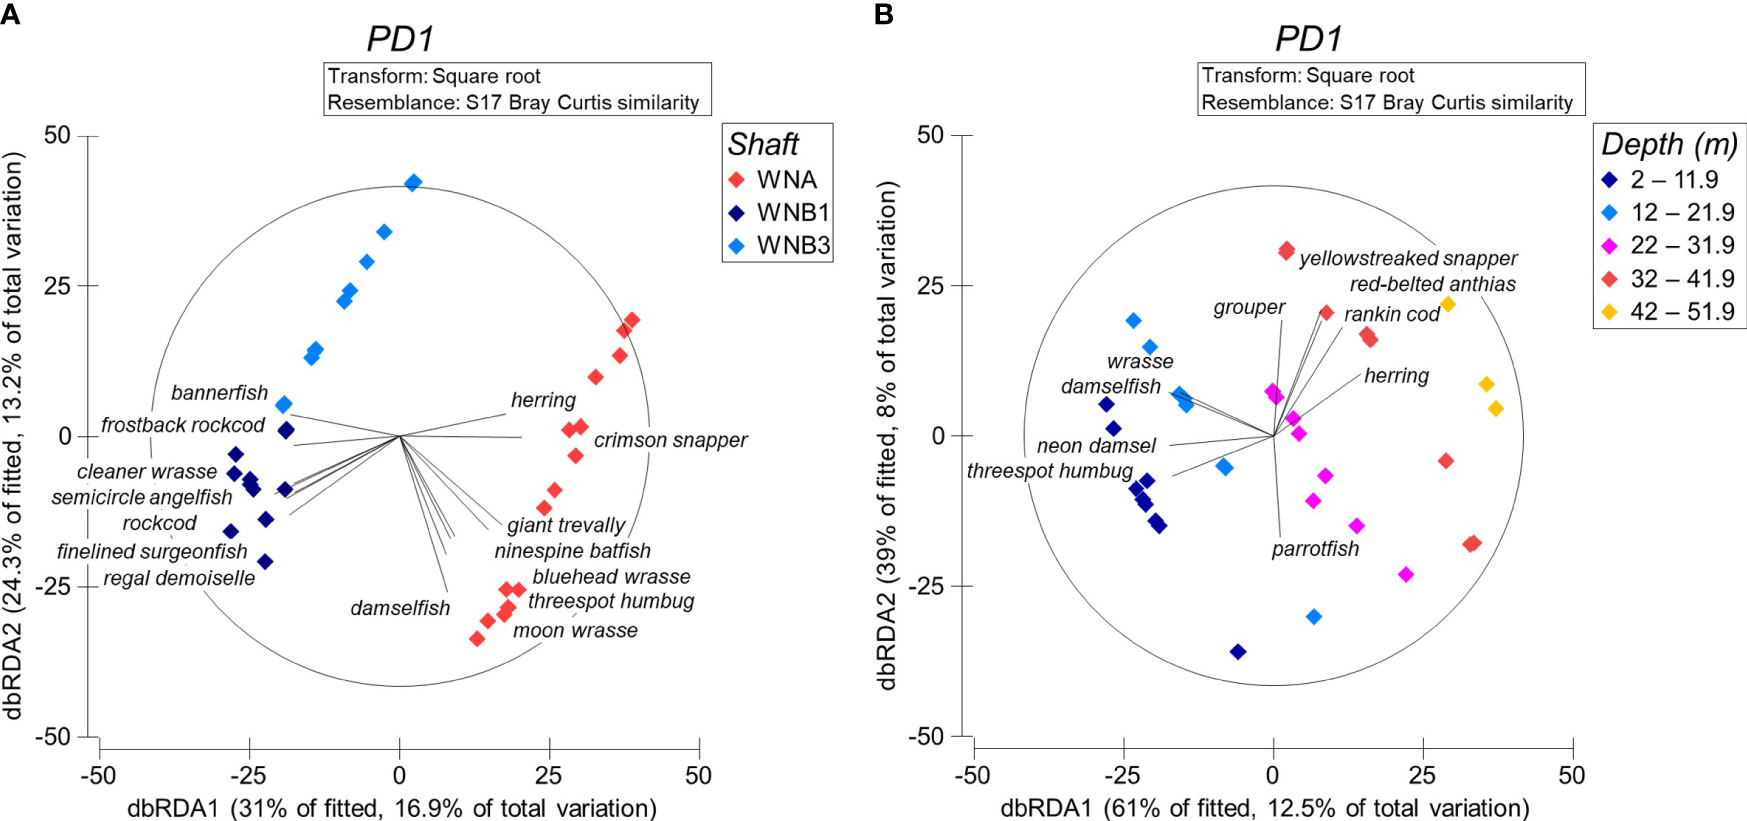
Figure 5 Distance-based redundancy analysis (dbRDA) ordination of the most parsimonious distance based linear model (DistLM) predicting fish assemblage structure by (A) shaft and (B) depth. Vectors are based on a Pearson’s correlation of R = 0.4.
WNA is characterised by a mix of larger mobile taxa and smaller reef-dependent fish, both of which are affected by depth and structural complexity. Smaller-bodied, low trophic level fish, such as the threespot humbug and bluehead wrasse (Thalassoma amblycephalum), were highly associated with shallower and more structurally complex habitats on WNA (Figure 5A; Supplementary Table 2). In contrast, larger, high trophic level species like giant trevally (Caranx ignoblis) and crimson snapper (Lutjanus erythropterus) were more common in moderate-deep and more open habitats. Significant numbers of highly mobile herring were also present at deeper sections of WNA.
The taxa associated with shafts on Wandoo B were predominantly reef-associated fish of varying size and trophic level (Figure 5A, Supplementary Table 2). Species ranged from smaller reef fish such as the regal demoiselle and blue-streak cleaner wrasse (Labroides dimidiatus) to larger predatory species such as the frostback rockcod (Epinephelus bilobatus). WNB3 had very low taxonomic richness and abundance and hence most fish associations were with WNB1. A tawny nurse shark (Nebrius ferrugineus), the largest species observed across all transects, was identified at WNB1 resting on a horizontal riser support beam at 14.7 m.
Clear distinctions in assemblage structure with depth across all shafts are visible when the dbRDA is ordinated by depth stratum (Figure 5B). Herbivorous reef-associated damselfish (Dascyllus trimaculatus, Pomacentrus coelestis), wrasse (Thalassoma sp.) and parrotfish (Chlororus sp.) species were characteristic of shallower portions of the platforms between zero and 22 m. Larger predatory species, such as yellowstreaked snapper (Lutjanus lemniscatus), rankin cod (Epinephalus multinotatus) and grouper (Epinephelus sp.), were highly associated with deeper sections of platforms below 32 m. The red-belted anthias (Pseudanthias rubrizonatus) and herring were also common at depths below 32 m.
A number of additional species were observed interacting with the structure but were not included during analysis. These species were often identified between two frames that were not at the required depth or during a period where the ROV veered from the standardised transect and therefore had to be excluded following the video scoring system. The species observed included multiple stripey snapper (Lutjanus carponotatus) at the base of all shafts, a Queensland grouper (Epinephelus lanceolatus) at 49 m at WNA, two individual blotched fantail rays (Taeniurops meyeni) on the caisson roof at WNB1, two carcharhinid sharks (Carcharhinus sp.) at 13 m at WNB1 and 34 m at WNB3, and two blacktip reef sharks (Carcharinus melanopterus) at 30 m at WNA.
3.4 Juveniles
Three species of fish were identified at juvenile life-stages based on morphological differences: threespot humbug, bluehead wrasse, and semicircle angelfish (Pomacanthus semicirculatus). All juveniles were observed at WNA except the semicircle angelfish (WNB1). The threespot humbug was the most frequently observed juvenile and occurred between 10.1-22 m depth, with a mean depth of 14.9 m. The greatest proportion of juveniles to adults was in depth strata 2 (12-22 m), whereby juveniles made up 17.8% of observations for the species. All threespot humbug juveniles were seen in groups of at least two and up to 16 individual juveniles in one frame, often mixed with adults of the same species. The bluehead wrasse was the second most frequently seen juvenile and was only observed in depth stata 2 between 13.2-14.6 m. In depth strata 2, juvenile bluehead wrasse comprised 21.9% of all observation for this species whose MaxN ranged from 14 to 26 individual juveniles in one frame. The single semicircle angelfish was observed at 34.1 m depth. A clear, unidentifiable larval-like juvenile (Juvenile spp.) was a potential fourth species and was observed at depths between 37.9-39.1 m on WNA. Almost all identified juveniles were associated with structurally complex portions of the platform (complexity score 2 and 3), with a mean complexity score of 2.26 for all juveniles. Unidentified juveniles were observed in schools of 29 to 76 individuals in any one frame.
Separate to the formal analysis, a juvenile red bass (Lutjanus bohar) was observed at 15 m depth on WNB1 between two depth frames and was therefore not included in the results. However, its presence does add information on the distribution of juvenile fish. Juvenile red bass, often mimicking Pomacentrids in the Chromis genus, was seen in close association with several West Australian puller (Chromis westaustralis), smoky puller (Chromis fumea), regal demoiselle, threespot humbug and a single tawny nurse shark. The structural complexity where the juvenile red bass was observed was score 3.
4 Discussion
4.1 ROV recommendations
This study represents an in-depth assessment of the utility of industry collected ROV video for ecological studies and, using a subset of usable ROV videos, provided insights into the vertical distributions of fish on the Wandoo platforms on the NWS. Only 4.9% of the ROV video archives could be used to understand the vertical distribution of fishes associated with the Wandoo platforms. These were exclusively from the high-definition imagery captured in 2015. The largest constraint was the lack of standardisation during ROV operation, with over 88% of video not being usable because the ROV did not follow the supporting structure in a defined transect. Video quality also hampered scientific utility, with surveys conducted pre-2015 exhibiting low resolution, overexposure in sunlit areas, underexposure in shaded areas and high contrasts.
Recommendations for future ROV campaigns based on the observations of the archival video utilised in this study have been collated to improve the utility of this resource for future research (Table 4). McLean et al. (2020) described modifications for both video collection methods (i.e. video quality and sampling design) and the addition of environmental and oceanographic sampling apparatus (i.e. CTD attachments, water and sediment samplers) on industry ROVs. Our recommendations are in relation to video collection methods and sampling design. We recommend additional transects specifically for research purposes as it is vital that changes to ROV sampling methods do not interfere with standard industry procedures.
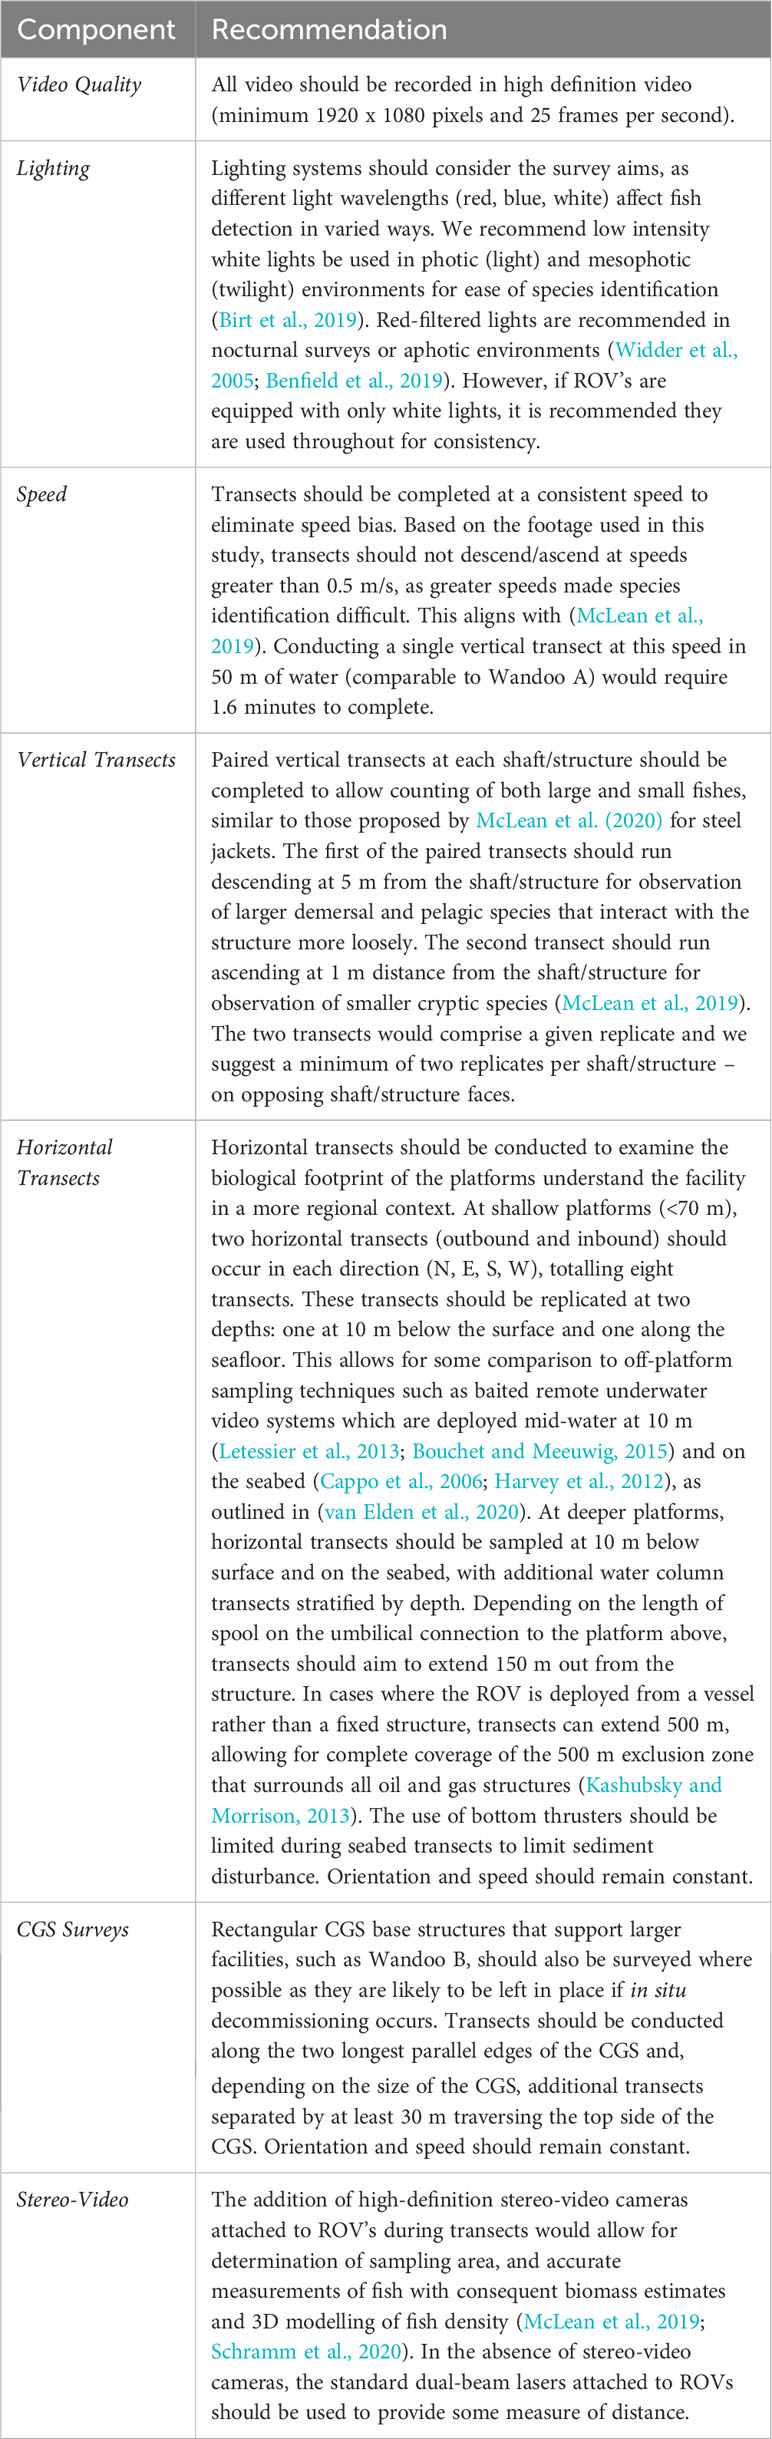
Table 4 Recommendations to future ROV survey methods to enhance scientific use based on the analysis of archival industry-ROV video provided by Vermilion Oil and Gas for this study.
Significant improvements can be made to ROV data collection methods so their scientific value is increased. Industry-science collaborations are an effective route to increasing the scientific value of footage (McLean et al., 2018; McLean et al., 2020). For these collaborations to be effective, however, ROV pilots and operators must be informed on the scientific requirements for statistical analysis. Scientists are rarely present during ROV surveys and hence guidelines, training programs and instructional videos that inform pilots on the scientific practice is necessary. The SERPENT (Scientific and Environmental ROV Partnership using Existing Industrial Technology) project has a long history of scientific partnership with industry operators in the Gulf of Mexico, however there is significant room for improvement. Greater collaboration in this area will also ensure a win-win approach whereby the scientific requirements neither interfere nor substantially add to the cost of ROV campaigns.
4.2 Distribution of fishes
Water depth is a significant influence on the distribution of fishes on vertical structures of the Wandoo platforms. The observed vertical gradient from the high number and abundance of small, low trophic level reef fishes, such as damselfish and wrasse, in the shallow portion of each shaft to larger predatory species like rankin cod and yellowstreaked snapper associated with structures below 32 m is common in natural reef systems (Friedlander and Parrish, 1998; Brokovich et al., 2008). The trends on the Wandoo platforms are similar to those on the nearby yet deeper (130 m) steel jacket Goodwyn Alpha production platform on the NWS, with abundance peaking in the shallow midwater habitat (25-50 m) and being lowest at depths below 100 m (McLean et al., 2019). It is possible, however, that surveying the caisson at Wandoo B would show an increase in richness and abundance at depth due to the size of this structure. The findings of this study contrast with those on oil platforms in other locations. For example, two steel jacket platforms in temperate Australia’s Bass Strait exhibit lowest taxonomic richness in shallow waters (0-15 m) and highest at depths below 60 m (Sih et al., 2022). Offshore platforms in southern California generally exhibit lowest fish densities in shallow portions of platforms (0-30 m) and increase significantly with depth (Love and Nishimoto, 2012; Claisse et al., 2015), which is due to assemblages being dominated by deeper-dwelling rockfish (Sebastes spp.; Love et al., 2006; Love et al., 2009; Love et al., 2012). It is therefore important to assess the characteristics and composition of taxa associating with oil and gas platforms on a case-by-case basis, particularly between platform type (CGS vs steel jacket) and region.
A greater number of taxa, particularly of smaller reef fish, were present in structurally complex portions of the platform where both vertical and horizontal structures were present. This is expected, as high diversity is often associated with marine habitats that provide highly complex hard substrate, particularly for small reef-fish (Friedlander and Parrish, 1998; Bonaca and Lipej, 2005; Wilson et al., 2012). Platforms with structurally complex midwater habitats in southern California have shown similar results, having higher species richness and higher densities of species typical of complex high-relief reefs (Love and Nishimoto, 2012; Love et al., 2019). The low level of taxonomic richness and abundance at WNB3 is a direct result of a lack of complexity, with the majority of transects traversing predominantly bare shaft. In contrast, WNA and WNB3 both observed a variety of smaller reef-associated species where risers and support crossbeams were present. The influence of complexity had little effect on abundance at WNA due to it being a comparatively small shaft of 2.5 m diameter compared to those at Wandoo B being 11 m diameter. It is therefore likely that fish abundance was not impacted by structural complexity at WNA for two reasons: (1) the comparatively smaller diameter provided less area for fish to flee for refuge as the ROV passed, thereby maintaining similar levels of fish abundance regardless of complexity; and (2) the lack of nearby structures, be it natural reef or other shafts as is present on Wandoo B, results in WNA acting like a fish aggregating device (FAD) for numerous mobile reef-associated and pelagic species (Franks, 2000), many of which were present behind the shaft in all transects and not influenced by the small-scale structural complexity on the shaft. Nevertheless, structural complexity is a key determinant of fish distributions on the Wandoo platforms, particularly for harbouring smaller species typical of rugose rocky reefs.
The presence of juvenile fish observed between 10 and 22 m at WNA provides some evidence that the shallow habitat of the Wandoo platforms may provide a nursery function for reef fishes. It is possible that reef-associated fish like threespot humbug and bluehead wrasse are self-recruiting to the shallow and midwater sections of the platform rather than dispersing to other habitats. Self-recruitment of coral reef fishes is relatively common, with up to 68% of damselfish juveniles in the Dascyllus and Pomacentrus genera self-recruiting to their natal population (Jones et al., 1999; Bernardi et al., 2001; Cuif et al., 2015). The lack of notable reef structure surrounding the Wandoo oilfield (~23 km) and relatively short post-settlement movements (<50 m) of small-reef dependent fish (Frederick, 1997; Turgeon et al., 2010) make it unlikely that juvenile damselfish are recruiting from surrounding natural environments and are likely being produced on the platform. It must be noted that the species had to recruit and/or migrate to the platform initially, however the extent of this at present is unknown. The observation of a juvenile red bass at 15 m indicates that the midwater habitat may serve a nursery function for larger demersal species as well, however further investigation is needed. The number of juveniles identified is a conservative estimate and it is likely that many juveniles, particularly those that do not display ontogenetic morphological changes, were marked as adults due to the absence of measurements.
A previous survey of the ecological halo around the Wandoo oilfield by van Elden et al. (2022) utilised alternative methodologies (stereo-baited remote underwater video systems) and captured a different species assemblage to those present in this study. 43% of the families observed directly on the platform in this study were shared with those found in the ecological halo around the platform (>50 m from the structure; van Elden et al., 2022), whilst only 16% of species were shared between surveys. Five families were observed solely on the ROV video transects (Apogonidae, Cirrhitidae, Clupeidae, Nomeidae, Zanclidae), all comprising of smaller-bodied species, whilst the families specific to the surrounding ecological halo were primarily sand-associated (Arridae, Pinguipedidae, Rhinidae, Synodontidae) or those comprising of large, mobile taxa (Carcharhinidae, Scombridae, Sphyrnidae, Stegostomatidae). The differences are due to the different habitat of locations surveyed and the methods used, but together inform future decommissioning research by providing a more holistic understanding of fish communities on and near these structures.
The distinct vertical gradient in fish assemblage attributes at both Wandoo platforms can inform future decommissioning policy. Under current legislation in Australia, complete removal of all structures is the most likely scenario; a process that will eliminate almost all associated marine life (Claisse et al., 2015; Pondella et al., 2015), particularly when surrounded by soft sediments. If in situ decommissioning of the Wandoo platforms is considered, such as toppling or topping (partial removal), then a considerable reduction in the number and types of fish species associating with the structure is expected. Toppling has been suggested to significantly alter platform community structure via removal of vertical complexity (Ajemian et al., 2015; McLean et al., 2022a). Topping (partial removal) of shallow-water platforms (30-80 m) in the US is commonly done at 26 m for navigational safety, a process considered relatively ‘low impact’, with up to 80% of biomass and 86% secondary production being retained post-removal (Carr et al., 2003; Claisse et al., 2015). This level of retention is unlikely the case on the Wandoo platforms, as the significantly higher number and abundance of predominantly small reef-associated species were distributed in the shallow portions of all shafts, much of which would likely be lost via topping. Furthermore, the two endemic species observed on the platform, the frostback rockcod and West Australian puller, were all present at depths <20 m (except a single frostback rockcod) and their preferred habitat would be lost via topping. The presence of two commercially targeted fishery species at the Wandoo platforms is common for offshore oil platforms in Australia and globally (Love et al., 2006; McLean et al., 2019), and their presence across all depth strata should be a consideration for future decommissioning. Larger demersal fish which associate with the bottom 20 m of all shafts, such as groupers and snappers, may be less affected. Consideration should be given to the possibility of leaving the Wandoo platforms standing upright, with topsides removed and navigational aids in place, as the shallow midwater habitat of the platform has higher ecological value than other parts of the vertical structures in terms of richness and abundance.
There were a number of constraints in this study. The haphazard nature of ROV video archives limited replication of transects for each shaft, however the limited data was still sufficient to provide insight into fish distributions on the Wandoo platforms. The lack of measurements due to the single camera and the use of common lengths as a proxy for in situ lengths limited accurate representation of fish size structure and life history stages across both platforms. Biomass distributions along the vertical gradient was not possible as a result and it is likely that juvenile species that do not display ontogenetic morphological differences were underrepresented. The FOV requirement, whereby the structure should take up 60-80% of the FOV, was not the most effective way of sampling two different sized structures. For structures at Wandoo A (2.5 m diameter) to comprise 60-80% of the FOV, the ROV does not require to be as far away from the structure as would be necessary at the wider shafts at Wandoo B (11 m diameter). Furthermore, WNA had considerable space between the main shaft and adjacent risers, allowing for many pelagic fish to be identified swimming in the water column behind the shaft and resulting in high abundance counts and a non-significant relationship with structural complexity. Marine growth assessments would further add to the influence of habitat complexity. Future research on the ecology of offshore platforms should aim for greater standardisation in methodology, with video transects being consistent in speed and distance from the structure.
5 Conclusion
This study utilises industry ROV video to analyse the vertical distributions of fish populations on the shafts of two offshore oil platforms in Australia. Using existing video archives collected during standard industry operations presents a resource that requires further utilisation for scientific purposes. Although only a small subset of video was usable, it was enough to provide novel insights into structure-fish associations on the vertical portions of the Wandoo oil platforms. Improvements can be made to future ROV surveys to align with standard scientific practice and increase the value of this footage for ecological research. Assessment of the historical ROV archives demonstrated the importance of vertical relief on the Wandoo oil platforms, with richness and abundance of fish being significantly greater in shallow midwater sections of the platforms, particularly of small reef fishes. Understanding the vertical ecology of platforms and the way structural complexity influences the distribution of fishes is crucial in the decommissioning decision-making process.
Data availability statement
The raw data supporting the conclusions of this article will be made available by the authors, without undue reservation.
Ethics statement
Ethical approval was not required for the study involving animals in accordance with the local legislation and institutional requirements because the data was observational only.
Author contributions
TT: Conceptualization, Data curation, Formal analysis, Investigation, Methodology, Software, Writing – original draft, Writing – review & editing. JM: Conceptualization, Methodology, Supervision, Writing – review & editing. SE: Conceptualization, Methodology, Writing – review & editing.
Funding
The author(s) declare financial support was received for the research, authorship, and/or publication of this article. Vermilion Oil and Gas Australia (Pty) Ltd. provided industry collected ROV video footage for analysis and funding for publication.
Acknowledgments
Our thanks to the Vermilion Oil and Gas Australia (Pty) Ltd. for their support of this project and providing industry collected ROV video footage for analysis.
Conflict of interest
The authors declare that the research was conducted in the absence of any commercial or financial relationships that could be construed as a potential conflict of interest.
The authors declare that this study received funding from Vermilion Oil and Gas Australia (Pty) Ltd. The funder was not involved in the study design, collection, analysis, interpretation of data, the writing of this article or the decision to submit it for publication.
The reviewer DM declared a shared affiliation with the authors to the handling editor at the time of review.
Publisher’s note
All claims expressed in this article are solely those of the authors and do not necessarily represent those of their affiliated organizations, or those of the publisher, the editors and the reviewers. Any product that may be evaluated in this article, or claim that may be made by its manufacturer, is not guaranteed or endorsed by the publisher.
Supplementary material
The Supplementary Material for this article can be found online at: https://www.frontiersin.org/articles/10.3389/fmars.2024.1328672/full#supplementary-material
References
Adobe (2019) Adobe Media Encoder. Available at: https://www.adobe.com/au/products/media-encoder.ht.
Ajemian M. J., Wetz J. J., Shipley-Lozano B., Shively J. D., Stunz G. W. (2015). An analysis of artificial reef fish community structure along the northwestern gulf of mexico shelf: potential impacts of “Rigs-to-Reefs” programs. PLoS ONE 10 (5), e0126354. doi: 10.1371/journal.pone.0126354
Anderson M., Gorley R. N., Clarke K. R. (2008). PERMANOVA + for PRIMER: Guide to software and statistical methods. doi: 10.1016/j.isatra.2014.07.008
Ars F., Rios R. (2017). Decommissioning: A call for a new approach. Offshore Technol. Conf. 1–7. doi: 10.4043/27717-MS
Benfield M. C., Kupchik M. J., Palandro D. A., Dupont J. M., Blake J. A., Winchell P. (2019). Documenting deepwater habitat utilization by fishes and invertebrates associated with Lophelia pertusa on a petroleum platform on the outer continental shelf of the Gulf of Mexico using a remotely operated vehicle. Deep-Sea Res. I 149, 103045. doi: 10.1016/j.dsr.2019.05.005
Bernardi G., Holbrook S. J., Schmitt R. J. (2001). Gene flow at three spatial scales in a coral reef fish, the three-spot dascyllus, Dascyllus trimaculatus. Mar. Biol. 138, 457–465. doi: 10.1007/s002270000484
Birt M. J., Stowar M., Currey L. M., Dianne R., Karen L. M. (2019). Comparing the effects of different coloured artificial illumination on diurnal fish assemblages in the lower mesophotic zone. Mar. Biol. 166, 1–9. doi: 10.1007/s00227-019-3595-0
Bonaca M. O., Lipej L. (2005). Factors affecting habitat occupancy of fish assemblage in the Gulf of Trieste (Northern Adriatic Sea). Mar. Ecol. 26, 42–53. doi: 10.1111/j.1439-0485.2005.00037.x
Bond T., Langlois T. J., Partridge J. C., Birt M. J., Malseed B. E., Smith L., et al. (2018). Diel shifts and habitat associations of fish assemblages on a subsea pipeline. Fish Res. 206, 220–234. doi: 10.1016/j.fishres.2018.05.011
Bouchet P. J., Meeuwig J. J. (2015). Drifting baited stereo-videography: A novel sampling tool for surveying pelagic wildlife in offshore marine reserves. Ecosphere 6, 1–29. doi: 10.1890/ES14-00380.1
Brokovich E., Einbinder S., Shashar N., Kiflawi M., Kark S. (2008). Descending to the twilight-zone: Changes in coral reef fish assemblages along a depth gradient down to 65 m. Mar. Ecol. Prog. Ser. 371, 253–262. doi: 10.3354/meps07591
Cappo M., Harvey E. S., Shortis M. (2006). “Counting and measuring fish with baited video techniques - an overview,” in Proceedings of the 2006 Australian society of fish biology conference and workshop. Eds. Lyle J. M., Furlani D. M., Buxton C. D., (Hobart, Tasmania), 101–114.
Carr M. H., McGinnis M. V., Forrester G. E., Harding J., Raimondi P. T. (2003). Consequences of alternative decommissioning options to reef fish assemblages and implications for decommissioning policy Vol. 53 (Santa Barbara, California: Marine Science Institute, Coastal Research Center, University of California, (OCS Study/MMS)), 104.
Claisse J. T., Pondella D. J., Love M., Zahn L. A., Williams C. M., Bull A. S. (2015). Impacts from partial removal of decommissioned oil and gas platforms on fish biomass and production on the remaining platform structure and surrounding Shell mounds. PloS One 10, 1–19. doi: 10.1371/journal.pone.0135812
Claisse J. T., Pondella D. J., Love M., Zahn L. A., Williams C. M., Williams J. P., et al. (2014). Oil platforms off California are among the most productive marine fish habitats globally. Proc. Natl. Acad. Sci. 111, 15462–15467. doi: 10.1073/pnas.1411477111
Cuif M., Kaplan D. M., Fauvelot C., Lett C., Vigliola L. (2015). Monthly variability of self-recruitment for a coral reef damselfish. Coral Reefs 34, 759–770. doi: 10.1007/s00338-015-1300-4
Department of Industry Innovation and Science. (2017). Resources and energy quarterly. Vol. 7 No. 1. (Canberra, Australia: Department of Industry Innovation and Science).
Department of Industry Innovation and Science. (2018). Discussion paper – decommissioning offshore petroleum infrastructure in commonwealth waters. (Canberra, Australia: Offshore Resources Branch, Department of Industry Innovation and Science).
Forteath G., Picken G., Ralph R., Williams J. (1982). Marine growth studies on the north sea oil platform montrose alpha. Mar. Ecol. Prog. Ser. 8, 61–68. doi: 10.3354/meps008061
Fowler A. M., Macreadie P. I., Booth D. J. (2015). Should we “reef” obsolete oil platforms? Proc. Natl. Acad. Sci. 112, 102. doi: 10.1073/pnas.1422274112
Franks J. S. (2000). “A review: pelagic fishes at petroleum platforms in the Northern Gulf of Mexico; diversity, interrelationships, and perspective,” in Pêche thonière et dispositifs de concentration de poissons, vol. 28 . Eds. Le Gall J. Y., Cayre P., Taquet M., 502–515.
Frederick J. L. (1997). Post-settlement movement of coral reef fishes and bias in survival estimates. Mar. Ecol. Prog. Ser. 150, 65–74. doi: 10.3354/meps150065
Friedlander A. M., Parrish J. D. (1998). Habitat characteristics affecting fish assemblages on a Hawaiian coral reef. J. Exp. Mar. Biol. Ecol. 224, 1–30. doi: 10.1016/S0022-0981(97)00164-0
Froese R., Pauly D. (2019) FishBase. Available at: www.fishbase.org.
Gass S. E., Roberts J. M. (2006). The occurrence of the cold-water coral Lophelia pertusa (Scleractinia) on oil and gas platforms in the North Sea: Colony growth, recruitment and environmental controls on distribution. Mar. pollut. Bull. 52, 549–559. doi: 10.1016/j.marpolbul.2005.10.002
Harvey E. S., Newman S. J., McLean D. L., Cappo M., Meeuwig J. J., Skepper C. L. (2012). Comparison of the relative efficiencies of stereo-BRUVs and traps for sampling tropical continental shelf demersal fishes. Fish Res. 125–126, 108–120. doi: 10.1016/j.fishres.2012.01.026
Horthorn T., Bretz F., Westfall P. (2008). Simultaneous inference in general parametric models. Biometrical J. 50, 346–363. doi: 10.1002/bimj.200810425
Ierodiaconou D., McLean D., Birt M. J., Bond T., Wines S., Glade-Wright O., et al. (2023). Industry remotely operated vehicle imagery for assessing marine communities associated with subsea oil and gas infrastructure on the continental shelf of South-East Australia. Front. Mar. Sci. 10. doi: 10.3389/fmars.2023.1095906
Jones G. P., Milicich M. J., Emslie M. J., Lunow C. (1999). Self-recruitment in a coral reef fish population. Environ. Prot. 402, 802–804. doi: 10.1038/45538
Kashubsky M., Morrison A. (2013). Security of offshore oil and gas facilities: exclusion zones and ships’ routeing. Aust. J. Maritime Ocean Affairs 5, 1–10. doi: 10.1080/18366503.2013.10815725
Kleiber C., Zeileis A. (2008). Applied econometrics with R (New York: Springer-Verlag). Available at: https://CRAN.R-project.org/package=AER.
Kulbicki M., Guillemot N., Amand M. (2005). A general approach to length-weight relationships for New Caledonian lagoon fishes. Cybium 29, 235–252.
Letessier T. B., Meeuwig J. J., Gollock M., Groves L., Bouchet P. J., Chapuis L., et al. (2013). Assessing pelagic fish populations: The application of demersal video techniques to the mid-water environment. Methods Oceanogr. 8, 41–55. doi: 10.1016/j.mio.2013.11.003
Love M. S., Kui L., Claisse J. T. (2019). The role of jacket complexity in structuring fish assemblages in the midwaters of two California oil and gas platforms. Bull. Mar. Sci. 95, 597–615. doi: 10.5343/bms.2017.1131
Love M. S., Nishimoto M. M. (2012). “Completion of fish assemblage surveys around manmade structures and natural reefs off California,” BOEM OCS Study 2012-020 Marine Science Institute, Santa Barbara, California: University of California.
Love M. S., Nishimoto M., Clark S., Schroeder D. M. (2012). Recruitment of young-of-the-year fishes to natural and artificial offshore structure within central and southern California waters 2008-2010. Bull. Mar. Sci. 88, 863–882. doi: 10.5343/bms.2011.1101
Love M. S., Schroeder D. M., Lenarz W., MacCall A., Bull A. S., Thorsteinson L. (2006). Potential use of offshore marine structures in rebuilding an overfished rockfish species, bocaccio (Sebastes paucispinis). Fish. Bull. 104, 383–390.
Love M. S., Yoklavich M., Schroeder D. M. (2009). Demersal fish assemblages in the Southern California Bight based on visual surveys in deep water. Environ. Biol. Fishes 84, 55–68. doi: 10.1007/s10641-008-9389-8
Macreadie P. I., Fowler A. M., Booth D. J. (2011). Rigs-to-reefs: Will the deep sea benefit from artificial habitat? Front. Ecol. Environ. 9, 455–461. doi: 10.1890/100112
Macreadie P. I., McLean D. L., Thomson P. G., Partridge J. C., Jones D. O. B., Gates A. R., et al. (2018). Eyes in the sea: Unlocking the mysteries of the ocean using industrial, remotely operated vehicles (ROVs). Sci. Total Environ. 634, 1077–1091. doi: 10.1016/j.scitotenv.2018.04.049
McLean D. L., Ferreira L. C., Benthuysen J. A., Miller K. J., Schläppy M. L., Ajemian M. J., et al. (2022a). Influence of offshore oil and gas structures on seascape ecological connectivity. Glob Chang Biol. 28, 3515–3536. doi: 10.1111/gcb.16134
McLean D. L., Macreadie P., White D. J., Thomson P. G., Fowler A., Gates A. R., et al. (2018). Understanding the global scientific value of industry ROV data, to quantify marine ecology and guide offshore decommissioning strategies. Offshore Technol. Conf. 1–10. doi: 10.4043/28312-ms
McLean D. L., Parsons M. J. G., Gates A. R., Benfield M. C., Bond T., Booth D. J., et al. (2020). Enhancing the scientific value of industry remotely operated vehicles (ROVs) in our oceans. Front. Mar. Sci. 7. doi: 10.3389/fmars.2020.00220
McLean D. L., Partridge J. C., Bond T., Birt M. J., Bornt K. R., Langlois T. J. (2017). Using industry ROV videos to assess fish associations with subsea pipelines. Cont Shelf Res. 141, 76–97. doi: 10.1016/j.csr.2017.05.006
McLean D., Speed C. W., Birt M. J., Colquhoun J., Case M., Stowar M., et al. (2022b). Habitat value of subsea wells and pipelines for fishery target species in Australia. Front. Mar. Sci. 9. doi: 10.3389/fmars.2022.960496
McLean D. L., Taylor M. D., Giraldo Ospina A., Partridge J. C. (2019). An assessment of fish and marine growth associated with an oil and gas platform jacket using an augmented remotely operated vehicle. Cont Shelf Res. 179, 66–84. doi: 10.1016/j.csr.2019.04.006
National Energy Resources Australia (2021). A baseline assessment of Australia’s offshore oil and gas decommissioning liability. Perth, Western Australia: Centre of Decommissioning Australia.
National Offshore Petroleum Safety and Environmental Management Authority (2017). Decommissioning offshore petroleum facilities in commonwealth waters. Perth, Western Australia: National Offshore Petroleum Safety Environmental Management Australia.
Newman S. J., Wise B. S., Santoro K. G., Gaughan D. J. (2023). Status Reports of the Fisheries and Aquatic Resources of Western Australia 2021/22: The State of Fisheries (Western Australia: Department of Primary Industries and Regional Development).
Pinheiro J., Bates D., DebRoy S., Sarkar D., Team, R. C (2019) nlme: Linear and Nonlinear Mixed Effects Models. R package version 3.1-140. Available at: https://CRAN.R-project.org/package=nlme.
Pondella D. J., Zahn L. A., Love M. S., Siegel D., Bernstein B. B. (2015). Modeling fish production for southern California’s petroleum platforms. Integr. Environ. Assess. Manag 11, 584–593. doi: 10.1002/ieam.1689
Pradella N., Fowler A. M., Booth D. J., Macreadie P. I. (2014). Fish assemblages associated with oil industry structures on the continental shelf of north-western Australia. J. Fish Biol. 84, 247–255. doi: 10.1111/jfb.12274
R Core Team (2015). A language and environment for statistical computing (Vienna, Austria: R Foundation for Statistical Computing). Available at: https://www.r-project.org/.
Ryan K. L., Lai E. K. M., Smallwood C. B. (2022). Boat-based recreational fishing in Western Australia 2020/21. Fisheries Research Report No. 327 (Western Australia: Department of Primary Industries and Regional Development). 221pp.
Schramm K. D., Marnane M. J., Elsdon T. S., Jones C., Saunders B. J., Goetze J. S., et al. (2020). A comparison of stereo-BRUVs and stereo-ROV techniques for sampling shallow water fish communities on and off pipelines. Mar. Environ. Res. 162. doi: 10.1016/j.marenvres.2020.105198
Schroeder D. M., Love M. S. (2004). Ecological and political issues surrounding decommissioning of offshore oil facilities in the Southern California Bight. Ocean Coast. Manag 47, 21–48. doi: 10.1016/j.ocecoaman.2004.03.002
SeaGIS Pty Ltd (2017) EventMeasure Stereo. Available at: https://www.seagis.com.au/event.html.
Sih T. L., Cure K., Yilmaz I. N., McLean D., Macreadie P. I. (2022). Marine life and fisheries around offshore oil and gas structures in southeastern Australia and possible consequences for decommissioning. Front. Mar. Sci. 9. doi: 10.3389/fmars.2022.979212
Taylor A. (2020). Shaping the decommissioning landscape of tomorrow. APPEA J. 60, 537. doi: 10.1071/AJ19029
Thomson P. G., Fowler A. M., Davis A. R., Pattiaratchi C. B., Booth D. J. (2018). Some old movies become classics – A case study determining the scientific value of ROV inspection footage on a platform on Australia’s north west shelf. Front. Mar. Sci. 5. doi: 10.3389/fmars.2018.00471
Todd V. L. G., Susini I., Williamson L. D., Todd I. B., McLean D. L., Macreadie P. I. (2021). Characterizing the second wave of fish and invertebrate colonization of an offshore petroleum platform. ICES J. Mar. Sci. doi: 10.1093/icesjms/fsaa245
Todd V. L. G., Williamson L. D., Cox S. E., Todd I. B., MacReadie P. I. (2019). Characterizing the first wave of fish and invertebrate colonization on a new offshore petroleum platform. ICES J. Mar. Sci. 77, 1127–1136. doi: 10.1093/icesjms/fsz077
Turgeon K., Robillard A., Grégoire J., Duclos V., Kramer D. L., Turgeon K., et al. (2010). Functional connectivity from a reef fish perspective: behavioral tactics for moving in a fragmented landscape. Ecology 91, 3332–3342. doi: 10.1890/09-2015.1
van der Stap T., Coolen J., Lindeboom H. (2016). Marine fouling assemblages on offshore gas platforms in the Southern North Sea: effects of depth and distance from shore on biodiversity. PloS One 11, e0146324. doi: 10.5061/dryad.6p566
van Elden S., Meeuwig J. J., Hobbs R. J. (2022). Offshore platforms as novel ecosystems: A case study from Australia’s Northwest Shelf. Ecol. Evol. 12, 22. doi: 10.1002/ece3.8496
van Elden S., Tothill T., Meeuwig J. J. (2020). Strategies for obtaining ecological data to enhance decommissioning assessments. APPEA J. 60, 559–562. doi: 10.1071/AJ19235
Vermilion Energy (2019) Australian Operations. Available at: https://www.vermilionenergy.com/our-operations/aus.
Widder E. A., Robison B. H., Reisenbichler K. R., Haddock S. H. D. (2005). Using red light for in situ observations of deep-sea fishes. Deep-Sea Res. I 52, 2077–2085. doi: 10.1016/j.dsr.2005.06.007
Wilson S. K., Babcock R. C., Fisher R., Holmes T. H., Moore J. A. Y., Thomson D. P. (2012). Relative and combined effects of habitat and fishing on reef fish communities across a limited fishing gradient at Ningaloo. Mar. Environ. Res. 81, 1–11. doi: 10.1016/j.marenvres.2012.08.002
Keywords: oil and gas, decommissioning, remotely operated vehicle, vertical distribution, rigs-to-reef, platform ecology
Citation: Tothill T, Meeuwig JJ and van Elden S (2024) The vertical distribution of fish on two offshore oil platforms. Front. Mar. Sci. 11:1328672. doi: 10.3389/fmars.2024.1328672
Received: 27 October 2023; Accepted: 16 January 2024;
Published: 01 February 2024.
Edited by:
Susana Carvalho, King Abdullah University of Science and Technology, Saudi ArabiaReviewed by:
Thadickal V. Joydas, King Fahd University of Petroleum and Minerals, Saudi ArabiaDianne McLean, Australian Institute of Marine Science (AIMS), Australia
Copyright © 2024 Tothill, Meeuwig and van Elden. This is an open-access article distributed under the terms of the Creative Commons Attribution License (CC BY). The use, distribution or reproduction in other forums is permitted, provided the original author(s) and the copyright owner(s) are credited and that the original publication in this journal is cited, in accordance with accepted academic practice. No use, distribution or reproduction is permitted which does not comply with these terms.
*Correspondence: Thomas Tothill, dGhvbWFzLnRvdGhpbGxAcmVzZWFyY2gudXdhLmVkdS5hdQ==; dGhvbXRvdGhpbGwzQGdtYWlsLmNvbQ==