 Diego Panzeri1*
 Marco Reale1
 Gianpiero Cossarini1
 Stefano Salon1
 Roberto Carlucci2
 Maria Teresa Spedicato3
 Walter Zupa3
 Nedo Vrgoč4
 Simone Libralato1
- 1National Institute of Oceanography and Applied Geophysics – OGS, Trieste, Italy
- 2Department of Biosciences, Biotechnology and Environment, University of Bari, Bari, Italy
- 3Fondazione COISPA ETS, Bari, Italy
- 4Institute of Oceanography and Fisheries, Split, Croatia
Predicting range shifts of marine species under different CO2 emission scenarios is of paramount importance to understand spatial potential changes in a context of climate change and to ensure appropriate management, in particular in areas where resources are critical to fisheries. Important tools which use environmental variables to infer range limits and species habitat suitability are the species distribution models or SDMs. In this work, we develop an ensemble species distribution model (e-SDM) to assess past, present and future distributions under Representative Concentration Pathway (RCP) 8.5 of nine demersal species and hotspot areas for their two life stages (adult and juvenile) in the Adriatic and Western Ionian Seas in four time windows (1999-2003, 2014-2018, 2031-2035 and 2046-2050). The e-SDM has been developed using three different models (and sub-models), i.e. (i) generalized additive models (GAM), (ii) generalized linear mixed model (GLMM), (iii) gradient boosting machine (GBM), through the combination of density data in terms of numbers of individuals km2 and environmental variables. Then, we have determined the changes in the aggregation hotspots and distributions. Finally, we assess gains and losses areas (i.e. occupation area) in the future climate change scenario as new potential range shifts for the nine species and their life stages. The results show that densities of some key commercial species, such as Merluccius merluccius (European hake), Mullus barbatus (red mullet), and Lophius budegassa (anglerfish) will be shifting northwards.
1 Introduction
Ocean is warming and observations confirm that sea temperature accelerated rapidly in recent decades (Cheng et al., 2019; IPCC, 2022). Temperature increase and consequential oceanographic changes are impacting marine life in several ways, including massive displacement of species from their historical areas (Kleisner et al., 2016; Baudron et al., 2020). The poleward shift of the marine species, for instance, is among the cause of current changes in the regional biodiversity (Román-Palacios and Wiens, 2020).
Such shifts in distribution also affect commercially exploited species, whose displacement may cause changes in fishing grounds that can result in social and economic costs and further complicate fisheries management (Olafsdottir et al., 2019). Assessing the vulnerability and geographical changes of different exploited resources is essential for management plans and sustainable resource use (Hidalgo et al., 2022). In particular, understanding future changes in the spatial distribution of marine species helps to define strategies to cope with seemingly inevitable changes and to prepare adaptive solutions in fisheries management (Bahri et al., 2021). In this context, semi-enclosed basins such as the Mediterranean Sea are particularly vulnerable to climate change (MedECC, 2020; IPCC, 2022) where reduced migration opportunities for certain species are exacerbating competitions and local extinction can be induced by climate change (Hoegh-Guldberg et al., 2014).
The Mediterranean Sea is a biodiversity hotspot with more than 650 fish species (Coll et al., 2010), and the impacts of climate change are already substantial (Darmaraki et al., 2019), leading for example to significant changes in population dynamics (Moullec et al., 2016), loss of genes (Chefaoui et al., 2018), and invasion of species (Azzurro et al., 2019).
Climate projections for the Mediterranean basin show an overall warming of seawater along with general acidification, oxygen depletion, and a decrease in plankton biomasses and nutrients in the water column (Soto-Navarro et al., 2020; Reale et al., 2022; Solidoro et al., 2022). In addition, increases in the frequency and intensity of marine heat waves (Frölicher and Laufkötter, 2018; Darmaraki et al., 2019) are impacting the marine ecosystem and biodiversity (Smale et al., 2019; Dayan et al., 2023). The modification of species ranges in the Mediterranean sea is already occurring (Baudron et al., 2020) with significant effects on the economies and communities of all countries surrounding the basin (Blasiak et al., 2017; FAO, 2022; Farahmand et al., 2023). Although, the fisheries economic sectors in the developing countries in the southern part of the basin might appear more vulnerable (Pita et al, 2021), it is expected that larger potential socio-economic impacts will also affect the northern part of the basin, where fisheries capacities, infrastructure and economies are well established (FAO, 2023).
In particular, the Adriatic and Ionian region (Figure 1), is important for fisheries in Mediterranean sea and climate change is expected to bring significant oceanographic and biological changes in both basins, such as an increasing northward shift of thermophilic species (Dulčić and Grbec, 2000; Dulčić et al., 2011) as well as the rarefaction or disappearance of cold-water species especially in the Adriatic (Boero and Bonsdorff, 2007; Templado, 2014), whose further northward migration of the species is prevented due to its dead-end nature (Ben Rais Lasram et al., 2010). Future climate change would favor an increase in invasive species such as Siganus luridus or Lagocephalus sceleratus (Carbonara et al., 2017; D’Amen and Azzurro, 2020) in these two sub-basins, that could dramatically affect the dynamics of the local food web (Occhipinti-Ambrogi, 2007) and eventually promote a further displacement of resident species.
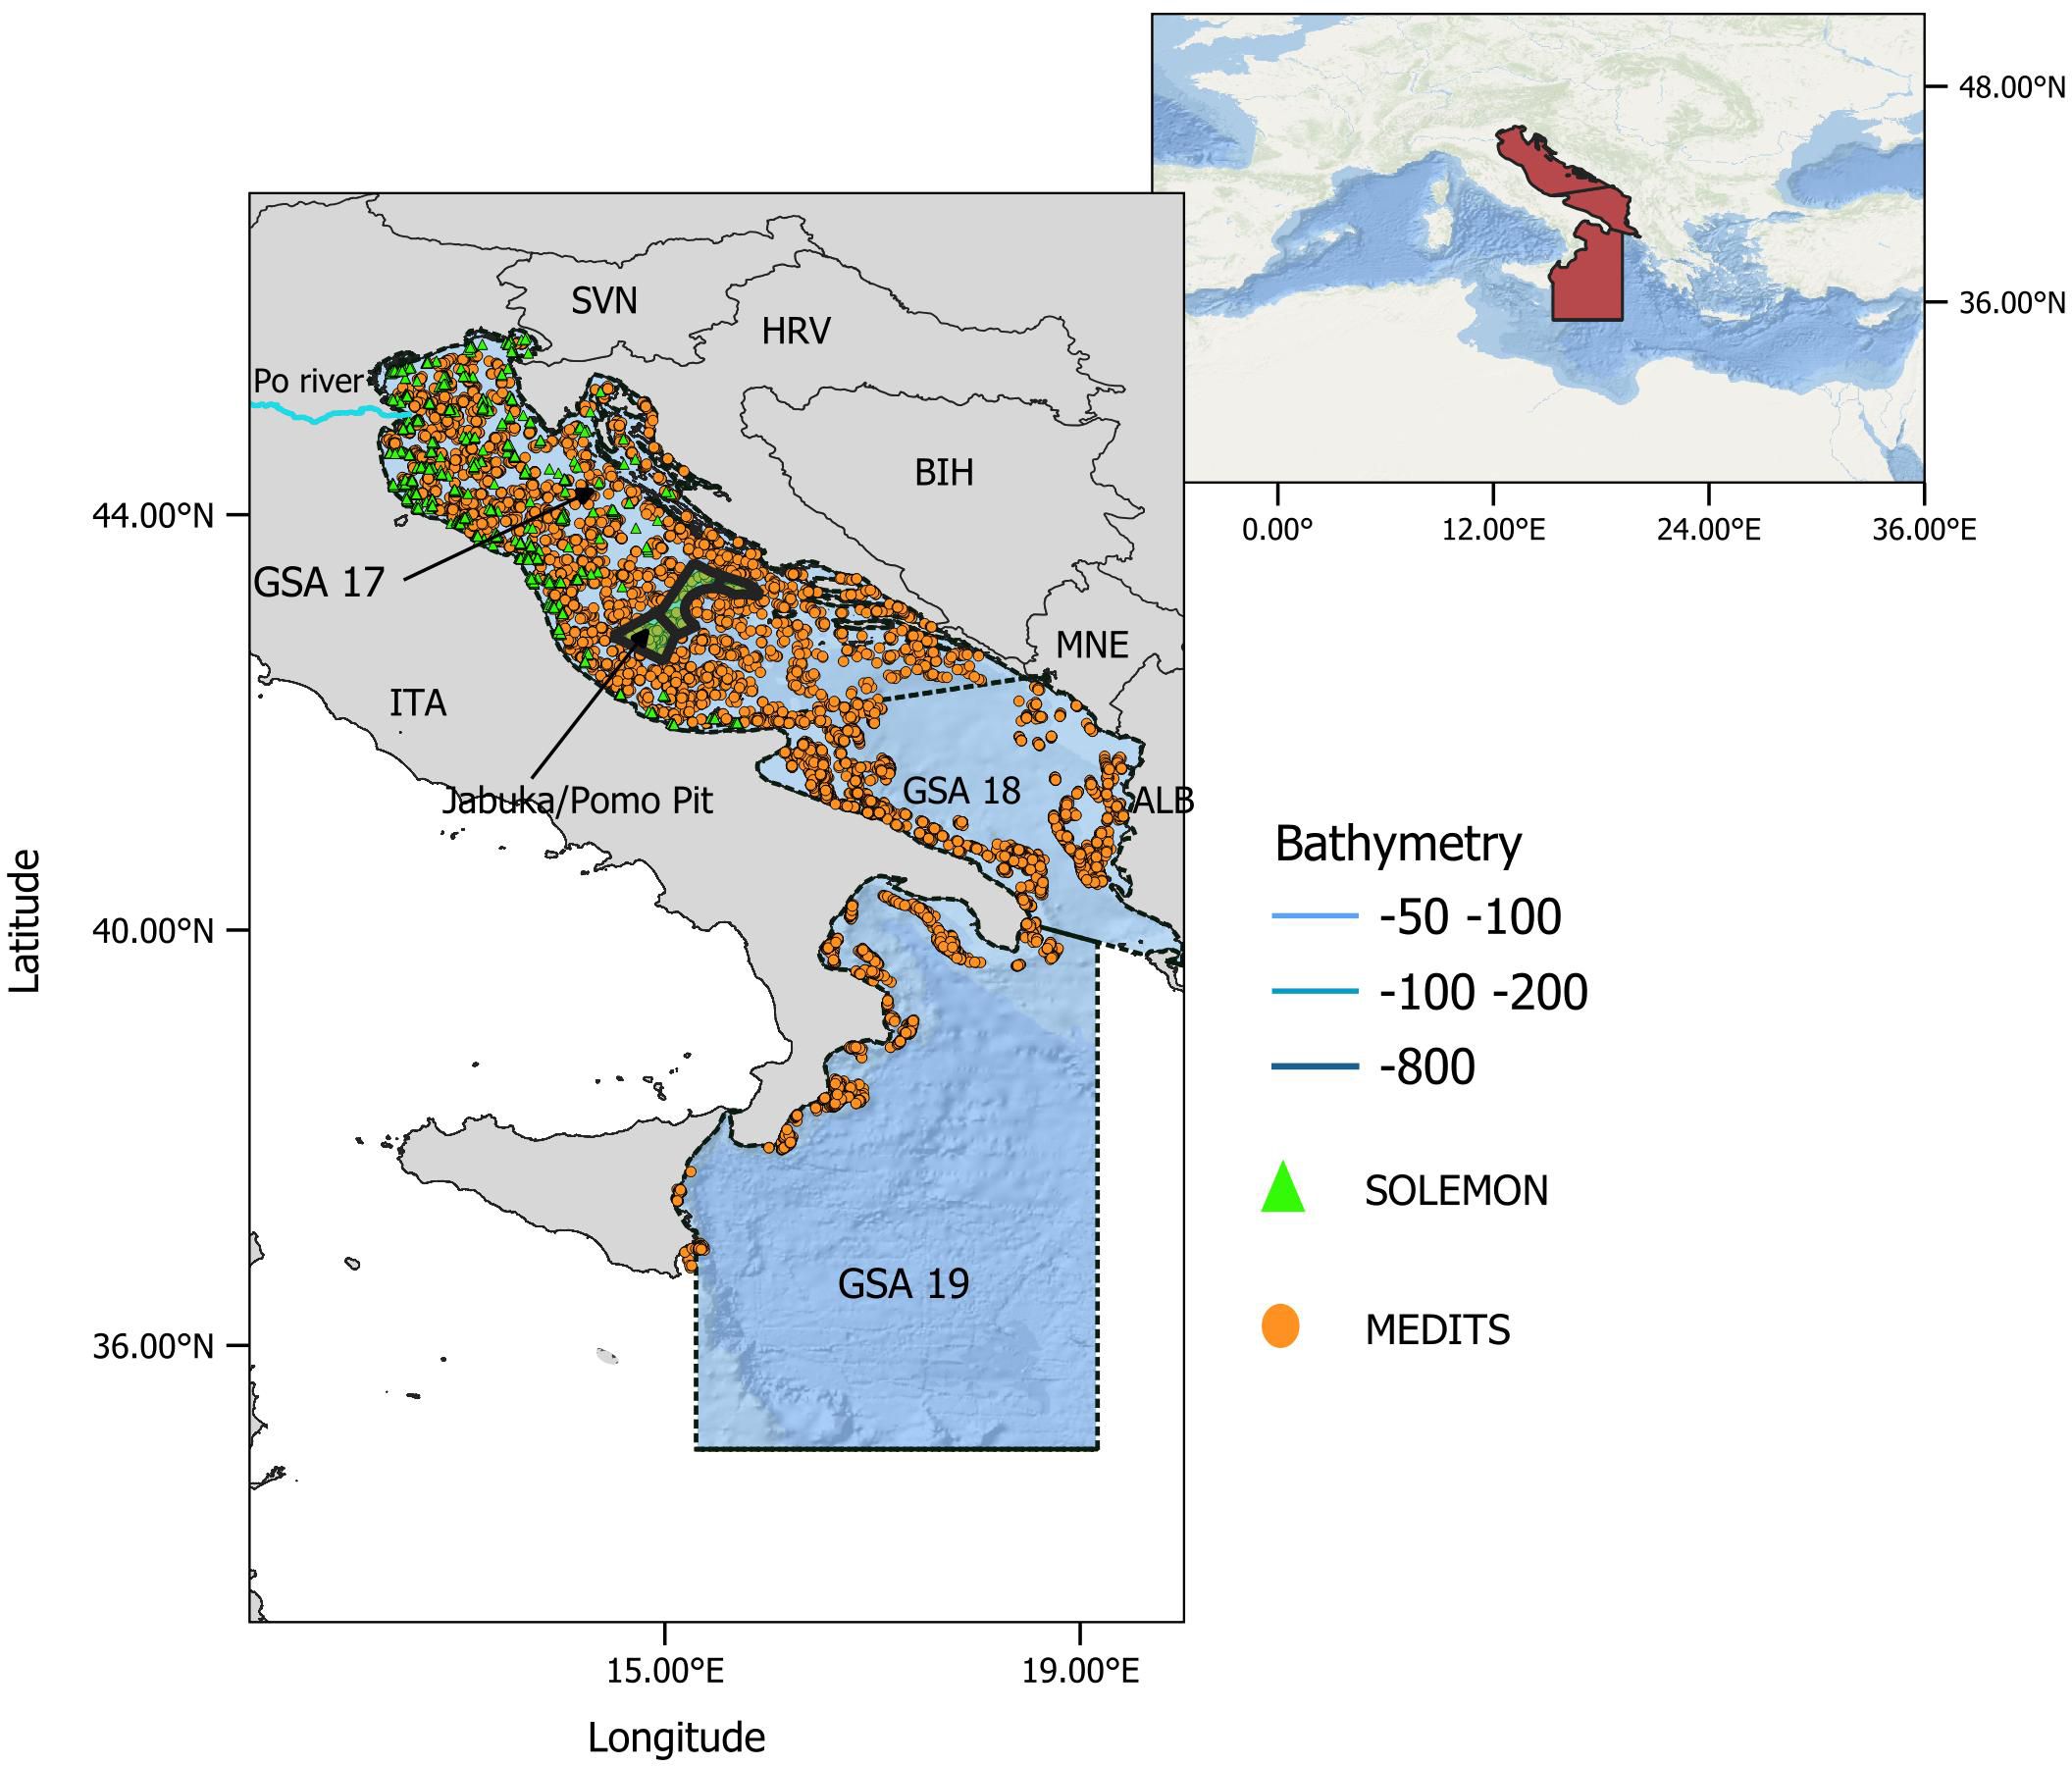
Figure 1 Map of the study area, northern and central Mediterranean (red area, in box at top right). The Adriatic and western Ionian Seas (focal area) comprise GSA 17-18-19 (delineated by black dashed lines) with bathymetric layers down to 1000 m depth (see legend). The orange dots show the position of MEDITS hauls during 1999-2018, and the green triangles show the position of SOLEMON hauls during 2005-2018. ITA, Italy; SVN, Slovenia; HRV, Croatia; BIH, Bosnia-Herzegovina; MNE, Montenegro; ALB, Albania. Jabuka/Pomo Pit Fisheries Restricted Area (FRA) is shown in the center of the basin (green area).
Intensive commercial fishing in the Adriatic and Western Ionian Sea, has led to the overfishing of stocks such as Merluccius merluccius (European hake) and Parapenaues longirostris (deep-water rose shrimp), while the situation is fairly better for other stocks such as Nephrops norvegicus (Norway lobster), Mullus barbatus (red mullet) and Sole solea (common sole) (GFCM-FAO, 2018a, b; Russo et al., 2019; GFCM-FAO, 2021a, b). Thanks to important management efforts, however, the status of the fisheries resources in the region is currently improving (FAO, 2023). These efforts are based on a Multi Annual Management Plan (MAP; GFCM-FAO, 2019; GFCM-FAO, 2022a, b) that include temporal or spatial closures (Scarcella et al., 2014; Bellido et al., 2020), such as the Fisheries Restricted Area (hereafter FRA) (Cardinale et al., 2017), in the Pomo/Jabuka Pit and Bari Canyon (GFCM-FAO, 2017).
While temporal and spatial closure of demersal fisheries had been key for improving the sustainable exploitation of commercial species in the area, maintaining their efficacy also under climatic-induced modifications is critical (FAO, 2022). In general, predicting future spatial shift of commercial species could help to optimize spatial fisheries management tools (Pinsky et al., 2013; Melo-Merino et al., 2020).
However, the dynamic distribution of marine species is the result of a complex set of interconnected factors that might be difficult to be considered explicitly (Nagelkerken and Munday, 2016). Such factors include for example physiological responses, behavior, feeding and habitat preferences, as well as avoidance of disturbances and predators that might be implicitly considered using statistical approaches. Species distribution models (SDMs) are correlative empirical approaches that can be trained over past data integrating species density (number of individuals per unit of surface) and oceanographic variables and than used to predict species distributions in response to climatic oceanographic changes (e.g. Kearney and Porter, 2009). SDMs relate occurrence (presence/absence) or biomass/density data to environmental variables (Thorson et al., 2015; Lauria et al., 2017; Brodie et al., 2020) and are used to extrapolate future distribution considering different species-specific scenarios (e.g. Robinson et al., 2017; Moullec et al., 2019).
The objective of the study is to explore the potential displacement of the main commercial species in the Adriatic and Ionian Sea in two future time windows, namely 2035 and 2050. The study implements an ensemble of species distribution models (hereafter e-SDM) developed previously (Panzeri et al., 2023) to derive the best estimate of future distributions and hotspot for 9 demersal of commercial interest species on the basis of essential ocean variables (EOVs) derived from a physical-biogeochemical 3D model under emission scenario RCP 8.5.
The work aims at identifying future regional anomalies in species distribution to assess changes in future fishing opportunities in the basin. Furthermore, by identifying future changes in the hot spots of aggregation for juvenile and adults of the 9 demersal species the work set the basis for understanding efficacy of current spatial management areas and indications for future plans.
2 Material & methods
2.1 Study area
FAO-GFCM (General Fisheries Commission for the Mediterranean) designates the northern, southern Adriatic Sea, and the Ionian Sea as Geographical Subareas (GSA) 17, 18, and 19, respectively (Figure 1).
The northern Adriatic Sea (GSA 17) is a relatively shallow basin (maximum depth 273m), where the general circulation is driven by runoff and wind stress (Giani et al., 2012). The southern Adriatic Sea (SAS, GSA 18; Figure 1) is characterized by complex topography with steep continental slopes reaching depth of 1250 m, and the presence of muddy bottoms, relict sands, rocky bottoms (Alfirević, 1981), canyons and cold-water coral mega habitats (D’Onghia et al., 2012; Carbonara et al., 2020). In the central of GSA 17 there is a deep depression called Jabuka-Pomo Pit area (depth 200-260m), which is subject to restrictions and recommendations for fishing (GFCM-FAO, 2017).
The Adriatic Sea is heavily impacted by fisheries, with trawlers and beam trawls (Colloca et al., 2013, 2017). In the Jabuka-Pomo Pit area, the situation has evolved positively since 2017, but several demersal species such as European hake (Merluccius merluccius) and Norway lobster (Nephrops norvegicus) are still overfished (FAO, 2023).
2.2 Input data
2.2.1 Trawl survey data
Sampling data for 1999-2018 are based on the MEDITS dataset (Mediterranean International Trawl Survey; Spedicato et al., 2019), based on averages 326 sampling sites per year in the three GSAs and bathymetric range between 10 and 800 m, and SOLEMON (Sole Monitoring; Scarcella et al., 2011; Grati et al., 2013), based on average of 70 sampling sites per year in GSA 17 from 2005 to 2018, and bathymetric range between 10 and 100 m.
Density indices per haul for demersal species (number of individuals per km-2, hereafter N/km2) were retrieved from the MEDITS dataset for four bony fish species: (i) European hake (Merluccius merluccius), (ii) red mullet (Mullus barbatus), (iii) anglerfish (Lophius budegassa), (iv) European horse mackerel (Trachurus trachurus). In addition, one crustacean species (v), Norway lobster (Nephrops norvegicus), and one cephalopod (vi), broadtail shortfin squid (Illex coindetii), were included.
From the SOLEMON dataset, one fish, one crustacean, and one cephalopod species were included: (i) common sole (Solea solea), (ii) mantis shrimp (Squilla mantis), and (iii) cuttlefish (Sepia officinalis) respectively.
These 9 species are among the most important commercially exploited by otter and beam trawl in the Adriatic and western Ionian Seas (UNEP-MAP-RAC/SPA, 2015; FAO, 2022) and account for ~60% of the total demersal fish landings of the Adriatic and Ionian Sea.
We then subdivided the data into two classes, namely adults and juveniles fishes, based on a species-specific size threshold (total length) of 24 cm, 9 cm, 33 cm, 14 cm, and 19 cm for European hake, red mullet, anglerfish, European horse mackerel, and sole, respectively; the carapace length thresholds were 2.5 cm for Norway lobster and mantis shrimp and 15 cm and 10 cm for broadtail shortfin squid and cuttlefish, respectively (Supplementary Table S2).
2.2.2 Temporal evolution of thermohaline and biogeochemical properties in the Adriatic and Ionian Sea
Marine physical and biogeochemical data for the Adriatic and Ionian Sea have been extracted from the reanalysis and climate projections data available for the Mediterranean region that have been produced using the OGSTM-BFM modelling system (Lazzari et al., 2012, 2016). Past physical and biogeochemical data are from reanalysis datasets, available from the Copernicus Marine Service (CMS, https://marine.copernicus.eu/), covering the period 1999-2019 with a spatial resolution of 1/16° and 72 unevenly vertical levels (Simoncelli et al., 2019; Teruzzi et al., 2019). On the other hand, physical and biogeochemical projections under emission scenario RCP8.5 cover the period 2005-2100 with a spatial resolution of 1/16° and 70 unevenly vertical levels (Reale et al., 2022; available at https://dds.cmcc.it/, last access 21/06/2023).
The reanalysis datasets have been used to provide an estimation of thermohaline and biogeochemical properties of the domain under investigation in two 5-year time windows: (i) 1999-2003 (hereafter “past”) and (ii) 2014-2018 (hereafter “present”). The climate projections have been used to provide an assessment of the same variables under the RCP8.5 emission scenario in two future time windows: (iii) 2031-2035 (hereafter ‘2035’) and (iv) 2046-2050 (hereafter ‘2050’). Although being built with the same modelling system, the two datasets have been produced by using different numerical setups and boundary conditions and some adjustments for accounting of model spurious trends in the climate projections has been done (see Reale et al., 2022).
The explanatory variables i.e. both geoposition (in UTM, northing and easting, hereafter Y.utm and X.utm respectively) and Essential Oceanographic variables, were preliminarily selected using the VIF approach (Variance Inflation Factor; Sheather, 2009) with a threshold of VIF< 5 (Supplementary Table S3) to avoid collinearity (Sion et al., 2019). The Essential Ocean Variables (EOVs) considered in this work were: average salinity in the water column (hereafter ‘sal’), bottom temperature (hereafter ‘TMP_bot’, °C), average nitrate (hereafter ‘nit’) and phosphate (hereafter ‘pho’) concentrations in the water column (mmol m-3), and particulate organic carbon at the bottom (hereafter ‘poc’, mg m-3).
Furthermore, the granulometry (hereafter ‘grain’) variable with the 1/16° of resolution was only available for the northern Adriatic (GSA 17) trough SOLEMON survey. For this reason, it was used only for species living in close contact with benthic sediment, within the bathymetric range 10-100 and recorded by SOLEMON sampling (Scarcella et al., 2011). In addition, we also assessed the correlation between the variables using Pearson’s test (Supplementary Figure S1).
These variables were selected because of their known relevance to the selected demersal species for their general ecological importance (Carlucci et al., 2018; Bitetto et al., 2019; Panzeri et al., 2023), their effects on physiological processes (e.g., ‘TMP_bot’), their use as proxies for favorable coastal conditions for juvenile fish (e.g., ‘nit’, ‘pho’), and for feeding areas also for adult fish (‘poc’).
2.3 The species distribution models
We implemented an ensemble of species distribution models (e-SDM) that combine multiple individuals model to create a single model result (Nisbet et al. (2009). The individual model used are:
1) Delta - Generalized Additive Models (hereafter ‘D-GAM’) (Hastie and Tibshirani, 1986);
2) Delta - Generalized Linear Mixed Model with sdmTMB (hereafter ‘D-GLMM’, Anderson et al., 2022);
3) GAM with Tweedie family distribution with log link function (hereafter ‘TW-GAM’; see mgcv R package, Wood, 2017).
4) Generalized Boosted Regression Model (hereafter ‘GBM’; Schapire, 2003).
For 1) and 2), a delta model (Cragg, 1971; Maunder and Punt, 2004) was implemented in two steps: i) a binomial occurrence model that fits presence/absence data (logit link function of the binomial family error distribution), ii) a Gaussian distribution model with log link function fits the density presence-only data for D-GAM (Grüss et al., 2014; Lauria et al., 2017), and a Gamma function with log link that fits the density presence-only data for D-GLMM. The final spatial distribution of species abundances (N/km2) is obtained by multiplying the binomial models and the distribution model predictions in each grid point of the domain (Grüss et al., 2014; Lauria et al., 2017).
For all GAM models (1 & 3), we chose a knot number of 5 for all covariates except coordinates, after trying different knot combinations for determining the best significance and variance, but also relying on literature references (Wood, 2001; Nie and Racine, 2012) and the ecological sense of splines. The final formula of variables used for each model can be found in Supplementary Table S4 (knots are implicit, Supplementary Material).
Finally, for 4) we used 5000 trees with a shrinkage of 0.01 (gbm package R, https://github.com/gbm-developers/gbm, Greenwell et al., 2022).
For each species and type of model (D-GAM, TW-GAM, D-GLMM, and GBM), a stepwise approach was used. The approach consisted of increasing the number of explanatory variables by successively adding to the simplest model (given by the minimum spatiotemporal explanatory variables) those with higher F-statistics until the model with all explanatory variables was reached. This approach led to a series of models with different combinations of explanatory variables to obtain the response variable (N/km2 or presence/absence).
Each model was subjected to a k-fold cross validation process; thus it was fitted on a spatial training dataset made by randomly choosing 70% of the data. The remaining 30% of records were used for testing the best-fitting of the model (Panzeri et al., 2021a, 2023). The training and testing were repeated using 5 spatial folds each selecting randomly without replacement data from squared blocks using the BlockCV package (Valavi et al., 2019; Panzeri et al., 2021a, 2023). Blocks were defined having side of approximately 36 km, equal to 6 cells of the 1/16° grid, as the best solution to reduce autocorrelation of the data and assure good spatial coverage (function cv_block_size, Valavi et al., 2019).
The best model was then selected based on metrics of model performance such as explained deviation (% ED) and prediction error (AIC, Akaike Information Criterion) of the training datasets and mean absolute error (MAE) of model predictions in the test dataset. In addition, the validation process includes a prediction of the best model on the training data set and an evaluation of the correlation with the test data using the coefficient of determination r2 (Lewis-Beck and Lewis-Beck, 2015; Table 1). For each individual model, the best model (derived from training and test routine) was shown to be able to capture spatial patterns. Therefore, the best distribution was considered as e-SDM, i.e., the weighted average of the distributions obtained with the 4 individual models, and the r2 (Table 1) derived from the validation process was considered as a weighting factor (Pearman et al., 2020; Panzeri et al., 2021a) as expressed in Equation 1.
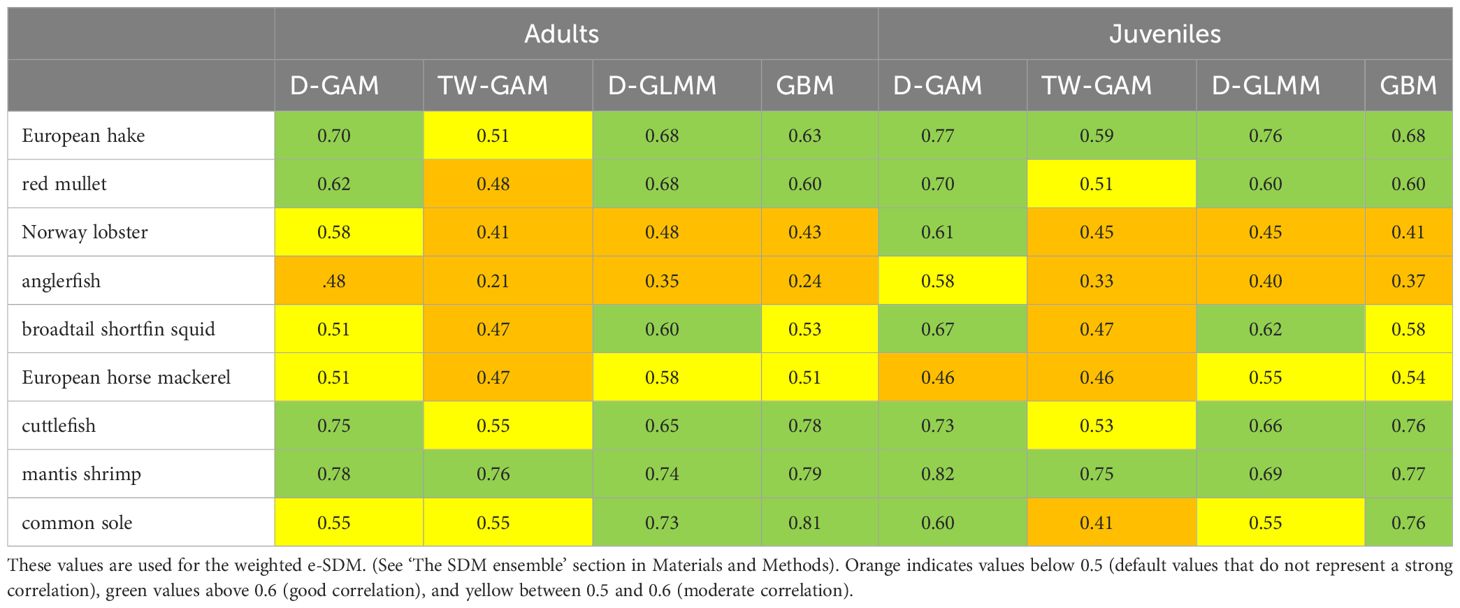
Table 1 Results of the r2 from the validation process for adults and juveniles of the species studied (common name).
We also assessed the normal distribution of the residuals derived from each fitted model with the Kolmogorov-Smirnov test (for samples of more than 5000 data) using ks.test (see results in Supplementary Table S5). In addition, we compared the median and standard deviation of the final prediction results of each model (including e-SDM) and observed data to evaluate the main pattern and see how each model can capture the median of the observed data (Supplementary Figure S4).
All analyses were coded with the software R (4.3.3, windows version) and the results were plotted with ggplot2 (version 3.5.0, Wickham, 2016).
2.4 Ensemble modelling
After running the best model resulting from the training and testing routine for the period (1999-2018), we used the fitted model to simulate the density of demersal species on a regular UTM grid on the basis of the temporal evolution of the environmental variables in four time windows (‘past’, ‘present’, ‘2035’ and ‘2050’). To develop an e-SDM, we calculated, for each model, an average density index (N/km2) for each time window and developed the final ensemble model by weighting the density obtained from the 4 models (Equation 1) by the corresponding r2 (Table 1). The distribution for each species results in density maps for the 'present' period (Figure 2).
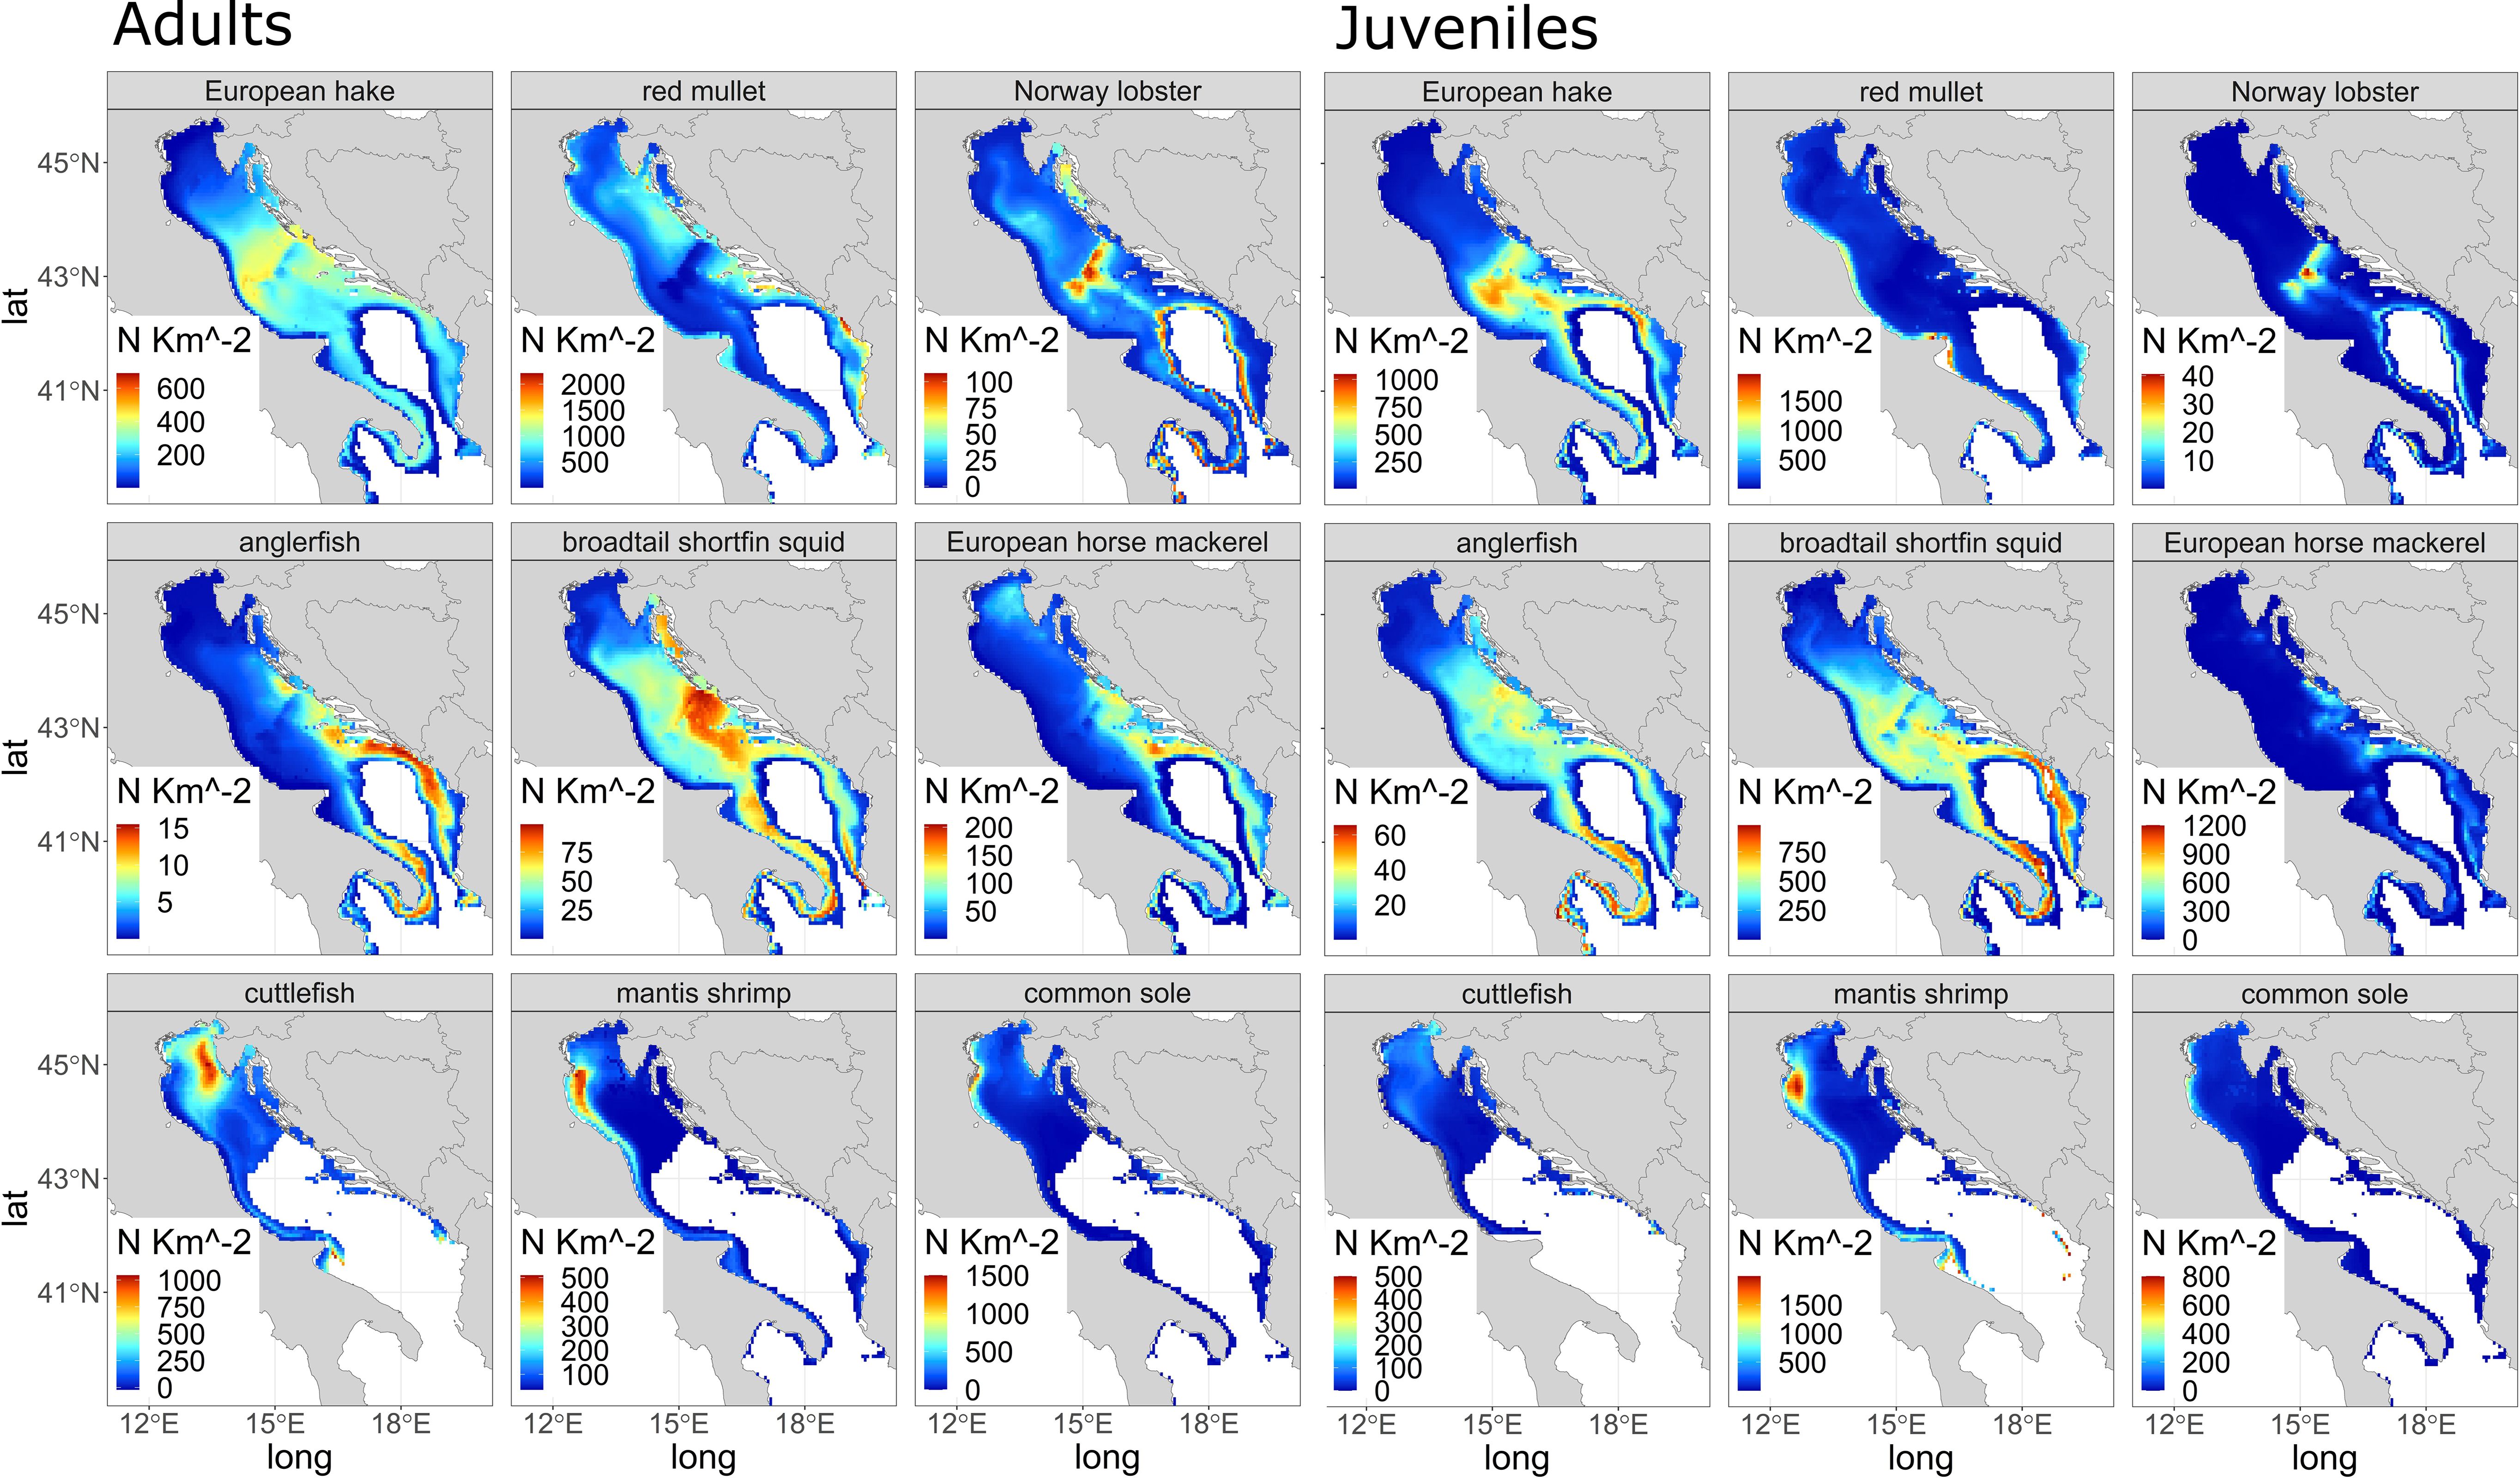
Figure 2 Distribution density for the “present” in N/km2 for the species studied: adults (left panels) and juveniles (right panels).
In Equation 1, di,ens are the density values of the e-SDM at each grid point i in the area computed as the weighted mean over the years for each time window, and r2 is the value derived from Table 1 for each model (D-GAM, TW-GAM, D-GLMM, GBM).
We evaluated the bias (Supplementary Figure S2) between the predicted value for the period 2014-2018 and the observed survey data (2014-2018), using the following equation:
where is the survey data for the period 2014-2018, and is the model prediction derived from the ensemble model (Equation 1) for each haul and year (i) of the period 2014-2018.
2.5 Future projection
We calculated the relative anomaly density between the present period and each of the other periods (past, 2035 and 2050) as:
Where are the density values of the e-SDM at each grid point i in the area computed as the mean over the years for each window (w= past, 2035 or 2050), that is , where n is the number of the years for each period (‘past’, ‘present’, ‘2035’ and ‘2050’) and x the density values for each year y and UTM location (i).
The pairwise statistical comparison of the distribution (N/km2) of the different scenarios (past/present, 2035/present, and 2050/present) was tested using the Mann-Whitney-Wilcoxon test (p< 0.05, see Table 2, Wilcoxon, 1945) to highlight the significant difference.
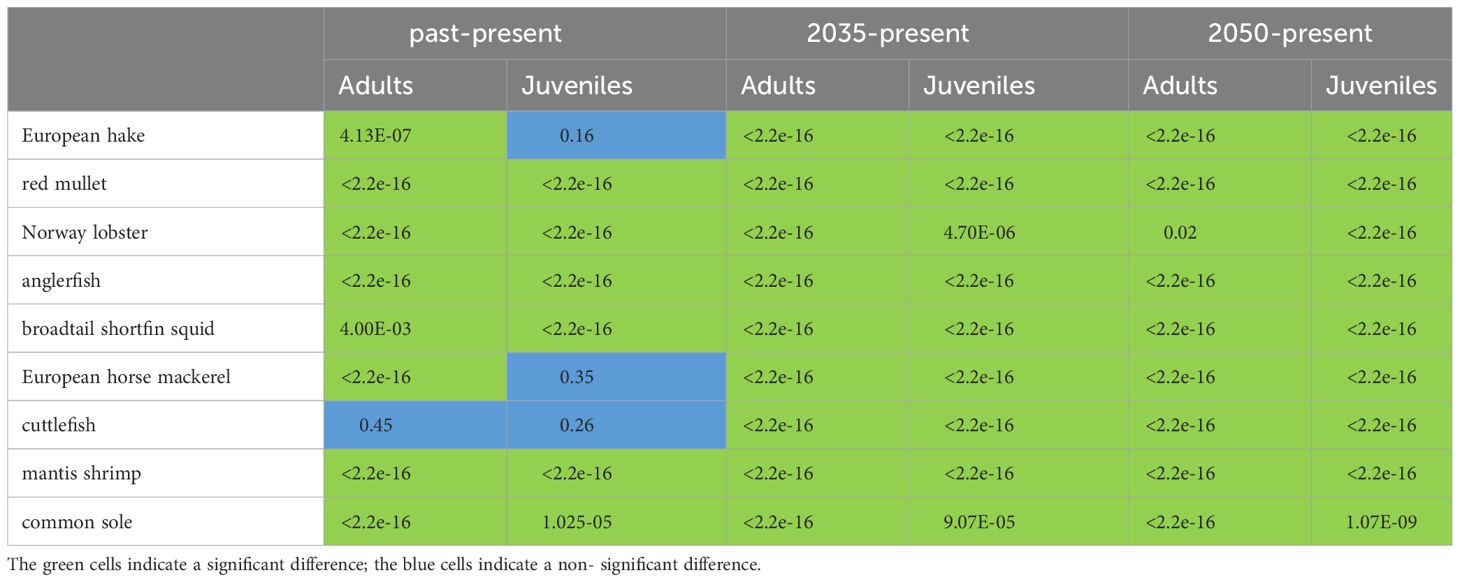
Table 2 Result of Mann-Whitney-Wilcoxon-test (with p<0.05) on density data between different scenarios: past-present, 2035 and present, and 2050 and present.
In addition, we applied the Getis-Ord-Gi* method (Getis and Ord, 1992, hereafter Gi*) to the density distribution to highlight the difference in hotspots between the chosen time windows (‘2035’ and ‘2050’). The Gi* statistic values are indicating where high or low density values cluster spatially. The larger the Gi*, the greater the clustering of high values (hot spot). The smaller the Gi*, the more intense the clustering of low values (cold spot).
Comparison of the areas with Gi* above the 75th percentile of the distribution (here used as a threshold for determining the hot spots areas) in the present and future (‘2050’) time window allowed to identify the potential ‘gained-lost-preserved’ areas in the basin.
3 Results
The AIC and the explained deviance of the four individual models are summarized in Supplementary Table S1 (Supplementary Material). Regarding r2 (Table 1), on average, the delta approaches (D-GAM, D-GLMM) perform better than the others models with good explained deviation and r2 usually higher.
Specifically, the best fits are observed for adults of European hake, mantis shrimp, cuttlefish, common sole and red mullet with D-GLMM (r2 > = 0.65/0.75), followed by D- GAM (r2 > 0.70) for adult European hake, and mantis shrimp. For juvenile the best fits are observed for European hake and mantis shrimp with D-GLMM (r2 = 0.76 and 0.68 respectively) and for European hake, red mullet, cuttlefish with D-GAM (r2 > 0.70) (Table 1).
The normal distribution of residuals derived from each fitted model and assessed with the Kolmogorov-Smirnov test shows results that are not significant for many species (green values in Supplementary Table S5), except for GBM for juveniles of cuttlefish (Supplementary Table S5), D-GAM (Gaussian fit) for mantis shrimp for both adults and juveniles (Supplementary Table S5), and D-GAM (Gaussian fit) and GBM for sole for both adults and juveniles (Supplementary Table S5).
Density values estimated with e-SDM in the ‘present’ period for all 9 demersal species (both adult and juvenile stage) are shown in Figure 2. The density of adult of European hake reaches 600 N/km2 (Figure 2, adults), mainly in the eastern part of the Adriatic basin, while adult red mullet (Figure 2 adults) reaches more than 2000 N/km2, in particular in the central and southern part of the Adriatic, near Croatia, Albania and Montenegro. Norway lobster (with an estimated maximum value of approximately 100 N/km2, Figure 2 adults) is found mainly in the Jabuka/Pomo Pit area (central Adriatic Sea) and on the northeastern area near the Croatian coast as well as in the southern part of the Adriatic and in the Otranto Channel. The adult anglerfish (Figure 2 adults) shows only few individuals (~ 15 N/km2) in the Otranto Channel, the southern Adriatic Sea (GSA 18) and the northern Ionian Sea (GSA 19). The adult broadtail shortfin squid (Figure 2 adults) distribution shows a maximum with values around 75 N/km2 near the central Croatian coast and the southern Adriatic Sea, while the adult European horse mackerel (Figure 2 adults) reaches 200 N/km2, mainly in the southeastern part of the Adriatic basin, along the coast of Albania and Montenegro and in the central part of Croatian coastlines. Regarding SOLEMON dataset, three adult species (Figure 2 adults) are: cuttlefish (Figure 2 adults) with a maximum of 1000 N/km2 concentrated mainly along the northeastern and northwestern Adriatic coast, the Common sole (Figure 2 adults) with more than 1500 N/km2 located mainly along the northwestern coast near the mouth of the Po river. This distribution is similar to the distribution of mantis shrimp (max. 500 N/km2, Figure 2 adults).
Juveniles of European hake reaches a density of 1000 N/km2 (Figure 2 Juveniles), similar to adults mainly in the central and southeastern part of the Adriatic basin, while juvenile mullet (Figure 2 Juveniles) reaches 1000-1500 individuals per km2, mainly in the western part of the Adriatic, near Apulia region. Norway lobster (estimated maximum of 40 N/km2, Figure 2 Juveniles) is found mainly in the Jabuka/Pomo Pit area, but it is also common in the southern part of the Adriatic and in the Otranto Channel. The juvenile anglerfish (Figure 2 Juveniles) shows individuals around ~ 60 N/km2 in the Otranto Channel, in the central and southern Adriatic Sea (GSA 18) and in the northern Ionian Sea (GSA 19) around the Apulia region. The juvenile broadtail shortfin squid (Figure 2 Juveniles), with values around 750 N/km2, is distributed near the central Croatian coast and the central and southern Adriatic Sea, while the juvenile European horse mackerel (Figure 2 Juveniles) is distributed mainly in the southeastern part of the Adriatic basin, along the Albanian and Montenegrin coasts, near the Italian coasts of Apulia region and in the central part of Croatia with values around 1200 N/km2. The three SOLEMON species (Figure 2 Juveniles) are: cuttlefish with 500 N/km2 mainly along north-northeastern Adriatic coast near the Venice lagoon, the mantis shrimp (max. 100 N/km2, Figure 2 Juveniles) is mainly distributed along the northwest coast near the Po’ delta, similar to common sole (Figure 2 Juveniles) with more than 700 N/km2.
In the future, with the exception of juveniles of red mullet and adults of European hake, all species show a similar pattern between adults and juveniles, with possible increases in density toward the north especially for species observed in the MEDITS survey.
In particular, the spatial distribution of differences derived from Equation 3 (Supplementary Figure S3) between the present time window and the other three time windows (‘past’, ‘2035’, and ‘2050’) shows significant negative changes in density between the ‘past’ and ‘present’ time periods for adult and juvenile fish, except for some species such as adults of Norway lobster (both adults and juveniles, Supplementary Figure S3) and adults of broadtail shortfin squid. Densities projections of several species in the ‘2035’ and ‘2050’ time periods show an increasing pattern: European hake, red mullet, anglerfish (especially in the central and western part of the basin), and European horse mackerel (adults and juveniles); a sharp decline was observed in SOLEMON species (cuttlefish, and sole, Supplementary Figure S3). In addition, the densities of anglerfish, broadtail shortfin squid of adults and anglerfish and European horse mackerel of juveniles (Supplementary Figure S3) are projected to decrease in the southeastern part of the basin, in GSA 18, near the coast of Montenegro and Albania (Supplementary Figure S3).
The comparison of median and interquartile range (Supplementary Figure S4) shows good improvement using the e-SDM for almost all species and age groups, especially in terms of uncertainty (i.e. interquartile range, particularly for adult species European hake, red mullet, broadtail shortfin squid, and cuttlefish, and juvenile species European hake, anglerfish and broadtail shortfin squid (Supplementary Figure S4). This suggests that, although not all models are good for the species studied (for example adults of Norway lobster, anglerfish and cuttlefish, and juveniles of Norway lobster, cuttlefish and mantis shrimp), the e-SDM is, on average, an excellent compromise that is a general improvement in most cases, especially for adult data that are better represented by surveys, because it captures the errors and patterns of all models by weighing the information on each model.
Nevertheless, it is clear that for some models and some species, such as TW-GAM for cuttlefish of adults and juveniles (Supplementary Figure S4) and D-GLMM for mantis shrimp of juveniles, does not represent a good model based on the whole (average) pattern. The use of the ensemble in this case ‘dampens’ the effect of the less informative models, also in terms of the statistical weight (r2) of each model used to weight the e-SDM.
The values of Gi* (Figure 3) above the third quartile for ‘present’, ‘2035’ and ‘2050’, shows that the main aggregation zone for the MEDITS species (European hake, red mullet, Norway lobster, anglerfish, European horse mackerel, broadtail shortfin squid) is located in the central and eastern part of the basins (in summer), while additional important aggregation zones are represented by the Jabuka/Pomo Pit area (Norway lobster and European hake) (Froglia and Gramitto, 1988; Melaku Canu et al., 2021) and the Croatian coast, Montenegro and Albanian coast (for adults and juveniles of the all other species).

Figure 3 Hot-spot assessment with Getis ord Gi* above the third quartile (> = 75° percentile) for each species (left panel adults and right panel juveniles) for the main scenario, present (2014-2018) and future (2035, 2050).
The hot spot area for adults (Figure 4, Adults) show that for European hake and red mullet adults are projected with important changes westward and northward respectively, while for Norway lobster is expected to loose areas in the central and southern part of the basin (between the Jabuka/Pomo Pit area and the southern part of the basin). For anglerfish the areas gained are in the central-eastern part of the basin, while for European horse mackerel no changes are projected. For SOLEMON species (mantis shrimp, cuttlefish, common sole), there is a lost area along the north coast of the Adriatic Sea, mainly for mantis shrimp and common sole, but an increase in gained areas for cuttlefish (green values) has been observed close to north-central part of the Adriatic Sea.
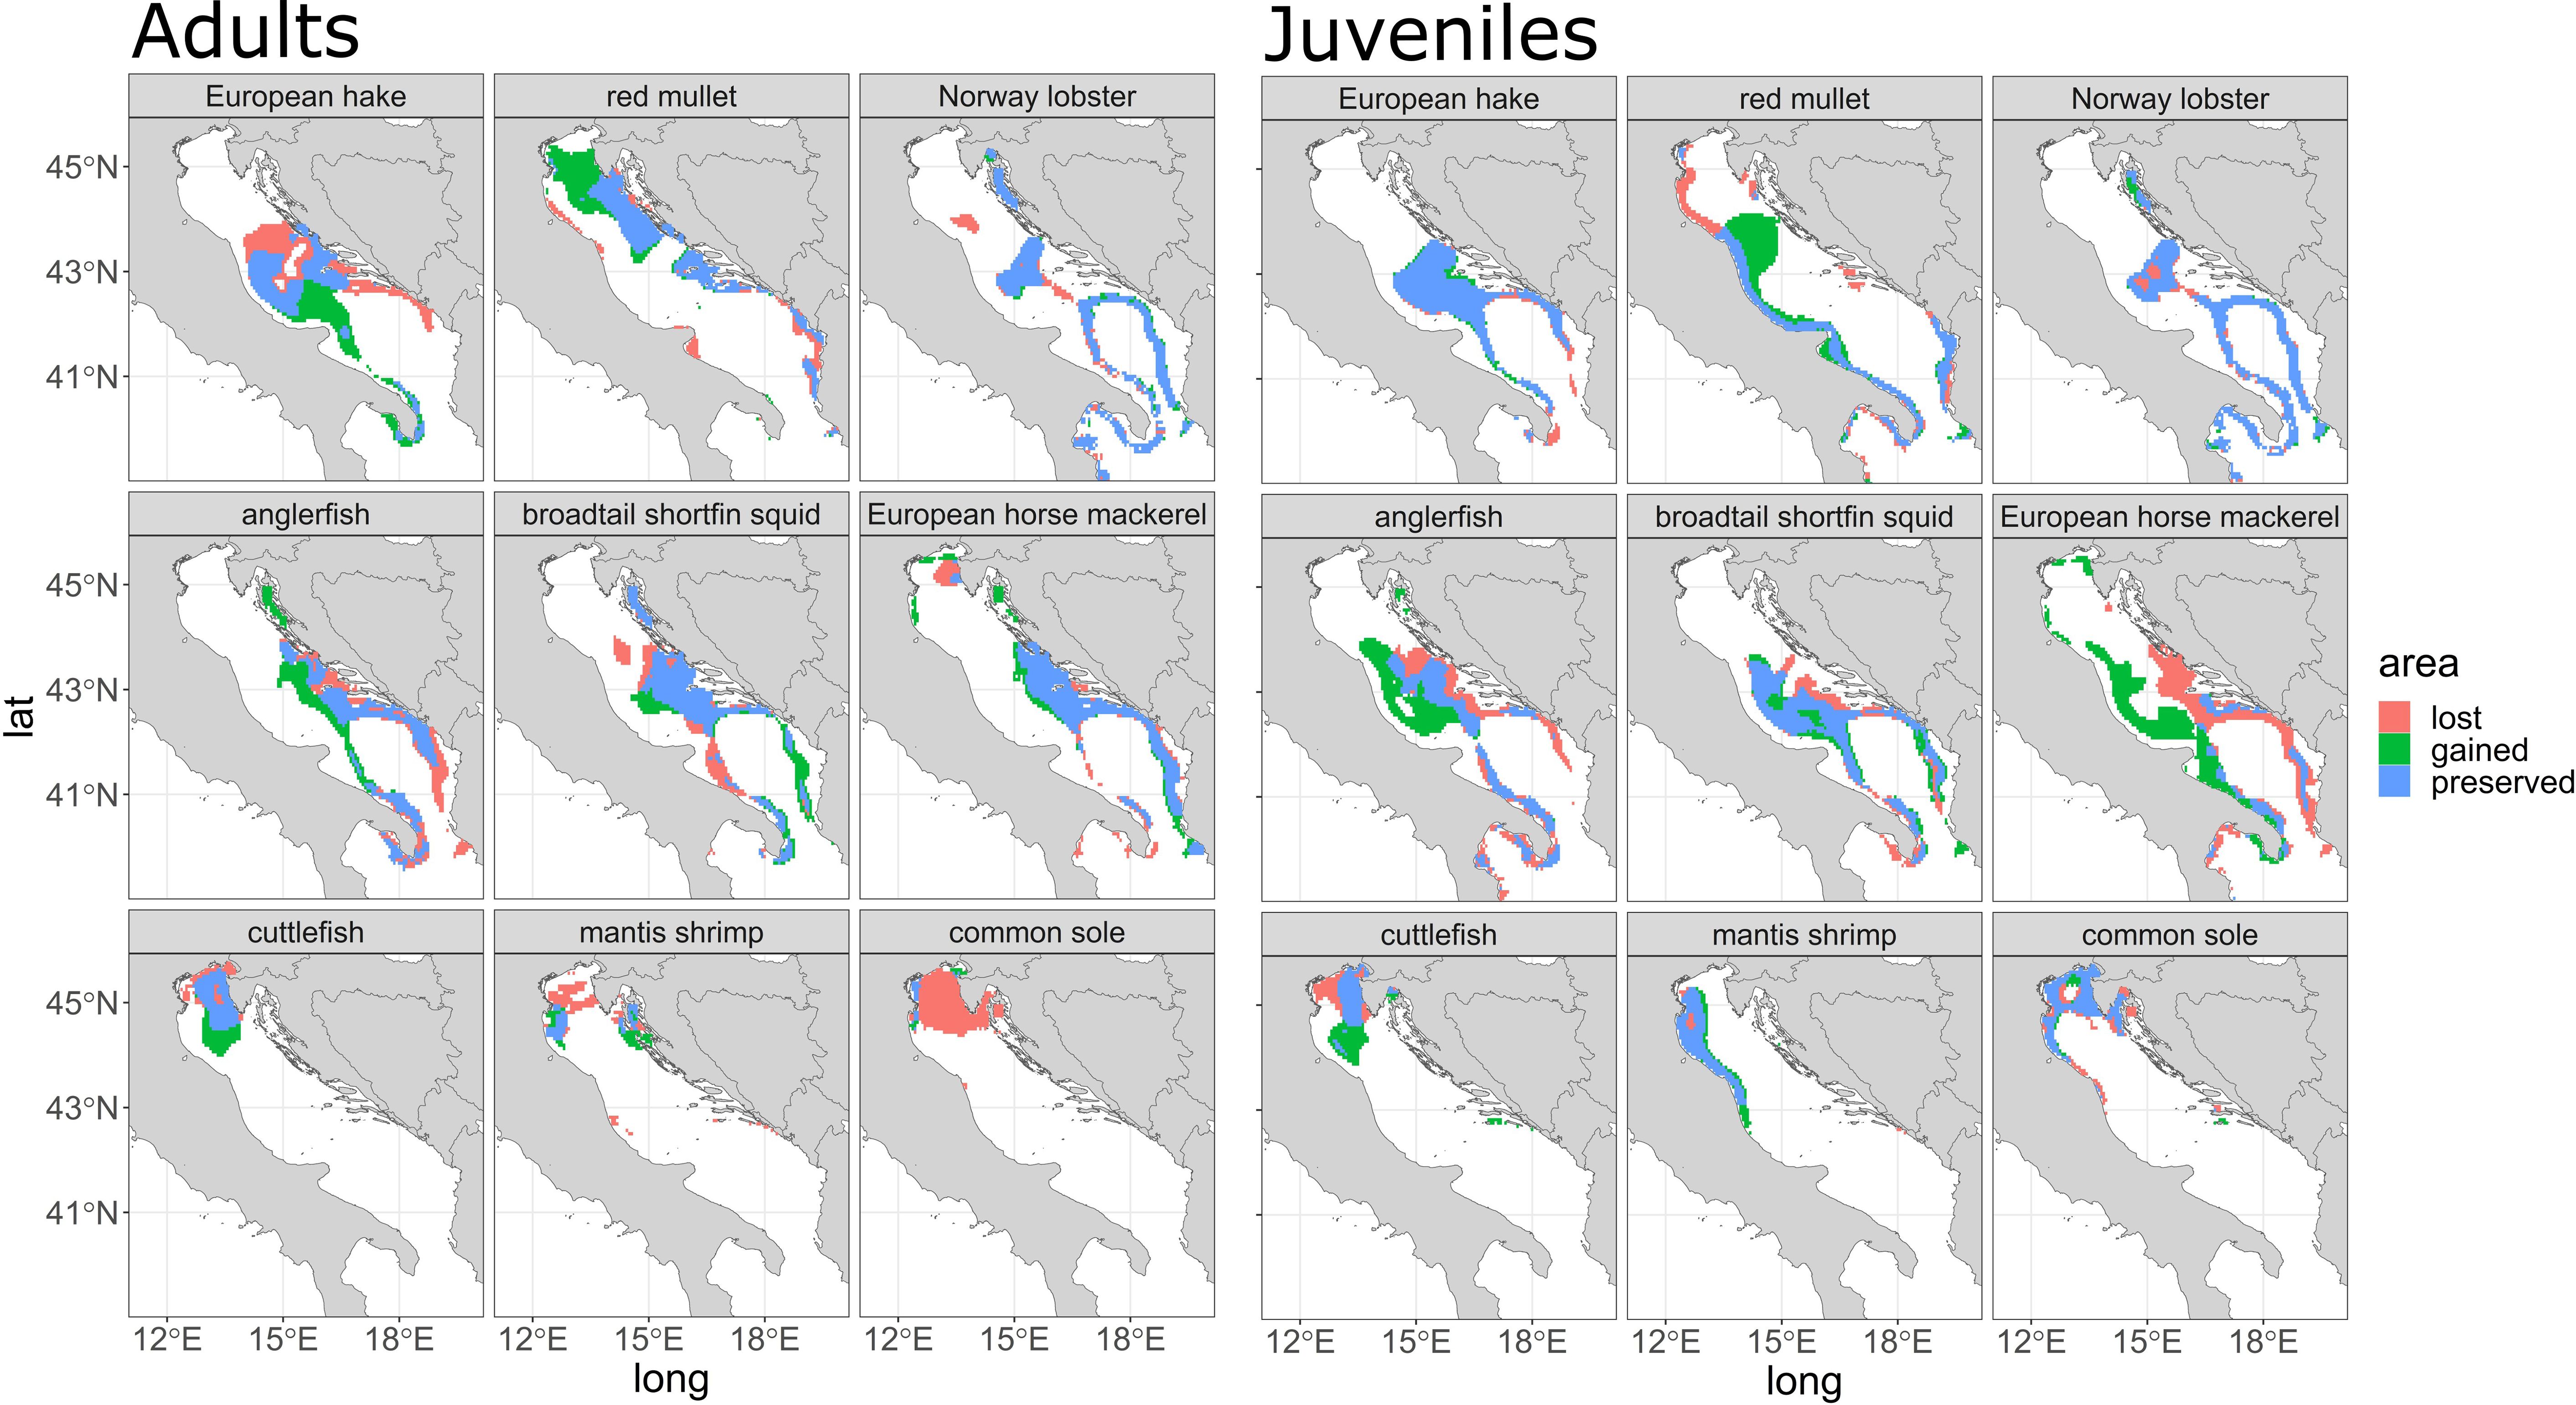
Figure 4 area gained, lost, and preserved (see legend) for each species for the year 2050 for adults (left panel) and juveniles (right panel). Each area is composed of grid cells that do not overlap (gained), overlap (preserved), and lack (lost) Getis ord-Gi* values > 75° percentile between the ‘present’ scenario and the ‘2050’ scenario.
For juveniles (Figure 4) no changes are projected for European hake, while territorial gains are found for red mullet along the north-central part of the basin. Moreover, territorial losses are projected for Norway lobster in the central and southern part of the basin, while strong territorial gains are observed for anglerfish, European horse mackerel in the central part of the Adriatic Sea and west coast of the basin. For the SOLEMON juvenile’s species, especially for cuttlefish, a lost area near the northeastern Adriatic Sea and few lost areas for mantis shrimps near the northwestern Adriatic Sea and the river Po can be recognized.
3.1 Assessment of the uncertainties in the predicted density estimation
The bias between predicted and observed values (Equation 2) (Supplementary Figure S2), illustrates the good performance of e-SDM with respect to the survey data. Table 3 summarizes the overestimation and underestimation of the bias equation averaged over grid resolutions, with colors highlighting the underestimation (light blue) or overestimation (red), as shown in Supplementary Figure S2, the latter for each survey point (i.e., averaged over years only for the ‘present’ scenario).

Table 3 Result of relative overestimation and underestimation of species density calculated as average bias (from Equation 2) over the grid resolutions and years.
For adult species, values (Table 3, column Adults) are underestimated for, Norway lobster, and anglerfish. For juvenile species (Table 3, column Juveniles), values are underestimated for anglerfish, and cuttlefish. e-SDM shows the same over- and underestimates for the same species and life stages, with the exception of Norway lobster (Table 3) and cuttlefish (Table 3).
4 Discussion
The influence of the climate change on the Adriatic Sea has been extensively studied, considering food web structure (Albouy et al., 2014), local trophic status (Sfriso et al., 2019), the overall effect of climate on future biodiversity, comparison of SDMs and multispecies trophic models (OSMOSE; Moullec et al., 2022) or biotic response to long-term climatic changes (Scarponi et al., 2022). To date, and to the best of our knowledge, few studies in the Adriatic and Ionian Seas have examined projections of species distribution under climate change conditions (Sys et al., 2022; Poos et al., 2024) with such high spatial resolution and with such an ensemble of different models, including fishery-independent data as response variables from two types of surveys (MEDITS and SOLEMON). The survey data used in this study represent a very long time series of information related to commercial species in the Adriatic and Ionian Seas providing a good and satisfactory estimate of both biomass and abundance indices (kg/km2 or N/km2) of the studied populations and their life stages.
In our study we developed a quantitative (distribution in terms of N/km2 and density differences, Figure 2 and Supplementary Figure S3, respectively) and qualitative (area gained/lost area Figure 4) representation of the projected future distribution of the main commercial species in both Adriatic and Ionian, one of the first attempt in using physical and biogeochemical projections under RCP8.5 scenarios, as produced and analyzed in Reale et al., 2022. The species here modelled live in a temperate zone, in a dead-end basin where displacement and north migration is limited. Indeed, different spatial patterns between SOLEMON and MEDITS species were observed in our results. Species mostly distributed in the southern/central part of the study area such as red mullet, anglerfish, broadtail shortfin squid and European horse mackerel, exhibits a displacement towards the north (Figure 4), especially on the eastern and central coast of the Adriatic. Species derived from the SOLEMON survey, such as cuttlefish and mantis shrimp, show a shift from east to southwest (Figure 4), especially for adults, and a lost area for adults of common sole. This indicates that the northward shift in distribution density is more pronounced in the central and southern portions of the study area. Some species derived from the MEDITS survey are projected to increase in density (Supplementary Figure S3, 2035 and 2050 panel, for both adults and juveniles) toward the north, especially along the Croatian coast and in the central part of the basin (e.g. European hake for both life stages, and European horse mackerel).
These changes are resulting from projected changes in the EOVs. The changes between ‘present’ (reanalysis) and ‘2050’ (climate projections) in the physical and biogeochemical variables for climate scenarios of our data (see Reale et al., 2022) show for example an average increase of 1-1.5 C° in the bottom temperature of the Adriatic basin and changes of ~ -15% in phosphate concentration (200-600m, mmol m-3), or -12% in nitrate concentration (200-600m, mmol m-3). The projected changes in physical and biogeochemical variables could be responsible for the abundance and spatial distribution of some species seeking more suitable habitats (Figure 4). Due to the uncertainty of the analyzes (see limitations), it is important to consider that the adaptation of certain species to possible environmental changes may also vary (e.g. Poloczanska et al., 2016), but the environmental drivers have the largest impact on the spatiality of the resources considering that these models (Supplementary Table S4) also improve their performance (e.g. explained deviance and r2) by using the biogeochemical variables employed (Panzeri et al., 2021a, b, 2023).
4.1 Implications for fisheries management
The temporal and spatial changes detected in the present study based on the data and variables used show shifts in the different species and their distribution. Furthermore, the predicted differences in density (Supplementary Figure S3) may indeed be significant (Table 2). In addition, growth, survival, and reproduction could be affected (Shoji et al., 2011), which in turn affects resources and fisheries (Bryndum-Buchholz et al., 2021). This study highlights that the main commercial species, which currently represent 60% of the total demersal landings in the area (FAO, 2022) could change their location and density in the near future, which will likely affect fishing activities and seasonal patterns. In particular, European hake, red mullet, anglerfish, and European horse mackerel (adult’s stages) and red mullet, anglerfish, and European horse mackerel (juveniles) are the stocks that will be most affected by climate change in the future with unpredictable commercial and economic impacts.
Representation of the future distribution of the species could support management spatial planning in the area, by anticipating hot spots and thus optimizing planning of spatio-temporal closure, for example. Future developments might include long term simulations based on the Shared Socioeconomic Pathways (SSPs) emission scenarios and CMIP6 ensemble members (see Lovato et al., 2022) that include changes in atmospheric carbon concentration as well as socio-economic and policy changes.
The fisheries management in the studied area is based on different approaches, including the adoption of spatial measures such as FRA (Fisheries Restricted Area, GFCM-FAO, 2017). Plotting hotspots for juvenile and adult densities of species may help us understand future prospects for fisheries grounds and management measures, particularly in the FRA (e.g Jabuka/Pomo Pit). Possible future changes in suitable areas, as we have estimated in this work, could lead to a change for the species concerned and directly affect fisheries activities in the Adriatic and Ionian Seas.
Consequently, the potential changes in species distribution may require new adaptive fisheries management measures in the future, such as adaptive spatial planning with short- and long-term regulation or differentiated control of fishing pressure in relation to the species exploited, changing spatial and temporal protection areas at manageable time frequency but also accounting for foreseen changes (Hidalgo et al., 2022). This might induce the definition or re-definition of spatial fisheries area. We also consider that the most important changes are observed in the eastern part of the Adriatic and Ionian basins, with particular interest for the Croatian, Bosnia, Albanian and Montenegrin coasts, with lost or gained area depending on the species.
We recall that the trawl survey is mainly conducted in spring and summer (for MEDITS), and that the potential impacts and changes due to climate change are exacerbated by the warmer seasons (Kim et al., 2019) and are likely to affect the main area of hotspots (Figure 3) near the eastern part of the Adriatic. Therefore, management measures should also take into account the spatial and temporal heterogeneity of the area. This aspect explains the paramount importance recently assigned in the Mediterranean Sea scientific community to the development of eddy-permitting regional ocean models able to resolve even the sub-mesoscale dynamics (Lévy et al., 2018; see Reale et al., 2022 and the discussion herein).
We must also consider that the present and future distribution of species is influenced not only by the abiotic environment, but also by the biological interactions between species (e.g. predation, competition) and anthropogenic stressors (e.g. fisheries). These processes should also be fully assessed for fisheries management based on ecosystem approaches (e.g., Koen-Alonso et al., 2019). The development of multispecies models can be useful in management and in determining how particular species may be affected not only by climatic conditions but also by intra- and interspecific interactions. For example, the use of Joint species distribution models (e.g., Roberts et al., 2022) is now essential and could be considered in future analyses.
4.2 Limitations
Sources of uncertainty of this study are primarily related to the data used, which have been extracted from a spring-summer trawl survey for MEDITS and autumn-winter survey for SOLEMON. The spatial dynamics within years cannot be fully represented by annual trawl sampling because species have relevant seasonal movements, which is an inherent limitation of the data used that cannot be overcome by the different models used. Therefore, hotspots and distribution are more relevant for species whose important aggregation phases (reproduction for adults, nursery for juveniles) coincide with the sampling period (late-spring/early summer for MEDITS (Tsikliras et al., 2010) and autumn for SOLEMON species) (Scarcella et al., 2014). Ontogenetic changes and movements are fairly well represented for all species, although in some cases the sampling periods did not overlap with the life stages here investigated.
In multispecies trawl surveys, the availability to the gear of certain species or life stage can differ, as for benthopelagic species (e.g. European horse mackerel, Supplementary Figure S2), thus causing higher variability. In addition, the species considered here, such as European hake or anglerfish, could experience other effects of climate change, with possible positive (increase in prey) or negative (decrease in prey) effects given the mismatch between them, which in turn affects trophic dynamics and the temporal mismatch between prey and predator levels (e.g., Thackeray et al., 2010).
Given recent improvements in Copernicus Marine Service products, a second source of uncertainty regards the quality levels characterizing the physical and biogeochemical data used in the model. Results from model reanalysis and future scenario projections are affected by many uncertainties (see Richon et al., 2019; IPCC, 2022; Reale et al., 2022). Progresses in quality of the Mediterranean Sea CMS products are continuous (Salon et al., 2019) and a new reanalysis at higher resolution (increasing from 1/16 to 1/24 of degree) has been recently made available (Cossarini et al., 2021). Higher quality and resolution can be included in our models providing a refinement of the results that will allow us to identify small scale patterns and the dependency of the species change patterns on mesoscale dynamics evolution (e.g. fronts and gyres). In addition, the use of discrete background variables such as seafloor eterogenity and properties could help improve the models used, especially for certain species such as Norway lobster.
5 Conclusions
Species adaptation to future climate change is difficult to account for because the successful establishment of a particular species in a new area depends not only on biotic and abiotic traits, but also on dispersal ability, demographic structure, and adaptability to new environmental conditions (Pinsky et al., 2020). In addition, we do not know whether species that arrive at a new site with similar conditions are likely to be more successful in their establishment than species that have not yet ‘settled’ due to expansion of suitable range in the future and reduction of current range (Chase and Leibold, 2009). We must also consider that a mismatch between survival processes and reproduction rates can occur if the rate of climate change is greater than a species’ adaptation rate or exceeds the population’s ability to cope with climate variability (Wang, 2022).
The e-SDM model-based approach has the aforementioned limitations and advantages associated with the inclusion of physical and biogeochemical variables derived from climate model projections (whose uncertainties are discussed in Reale et al., 2022), which are then used to evaluate the distribution of species under future climatic conditions.
With the model we developed, we aimed to determine the range of change in distribution under climate change of species that represent a large proportion of commercial landings, evaluating different aspects of their distribution and the shift of the current area of high aggregation (hot spot), since this area is strongly influenced by fisheries and will probably continue to be exploited in the future.
Data availability statement
Raw trawl survey data can be requested to the Ministry of Agriculture of Italy and Croatia. Oceanographic variables used in this work are available at Copernicus Marine Service. All treated data are available at the project FAIRSEA platform (https://fairsea.inkode.it/#/login) and access can be requested from the corresponding author.
Author contributions
DP: Conceptualization, Data curation, Formal analysis, Investigation, Methodology, Writing – original draft. MR: Data curation, Writing – original draft, Writing – review & editing. GC: Data curation, Writing – review & editing. SS: Data curation, Writing – review & editing. RC: Writing – review & editing. MS: Writing – review & editing. WZ: Writing – review & editing. NV: Writing – review & editing. SL: Conceptualization, Data curation, Supervision, Writing – review & editing, Funding acquisition, Project administration, Writing – original draft.
Funding
The author(s) declare financial support was received for the research, authorship, and/or publication of this article. This work results from activities of the project FAIRSEA (Fisheries in the Adriatic Region – a Shared Ecosystem Approach) funded by the 2014–2020 Interreg V-A Italy – Croatia CBC Programme [Standard project ID 10046951], which provided partial financial support. Further support was provided by the project funded under the National Recovery and Resilience Plan (NRRP), Mission 4, Component 2 Investment 1.4 - Call for tender No. 3138 of 16 December 2021, rectified by Decree n. 3175 of 18 December 2021 of Italian Ministry of University and Research funded by the European Union – NextGenerationEU: project code CN_00000033, Concession Decree No. 1034 of 17 June 2022 adopted by the Italian Ministry of University and Research, CUP F83B22000050001, Project title “National Biodiversity Future Center - NBFC”.
Acknowledgments
The MEDITS surveys have been carried out with the financial support of the European Commission and Member States until 2001 and subsequently within the EU Data Collection Framework. The scientific surveys’ teams and Data Collection Framework are thankfully acknowledged. The SOLEMON surveys have been carried out with the financial support of the Italian Ministry of Agriculture (MIPAAF) and National Research Council (CNR) until 2016 and subsequently within the Data Collection Framework. This study has been conducted using E.U. Copernicus Marine Service Information that is duly acknowledged. The Ministries of Agriculture of Member States of Italy and Croatia and the FAO AdriaMed Project are thankfully acknowledged for sharing information used in this work. We would like to thank Giuseppe Scarcella (CNR-IRBIM) for giving us access to the SOLEMON data.
Conflict of interest
The authors declare that the research was conducted in the absence of any commercial or financial relationships that could be construed as a potential conflict of interest.
The author(s) declared that they were an editorial board member of Frontiers, at the time of submission. This had no impact on the peer review process and the final decision.
Publisher’s note
All claims expressed in this article are solely those of the authors and do not necessarily represent those of their affiliated organizations, or those of the publisher, the editors and the reviewers. Any product that may be evaluated in this article, or claim that may be made by its manufacturer, is not guaranteed or endorsed by the publisher.
Supplementary material
The Supplementary Material for this article can be found online at: https://www.frontiersin.org/articles/10.3389/fmars.2024.1308325/full#supplementary-material
References
Albouy C., Velez L., Coll M., Colloca F., Le Loc’h F., Mouillot D., et al. (2014). From projected species distribution to food-web structure under climate change. Global Change Biol. 20, 730–741. doi: 10.1111/gcb.12467
Alfirević S. (1981). Contribution a la connaissance des caractéristiques bathymétriques et sédimentologiques de l’Adriatique. FAO Rapp. Pech. Fish 253, 43–52.
Anderson S. C., Ward E. J., English P. A., Barnett L. A. K. (2022). sdmTMB: an R package for fast, flexible, and user-friendly generalized linear mixed effects models with spatial and spatiotemporal random fields. BioRxiv, 2022.03.24.485545. doi: 10.1101/2022.03.24.485545
Azzurro E., Sbragaglia V., Cerri J., Bariche M., Bolognini L., Ben Souissi J., et al. (2019). Climate change, biological invasions, and the shifting distribution of Mediterranean fishes: A large-scale survey based on local ecological knowledge. Global Change Biol. 25, 2779–2792. doi: 10.1111/gcb.14670
Bahri T., Vasconcellos M., Welch D. J., Johnson J., Perry R. I., Ma X., et al. (Eds.) (2021). Adaptive management of fisheries in response to climate change: FAO fisheries and aquaculture technical paper No. 667 (Vol. 667) (Rome, Italy: Food & Agriculture Organisation). doi: 10.4060/cb3095en
Baudron A. R., Brunel T., Blanchet M. A., Hidalgo M., Chust G., Brown E. J., et al. (2020). Changing fish distributions challenge the effective management of European fisheries. Ecography 43, 494–505. doi: 10.1111/ecog.04864
Bellido J. M., Sumaila U. R., Sánchez-Lizaso J. L., Palomares M. L., Pauly D. (2020). Input versus output controls as instruments for fisheries management with a focus on Mediterranean fisheries. Mar. Policy 118. doi: 10.1016/j.marpol.2019.103786
Ben Rais Lasram F., Guilhaumon F., Albouy C., Somot S., Thuiller W., Mouillot D. (2010). The Mediterranean Sea as a “cul-de-sac” for endemic fishes facing climate change. Global Change Biol. 16, 3233–3245. doi: 10.1111/j.1365-2486.2010.02224.x
Bitetto I., Romagnoni G., Adamidou A., Certain G., Di Lorenzo M., Donnaloia M., et al. (2019). Modelling spatio-temporal patterns of fish community size structure across the northern mediterranean sea: An analysis combining medits survey data with environmental and anthropogenic drivers. Scientia Marina. 83, 141–151. doi: 10.3989/scimar.2019.83S1
Blasiak R., Spijkers J., Tokunaga K., Pittman J., Yagi N., Österblom H. (2017). Climate change and marine fisheries: Least developed countries top global index of vulnerability. PloS One 12, e0179632. doi: 10.1371/journal.pone.0179632
Boero F., Bonsdorff E. (2007). A conceptual framework for marine biodiversity and ecosystem functioning. Mar. Ecol. 28, 134–145. doi: 10.1111/mae.2007.28.issue-s1
Brodie S. J., Thorson J. T., Carroll G., Hazen E. L., Bograd S., Haltuch M. A., et al. (2020). Trade-offs in covariate selection for species distribution models: A methodological comparison. Ecography 43, 11–24. doi: 10.1111/ecog.04707
Bryndum-Buchholz A., Tittensor D. P., Lotze H. K. (2021). The status of climate change adaptation in fisheries management: Policy, legislation and implementation. Fish Fish. 22, 1248–1273. doi: 10.1111/faf.12586
Carbonara P., Kolitari J., Durović M., Gaudio P., Ikica Z., Kroqi G., et al. (2017). The presence of Tetraodontidae species in the Central Mediterranean: an update from the southern Adriatic Sea. Acta Adriatica 58, 325–336. doi: 10.32582/aa.58.2.11
Carbonara P., Zupa W., Follesa M. C., Cau A., Capezzuto F., Chimienti G., et al. (2020). Exploring a deep-sea vulnerable marine ecosystem: Isidella elongata (Esper 1788) species assemblages in the Western and Central Mediterranean. Deep Sea Res. Part I: Oceanogr. Res. Pap. 166, 103406. doi: 10.1016/j.dsr.2020.103406
Cardinale M., Osio G. C., Scarcella G. (2017). Mediterranean Sea: a failure of the European fisheries management system. Front. Mar. Sci. 4. doi: 10.3389/fmars.2017.00072
Carlucci R., Bandelj V., Ricci P., Capezzuto F., Sion L., Maiorano P., et al. (2018). Exploring spatio-temporal changes in the demersal and benthopelagic assemblages of the northwestern Ionian Sea (central Mediterranean Sea). Mar. Ecol. Prog. Ser. 598, 1–19. doi: 10.3354/meps12613
Chase J. M., Leibold M. A. (2009). Ecological niches: linking classical and contemporary approaches (University of Chicago Press). doi: 10.7208/chicago/9780226101811.001.0001
Chefaoui R. M., Duarte C. M., Serrão E. A. (2018). Dramatic loss of seagrass habitat under projected climate change in the Mediterranean Sea. Global Change Biol. 24, 4919–4928. doi: 10.1111/gcb.14401
Cheng L., Abraham J., Hausfather Z., Trenberth K. E. (2019). How fast are the oceans warming? Science 363, 128–129. doi: 10.1126/science.aav7619
Coll M., Piroddi C., Steenbeek J., Kaschner K., Lasram F. B. R., Aguzzi J., et al. (2010). The biodiversity of the Mediterranean Sea: Estimates, patterns, and threats. PloS One 5 (8), e11842. doi: 10.1371/journal.pone.0011842
Colloca F., Cardinale M., Maynou F., Giannoulaki M., Scarcella G., Jenko K., et al. (2013). Rebuilding Mediterranean fisheries: A new paradigm for ecological sustainability. Fish Fish. 14, 89–109. doi: 10.1111/j.1467-2979.2011.00453.x
Colloca F., Scarcella G., Libralato S. (2017). Recent trends and impacts of fisheries exploitation on Mediterranean stocks and ecosystems. Front. Mar. Sci. 4. doi: 10.3389/fmars.2017.00244
Cossarini G., Feudale L., Teruzzi A., Bolzon G., Coidessa G., Solidoro C., et al. (2021). High-resolution reanalysis of the Mediterranean Sea biogeochemistry, (1999–2019). Front. Mar. Sci. 8. doi: 10.3389/fmars.2021.741486
Cragg J. G. (1971). Some statistical models for limited dependent variables with application to the demand for durable goods. Econometria 39, 829–844. doi: 10.2307/1909582
D’Amen M., Azzurro E. (2020). Lessepsian fish invasion in Mediterranean marine protected areas: A risk assessment under climate change scenarios. ICES J. Mar. Sci. 77, 388–397. doi: 10.1093/icesjms/fsz207
Darmaraki S., Somot S., Sevault F., Nabat P. (2019). Past variability of mediterranean sea marine heatwaves. Geophys. Res. Lett. 46, 9813–9823. doi: 10.1029/2019GL082933
Dayan H., McAdam R., Juza M., Masina S., Speich S. (2023). Marine heat waves in the Mediterranean Sea: An assessment from the surface to the subsurface to meet national needs. Front. Mar. Sci 10. doi: 10.3389/fmars.2023.1045138
D’Onghia G., Maiorano P., Carlucci R., Capezzuto F., Carluccio A., Tursi A., et al. (2012). Comparing deep-sea fish fauna between coral and non-coral “megahabitats” in the Santa Maria di Leuca cold-water coral province (Mediterranean Sea). PloS One 7, e44509. doi: 10.1371/journal.pone.0044509
Dulčić J., Dragičević B., Grgičević R., Lipej L. (2011). First substantiated record of a lessepsian migrant-the dusky spinefoot, siganus luridus (actinopterygii: Perciformes: Siganidae), in the adriatic sea. Acta Ichthyol. Piscat. 41, 141–143. doi: 10.3750/AIP2011.41.2.12
Dulčić J., Grbec B. (2000). Climate change and Adriatic ichthyofauna. Fish. Oceanogr. 9, 187–191. doi: 10.1046/j.1365-2419.2000.00128.x
FAO (2022). The State of Mediterranean and Black Sea Fisheries 2022 (Rome: General Fisheries Commission for the Mediterranean). doi: 10.4060/cc3370en
FAO (2023). The State of Mediterranean and Black Sea Fisheries 2023 – Special edition (Rome: General Fisheries Commission for the Mediterranean). doi: 10.4060/cc8888en
Farahmand S., Hilmi N., Cinar M., Safa A., Lam V. W., Djoundourian S., et al. (2023). Climate change impacts on Mediterranean fisheries: A sensitivity and vulnerability analysis for main commercial species. Ecol. Econ. 211, 107889. doi: 10.1016/j.ecolecon.2023.107889
Froglia C., Gramitto M. E. (1988). An estimate of growth and mortality parameters for Norway lobster (Nephrops norvegicus) in the Central Adriatic Sea. Tech. Consult. Stock Assess. Adriatic Ionian Seas, 189–203.
Frölicher T. L., Laufkötter C. (2018). Emerging risks from marine heat waves. Nat. Commun. 9, 2015–2018. doi: 10.1038/s41467-018-03163-6
Getis A., Ord J. K. (1992). The analysis of spatial association by use of distance statistics. Geogr. Anal. 24, 189–206. doi: 10.1111/j.1538-4632.1992.tb00261.x
GFCM-FAO (2017). Reccomandation 41/2017/3 on the establishment of a fisheries restricted area in the Jabuka/Pomo Pit in the Adriatic Sea (Rome, Italy: FAO-GFCM).
GFCM-FAO (2018a). Scientific Advisory Committee on Fisheries (SAC) Second meeting of the Subregional Committee for the Western Mediterranean Report. Available online at: https://www.fao.org/gfcm/data/safs/fr/.
GFCM-FAO (2018b). Stock Assessment Demersal Form Demersal Species: Neprhops norvegicus. Reference year 2018, reporting year 2019. Available online at: https://www.fao.org/gfcm/data/safs/fr/.
GFCM-FAO (2019). Recommendation 43/2019/5 on a multiannual management plan for sustainable demersal fisheries in the Adriatic Sea (geographical subareas 17 and 18). Available online at: https://www.fao.org/gfcm/decisions/en/.
GFCM-FAO (2021a). Stock Assessment Demersal Form Demersal Species: Mullus barbatus. Reference year 2021, reporting year 2023. Available online at: https://www.fao.org/gfcm/data/safs/fr/.
GFCM-FAO (2021b). Stock Assessment Demersal Form Demersal Species: Merluccius merluccius. Reference year 2021, reporting year 2022. Available online at: https://www.fao.org/gfcm/data/safs/fr/.
GFCM-FAO (2022a). Recommendation 45/2022/8 on the implementation of a fishing effort regime for key demersal stocks in the Adriatic Sea (geographical subareas 17 and 18) in 2023, stemming from Recommendation GFCM/43/2019/5. Available online at: https://www.fao.org/gfcm/decisions/en/.
GFCM-FAO (2022b). Recommendation 45/2022/6 on a multiannual management plan for the sustainable exploitation of giant red shrimp and blue and red shrimp stocks in the Ionian Sea (geographical subareas 19 to 21), repealing Recommendations. Available online at: https://www.fao.org/gfcm/decisions/en/.
Giani M., Djakovac T., Degobbis D., Cozzi S., Solidoro C., Umani S. F. (2012). Recent changes in the marine ecosystems of the northern Adriatic Sea. Estuarine Coast. Shelf Sci. 115, 1–13. doi: 10.1016/j.ecss.2012.08.023
Grati F., Scarcella G., Polidori P., Domenichetti F., Bolognini L., Gramolini R., et al. (2013). Multi-annual investigation of the spatial distributions of juvenile and adult sole (Solea solea L.) in the Adriatic Sea (northern Mediterranean). J. Sea Res. 84, 122–132. doi: 10.1016/j.seares.2013.05.001
Greenwell B., Boehmke B., Cunningham J., Developers G. (2022). gbm: Generalized Boosted Regression: Models_ (R package version 2.1.8.1). Available at: https://CRAN.R-project.org/package=gbm.
Grüss A., Drexler M., Ainsworth C. H. (2014). Using delta generalized additive models to produce distribution maps for spatially explicit ecosystem models. Fish. Res. 159, 11–24. doi: 10.1016/j.fishres.2014.05.005
Hastie T. J., Tibshirani R. J. (1986). Generalized additive models. Gen. Addit. Model., 1–335. doi: 10.1214/ss/1177013604
Hidalgo M., El-Haweet A. E., Tsikliras A. C., Tirasin E. M., Fortibuoni T., Ronchi F., et al. (2022). Risks and adaptation options for the Mediterranean fisheries in the face of multiple climate change drivers and impacts. ICES J. Mar. Sci. 79, 2473–2488. doi: 10.1093/icesjms/fsac185
Hoegh-Guldberg O., Cai R., Poloczanska E. S., Brewer P. G., Sundby S., Hilmi K., et al. (2014). “The Ocean,” in Climate Change 2014: Impacts, Adaptation, and Vulnerability. Part B: Regional Aspects. Contribution of Working Group II to the Fifth Assessment Report of the Intergovernmental Panel on Climate Change. Eds. Barros V. R., Field C. B., Dokken D. J., Mastrandrea M. D., Mach K. J., Bilir T. E., Chatterjee M., Ebi K. L., Estrada Y. O., Genova R. C., Girma B., Kissel E. S., Levy A. N., MacCracken S., Mastrandrea P. R., White L. L. (Cambridge University Press, Cambridge, United Kingdom and New York, NY, USA), 1655–1731.
IPCC (2022). Climate Change 2022: Impacts, Adaptation and Vulnerability. Contribution of Working Group II to the Sixth Assessment Report of the Intergovernmental Panel on Climate Change. Eds. Pörtner H.-O., Roberts D. C., Tignor M., Poloczanska E. S., Mintenbeck K., Alegría A., Craig M., Langsdorf S., Löschke S., Möller V., Okem A., Rama B. (Cambridge, UK and New York, NY, USA: Cambridge University Press). 3056 pp. doi: 10.1017/9781009325844
Kearney M., Porter W. (2009). Mechanistic niche modelling: Combining physiological and spatial data to predict species’ ranges. Ecol. Lett. 12, 334–350. doi: 10.1111/j.1461-0248.2008.01277.x
Kim G. U., Seo K. H., Chen D. (2019). Climate change over the Mediterranean and current destruction of marine ecosystem. Sci. Rep. 9, 18813. doi: 10.1038/s41598-019-55303-7
Kleisner K. M., Fogarty M. J., McGee S., Barnett A., Fratantoni P., Greene J., et al. (2016). TheEffects of sub-regional climate velocity on the distribution and spatial extent of marine species assemblages. PloS One 11, e0149220. doi: 10.1371/journal.pone.0149220
Koen-Alonso M., Pepin P., Fogarty M. J., Kenny A., Kenchington E. (2019). The Northwest Atlantic Fisheries Organization Roadmap for the development and implementation of an Ecosystem Approach to Fisheries: structure, state of development, and challenges. Mar. Policy 100, 342–352. doi: 10.1016/j.marpol.2018.11.025
Lauria V., Garofalo G., Fiorentino F., Massi D., Milisenda G., Piraino S., et al. (2017). Species distribution models of two critically endangered deep-sea octocorals reveal fishing impacts on vulnerable marine ecosystems in central Mediterranean Sea. Sci. Rep. 7, 1–14. doi: 10.1038/s41598-017-08386-z
Lazzari P., Solidoro C., Ibello V., Salon S., Teruzzi A., Béranger K., et al. (2012). Seasonal and inter-annual variability of plankton chlorophyll and primary production in the Mediterranean Sea: a modelling approach. Biogeosciences 9, 217–233. doi: 10.5194/bg-9-217-2012
Lazzari P., Solidoro C., Salon S., Bolzon G. (2016). Spatial variability of phosphate and nitrate in the Mediterranean Sea: A modeling approach. Deep Sea Res. Part I: Oceanogr. Res. Pap. 108, 39–52. doi: 10.1016/j.dsr.2015.12.006
Lévy M., Franks P. J., Smith K. S. (2018). The role of submesoscale currents in structuring marine ecosystems. Nat. Commun. 9, 4758. doi: 10.1038/s41467-018-07059-3
Lewis-Beck C., Lewis-Beck M. (2015). Applied regression: An introduction (Vol. 22) (Thousand Oaks, California, USA: Sage publications).
Lovato T., Peano D., Butenschön M., Materia S., Iovino D., Scoccimarro E., et al. (2022). CMIP6 simulations with the CMCC Earth system model (CMCC-ESM2). J. Adv. Model. Earth Syst. 14, e2021MS002814. doi: 10.1029/2021MS002814
Maunder M. N., Punt A. E. (2004). Standardizing catch and effort data: A review of recent approaches. Fish. Res. 70, 141–159. doi: 10.1016/j.fishres.2004.08.002
MedECC (2020). Climate and Environmental Change in the Mediterranean Basin – Current Situation and Risks for the Future. First Mediterranean Assessment Report. Eds. Cramer W., Guiot J., Marini K. (Marseille, France: Union for the Mediterranean, Plan Bleu, UNEP/MAP), ISBN: ISBN 978-2-9577416-0-1. 632pp. doi: 10.5281/zenodo.4768833
Melaku Canu D., Laurent C., Morello E. B., Querin S., Scarcella G., Vrgoc N., et al. (2021). Nephrops norvegicus in the Adriatic Sea: Connectivity modeling, essential fish habitats, and management area network. Fish. Oceanogr. 30, 349–365. doi: 10.1111/fog.12522
Melo-Merino S. M., Reyes-Bonilla H., Lira-Noriega A. (2020). Ecological niche models and species distribution models in marine environments: A literature review and spatial analysis of evidence. Ecol. Model. 415, 108837. doi: 10.1016/j.ecolmodel.2019.108837
Moullec F., Barrier N., Drira S., Guilhaumon F., Hattab T., Peck M. A., et al. (2022). Using species distribution models only may underestimate climate change impacts on future marine biodiversity. Ecol. Model. 464. doi: 10.1016/j.ecolmodel.2021.109826
Moullec F., Barrier N., Drira S., Guilhaumon F., Marsaleix P., Somot S., et al. (2019). An end-to-end model reveals losers and winners in a warming Mediterranean Sea. Front. Mar. Sci. 6. doi: 10.3389/fmars.2019.00345
Moullec F., Ben Rais Lasram F., Coll M., Guilhaumon F., Halouani G., Hattab T., et al. (2016). “Sub-chapter 2.1.3. Climate change impacts on marine resources: From individual to ecosystem responses,” in The Mediterranean region under climate change: A scientific update. Eds. Moatti J., Thiébault S. (Montpellier, France: IRD Éditions). doi: 10.4000/books.irdeditions.23421
Nagelkerken I., Munday P. L. (2016). Animal behaviour shapes the ecological effects of ocean acidification and warming: moving from individual to community-level responses. Global Change Biol. 22, 974–989. doi: 10.1111/gcb.13167
Nie Z., Racine J. S. (2012). The crs package: nonparametric regression splines for continuous and categorical predictors. R J. 4 (2). doi: 10.32614/RJ-2012-012
Nisbet R., Elder J., Miner G. D. (2009). Handbook of statistical analysis and data mining applications. 1st edition (Cambridge, Massachusetts, USA: Academic press), 864.
Occhipinti-Ambrogi A. (2007). Global change and marine communities: alien species and climate change. Mar. pollut. Bull. 55, 342–352. doi: 10.1016/j.marpolbul.2006.11.014
Olafsdottir A. H., Utne K. R., Jacobsen J. A., Jansen T., Óskarsson G. J., Nøttestad L., et al. (2019). Geographical expansion of Northeast Atlantic mackerel (Scomber scombrus) in the Nordic Seas from 2007 to 2016 was primarily driven by stock size and constrained by low temperatures. Deep-Sea Res. Part II: Topical Stud. Oceanogr. 159, 152–168. doi: 10.1016/j.dsr2.2018.05.023
Panzeri D., Bitetto I., Carlucci R., Cipriano G., Cossarini G., D’andrea L., et al. (2021b). Developing spatial distribution models for demersal species by the integration of trawl surveys data and relevant ocean variables. J. Operat. Oceanogr. 14, 1–185. doi: 10.1080/1755876X.2021.1946240
Panzeri D., Carlucci R., Cipriano G., Bitetto I., Spedicato M. T., Solidoro C., et al. (2021a). Defining a procedure for integrating multiple oceanographic variables in ensemble models of marine species distribution. Learn. to Meas. Sea Heal. Param. IEEE, 360–365. doi: 10.1109/MetroSea52177.2021.9611559
Panzeri D., Russo T., Arneri E., Carlucci R., Cossarini G., Isailovic I., et al. (2023). Identifying priority area for spatial management of mixed fisheries using ensemble of multi-species distribution models. Fish Fish. 25, 187–204. doi: 10.1111/faf.12802
Pearman T. R. R., Robert K., Callaway A., Hall R., Iacono C. L., Huvenne V. A. (2020). Improving the predictive capability of benthic species distribution models by incorporating oceanographic data–Towards holistic ecological modelling of a submarine canyon. Prog. Oceanogr. 184, 102338. doi: 10.1016/j.pocean.2020.102338
Pinsky M. L., Selden R. L., Kitchel Z. J. (2020). Climate-driven shifts in marine species ranges: scaling from organisms to communities. Ann. Rev. Mar. Sci. 12, 153–179. doi: 10.1146/annurev-marine-010419-010916
Pinsky M. L., Worm B., Fogarty J. M., Sarmineto J. L., Levin R. S. (2013). Marine taxa track local climate velocities. Science 341, 1239–1242. doi: 10.1126/science.1239352
Pita I., Mouillot D., Moullec F., Shin Y. J. (2021). Contrasted patterns in climate change risk for Mediterranean fisheries. Global Change Biol. 27, 5920–5933. doi: 10.1111/gcb.15814
Poloczanska E. S., Burrows M. T., Brown C. J., Molinos J. G., Halpern B. S., Hoegh-Guldberg O., et al. (2016). Responses of marine organisms to climate change across oceans. Front. Mar. Sci. 3. doi: 10.3389/fmars.2016.00062
Poos J. J., Bastardie F., Damalas D., García D., Hamon K., Hintzen N., et al. (2024). SEAwise Report on fisheries spatial distribution responding to climate-related factors and ecological change. (Technical University of Denmark). doi: 10.11583/DTU.25611528.v1
Reale M., Cossarini G., Lazzari P., Lovato T., Bolzon G., Masina S., et al. (2022). Acidification, deoxygenation, and nutrient and biomass declines in a warming Mediterranean Sea. Biogeosciences 19, 4035–4065. doi: 10.5194/bg-19-4035-2022
Richon C., Dutay J. C., Bopp L., Le Vu B., Orr J. C., Somot S., et al. (2019). Biogeochemical response of the Mediterranean Sea to the transient SRES-A2 climate change scenario. Biogeosciences 16, 135–165. doi: 10.5194/bg-16-135-2019
Roberts S. M., Halpin P. N., Clark J. S. (2022). Jointly modeling marine species to inform the effects of environmental change on an ecological community in the Northwest Atlantic. Sci. Rep. 12, 132. doi: 10.1038/s41598-021-04110-0
Robinson N. M., Nelson W. A., Costello M. J., Sutherland J. E., Lundquist C. J. (2017). A systematic review of marine-based Species Distribution Models (SDMs) with recommendations for best practice. Front. Mar. Sci. 4. doi: 10.3389/fmars.2017.00421
Román-Palacios C., Wiens J. J. (2020). Recent responses to climate change reveal the drivers of species extinction and survival. Proc. Nation. Acad. Sci. U. S. A. 117, 4211–4217. doi: 10.1073/pnas.1913007117
Russo T., Carpentieri P., D’Andrea L., De Angelis P., Fiorentino F., Franceschini S., et al. (2019). Trends in effort and yield of trawl fisheries: a case study from the Mediterranean Sea. Front. Mar. Sci. 6. doi: 10.3389/fmars.2019.00153
Salon S., Cossarini G., Bolzon G., Feudale L., Lazzari P., Teruzzi A., et al. (2019). Novel metrics based on Biogeochemical Argo data to improve the model uncertainty evaluation of the CMEMS Mediterranean marine ecosystem forecasts. Ocean Sci. 15, 997–1022. doi: 10.5194/os-15-997-2019
Scarcella G., Fabi G., Grati F., Polidori P., Domenichetti F., Bolognini L., et al. (2011). “SoleMon survey for the study of flatfish stocks in the central and northern Adriatic Sea,” in International Flatfish Symposium 2011. November 5-10, 2011, IMARES Wageningen-UR, IJmuiden, The Netherlands.
Scarcella G., Grati F., Raicevich S., Russo T., Gramolini R., Scott R. D., et al. (2014). Common sole in the northern and central Adriatic Sea: Spatial management scenarios to rebuild the stock. J. Sea Res. 89, 12–22. doi: 10.1016/j.seares.2014.02.002
Scarponi D., Nawrot R., Azzarone M., Pellegrini C., Gamberi F., Trincardi F., et al. (2022). Resilient biotic response to long-term climate change in the Adriatic Sea. Glob. Change Biol. 28, 4041–4053. doi: 10.1111/gcb.16168
Schapire R. E. (2003). The boosting approach to machine learning: an overview. In: Denison D.D., Hansen M.H., Holmes C.C., Mallick B., Yu B. (eds) Nonlinear Estimation and Classification. Lecture Notes in Statistics (New York, NY: Springer), 171, 149–171. doi: 10.1007/978-0-387-21579-2_9
Sfriso A., Buosi A., Mistri M., Munari C., Franzoi P., Sfriso A. A. (2019). Long-term changes of the trophic status in transitional ecosystems of the northern Adriatic Sea, key parameters and future expectations: The lagoon of Venice as a study case. Nat. Conserv. 34, 193–215. doi: 10.3897/natureconservation.34.30473
Sheather S. J. (2009). A modern approach to regression with R. Design 102, 618. doi: 10.1007/978-0-387-09608-7_1
Shoji J., Toshito S. I., Mizuno K. I., Kamimura Y., Hori M., Hirakawa K. (2011). Possible effects of global warming on fish recruitment: shifts in spawning season and latitudinal distribution can alter growth of fish early life stages through changes in daylength. ICES J. Mar. Sci. 68, 1165–1169. doi: 10.1093/icesjms/fsr059
Simoncelli S., Fratianni C., Pinardi N., Grandi A., Drudi M., Oddo P., et al. (2019). Mediterranean Sea Physical Reanalysis (CMEMS MED-Physics) [Data set] (Copernicus Monitoring Environment Marine Service (CMEMS). doi: 10.25423/MEDSEA_REANALYSIS_PHYS_006_004
Sion L., Zupa W., Calculli C., Garofalo G., Hidalgo M., Jadaud A., et al. (2019). Spatial distribution pattern of european hake, merluccius merluccius (Pisces: Merlucciidae), in the mediterranean sea. Scientia Marina 83, 21–32. doi: 10.3989/scimar.2019.83S1
Smale D. A., Wernberg T., Oliver E. C. J., Thomsen M., Harvey B. P., Straub S. C., et al. (2019). Marine heatwaves threaten global biodiversity and the provision of ecosystem services. Nat. Climate Change. 9, 306–312. doi: 10.1038/s41558-019-0412-1
Solidoro C., Cossarini G., Lazzari P., Galli G., Bolzon G., Somot S., et al. (2022). Modeling carbon budgets and acidification in the Mediterranean Sea ecosystem under contemporary and future climate. Front. Mar. Sci. 8. doi: 10.3389/fmars.2021.781522
Soto-Navarro J., Jordá G., Amores A., Cabos W., Somot S., Sevault F., et al. (2020). Evolution of Mediterranean Sea water properties under climate change scenarios in the Med-CORDEX ensemble. Climate Dynamics 54, 2135–2165. doi: 10.1007/s00382-019-05105-4
Spedicato M. T., Massutí E., Mérigot B., Tserpes G., Jadaud A., Relini G. (2019). The medits trawl survey specifications in an ecosystem approach to fishery management. Scientia Marina. 84, 309. doi: 10.3989/scimar.04915.11X
Sys K., Rindorf A., Bastardie F., Baudron A., Berg C., Bitetto I., et al. (2022). SEAwise report on historic and future spatial distribution of fished stocks (Lyngby, Copenhagen, Denmark: Technical University of Denmark). doi: 10.11583/DTU.21694934
Templado J. (2014). Future trends of mediterranean biodiversity. In: Goffredo S., Dubinsky Z. (eds) The Mediterranean Sea. Dordrecht: Springer. doi: 10.1007/978-94-007-6704-1_28
Teruzzi A., Bolzon G., Cossarini G., Lazzari P., Salon S., Crise A., et al. (2019). Mediterranean Sea biogeochemical reanalysis (CMEMS MED-biogeochemistry)[data set] (Copernicus Monitoring Environment Marine Service (CMEMS).
Thackeray S. J., Sparks T. H., Frederiksen M., Burthe S., Bacon P. J., Bell J. R., et al. (2010). Trophic level asynchrony in rates of phenological change for marine, freshwater and terrestrial environments. Global Change Biol. 16, 3304–3313. doi: 10.1111/j.1365-2486.2010.02165.x
Thorson J. T., Shelton A. O., Ward E. J., Skaug H. J. (2015). Geostatistical delta-generalized linear mixed models improve precision for estimated abundance indices for west coast groundfishes. ICES J. Mar. Sci. 72, 1297–1310. doi: 10.1093/icesjms/fsu243
Tsikliras A. C., Antonopoulou E., Stergiou K. I. (2010). Spawning period of Mediterranean marine fishes. Rev. Fish Biol. Fish. 20, 499–538. doi: 10.1007/s11160-010-9158-6
UNEP-MAP-RAC/SPA (2015). Adriatic Sea: Status and conservation of fisheries. By Farrugio, H. & Soldo, A. Eds. Cebrian D., Requena S. (Tunis: RAC/SPA). 58 pp.
Valavi R., Elith J., Lahoz-Monfort J. J., Guillera-Arroita G. (2019). blockCV: An r package for generating spatially or environmentally separated folds for k-fold cross-validation of species distribution models. Methods Ecol. Evol. 10, 225–232. doi: 10.1111/2041-210X.13107
Wang Z. (2022). “Influence of Climate Change On Marine Species and Its Solutions,” in IOP Conference Series: Earth and Environmental Science, vol. 1011. (Bristol, England: IOP Publishing), 012053. doi: 10.1088/1755-1315/1011/1/012053
Wickham H. (2016). ggplot2: Elegant Graphics for Data Analysis. Springer-Verlag New York. https://ggplot2.tidyverse.org.
Wilcoxon F. (1945). Individual comparisons by ranking methods. Biom. Bull. 1, 80–83. doi: 10.2307/3001968
Keywords: marine species distribution, ensemble model, climate change, fisheries management, Adriatic and Ionian Seas
Citation: Panzeri D, Reale M, Cossarini G, Salon S, Carlucci R, Spedicato MT, Zupa W, Vrgoč N and Libralato S (2024) Future distribution of demersal species in a warming Mediterranean sub-basin. Front. Mar. Sci. 11:1308325. doi: 10.3389/fmars.2024.1308325
Received: 06 October 2023; Accepted: 24 April 2024;
Published: 22 May 2024.
Edited by:
Iris Eline Hendriks, Spanish National Research Council (CSIC), SpainReviewed by:
Emna Ben Lamine, Université de Nice Sophia Antipolis, FranceJinlin Liu, Tongji University, China
Copyright © 2024 Panzeri, Reale, Cossarini, Salon, Carlucci, Spedicato, Zupa, Vrgoč and Libralato. This is an open-access article distributed under the terms of the Creative Commons Attribution License (CC BY). The use, distribution or reproduction in other forums is permitted, provided the original author(s) and the copyright owner(s) are credited and that the original publication in this journal is cited, in accordance with accepted academic practice. No use, distribution or reproduction is permitted which does not comply with these terms.
*Correspondence: Diego Panzeri, ZHBhbnplcmlAb2dzLml0