 Wei Yang1
 Yu Zhao2
 Yingxu Wu1*Zijie Chen2Xiang Gao1Hongmei Lin3
 Zhangxian Ouyang4
 Weijun Cai4
 Liqi Chen1
 Di Qi1*
- 1Polar and Marine Research Institute, College of Harbor and Coastal Engineering, Jimei University, Xiamen, China
- 2Marine Science College, Nanjing University of Information Science & Technology, Nanjing, China
- 3Key Laboratory of Global Change and Marine-Atmospheric Chemistry of Ministry of Natural Resources (MNR), Third Institute of Oceanography, Xiamen, China
- 4School of Marine Science and Policy, University of Delaware, Newark, DE, United States
The strong CO2 sink in Arctic Ocean plays a significant role in the global carbon budget. As a high-latitude oceanic ecosystem, the features of sea surface pCO2 and air-sea CO2 flux are significantly influenced by sea ice melt; however, our understanding of pCO2 evolution during sea ice melt remains limited. In this study, we investigate the dynamics of pCO2 during the progression of sea ice melt in the western Arctic Ocean based on data from two cruises conducted in 2010 and 2012. Our findings reveal substantial spatiotemporal variability in surface pCO2 on the Chukchi Sea shelf and Canada Basin, with a boundary along the shelf breaks at depths of 250-500 m isobaths. On the Chukchi Sea shelf, strong biological consumption dominates pCO2 variability. Moreover, in Canada Basin, the pCO2 dynamics are modulated by various processes. During the active sea ice melt stage before sea ice concentration decreases to 15%, biological production through photosynthetic processes and dilution of ice melt water lead to a reduction in DIC concentration and subsequent decline in pCO2. Further, these effects are counteracted by the air-sea CO2 exchange at the sea surface which tends to increase seawater DIC and subsequently elevate surface pCO2. Compared to the pCO2 reduction resulting from biological production and dilution effects, the contribution of air-sea CO2 exchange is significantly lower. The combined effects of these factors have a significant impact on reducing pCO2 during this stage. Conversely, during the post sea ice melt stage, an increase in pCO2 resulting from high temperatures and air-sea CO2 exchange outweighs its decrease caused by biological production. Their combined effects result in a prevailing increase in sea surface pCO2. We argue that enhanced air-sea CO2 uptake under high wind speeds also contributes to the high sea surface pCO2 observed in 2012, during both active sea ice melt stage and post sea ice melt stage. The present study reports, for the first time, the carbonate dynamics and pCO2 controlling processes during the active sea ice melt stage. These findings have implications for accurate estimation of air-sea CO2 fluxes and improved modeling simulations within the Arctic Ocean.
Highlights
● The decrease in DIC resulting from biological production and dilution of ice melt water tends to reduce pCO2 during the active sea ice melt stage in Canada Basin, although it is counteracted by CO2 uptake at the air-sea interface.
● The increase in pCO2 resulting from high temperatures and air-sea CO2 exchange outweighs its decrease caused by biological production, leading to elevated sea surface pCO2 during the post sea ice melt stage in Canada Basin.
● The enhanced air-sea CO2 uptake under high wind speeds also contributes to the high sea surface pCO2 observed in 2012, during both active sea ice melt stage and post sea ice melt stage.
1 Introduction
Since the beginning of the first industrial revolution, anthropogenic activities have resulted in substantial carbon emissions into the atmosphere. Consequently, atmospheric carbon dioxide (CO2) levels have continuous risen from 280 ppm in 1850 to 417 ppm in 2022. However, this increase accounts for only 49% of total carbon emissions, and 29% of emitted CO2 has been absorbed by surface ocean (Friedlingstein et al., 2022). Due to the high solubility of CO2 in low-temperature waters, the Arctic Ocean and its adjacent marginal seas serve as a significant CO2 sink (Anderson and Kaltin, 2016; Yasunaka et al., 2018). Observations and model simulations have indicated that the Arctic Ocean absorbs 58-180 Tg C per year, accounting for 2%-7% of the global oceanic carbon sink (Manizza et al., 2013; Yasunaka et al., 2016; Mortenson et al., 2020). In recent decades, rapid and diverse changes, for example the increased seawater temperature, ice sheet melt, and an extended ice-free period, have occurred in Arctic ecosystems (Screen and Simmonds, 2010; Shepherd et al., 2012; Jeong et al., 2018). These changes exert a significant influence on sea surface pCO2 and air-sea CO2 fluxes. For instance, in the context of global warming, the Chukchi Sea has transitioned from being perennially covered by ice to becoming seasonally ice-free during the past two decades, and the summer CO2 uptake has significantly increased by l.4 ± 0.6 Tg C per decade (Ouyang et al., 2022).
Different from observations made in low/middle latitudinal marginal seas and open oceans, the features of sea surface pCO2 and air-sea CO2 flux in Arctic Ocean are significantly influenced by the presence of sea ice (Bates et al., 2011; Qi et al., 2020). During cold seasons, despite the elevated pCO2 values beneath the sea ice, the air-sea CO2 exchange is impeded by ice, resulting in relatively low CO2 fluxes (Schuster et al., 2013; Cross et al., 2014; DeGrandpre et al., 2020). In contrast to observations in cold seasons, the water column stratification ensues during warm seasons when sea ice melts and freshwater input occurs. This leads to a decrease in pCO2 values and consequently enhances the CO2 sink at the sea surface (Riedel et al., 2008). Moreover, the mixing of ice melt water featured low pCO2 values, CaCO3 dissolution, and photosynthesis during algal blooms would further decrease pCO2 values and facilitate CO2 dissolving into seawater (Fransson et al., 2009; Geilfus et al., 2012). However, this pCO2 drawdown would be counteracted by the increased sea surface temperature and the strong CO2 sink at the sea surface (Burgers et al., 2017; Islam et al., 2017; Pipko et al., 2017). In the seawater carbonate system, a frequent occurrence of high pCO2 is observed in accordance with elevated SST values due to its decreased solubility at high temperatures (Wanninkhof et al., 2022). Additionally, the air-sea CO2 exchange at the sea surface tends to increase seawater DIC in the Arctic Ocean, subsequently elevating seawater pCO2 (Yang et al., 2023). Moreover, changes in wind fields, such as high wind speeds (>10 m/s) and upwelling-favorable wind, tend to upward transport the nutrient enriched water to subsurface. This nutrient supply significantly increases the net primary production (NPP), which consumes DIC and decreases the sea surface pCO2 (Xu et al., 2023).
As previously mentioned, the spatiotemporal variability of hydrographic features and carbonate parameters during sea ice melt is influenced by various processes; however, their contributions to the dynamics of sea surface pCO2 remain unclear. Previous studies have reported the pCO2 dynamics during sea ice melt through model simulations and field measurements (e.g., Nomura et al., 2010; Fransson et al., 2017; DeGrandpre et al., 2020), but limited attention has been devoted to its changes prior to the melting process (DeGrandpre et al., 2020).
The Arctic Ocean serves as a conduit for water exchange between the Pacific and Atlantic oceans, and its biogeochemical cycling is influenced by lateral inputs of nutrients from sources like nutrient-rich inflows through the Barents Sea (North Atlantic) and Chukchi Sea (North Pacific) (Schuster et al., 2013). Characterized by intricate interactions and feedbacks among sea ice, ocean, and atmosphere, the Arctic Ocean plays a crucial role in the global climate system, (Bates et al., 2011). In the context of global warming, there has been a significant decline in seasonal sea ice extent in the Arctic Ocean over the past four decades, accompanied by a more recent year-round decrease in sea ice extent, area, and volume (Polyakov et al., 2020). For instance, arctic sea ice extent has decreased at a rate of 13.1% per decade in September and 2.6% per decade in March; furthermore, the annual mean thickness of sea ice in the central Arctic Ocean reduced from 3.59 m to 1.25 m between 1975 and 2012 (Lindsay and Schweiger, 2015; Garcia-Soto et al., 2021). The reduction of sea ice content would hinder dense water formation while slowing down deep water circulation processes, leading to diminished CO2 sequestration capacity (Semiletov et al., 2004).
In this study, we investigated the pCO2 dynamics during two cruises in the western Arctic Ocean using underway measurements downloaded from an online database. Firstly, we identified the dominant processes governing the variations in pCO2 and subsequently used a 1-D dynamic model to simulate pCO2 values in the western Arctic Ocean during sea ice melt. Finally, we quantified changes in pCO2 between different stages of sea ice melt and elucidated their underlying controlling mechanisms.
2 Data and methods
2.1 Study area
The Arctic Ocean is a distinct basin surrounded by vast continental land masses. Based on hydrographic, topographic, and ocean circulation characteristics, the Arctic Ocean can be classified into various sub-regions such as the Norwegian Sea, Barents Sea, East Siberian Sea, Chukchi Sea, Beaufort Sea and the Canada Basin (Yasunaka et al., 2018). In this study, we divided the western Arctic Ocean into three sub-regions, as (1) the nutrient-rich Chukchi Sea shelf with a latitude range of 65-75°N; (2) the oligotrophic Canada Basin separated from the Chukchi Shelf along the shelf breaks at depths of 250-500 m isobaths; and (3) the Beaufort Sea separated from both the Chukchi Sea and Canada Basin by boundaries defined as longitude 152°W and latitude 72°N (Figure 1). Considering the different sea ice concentration (SIC) values presented in Table 1, we further divided the Canada Basin into two sub-regions, i.e. a sea ice covered zone (>77°N) and a rapid sea ice melt zone (<77°N). In Canada Basin, the water column can be categorized into five primary water masses, namely Pacific Winter Water (PWW), Alaska Coastal Water (ACW), Chukchi Summer Water (CSW), Early-Season Melt Water (ESMW), and Late-Season Melt Water (LSMW). During the warm seasons, ESMW and LSMW exert significant influence on the characteristics of surface water, confirming the impact of sea ice melt water (Qi et al., 2022a).
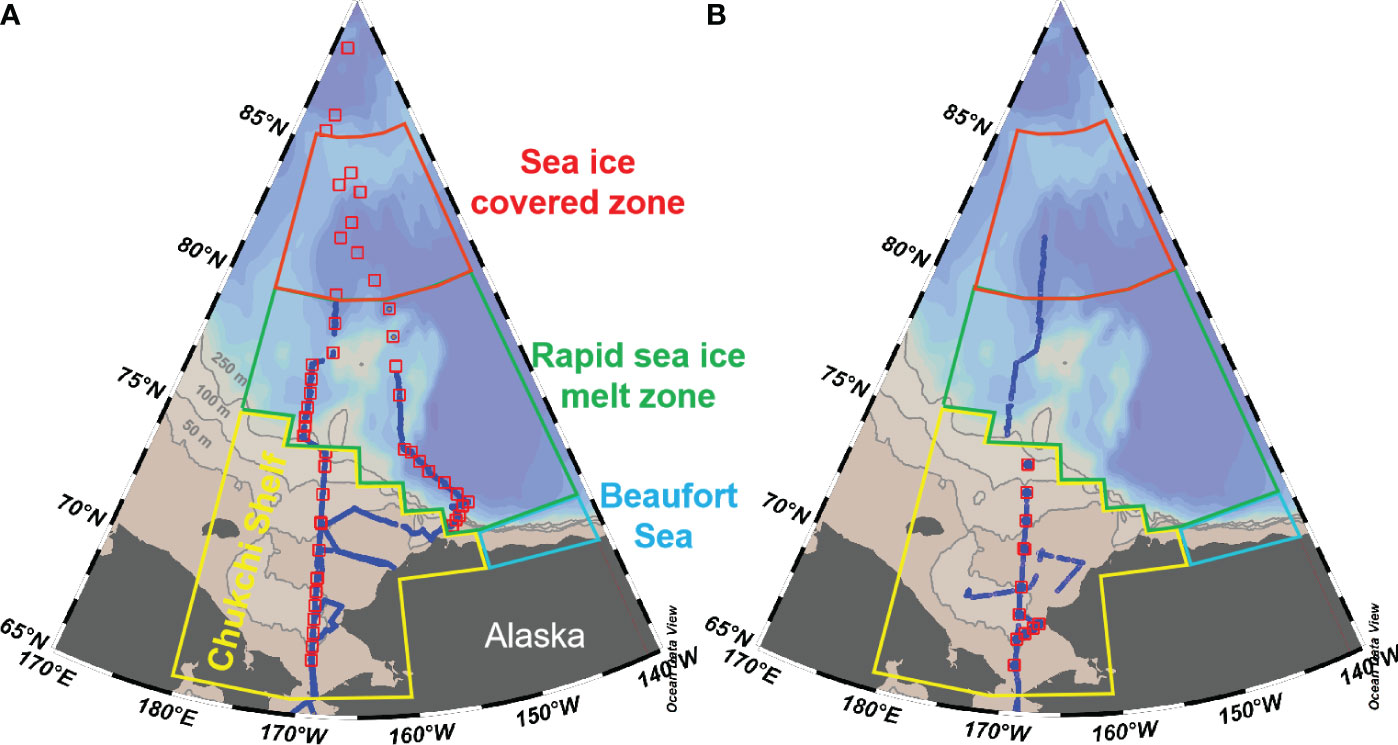
Figure 1 Maps showing the location of sampling stations (red squares) and underway measurements (blue dotes) in the western Arctic Ocean during 2010 (A) and 2012 (B). Also shown are the boundary of different sub-regions following Ouyang et al. (2022): (1) Chukchi Sea shelf with latitude of 65-75°N, as shown by the yellow line; (2) Canada Basin, separated from the Chukchi Shelf along the 250-500 m isobaths; (3) the Beaufort Sea, separated from the Chukchi Sea and Canada Basin along 152°W and 72°N, respectively. Considering the different sea ice concentrations during warm seasons, we further divided the Canada Basin into two sub-regions with a latitude of 80°N, i.e. the sea ice covered zone and the rapid sea ice melt zone (Ouyang et al., 2022).
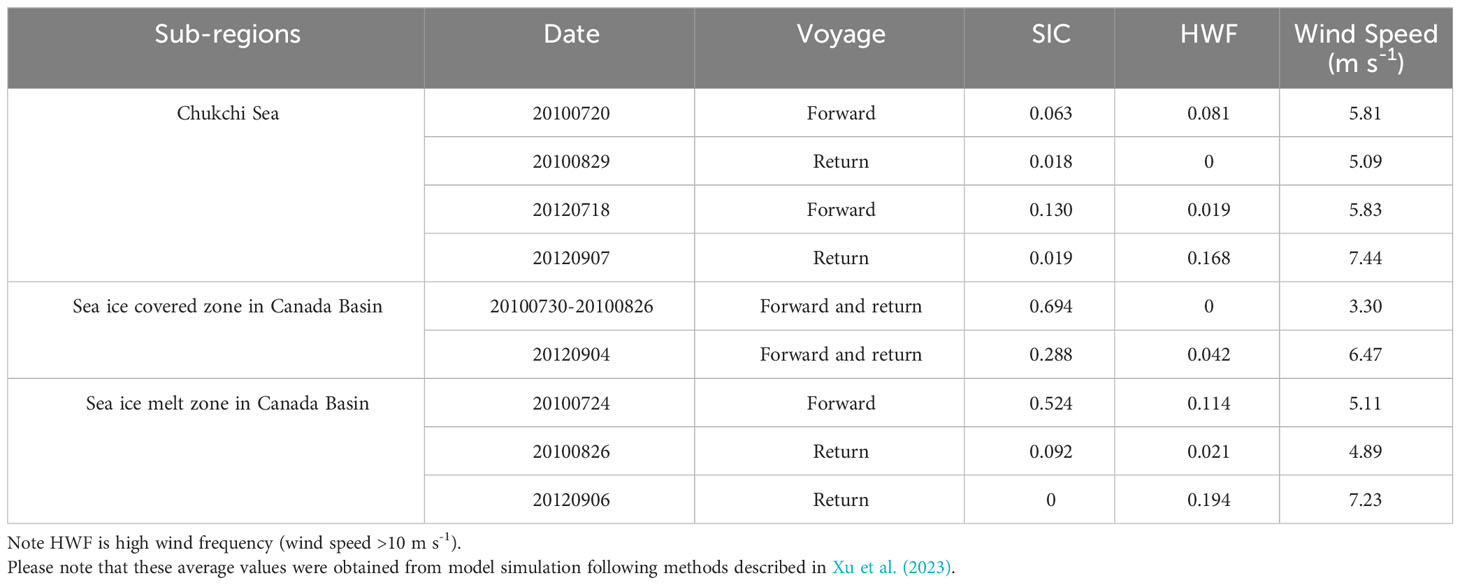
Table 1 Summary of sea ice concentration (SIC), high wind frequency (HWF) and wind speed in different sub-regions.
2.2 Data source
In this study, the in situ temperature, salinity, dissolved inorganic carbon (DIC), total alkalinity (TA), air and seawater pCO2 values in the western Arctic Ocean were obtained from the Climate Variability and Predictability Experiment (CLIVAR) database (https://www.ncei.noaa.gov/access/ocean-carbon-acidification-data-system/oceans/RepeatSections/) (Figure 1). The data were collected during the 4th and 5th Chinese National Arctic Research Expedition (CHINARE) in 2010 and 2012, respectively. Detailed sampling and analysis methods for these two cruises can be found in Ouyang et al. (2020). Wind speed was obtained from JRA-55 reanalysis dataset (http://search.diasjp.net/en/dataset/JRA55), which has a spatial resolution of 0.5625° latitude/longitude and a temporal resolution of 3 hours (Japan Meteorological Agency/Japan, 2013). Near-surface winds were utilized to calculate the high wind frequency (HWF), representing the percentage of time when wind speed exceeds 10 m/s (Xu et al., 2023).
2.3 Air-sea CO2 flux estimation
The net air-sea CO2 flux (FCO2, mmol C m-2 d-1) is calculated as (see Equation 1):
where k represents the gas transfer velocity (m d-1), a denotes the solubility of CO2 (mol kg-1 atm-1; Weiss, 1974); pCO2s and pCO2a represent the partial pressure of CO2 in seawater and atmosphere, respectively, and their difference (defined as ΔpCO2) determines the direction of CO2 transfer; SIC is the sea ice concentration with values ranging from 0 to 1. Please note that the SIC data utilized in this study were obtained from the NSIDC (Nation Snow and Ice Data Center) database (https://nsidc.org/data/nsidc-0079/versions/3).
The gas transfer velocity was calculated following Wanninkhof (2014), as (see Equation 2):
where U10 represents wind speed at 10 m height. Sc corresponds to Schmidt number for CO2, which was determined using equations in Wanninkhof (2014).
2.4 Modeling the pCO2 values with a 1-D dynamic approach
In this study, a mass balance model was used to simulate the pCO2 dynamics during sea ice melt. For each simulation step (Δt, 1 day in this study), sea surface pCO2 was calculated from TA and DIC at the corresponding step. A change in DIC inventory for a time step, Δt, in the surface mixed layer (defined as ΔDICt) is calculated as follows (see Equation 3):
where FCO2t, NCPt, and ΔDIC(diluted)t indicate the changes in DIC inventory (μmol kg-1) induced by air-sea CO2 flux (mmol C m-2 d-1), net community production (NCP, mmol C m-2 d-1), and melt water dilution (ΔDIC(diluted)t, μmol kg-1) at simulation time step t, respectively. MLD (m) and ρ (set as 1.021×10³ kg m-3) are the mixed layer depth and density of surface seawater.
During the model simulation, we assumed that the dilution of ice melt water will change the concentrations of DIC and TA in the seawater at a same rate, which has been previously proposed and utilized by Qi et al. (2022b). In Arctic Ocean, the TA and DIC values in surface water were set as 1959 μmol kg-1 and 1880 μmol kg-1, respectively, which were much higher than that in the ice melt water end-member (TA=400 μmol kg-1, DIC=450 μmol kg-1) (Yang et al., 2023). The mixing of ice melt water have negligible influence on the TA/DIC ratio in surface water, which is close to 1:1. Therefore, any changes in DIC induced by dilution (defined as ΔDIC(diluted)t) can be quantified as follows (see Equation 4):
where (TAt+1-TAt)/TAt is the changing rate in TA during sea ice melt. And DIC at time step t+1 is iteratively calculated as follows (see Equation 5):
Due to the dilution caused by ice melt water, TA in the seawater decreased continuously from its initial values at a SIC of 95% to low values at a SIC of 0% during the sea ice melt. Subsequently, TA remained constant during the ice free period. With the new DIC and TA for the next simulation step, a new pCO2 is calculated, and this simulation process repeats until the last day.
3 Results
3.1 Distributions of sea surface temperature, salinity and pCO2 in the western Arctic Ocean
The surface distributions of temperature (SST), salinity (SSS), and pCO2 during both cruises are shown in Figure 2, which exhibited significant spatial variability. In 2010, SST ranged from -2.0 to 8.0 °C, exhibiting a latitudinal decreasing trend (Figure 2A). The Chukchi Sea exhibited the highest SST values, followed by the rapid sea ice melt zone and the sea ice covered zone in Canada Basin. This distribution pattern aligns with previous studies conducted by Sun et al. (2017) and Yang et al. (2023), which can be attributed to reduced solar radiation at higher latitudes and the influence of warm Pacific surface water on the Chukchi Sea shelf (Zheng et al., 2021). SSS displayed their highest values on the Chukchi Sea shelf, ranging from 29 to 32.5, while relatively lower values were observed in Canada Basin, ranging from 25.5 to 29 (Figure 2B). As mentioned earlier, high salinity on the Chukchi Sea shelf reflects the influence of Pacific Source Water, whereas low salinity surface water in Canada Basin is likely diluted by ice melt water (Geilfus et al., 2012). The sea surface pCO2 during this cruise exhibited a range of 100-350 μatm (Figure 2C). Low pCO2 values were observed on the Chukchi Sea shelf, whereas high values were observed in Canada Basin. On the Chukchi Sea shelf, the low pCO2 values can be attributed to the high biological production sustained by nutrient-rich Bering Strait through flow (Tu et al., 2021; Zheng et al., 2021). In Canada Basin, sea ice exerts a significant influence on regulating the dynamics of sea surface pCO2 during both sea ice formation and melt processes. The evolution of sea surface pCO2 during the sea ice melt will be further quantified in the subsequent discussion.
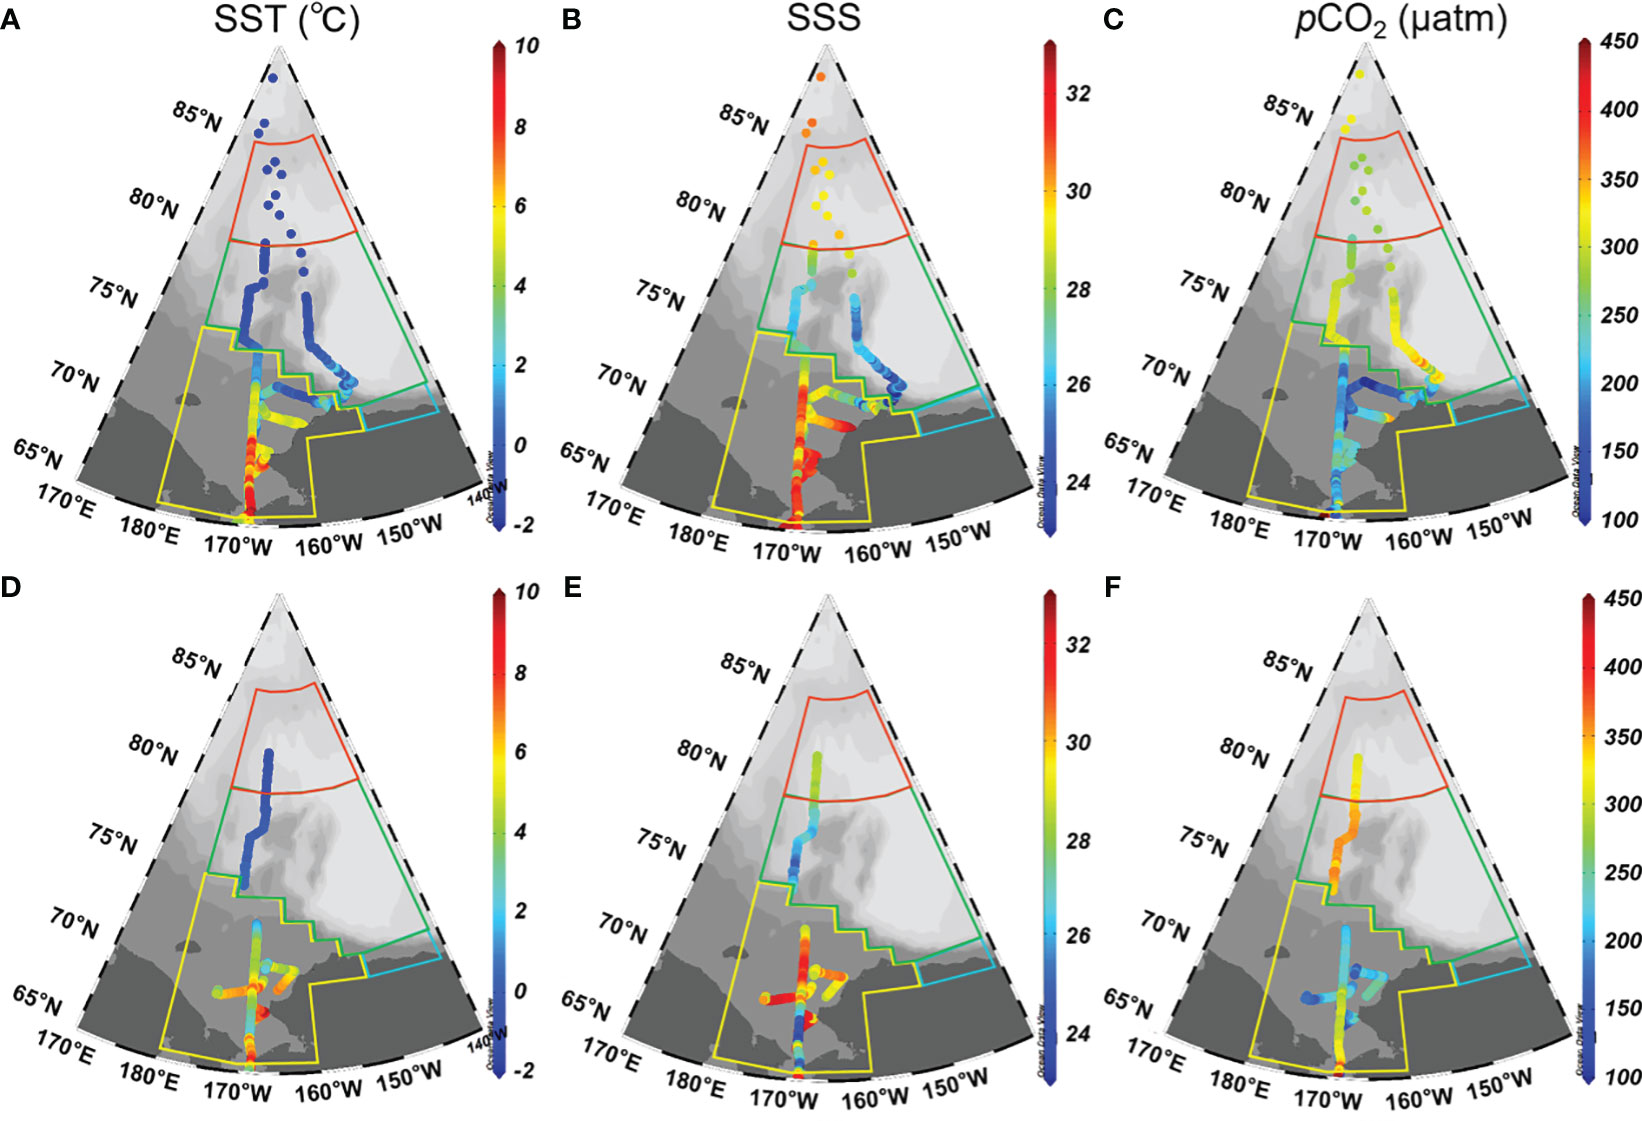
Figure 2 Surface distributions of temperature (left panels), salinity (middle panels), and pCO2 (right panels) in the western Arctic Ocean in 2010 (A–C) and 2012 (D–F). In (A, B), SST and SSS observed north of 80° N are sourced from bottle data. In (C), pCO2 were calculated from DIC and TA using the CO2SYS program (Pierrot et al., 2006), which employed dissociation constants for carbonic acid from Mehrbach et al. (1973), as refitted by Dickson and Millero (1987), along with the dissociation constant for HSO4- determined by Dickson (1990). The relationship between total boron and salinity followed Uppstrom (1967).
In 2012, SST, SSS, and pCO2 ranged -1-7.5 °C, 25.0-32.0, and 180-360 μatm, respectively (Figures 2D–F). Due to the influence of Pacific Water, the Chukchi Sea shelf exhibited significantly higher SST and SSS compared to the Canada Basin, which is consistent with the observations made in 2010. In contrast to the observations in Canada Basin, the sea surface pCO2 on the Chukchi Sea shelf was observed to be at its lowest level.
3.2 Distributions of SIC, HWF and wind speed in the western Arctic Ocean
As shown in Table 1, the surface water in the northernmost sea ice covered zone was predominantly encompassed by sea ice with SIC values ranging from 0.29 to 0.69 throughout the sampling period. In the rapid sea ice melt zone, distinct SIC values were recorded during these three voyages, ranging from 0 to 0.524. On the Chukchi Sea shelf, there was a minor influence of sea ice melt as evidenced by low SIC values ranging from 0.02 to 0.13. The highest HWF and wind speed were observed during the cruise in 2012.
4 Discussion
4.1 Controlling processes to the dynamics of sea surface pCO2 in Canada Basin
4.1.1 Temperature effect
During both cruises, the variability of SST ranged from -1.6 °C to 4.0 °C, which could significantly impact the distribution patterns of surface pCO2. To assess the influence of temperature on pCO2 variability, we plotted the relationship between lnpCO2 and SST (Figure 3A). In 2010, a positive correlation was observed with an equation of lnpCO2 = 0.0394×SST+5.7704 (R2 = 0.38, p<0.05). Wanninkhof et al. (2022) suggested an exponential increase in pCO2 with rising temperature at a rate of 4.13% °C-1. Although the observed slope was nearly consistent with the theoretical value of 0.0413, the correlation coefficient is only 0.6 (R=0.6). This result indicates that although temperature is a significant controlling factor, it cannot fully explain the variability in pCO2 within the Canada Basin. In 2012, there was also a positive correlation relationship between lnpCO2 and SST for surface water with an equation of lnpCO2 = 0.0702x+5.8696 (R2 = 0.26, not shown in the figure), but this relationship alone cannot fully explain variation in pCO2.
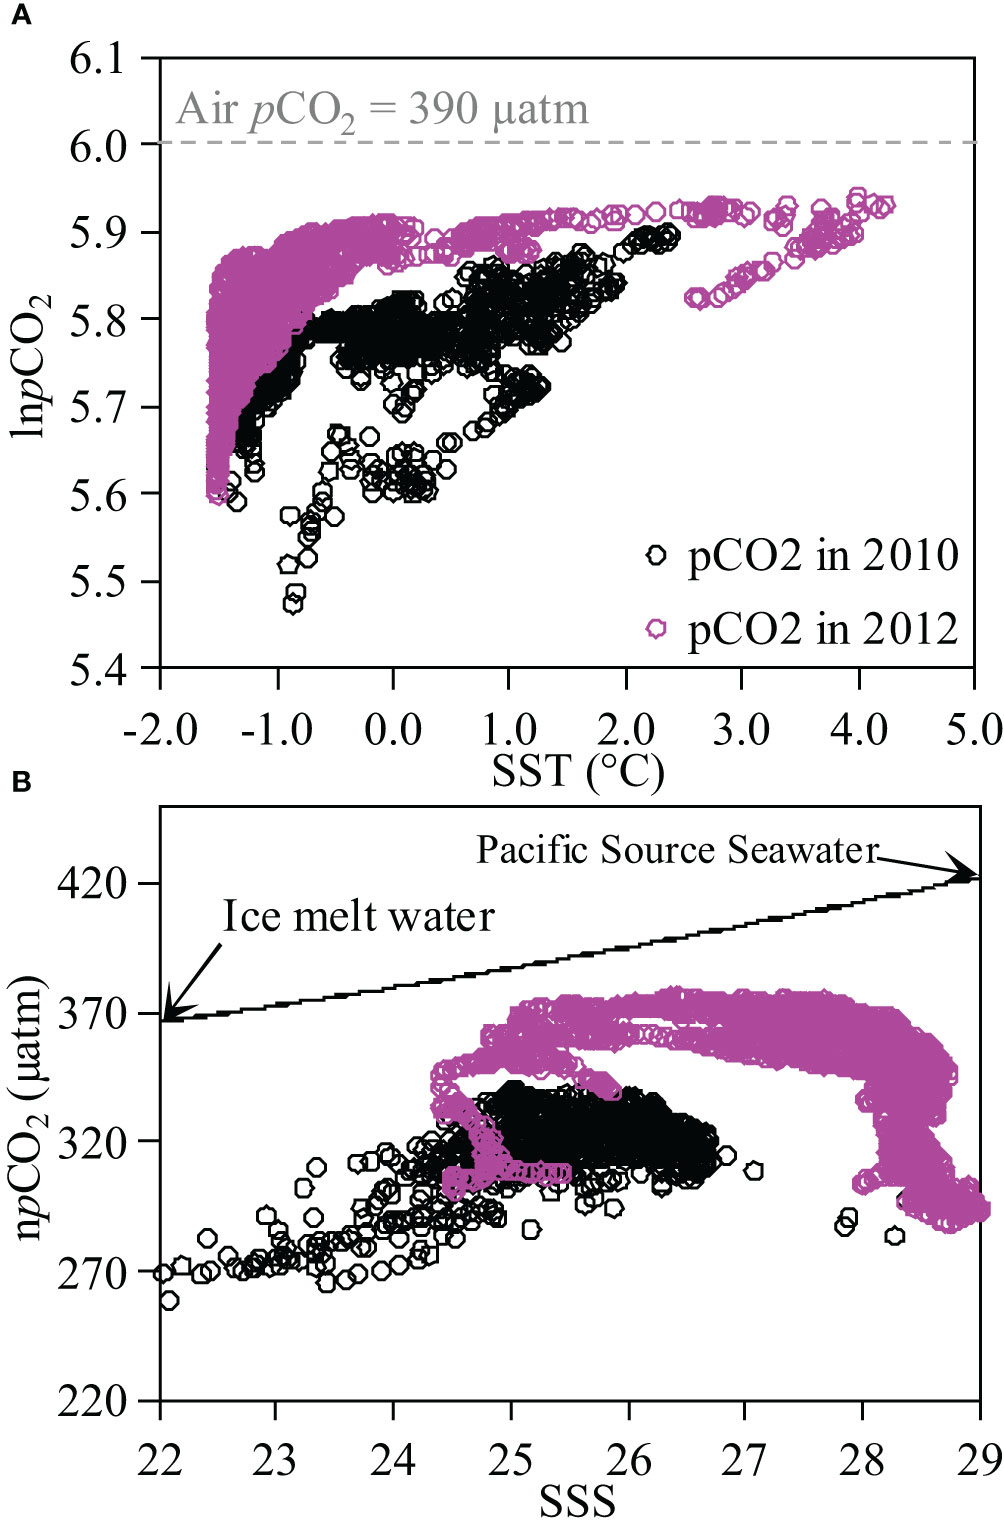
Figure 3 Relationships of lnpCO2 vs. sea surface temperature, SST (lnpCO2-SST, (A) and npCO2 vs. sea surface salinity, SSS (npCO2-SSS, panel b) for surface water in Canada Basin in 2010 and 2012. In panel a, dashed line indicate the logarithm of air pCO2. In (B), black arrows represent the end-members of ice melt water and Pacific Source Seawater with end-member values sourced from Qi et al. (2020) and Yang et al. (2023); solid line represent the hypothetical conservative mixing line between these two end-members.
4.1.2 Dilution of ice melt water
In Canada Basin, it has been suggested that the offshore surface water is influenced by the dilution of ice melt water and Pacific Source Seawater (Qi et al., 2020). Using end-member values of S=33.215 ± 0.012, TA=2242.2 ± 6.9 μmol kg-1, DIC=2159.1 ± 0.3 μmol kg-1 for Pacific Source Seawater and S=0, TA=400 μmol kg-1, DIC=450 μmol kg-1 for ice melt water (Yang et al., 2023), we calculated the proportions of ice melt water at different salinities. During both cruises, the fractions of ice melt water ranged from 12.7% to 27.7%. We further calculated the conservative pCO2 values at different salinities, and the result suggested a pCO2 value of 368 μatm at salinity of 22, and a pCO2 value of 411 μatm at salinity of 29. The observed difference in pCO2 (43 μatm) can be attributed to the dilution effect. We also examined the relationship between npCO2 and SSS to investigate the influence of water mass mixing on the variability of sea surface pCO2 in Canada Basin (Figure 3B). In this study, npCO2 was normalized to 0 °C following the method of Wanninkhof et al. (2022). Consequently, no significant correlation was observed between npCO2 and SSS, indicating that other processes may exert a stronger impact on the spatial variability of sea surface pCO2 than mixing during both cruises.
4.1.3 Air-sea CO2 flux
In Canada Basin, there was an average difference of -25 to -80 µatm between pCO2 values in surface water and the overlying atmosphere (Table 2), indicating a net uptake of CO2 during both cruises. Using average SIC values and wind speeds summarized in Table 1, we estimated the air-sea CO2 flux during the sampling period, and the results are summarized in Table 2. Consequently, the instantaneous air-sea CO2 fluxes varied from -1.6 to -4.3 mmol C m-2 d-1 (Table 2; negative values indicate a CO2 sink). Our estimated CO2 flux was almost consistent with Yasunaka et al. (2016) of -4 ± 4 mmol C m-2 d-1, Manizza et al. (2019) of -2.5 ± 0.2 mmol C m-2 d-1, Bates and Mathis (2009) of -1.7~-4.2 mmol C m-2 d-1, and Islam et al. (2017) of -2.5 ± 2.6 mmol C m-2 d-1 in Arctic Ocean, but was lower than Ouyang et al. (2022) of -5.0 mmol C m-2 d-1 in Canada Basin, Sun et al. (2017) of -8.6 ± 1.4 mmol C m-2 d-1 and Burgers et al. (2017) of -12 mmol C m-2 d-1 in Arctic Ocean.
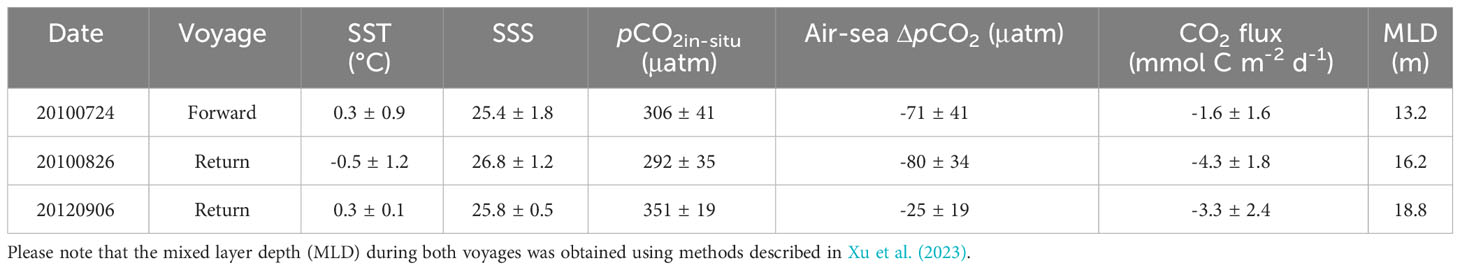
Table 2 Summary of sea surface temperature (SST), sea surface salinity (SSS), sea surface pCO2, air-sea ΔpCO2, CO2 flux, and average mixed layer depth (m) in Canada Basin.
Here we conducted a preliminary estimation of DIC and subsequently the pCO2 increase during sea ice melt. Assuming an average CO2 flux of -3.0 mmol C m-2 d-1 during these three voyages (Table 2), an ice melt period of 80 days during warm seasons (from DSR=-40 to DSR=40), and an average MLD of 16 m that obtained using methods described in Xu et al. (2023) (Table 2), it can be inferred that the air-sea CO2 exchange at the sea surface would result in a rise in seawater DIC by 15 μmol kg-1. Based on the definition of Revelle factor (RF), pCO2 variability caused by the air-sea CO2 exchange can be calculated as: RF×pCO2water×ΔDICF/DICwater (Harry et al., 1979; Egleston et al., 2010). The results suggest that, during sea ice melt, air-sea CO2 exchange at the sea surface would lead to an increase in seawater pCO2 by 40 μatm in Canada Basin.
4.1.4 Sea ice concentration
In Canada Basin, a significant negative relationship is observed between SIC and sea surface pCO2 (pCO2=-46.14×SIC+343.43, R2 = 0.47, Figure 4). The surface pCO2 tends to decrease with increasing SIC, exhibiting lower values in areas where SIC>0.5 and higher values in open water with an SIC of 0. In Arctic ecosystems, low SIC would facilitate CO2 dissolution into seawater, leading to increased seawater DIC and surface pCO2. During both cruises, the observed sea surface pCO2 was measured at 343 μatm when SIC=0, and decreased to 297 μatm when SIC=1. The calculated difference in pCO2 amounts to 46 μatm.
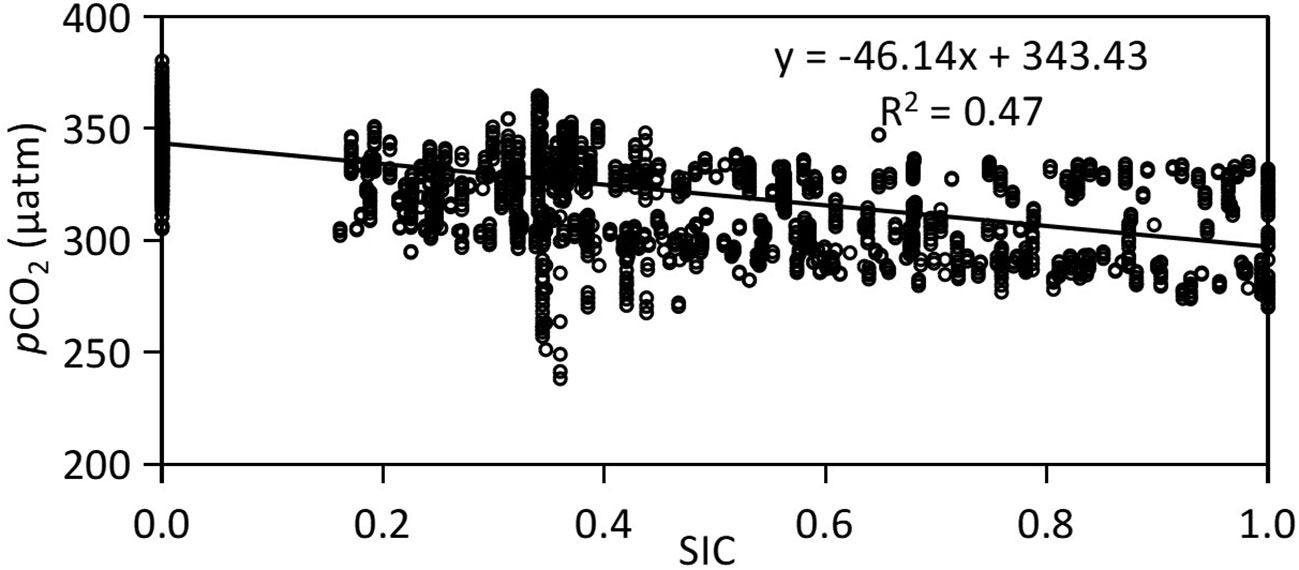
Figure 4 Linear relationship between surface pCO2 and sea ice concentration (SIC) in Canada Basin with data collected during both 2010 and 2012.
4.1.5 Biological consumption
In Arctic Ocean, the higher nutrient supply and subsequent biological consumption of DIC result in a significant net uptake of CO2. Previous studies have reported the NCP values in this region, ranging from 1.88 to 7 mmol C m-2 d-1 (Cai et al., 2010; Islam et al., 2017; DeGrandpre et al., 2019; Ouyang et al., 2022). Using an NCP value of 1.88 mmol C m-2 d-1 (Cai et al., 2010), and an ice melt period of 80 days, it can be inferred that biological consumption would lead to a decrease in seawater DIC by 9 μmol kg-1 and subsequently reduce seawater pCO2 by 24 μatm.
4.1.6 Wind speed
In the estimation of air-sea CO2 flux, higher wind speeds lead to an increased gas transfer velocity, thereby resulting in a higher CO2 flux (see Equation 2). In Arctic Ocean, the intensified CO2 sink under high wind speeds would elevate seawater DIC concentrations and subsequently increase pCO2. Here we utilized the HWF obtained from model simulations to characterize the intensity of wind speeds (for more details on the model simulation, please refer to Xu et al. (2023)), and their respective results were presented in Table 1. Consequently, HWF and wind speeds exhibited notable increases in 2012 than in 2010, which may also contribute to higher pCO2 in 2012.
4.2 Modeling the sea surface pCO2 during sea ice melt
4.2.1 Results from a 1-D dynamic model
To assess changes in sea surface pCO2 during sea ice melt, we utilized the definition of days since ice retreat (DSR) in our results description and model simulation. Firstly, the day of ice retreat (DOR) is defined as the day when SIC falls below 15%. Then, we calculate the temporal difference between DOR and the day of field observation (DOF), which represents DSR. A positive or negative DSR indicates that the corresponding DOR occurred earlier or later than DOF. The specific values of DSR and SIC during these two cruises can be found in the Supplementary Material provided by Qi et al. (2022b).
In the present study, we divided the sampling period during both cruises into three distinct stages, the pre-retreat stage (DSR<-40), an active sea ice melt stage (-40<DSR<0), and a post sea ice melt stage (DSR>0). Consequently, DSR values for pCO2 measurements in 2010 were predominantly negative (DSR<0), representing an active sea ice melt stage. Conversely, DSR values in 2012 were positive (DSR>0), representing a post sea ice melt stage. As shown in Figure 5, during the active sea ice melt stage in 2010, pCO2 measurements displayed a scattered distribution pattern; however, they demonstrated an increasing trend during the post sea ice melt stage in 2012.
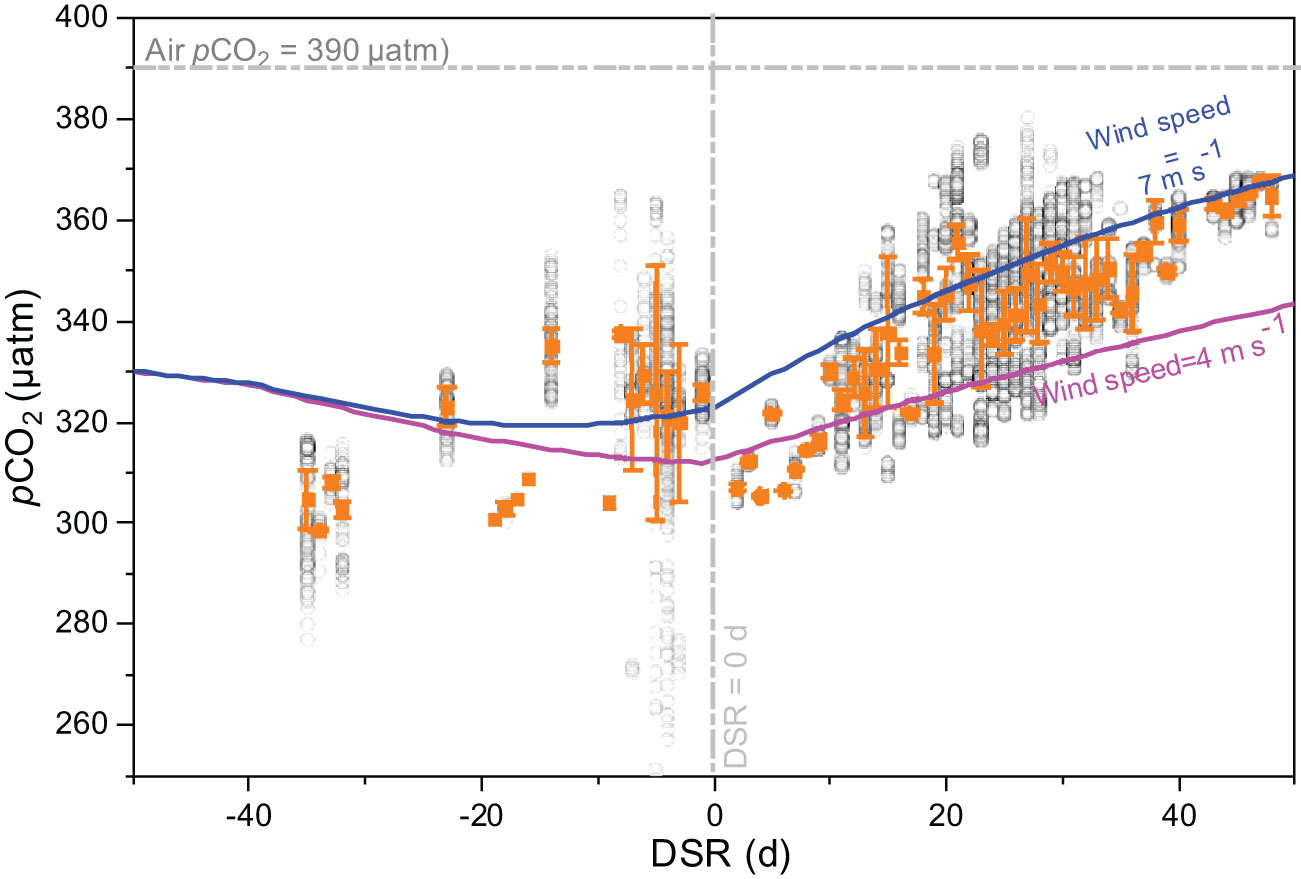
Figure 5 Relationships between pCO2 and days since ice retreat (DSR) in Canada Basin during the cruise both in 2010 and 2012 (gray circles). Orange squares and error bars indicate the average values. During both cruises, DSR values for pCO2 measurements in 2010 were predominantly negative (DSR<0), representing an active sea ice melt stage. Conversely, DSR values in 2012 were positive (DSR>0), representing a post sea ice melt stage. The horizontal dashed line is the atmospheric pCO2 of 390 μatm, and the vertical dashed line is DSR=0 d. Solid lines are the simulated seawater pCO2 using a 1-D dynamic approach at a wind speed of 4 m s-1 (pink line) and 7 m s-1 (blue line), with initial values and model settings derived from Qi et al. (2022b).
In order to gain a better understanding of variations in pCO2 during sea ice melt, we extended our simulation time to the early melt period. Consequently, our modeled results covered the DSR from -50 days to the maximum DSR recorded during these two cruises (50 days). The initial values and model settings were derived from Qi et al. (2022b). Briefly, the initial SST, SSS, pCO2, and TA were averaged from observations beneath the sea ice for the period 2011-2020 when DSR was less than -40. Their respective values were set at -1.0 °C, 27.1, 330 μatm, and 1959 μmol kg-1. During the sea ice retreat period (-50<DSR<0), we assumed that SST linearly increased from its initial value to the mean SST over -5<DSR<5. Simultaneously, ice concentration linearly decreased from 95% to 0%, while SSS and TA decreased gradually from their initial values to their respective means over -5<DSR<5. The values of SST, SSS, and TA at DSR=0 were set to -0.7 °C, 26, and 1886 μmol kg-1, respectively. During the ice free period (DSR>0), SSS and TA remained constant while allowing SST to increase up to a maximum value of 1.4 °C at DSR=60. A NCP value of 1.88 mmol C m-2 d-1 was assigned for the period between -40<DSR<50 to reflect weak primary production in the study area (Cai et al., 2010), whereas a value of 0 mmol C m-2 d-1 was used for the period between -50<DSR<-40. An averaged MLD of 16 m was consistently applied throughout the simulation (Table 2). Two average wind speeds, 4 m s-1 recorded during July and August in 2010, and 7 m s-1 observed during July, August, and September in 2012, were considered for CO2 flux estimation and model simulation.
The evolution of seawater pCO2 during sea ice melt in Canada Basin was simulated with a wind speed of 4.0 m s-1, and their result was shown in Figure 5. During the pre-retreat stage, no significant change was observed in the simulated seawater pCO2. Subsequently, a decreasing trend in pCO2 was observed during the active sea ice melt stage. Following this stage, there was a continuous increase in the simulated seawater pCO2 during the post sea ice melt stage. When using a higher wind speed of 7.0 m s-1, it was noted that pCO2 exhibited a decreasing trend when DSR<-10 but an increasing trend when DSR>-10. In comparison to the pCO2 values simulated at a wind speed of 4.0 m s-1, the modeled pCO2 with a wind speed of 7.0 m s-1 showed significantly higher values; exhibiting a difference of 11 μatm at DSR=0 and reaching up to 25 μatm at DSR=50.
4.2.2 Quantifying the controlling processes to the pCO2 dynamics during sea ice melt
Here, we quantified the controlling processes to pCO2 dynamics during sea ice melt at two stages, the active sea ice melt stage (from DSR=-40 to DSR=0) and the post sea ice melt stage (from DSR=0 to DSR=50), with modeled carbonate parameters at DSR=-40, 0, and 50. To assess the impact of temperature effects on pCO2 dynamics, we firstly calculated pCO2 values at different SSTs while keeping DIC and TA constant for each stage. The difference in pCO2 values represented changes attributed to temperature effects. For biological production and air-sea CO2 exchange, we first calculated the variability in DIC resulting from the biological consumption (referred to as ΔDICBio) and air-sea CO2 flux (referred to as ΔDICFlux) as NCP/(MLD×ρ) and FCO2/(MLD×ρ), respectively. Subsequently, these DIC consumption/addition values were subtracted/added to the observed DIC data (referred to as DICobs-Bio and DICobs-Flux), allowing us to calculate seawater pCO2 with the new DIC concentrations. The difference between these calculated and observed pCO2 values indicates changes attributed to biological production and air-sea CO2 exchange. Finally, the DIC changes resulted from the dilution of ice melt water was estimated as ΔDIC-ΔDICBio-ΔDICFlux to balance the overall DIC budget. Its impact on pCO2 variability could be determined using methods described above.
During the sea ice melt, the contributions of different processes to the dynamics of pCO2 under a wind speed of 4 m s-1 were summarized in Figures 6A. During the active sea ice melt stage, the increase in SST of 0.24 °C only resulted in a rise in pCO2 by 4 μatm. Over a time scale of 40 days, biological production and air-sea CO2 exchange led to a decrease and increase in DIC by 5 μmol kg-1 and 5 μmol kg-1, respectively, which would alter seawater pCO2 by -15 μatm and 15 μatm correspondingly. Furthermore, the dilution effect caused by ice melt water further reduced seawater pCO2 by 16 μatm. Consequently, compared to its reduction resulting from biological production and dilution effects, the contribution of air-sea CO2 exchange towards increasing pCO2 was significantly lower. The combined effects of biological production, dilution effects, and air-sea CO2 exchange have a significant impact on reducing pCO2 during this stage. During the post sea ice melt stage, there was an observed increase in pCO2 by 45 μatm. The increase in SST by 2.1 °C would elevate pCO2 by 32 μatm, while biological production and air-sea CO2 exchange would lead to a decrease and increase respectively in seawater pCO2 by 22 μatm and 37 μatm due to variability in DIC of -7 μmol kg-1 and 11 μmol kg-1. The influence of ice melt water is negligible during the post sea ice melt stage. Consequently, the increase in pCO2 resulting from high temperatures and air-sea CO2 exchange outweighs its decrease caused by biological production. The combined effects of temperature effect, biological production, and air-sea CO2 exchange result in a prevailing increase in sea surface pCO2 during the post sea ice melt stage.
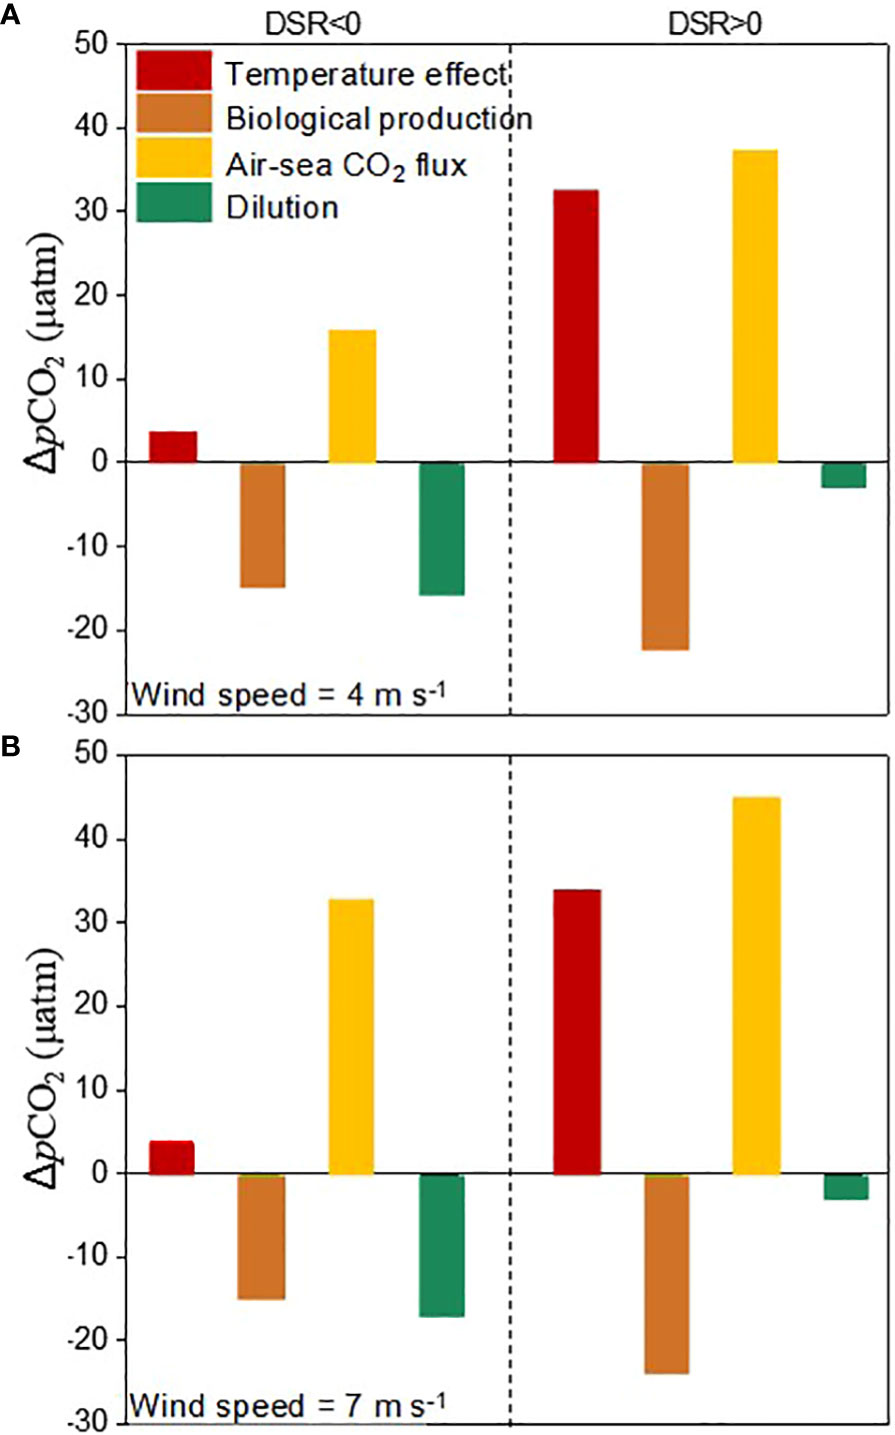
Figure 6 Contributions of temperature effect, biological production, air-sea CO2 flux and the dilution of ice melt water to the changes of sea surface pCO2 during sea ice melt at a wind speed of 4 m s-1 (A) and 7 m s-1 (B). During the data processing, the modeled carbonate parameters at DSR=-40, 0, and 50 were selected for quantification.
Compared to the average low wind speed of 4.0 m s-1 recorded during July and August in 2010, the enhanced CO2 uptake at a high average wind speed of 7.0 m s-1 observed during July, August, and September in 2012 would further increase seawater pCO2 by 17 μatm during the active sea ice melt stage and by 8 μatm during the post sea ice melt stage, while the contributions of temperature, biological production, and dilution from ice melt water remain constant (Figure 6B). During the active sea ice melt stage, although the presence of sea ice cover hinders air-sea CO2 exchange at the sea surface, the increased wind speed from 4.0 m s-1 to 7.0 m s-1 and extremely low pCO2 values (ranging from 320-330 μatm) tend to facilitate CO2 dissolution into seawater and subsequently elevate the pCO2 by 17 μatm. However, this wind-driven enhancement in CO2 sinking is significantly attenuated with a pCO2 increase of 8 μatm during the post sea ice melt stage when pCO2 values are considerably higher (ranging from 330-370 μatm).
4.2.3 Uncertainty analysis
In this study, the initial values utilized in model simulations were derived from a long-time field observation, which may differ from the observed values in a specific year. As previously discussed, we quantified the impact of varying wind speeds on pCO2 dynamics, ranging from 53 to 77 μatm. Regarding the dilution effect, the mixing of ice melt water contributed to a pCO2 variability of 18-43 μatm. For biological production, a low NCP of 1.88 mmol C m-2 d-1 and a high NCP of 7 mmol C m-2 d-1 was used in our pCO2 simulation, indicating that biological processes could contribute to a pCO2 variability of 37-137 μatm. Additionally, temperature effects were found to contribute significantly to a pCO2 variability of 36-350 μatm. Therefore, careful selection of wind speeds, NCP values and the temperature range is crucial for achieving accurate model simulations.
5 Conclusion
This study presents the dynamics of sea surface pCO2 during sea ice melt based on field measurements in the western Arctic Ocean. Compared to the pCO2 reduction resulting from biological production and dilution effects, the contribution of air-sea CO2 exchange is significantly lower. The combined effects of these factors have a significant impact on reducing pCO2 during the active sea ice melt stage. In contrast, during the post sea ice melt stage, the increase in pCO2 resulting from high temperatures and air-sea CO2 exchange outweighs its decrease caused by biological production, dominating the prevailing increase in sea surface pCO2. Compared to normal situations with a wind speed of 4.0 m s-1, enhanced CO2 uptake at a high wind speed of 7.0 m s-1 would further elevate seawater pCO2 during both active and post sea ice melt stages. The increase in pCO2 with high wind speed was more pronounced during active sea ice melt stage when seawater pCO2 values were significantly lower. The present study reports, for the first time, the carbonate dynamics and controlling processes that govern pCO2 dynamics during the active sea ice melt stage. It highlights the crucial role of wind speed in regulating the evolution of surface pCO2 during sea ice melt.
In the Arctic Ocean, Manizza et al. (2019) also observed an exceptionally low SIC and relatively high levels of pCO2 in the East Siberian Sea during 2012. Their findings indicated that the melt of sea ice under elevated seawater temperatures resulted in a substantial accumulation of freshwater on the sea surface. The presence of this low-density freshwater led to stratification within the water column, which hindered primary productivity of surface phytoplankton and impeded further reduction of pCO2 through biotic processes, consequently leading to increased values of sea surface pCO2. Our study argues that enhanced air-sea CO2 uptake during periods characterized by high wind speeds also contributed to the elevated levels of sea surface pCO2 observed in 2012.
Data availability statement
The original contributions presented in the study are included in the article/Supplementary Material. Further inquiries can be directed to the corresponding author.
Author contributions
WY: Conceptualization, Methodology, Validation, Writing – original draft, Writing – review & editing. YZ: Conceptualization, Data curation, Methodology, Software, Validation, Writing – original draft, Writing – review & editing. YW: Conceptualization, Data curation, Methodology, Software, Supervision, Validation, Writing – original draft, Writing – review & editing. ZC: Data curation, Methodology, Software, Validation, Writing – original draft, Writing – review & editing. XG: Data curation, Software, Validation, Writing – original draft, Writing – review & editing. HL: Validation, Writing – original draft, Writing – review & editing. ZO: Conceptualization, Data curation, Methodology, Validation, Writing – original draft, Writing – review & editing. WC: Conceptualization, Methodology, Supervision, Validation, Writing – original draft, Writing – review & editing. LC: Conceptualization, Methodology, Writing – original draft, Writing – review & editing. DQ: Conceptualization, Formal analysis, Funding acquisition, Methodology, Project administration, Supervision, Validation, Writing – original draft, Writing – review & editing.
Funding
The author(s) declare financial support was received for the research, authorship, and/or publication of this article. This work was supported by the National Key Research and Development Program of China (2019YFE0114800), National Natural Science Foundation of China (42176230, 41941013), Fujian Provincial Science and Technology Plan (2022J06026), and and Independent Research Projects of the Southern Marine Science and Engineering Guangdong Laboratory (Zhuhai) (SML2021SP306).
Acknowledgments
We thank the many contributors to the CHINARE dataset as well as the many research vessels and crews that contributed to the collection of data used in this study. We thank the Polar Research Institute of China and the Chinese National Arctic and Antarctic Data Center.
Conflict of interest
The authors declare that the research was conducted in the absence of any commercial or financial relationships that could be construed as a potential conflict of interest.
The handling editor, JC declared a past collaboration with the authors, DQ, YW, WC.
Publisher’s note
All claims expressed in this article are solely those of the authors and do not necessarily represent those of their affiliated organizations, or those of the publisher, the editors and the reviewers. Any product that may be evaluated in this article, or claim that may be made by its manufacturer, is not guaranteed or endorsed by the publisher.
References
Anderson L., Kaltin S. (2016). Carbon fluxes in the Arctic Ocean-potential impact by climate change. Polar Res. 20 (2), 225–232. doi: 10.3402/Q26polar.v20i2.6521
Bates N., Cai J., Mathis J. (2011). The ocean carbon cycle in the Western Arctic Ocean: distributions and air-sea fluxes of carbon dioxide. Oceanography 24 (3), 186–201. doi: 10.5670/oceanog.2011.71
Bates N., Mathis J. (2009). The Arctic Ocean marine carbon cycle: evaluation of air-sea CO2 exchanges, ocean acidification impacts and potential feedbacks. Biogeosciences 6 (11), 2433–2459. doi: 10.5194/bg-6-2433-2009
Burgers T., Miller L., Thomas H., Else B., Gosselin M., Papakyriakou T. (2017). Surface water pCO2 variations and sea-air CO2 fluxes during summer in the Eastern Canadian Arctic. J. Geophys. Res. 122, 9663–9678. doi: 10.1002/2017JC013250
Cai W., Chen L., Chen B., Gao Z., Lee S., Chen J., et al. (2010). Decrease in the CO2 uptake capacity in an ice-free Arctic Ocean Basin. Science 329, 556–559. doi: 10.1126/science.1189338
Cross J. N., Mathis J. T., Frey K. E., Cosca C. E., Danielson S. L., Bates N. R. (2014). Annual sea-air CO2 fluxes in the Bering Sea: insights from new autumn and winter observations of a seasonally ice-covered continental shelf. J. Geophys. Res. Oceans. 119, 6693–6708. doi: 10.1002/2013JC009579
DeGrandpre M., Evans W., Timmermans M., Krishfield R., Williams B., Steele M. (2020). Changes in the Arctic Ocean carbon cycle with diminishing ice cover. Geophys. Res. Lett. 47 (12), e2020GL088051. doi: 10.1029/2020GL088051
DeGrandpre M., Lai C., Timmermans M., Krishfield R., Proshutinsky A., Torres D. (2019). Inorganic Carbon and pCO2 Variability during ice formation in the Beaufort Gyre of the Canada Basin. J. Geophys. Res. Oceans 124 (6), 4017–4028. doi: 10.1029/2019JC015109
Dickson A. (1990). Standard potential of the reaction: AgCl(s)+12H2(g) =Ag(s)+HCl(aq), and and the standard acidity constant of the ion HSO4- in synthetic sea water from 273.15 to 318.15 K. J. Chem. Thermodyn 22, 113–127. doi: 10.1016/0021-9614(90)90074-Z
Dickson A., Millero F. (1987). A comparison of the equilibrium constantsfor the dissociation of carbonic acid in seawater media. Deep Sea Res. Part A Oceanographic Res. Papers 34, 1733–1743. doi: 10.1016/0198-0149(87)90021-5
Egleston E. S., Sabine C. L., Morel F. M. M. (2010). Revelle revisited: Buffer factors that quantify the response of ocean chemistry to changes in DIC and alkalinity. Glob. Biogeochem. Cycles. 24, GB1002. doi: 10.1029/2008GB003407
Fransson A., Chierici M., Nojiri Y. (2009). New insights into the spatial variability of the surface water carbon dioxide in varying sea ice conditions in the Arctic Ocean. Cont Shelf Res. 29, 1317–1328. doi: 10.1016/j.csr.2009.03.008
Fransson A., Chierici M., Skjelvan A., Olsen P., Assmy A., Peterson G., et al. (2017). Effects of sea-ice and biogeochemical processes and storms on under-ice water fCO2 during the winter-spring transition in the high Arctic Ocean: implications for sea-air CO2 fluxes. J. Geophys. Res. Oceans 122, 5566–5587. doi: 10.1002/2016JC012478
Friedlingstein P., Jones M., O’ Sullivan M., Andrew R., Bakke D., Hauck J. (2022). Global carbon budget 2021. Earth Syst. Sci. Data. 14, 1917–2005. doi: 10.5194/essd-14-1917-2022
Garcia-Soto C., Cheng L., Caesar L., Schmidtko S., Jewett E., Cheripka A., et al. (2021). An overview of ocean climate change indicators: sea surface temperature, ocean heat content, ocean pH, dissolved oxygen concentration, arctic sea ice extent, thickness and volume, sea level and strength of the AMOC (Atlantic meridional overturning circulation). Front. Mar. Sci. 21, 8–2021. doi: 10.3389/fmars.2021.642372
Geilfus N., Carnat G., Papakyriakou T., Tison J., Else B., Thomas H., et al. (2012). Dynamics of pCO2 and related air-ice CO2 fluxes in the Arctic coastal zone (Amundsen Gulf, Beaufort Sea). J. Geophys. Res. 117, 1–15. doi: 10.1029/2011JC007118
Harry Y., Mcsween J. R., Taylor L. A., Stolper E. M. (1979). Carbon dioxide in the ocean surface: the homogeneous buffer factor. Science. 204, 1203–1205. doi: 10.1126/science.204.4398.1203
Islam F., DeGrandpre M., Beatty C., Timmermans M., Krishfield R., Toole J., et al. (2017). Sea surface pCO2 and O2 dynamics in the partially ice-covered Arctic Ocean. J. Geophys. Res. 122, 1425–1438. doi: 10.1002/2016JC012162
Japan Meteorological Agency/Japan. (2013). JRA-55: Japanese 55-year reanalysis, daily 3-hourly and 6-hourly data (Boulder, CO: Research Data Archive, National Center for Atmospheric Research, Computational and Information Systems Laboratory).
Jeong S., Bloom A., Schimel D., Sweeney C., Parazoo N., Medvigy D., et al. (2018). Accelerating rates of Arctic carbon cycling revealed by long-term atmospheric CO2 measurements. Sci. Adv. 4 (7), eaao1167. doi: 10.1126/sciadv.aao1167
Lindsay R., Schweiger A. (2015). Arctic sea ice thickness loss determined using subsurface, aircraft, and satellite observations. Cryosphere 9 (1), 269–283. doi: 10.5194/tc-9-269-2015
Manizza M., Follows M., Dutkiewicz S., Menemenlis D., Hill C., Key R. (2013). Changes in the arctic ocean CO2 sink, (1996-2007): a regional model analysis. Global Biogeochem. Cycles 27, 1108–1118. doi: 10.1002/2012GB004491
Manizza M., Menemenlis D., Zhang H., Miller C. (2019). Modeling the recent changes in the Arctic Ocean CO2 sink, (2006-2013). Global Biogeochem Cycles 33 (3), 420–438. doi: 10.1029/2018GB006070
Mehrbach C., Culberson C., Hawley J., Pytkowicx R. (1973). Measurement of the apparent dissociation constants of carbonic acid in seawater at atmospheric pressure. Limnol. Oceanogr. 18, 897–907. doi: 10.4319/lo.1973.18.6.0897
Mortenson E., Steiner N., Monahan A., Hayashida H., Sou T., Shao A. (2020). Modeled impacts of sea ice exchange processes on Arctic Ocean carbon uptake and acidification, (1980-2015). J. Geophys. Res. Oceans 125, e2019JC015782. doi: 10.1029/2019JC015782
Nomura D., Eicken H., Gradinger R., Shirasawa K. (2010). Rapid physically driven inversion of the air-sea ice CO2 flux in the seasonal landfast ice off Barrow, Alaska after onset of surface melt. Cont Shelf Res. 30, 1998–2004. doi: 10.1016/j.csr.2010.09.014
Ouyang Z., Li Y., Qi D., Zhong W., Murata A., Nishino S., et al. (2022). The changing CO2 sink in the Western Arctic Ocean from 1994 to 2019. Global Biogeochem Cycles 36 (1), e2021GB007032. doi: 10.1029/2021GB007032
Ouyang Z., Qi D., Chen L., Takahashi T., Zhong W., DeGrandpre M., et al. (2020). Sea-ice loss amplifies summertime decadal CO2 increase in the western Arctic Ocean. Nat. Clim Chang 10, 678–684. doi: 10.1038/s41558-020-0784-2
Pierrot D., Lewis E., Wallace D. (2006). MS Excel program developed for CO2 system calculations. Carbon Dioxide Information Analysis Center, Oak Ridge National Laboratory (Oak Ridge: U.S. Department of Energy). doi: 10.3334/cdiac/otg.co2sys_xls_cdiac105a
Pipko I., Pugach S., Semiletov I., Anderson L., Shakhova N., Gustafsson Ö., et al. (2017). The spatial and inter-annual dynamics of the surface water carbonate system and air-sea CO2 fluxes in the outer shelf and slope of the Eurasian Arctic Ocean. Ocean Sci. 13, 997–1016. doi: 10.5194/os-13-997-2017
Polyakov I., Rippeth T., Fer I., Alkire M., Baumann T., Carmack E., et al. (2020). Weakening of cold halocline layer exposes sea ice to oceanic heat in the Eastern Arctic Ocean. J. Clim. 33 (18), 8107–8123. doi: 10.1175/JCLI-D-19-0976.1
Qi D., Chen B., Chen L., Lin H., Gao Z., Sun H., et al. (2020). Coastal acidification induced by biogeochemical processes driven by sea-ice melt in the western Arctic ocean. Polar Sci. 23, 100504. doi: 10.1016/j.polar.2020.100504
Qi D., Ouyang Z., Chen L., Wu Y., Lei R., Chen B., et al. (2022b). Climate change drives rapid decadal acidification in the Arctic Ocean from 1994 to 2020. Science 377 (6614), 1544–1550. doi: 10.1126/science.abo0383
Qi D., Wu Y., Chen L., Cai W., Ouyang Z., Zhang Y., et al. (2022a). Rapid acidification of the arctic Chukchi Sea waters driven by anthropogenic forcing and biological carbon recycling. Geophys. Res. Lett. 49, e2021GL097246. doi: 10.1029/2021GL097246
Riedel A., Michel C., Gosselin M., Leblanc B. (2008). Winter-spring dynamics in sea-ice carbon cycling in the coastal Arctic Ocean. J. Mar. Syst. 74, 918–932. doi: 10.1016/j.jmarsys.2008.01.003
Schuster U., McKinley G., Bates N., Chevallier F., Doney S., Fay A., et al. (2013). An assessment of the Atlantic and Arctic sea-air CO2 fluxes 1990-2009. Biogeosciences 10, 607–627. doi: 10.5194/bg-10-607-2013
Screen J., Simmonds I. (2010). The central role of diminishing sea ice in recent Arctic temperature amplification. Nature 464 (7293), 1334–1337. doi: 10.1038/nature09051
Semiletov I., Makshtas A., Akasofu S. (2004). Atmospheric CO2 balance: The role of Arctic sea ice. Geophys. Res. Lett. 31, L05121. doi: 10.1029/2003GL017996
Shepherd A., Ivins E., Barletta V., Bentley M., Bettadpur S., Briggs K., et al. (2012). A reconciled estimate of ice-sheet mass balance. Science 338 (6111), 1183–1189. doi: 10.1126/science.1228102
Sun H., Gao Z., Peng L., Xiu P., Chen L. (2017). Evaluation of the net CO2 uptake in the Canada Basin in the summer of 2008. Hai Yang Xue Bao. 36, 1–7. doi: 10.1007/s13131-017-1028-9
Tu Z., Le C., Bai Y., Jiang Z., Wu Y., Ouyang Z., et al. (2021). Increase in CO2 uptake capacity in the Arctic Chukchi Sea during summer revealed by satellite-based estimation. Geophys. Res. Lett. 48, e2021GL093844. doi: 10.1029/2021GL093844
Uppstrom L. (1967). “Analysis of boron in seawater by a modified curcumin method,” in Marine chemistry, vol. 1 (Analytical methods), 2nd ed, vol. 1972 . Ed. Martin D. F. (New York: Marcei. Dekker. Inc), 389.
Wanninkhof R. (2014). Relationship between wind speed and gas exchange over the ocean revisited. Limnol Oceanogr. Methods 12, 351–362. doi: 10.4319/lom.2014.12.351
Wanninkhof R., Pierrot D., Sullivan K., Mears P., Barbero L. (2022). Comparison of discrete and underway CO2 measurements: inferences on the temperature dependence of the fugacity of CO2 in seawater. Mari Chem. 247, 104178. doi: 10.1016/j.marchem.2022.104178
Weiss R. (1974). Carbon dioxide in water and seawater: the solubility of a nonideal gas. Mar. Chem. 2, 203–215. doi: 10.1016/0304-4203(74)90015-2
Xu A., Jin M., Wu Y., Qi D. (2023). Response of nutrients and primary production to high wind and upwelling favorable wind in the Arctic Ocean: A modeling perspective. Front. Mar. Sci. 10, 1065006. doi: 10.3389/fmars.2023.1065006
Yang W., Wu Y., Cai. W., Ouyang Z., Zhuang Y., Chen L., et al. (2023). Rapid changes in the surface carbonate system under complex mixing schemes across the Bering Sea: a comparative study of a forward voyage in July and a return voyage in September 2018. Front. Mar. Sci. 10, 1107646. doi: 10.3389/fmars.2023.1107646
Yasunaka S., Murata A., Watanabe E., Chierici M., Fransson A., Heuven S., et al. (2016). Mapping of the air-sea CO2 flux in the Arctic Ocean and its adjacent seas: Basin-wide distribution and seasonal to interannual variability. Polar Res. 10, 323–334. doi: 10.1016/j.polar.2016.03.006
Yasunaka S., Siswanto E., Olsen A., Hoppema M., Watanabe E., Fransson A., et al. (2018). Arctic Ocean CO2 uptake: an improved multiyear estimate of the air-sea CO2 flux incorporating chlorophyll a concentrations. Biogeosciences 15, 1643–1661. doi: 10.5194/bg-15-1643-2018
Keywords: Western Arctic Ocean, pCO2 dynamics, sea ice melt, sea ice concentration, wind speed
Citation: Yang W, Zhao Y, Wu Y, Chen Z, Gao X, Lin H, Ouyang Z, Cai W, Chen L and Qi D (2024) The impact of sea ice melt on the evolution of surface pCO2 in a polar ocean basin. Front. Mar. Sci. 11:1307295. doi: 10.3389/fmars.2024.1307295
Received: 04 October 2023; Accepted: 09 January 2024;
Published: 07 February 2024.
Edited by:
Jianfang Chen, Ministry of Natural Resources, ChinaReviewed by:
Wei-Jen Huang, National Sun Yat-sen University, TaiwanHui Gao, Guangdong Ocean University, China
Copyright © 2024 Yang, Zhao, Wu, Chen, Gao, Lin, Ouyang, Cai, Chen and Qi. This is an open-access article distributed under the terms of the Creative Commons Attribution License (CC BY). The use, distribution or reproduction in other forums is permitted, provided the original author(s) and the copyright owner(s) are credited and that the original publication in this journal is cited, in accordance with accepted academic practice. No use, distribution or reproduction is permitted which does not comply with these terms.
*Correspondence: Yingxu Wu, eWluZ3h1Lnd1QGptdS5lZHUuY24=; Di Qi, cWlkaUBqbXUuZWR1LmNu