 Constanza Ricaurte-Villota
 Magnolia Murcia-Riaño
 José Martín Hernádez-Ayón
94% of researchers rate our articles as excellent or good
Learn more about the work of our research integrity team to safeguard the quality of each article we publish.
Find out more
ORIGINAL RESEARCH article
Front. Mar. Sci., 30 January 2025
Sec. Ocean Observation
Volume 11 - 2024 | https://doi.org/10.3389/fmars.2024.1305542
This article is part of the Research TopicTime-Series Observations of Ocean Acidification: a Key Tool for Documenting Impacts on a Changing PlanetView all 18 articles
Introduction: This study investigated the variability and main drivers of the carbonate system in Gayraca Bay and Chengue Bay, located on the northeastern Caribbean coast of Colombia, through monthly measurements of partial pressure of CO2 (pCO2), pH, total alkalinity (TA), and dissolved inorganic carbon (DIC) from 2017 to 2022. Statistical analyses and Taylor series decomposition were employed to determine the seasonal and interannual contributions of sea surface temperature, salinity, TA, and DIC to changes in pCO2, pH, and calcium carbonate saturation state (Ω).
Results: The results showed significant seasonal variability influenced by annual changes in coastal upwelling, rainfall, and river runoff. Low/high pH and Ω values were associated with high/low DIC and TA values during the dry and wet seasons, respectively, while pCO2 exhibited an opposite pattern. During El Niño, negative anomalies in coastal upwelling produced negative anomalies in pCO2 and positive anomalies in Ω, DIC, and TA. Conversely, during La Niña, alternating periods of positive rainfall and upwelling anomalies were observed. Higher rainfall corresponded to negative anomalies in pCO2, DIC, and TA and positive anomalies in Ω, whereas stronger upwelling led to opposite trends. In early 2022, undersaturated levels of Ωcalc and Ωarag (<1) were observed, which could affect coral calcification and pose risks in future climate change scenarios. Taylor series decomposition analysis identified TA and DIC as primary drivers of carbonate system variability, modulated by seasonal and interannual changes in rainfall and river runoff, which are influenced by ENSO events. The observed trends in pH and pCO2 were driven by a decrease in DIC and TA, attributed to increased river runoff, contrasting with typical ocean acidification trends driven by rising atmospheric CO2 levels.
Discussion: This highlights the region's unique dynamics and underscores the importance of local studies. This study provides a novel 6-year time-series dataset for the carbonate system in the Colombian Caribbean, offering a valuable baseline for assessing the impacts of global warming and ocean acidification in the region.
Ocean acidification (OA), a reduction in pH caused by the absorption of atmospheric CO2, alters the carbonate balance (Feely et al., 2004; Orr et al., 2005; Fabry et al., 2008; Doney et al., 2009a). Rising water temperatures and OA threaten the long-term health of calcifying organisms and the persistence of coral reef ecosystems (Silverman et al., 2009). In coastal zones and shallow environments, OA is exacerbated by highly variable coastal processes influenced by multiple factors, including freshwater and nutrient inputs, biological processes, and upwelling (Doney et al., 2009a; Rheuban et al., 2019; Cai et al., 2021; Wright‐Fairbanks and Saba, 2022). Despite their importance, the impacts of these factors have been poorly studied in tropical areas, especially in Latin America. Furthermore, the magnitude of the sinks and the degree of acidification in marine shelf areas are not accurately known, mainly due to limited time series and higher natural spatiotemporal variability compared to that of open ocean systems (Omar et al., 2019).
Carbonate chemistry variability in tropical areas caused by seasonal upwelling has been observed in the Gulf of Papagayo (Sánchez-Noguera et al., 2018), Gulf of Tehuantepec (Chapa-Balcorta et al., 2015), and Galapagos Islands (Manzello et al., 2014). However, little is known regarding how regional upwelling affects the variability of the carbonate system in these important regions or the Caribbean. Indeed, few Latin American countries with tropical coastal zones have produced robust time series with high-quality data on carbonate system variables, although Mexico (Hernández-Ayón et al., 2003, 2013; Norzagaray-López et al., 2013, 2015, 2017; Chapa-Balcorta et al., 2015), Costa Rica ( (Sánchez-Noguera et al., 2018), and Brazil (Parard et al., 2010; Valerio et al., 2021) are notable exceptions, and modeling information is available for the region (Takahashi et al., 2002; Doney et al., 2009b; Gallego et al., 2018; Gregor and Gruber, 2021).
In the northern Caribbean, a 17-year dataset was generated with ships of opportunity, which has been used to evaluate decadal trends and patterns of the inorganic carbon cycle and OA (Wanninkhof et al., 2020). Gledhill et al. (2008) compiled satellite data, modeling results, and measurements from ships of opportunity and geochemical prospecting efforts in the Greater Caribbean region, such as those conducted within the World Ocean Circulation Experiment program (WOCE 22 and AR01) and Eastern Boundary Current cruise (ABACO). Woosley et al. (2016) evaluated a transect in the western Atlantic (centered at 66° W, between 11° and 40° N) to analyze anthropogenic carbon capture and storage. Astor et al., 2005, 2013) examined the variability of DIC and CO2 fugacity (fCO2) in the Cariaco Basin, off Venezuela. Tigreros (2013) studied the north-central Colombian Caribbean Sea, reporting that the average partial pressure of CO2 (pCO2-sea) was greater than the atmospheric partial pressure of CO2 (pCO2-atm). Given this difference, the system attains equilibrium by releasing CO2 into the atmosphere. Despite these advances, uncertainty still surrounds the carbonate system in the Caribbean region.
The Tayrona National Natural Park (TNNP) is located within the Southern Caribbean Upwelling System (Correa-Ramirez et al., 2020), which covers the northern part of Colombia and Venezuela. Upwelling and terrestrial runoff converge in the TNNP, resulting in seasonal and interannual variability (Bayraktarov et al., 2014). During the upwelling season, the region acts as a source of CO2 to the atmosphere (Astor et al., 2005). Interannual variability in pCO2 is positively related to sea surface temperature (SST), and low but significant correlations between SST and the Atlantic Multi-decadal Oscillation (AMO) and El Niño Southern Oscillation (ENSO) have also been identified (Astor et al., 2013). The TNNP is representative of the biodiversity of the coral formations in Colombia and provides habitats for many fish species and benthic organisms.
Carbonate system drivers have been investigated worldwide (Lovenduski et al., 2007; Doney et al., 2009b; Gallego et al., 2018; Gregor and Gruber, 2021). Although multiple studies have investigated these drivers in temperate regions (Rheuban et al., 2019; Da et al., 2021; Wright‐Fairbanks and Saba, 2022), the drivers behind the seasonal cycle and interannual variability have not been documented in tropical zones, such as the Caribbean, where the sea theoretically behaves as a CO2 source (Takahashi et al., 2002). Thus, this study aimed to understand the spatiotemporal variation of the carbonate system in the TNNP, including the effects of local (river runoff and seasonal upwelling) and regional (ENSO) drivers. This survey provides a novel dataset (2017–2022) composed of monthly data on the carbonate system and meteorological, hydrological, and oceanographic variables for the northeastern Colombian Caribbean, thus establishing a baseline to study the effects of global warming in the region.
This study was conducted in the Gayraca and Chengue Bays of the TNNP (Figure 1), located within a coastal complex formed by the entrance of the sea in the northwestern Sierra Nevada de Santa Marta (Garzón-Ferreira et al., 2004). The continental shelf of the TNNP is narrow, with depths of 200 m within 2 km from the coast. The TNNP is a biodiversity hotspot in the Caribbean, hosting 500–1000 benthic species, including mollusks, echinoderms, corals, and sponges (Miloslavich et al., 2010), as well as coral communities, seagrass meadows, and mangrove ecosystems in its capes, inlets, and bays (Bayraktarov and Wild, 2014). The western sides of the bays are more exposed to wave action, with the more protected eastern areas hosting complex and species-rich coral formations dominated by massive colonies (Díaz et al., 2000). Coral and crustose coralline algae coverage is higher in the exposed areas of the bays than in the protected areas (Eidens et al., 2014).

Figure 1. Map with bathymetric contours of the Gayraca and Chengue Bays in the Tayrona National Natural Park (TNNP). Triangles represent exposed areas, while circles indicate sheltered areas (A). Climatological average of the sea surface temperature (SST, °C) for the Caribbean Sea in February (17 years, 2003–2019) (B). The black box shows the location of the study area in the continental Colombian Caribbean (northeastern Caribbean Coast of Colombia). The red box indicates the location of the TNNP (C). The temperatures of the waters influenced by the Magdalena River and the Ciénaga Grande de Santa Marta are also shown.
From December to April (boreal winter) and July to August (known as Veranillo de San Juan), periods of low precipitation and trade wind intensification occur in the TNNP (Salzwedel and Müller, 1983; Diaz-Pulido and Garzón-ferreira, 2002; Sarmiento-Devia et al., 2013; Correa-Ramirez et al., 2020). Wind intensification results in La Guajira upwelling, which forms part of the western South Caribbean Upwelling System (Figure 1B). In the southeastern Caribbean, La Guajira upwelling raises cold subsurface waters (average of 24–25.5°C; Correa-Ramirez et al., 2020) belonging to Subtropical Underwater (SUW) with distinct biogeochemistry (Cervantes-Díaz et al., 2022) from those of the surrounding Caribbean surface waters (average temperature of 26.5–28°C). A minor rainy season and weakened winds are present from May to June (Sarmiento-Devia et al., 2013). The highest precipitation due to the migration of the Intertropical Convergence Zone (ITCZ) occurs from September to November. This migration also alters wind intensity and intensifies terrestrial runoff (Bayraktarov et al., 2014).
The mouth of the Magdalena River (Bocas de Ceniza and Boca de la Ciénaga Grande de Santa Marta; Figure 1C) is located in the southwestern region of the study area. The Magdalena River extends 1613 km, and its drainage basin covers 257.438 km2. The Magdalena River flows northward through Colombia and discharges into the Caribbean Sea (annual discharge of 228 km3). According to data from the Calamar station (112 km upstream), the average annual flow rate of Magdalena River discharge is 7200 m3·s-1, with low average discharge (4068 m3·s-1) in March and high average discharge (10287 m3·s-1) in November (Restrepo and Kjerfve, 2000). ENSO affects the rainfall regime in the Colombian Andes (Poveda and Mesa, 1997), where the Magdalena River originates, and is strongly associated with the interannual variability of Magdalena River discharge. Precipitation increases when negative Oceanic Niño Index (ONI) anomalies are recorded in the Pacific Ocean (cold phase-La Niña), resulting in increased flow (Poveda and Mesa, 1996). When positive ONI anomalies are recorded (warm phase-El Niño), precipitation decreases, negatively affecting flow rates. The ENSO phenomenon explains up to 65% of the interannual variability in the flows of the main rivers in Colombia that discharge into the Caribbean Sea (Restrepo and Kjerfve, 2000; Gutiérrez and Dracup, 2001). The flow rates associated with negative ONI anomalies of the La Niña phase exceed 12000 m3·s-1, whereas the flow rates associated with the positive ONI anomalies of the El Niño phase range from 2000 to 3000 m3·s-1 (Restrepo and Kjerfve, 2000).
In addition to the Magdalena River (which enters this swampy complex through channels on the western side), the Fundación, Aracataca, and Sevilla Rivers descend from the Sierra Nevada de Santa Marta and discharge in the southern and eastern sides of the Ciénaga Grande de Santa Marta lagoon. The flow through the mouth of the Ciénaga Grande de Santa Marta, called Boca de la Barra, ranges from 200 to 700 m3·s-1 throughout the year (Ricaurte-Villota et al., 2018). The contributions of continental water and those from the Magdalena River primarily reach the study area during the intense rainy season from September to November, when the northeast trade winds weaken and the coastal counter-current strengthens (Pujos et al., 1986). Romero-Rodríguez et al. (2017) also noted these patterns in the climatology of the Magdalena River sediment plume extension in data from the MODIS sensor (555-nm band).
To assess the spatiotemporal variation of the carbonate system in the TNNP related to climatic and oceanographic forcings, measurement stations were established in the exposed and protected areas of the Gayraca and Chengue Bays (Figure 1C). Field measurements were taken monthly between March and November 2017, January and November 2018, March and December 2019, February 2020 (due to the COVID-19 pandemic), October and December 2020, March and December 2021, and January and October 2022 and complemented with satellite and ONI data.
To assess the forcings that influence the variability of the carbonate system in the study area, we analyzed monthly meteorological (wind and precipitation), hydrological (Magdalena River flow rates), and oceanographic (SST, salinity, and dissolved oxygen) data. Wind speed data from a point near the study area (11° 30´ N, 74° 15´ W), which were also used to calculate the upwelling index and monthly climatological analysis, were obtained from the fifth-generation ERA-5 reanalysis dataset (Hersbach et al., 2023) available on the Copernicus platform; these data have a spatial resolution of 0.25° x 0.25° and an hourly temporal resolution.
We calculated the upwelling index, which considers the volume of water transported per unit of time and distance along the coast, to determine the contribution of upwelled water to the study area. We followed the methodology of Bakun (1973) and calculated Ekman transport as follows (Equation 1):
where ρ is the air density (ρ = 1.2 kg·m³), f is the Coriolis parameter (f), and are the wind stress components calculated via the wind speed for each west-east () and north-south () component (Equation 2). Monthly ERA-5 wind data were used.
where ρa = 1025 kg·m³ is the water density and Cd is the drag coefficient (Cd = 1.4 x 10⁻³). Based on the results obtained for the zonal and meridional Ekman transport (Qx and Qy), the upwelling index was calculated for each month (2017–2022; Equation 3):
theta (θ) is the mean angle between the shoreline and the equator (37.82°).
The rainfall data for the study period were obtained from the Institute of Hydrology, Meteorology, and Environmental Studies (IDEAM)1 Aeropuerto Simón Bolívar station. The monthly flow rates of the Magdalena River and its monthly climatological patterns, which were used as an indicator of terrestrial runoff, were calculated from the 2007–2022 time series of the IDEAM2 Calamar station.
The annual SST cycle was derived from a 15-year time series (2007–2022) of the Global Ocean OSTIA Sea Surface Temperature and Sea Ice Analysis product (Good et al., 2020) obtained from the Copernicus Marine Service (CMEMS)2, with a spatial resolution of 1/20° (~6 km) and daily temporal resolution. The annual sea surface salinity (SSS) cycle for 2007–2022 was obtained from the Global Ocean Physics Reanalysis and Global Ocean Physics Analysis and Forecast products, also available from the Copernicus Marine Service platform. This reanalysis had a spatial resolution of 1/12° (~9 km) and daily temporal resolution.
To analyze temperature, salinity, and dissolved oxygen from 2018 onward, we used in situ measurements from a CTD system (Conductivity, Temperature, Depth) composed of a CTD SBE 19Vplus unit (Sea-Bird Scientific, Bellevue, USA) equipped with sensors for pressure (SBE-19P, initial accuracy ± 0.1% of full-scale range), temperature (SBE19plusV2, initial accuracy ± 0.005°C), conductivity (SeaCAT Profiler, initial accuracy ± 0.0005 S/m), and dissolved oxygen (SBE-43, initial accuracy ± 2% of saturation). These sensors were calibrated at SBE headquarters on multiple occasions: November 2014, July 2017, December 2018, and September 2019. The CTD data were post-processed according to standard practices using Sea-Bird Data Processing software3. From temperature and salinity data throughout the water column, we identified the water masses in the study area during different climatic seasons by plotting potential temperature against absolute salinity (Ɵ-SA diagram), following the classifications proposed by Emery and Meincke (1986); Giraldo (1994), and Hernandez-Guerra and Joyce (2000). Dissolved oxygen was used as a water mass tracer.
To evaluate interannual changes related to ENSO, we used ONI4 data from 2017 to 2022 and compared them with the deseasonalized standardized anomalies of carbonate system variables for the exposed Gayraca site. Spearman correlations (95% confidence) between the ONI and carbonate system variable anomalies were calculated using Minitab v. 21.1.0.
To study carbonate biogeochemistry, pH profiles (NBS scale) from the surface to approximately 20 m were generated from the data collected with the CTD fitted with a pH sensor (SBE-18, ± 0.1 pH stated accuracy achievable with frequent field calibrations). The on-site sensor calibration followed the no. 18-15 application note for SBE 18, using three standard pH buffer solutions (pH 4.01, 7.00, and 10.00) provided by WTW, a division of Thermo Fisher Scientific. This sensor was also calibrated at the SBE main facility in March 2017, July 2017, and December 2018. The NBS scale was utilized as the CTD, and its calibration solutions are standardized for this scale.
Water samples were collected from the surface layer at each station using 5-L Niskin bottles to measure pH, dissolved inorganic carbon (DIC), and total alkalinity (TA) in the laboratory. Each sample was transferred to a 40-ml amber borosilicate bottle with double septa and fixed with 10 µl (i.e., the minimum recommended amount) of mercury chloride (HgCl2) solution (Dickson et al., 2007). The samples were refrigerated until arriving in the laboratory, where they were preserved at 4°C for analysis. The DIC concentration was analyzed following the coulometric method described by Johnson et al. (1987) with an uncertainty of 3.0 µmol·kg-1 in the Oceanographic Research Institute (IIO-UABC). Certified reference material (CRM AG Dickson, Scripps Institution of Oceanography) was used to ensure accurate readings (≤0.15%). The reference material resulted in an average relative difference of 2.2 ± 1.1 µmol·kg-1, with a maximum of 4 µmol·kg-1 (0.2% error), compared to the certified value. Meanwhile, TA was measured using the open-cell potentiometric titration method at the Marine Environmental Quality Laboratory (LabCAM) of the Institute for Marine and Coastal Research (Bernal et al., 2021) with an uncertainty of 4.0 µmol·kg-1. The carbonate system variables measured in situ were compared with meteorological, hydrological, and oceanographic information to understand their influence on these variables. Aragonite (Ωarag) and calcite (Ωcalc) saturation levels were calculated with CO2sys v2.3.xls (Lewis and Wallace, 1998), using discrete measurements of SST, salinity, DIC, and TA (Orr et al., 2018). Additionally, the Millero constants were applied because they are suitable for the NBS scale and coastal estuarine environments (Millero, 2010), which are characterized by notable variations in salinity driven by freshwater runoff.
The pCO2 data were measured in situ using a Pro-Oceanus CO₂-Pro probe (Bridgewater, Canada) at the surface and bottom in the exposed and protected areas of each bay and compared with those calculated by the couple DIC-TA using CO2sys_v2.3.xls (Lewis and Wallace, 1998). This dataset initially showed similar values; however, by the end of the record (2022), the measured values diverged from the calculated values in both magnitude and trend. As a result, the calculated values were chosen for analysis. These discrepancies may have been caused by sensor drift or calibration errors over time. Additionally, factors, such as debris o water pollution, could have impacted the in situ pCO₂ measurements. The wind speed in each area was measured in situ on each side of each bay using a GM816 BENETCH digital handheld anemometer (Palo Alto, USA), which also measured air temperature.
The CO2 flux in the ocean-atmosphere interface (FCO2) was determined using the following equation:
where K0 is the CO2 solubility coefficient in seawater (mol L-1 atm-1); determined according to (Weiss, 1974) as a function of SST (°K) and SSS; Kw is the gas transfer velocity (cm hour-1), calculated using the equation of Wanninkhof (2014); pCO₂sw is the pCO₂ at the surface (measured in this study); and pCO₂atm is the pCO₂ in the atmosphere, which was obtained from the Ragged Point measuring station (Barbados) of the Earth System Research Laboratories of the NOAA Global Monitoring Network (Lan et al., 2024). This station was the closest to the study area and exhibited similar conditions to those in the Caribbean. A positive FCO2 value indicates that more CO2 is present in the ocean than in the atmosphere. Under these conditions, the ocean acts as a CO2 source. In contrast, negative values indicate that more CO2 is present in the atmosphere than in the ocean, with the ocean acting as a CO2 sink.
To determine the main underlying drivers of the pCO2, pH, and Ω variability in the study area, a first-order Taylor series decomposition method was used for pCO₂, pH, and Ωarag, considering the influence of temperature (T), salinity (S), DIC, and TA. This type of decomposition has been used in other marine carbonate system studies (Lovenduski et al., 2007; Doney et al., 2009b; Gallego et al., 2018; Wright‐Fairbanks and Saba, 2022).
The interannual and seasonal surface-water anomalies for any variable X´ ( can also be expanded linearly for all variables under consideration:
where
where
where
In addition, freshwater precipitation and evaporation drive correlated variations in surface water DIC´ and TA´, which have opposite effects on pCO2. To remove this effect, we use the modified method of Lovenduski et al. (2007), normalizing DIC and TA by salinity (nDIC and nTA, respectively), using (Equation 11), with average salinity represented by Salref:
The monthly anomaly of the variable after removing the mean monthly climatology (X0; i.e., mean January or mean February), given by X´= X – X0, was used to evaluate change on the interannual time scale. The partial derivative SFW corresponds to the freshwater driver that includes the direct effect of changes in salinity on pCO2, pH, and Ωarag and the indirect effect caused by changes in surface DIC and TA (Lovenduski et al., 2007; Doney et al., 2009b; Hauri et al., 2013; Franco et al., 2021). To calculate the partial derivatives, we used the derived routine for CO2SYS-MATLAB (Orr et al., 2018).
Instead of using the deseasonalized series for the seasonal analysis, monthly averages were calculated, and the difference between these and the total average (seasonal amplitude) was used.
Finally, we evaluated differences in conditions between the Gayraca and Chengue Bays and between exposed and sheltered stations with a non-parametric Mann–Whitney test in Minitab v21.1.0. No significant differences were present between the exposed and protected areas of each bay or between the Gayraca and Chengue Bays (see Supplementary Material). Both sites displayed similar patterns; thus, we only describe Gayraca Bay in this study. The results for Chengue Bay can be found in the supplementary material.
Contrasting annual patterns in wind and rainfall were observed. The highest wind speeds (until 12 m·s-1) and minimal rainfall (~0 mm) were recorded in the first three months of the year related to the intensification of the northeast trade winds between December and March, with seasonal upwelling decreasing temperature (Figure 2A). From September to November, the winds relaxed, and the northward shift in the ITCZ enhanced precipitation, decreased salinity (~33 PSU; Figure 2B), and increased SST. The intensification in rainfall increased Magdalena River discharge (a proxy for terrestrial runoff; Figure 2C), with the freshwater contribution resulting in biogeochemical changes in the area.
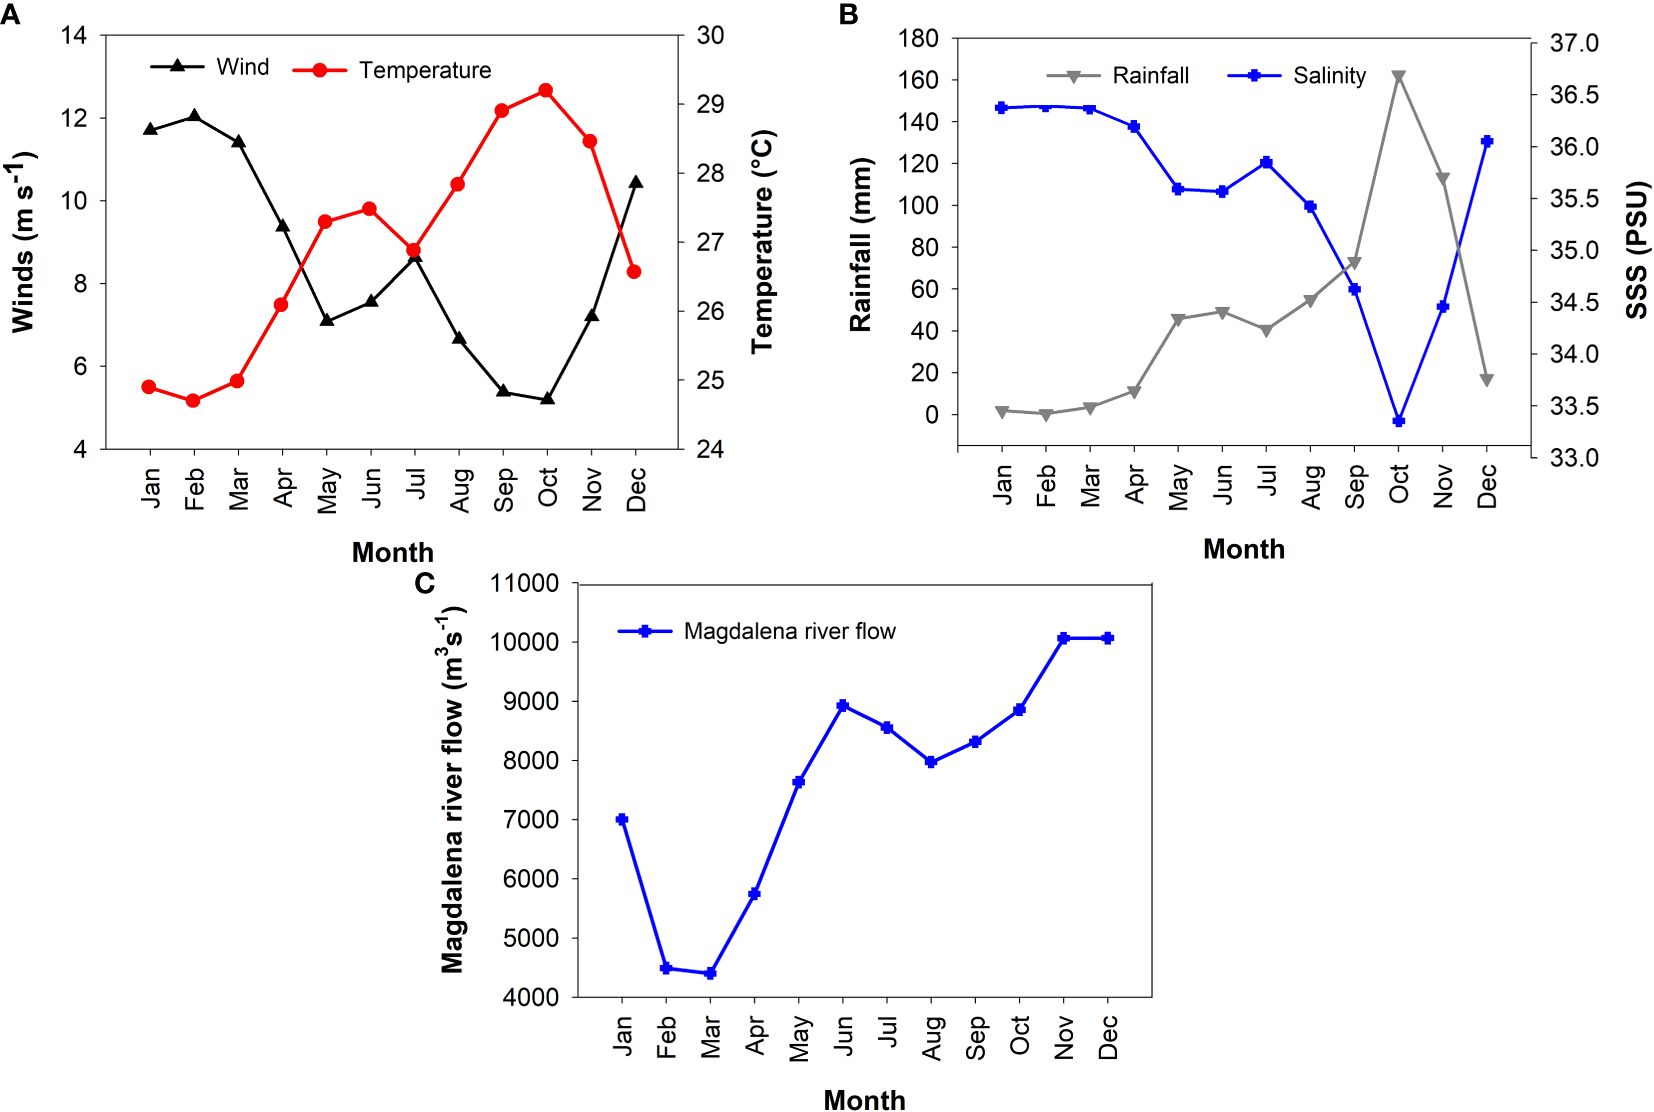
Figure 2. Description of the seasonal cycle of wind (m·s-1) and sea surface temperature (SST, °C) (A), precipitation (mm) and salinity (UPS) (B), and Magdalena River discharge (m³·s-1) (C) for a location near the study area (11° 30´N, 74° 15´ W).
During the study period, a weak La Niña (2017–2018) evolved into a weak El Niño (2018–2019), followed by a moderate La Niña (2020–2022). The upwelling index indicated that upwelling conditions were present throughout much of the year, with weakening in the wet season and strengthening in the dry season (first three months of the year; Figure 3A). Upwelling and rainfall exhibited interannual changes related to ENSO conditions (Figure 3B), with an intensification of upwelling and negative anomalies in rainfall coinciding with the weak El Niño. During La Niña periods, the strongest negative upwelling anomalies were observed along with positive rainfall anomalies.
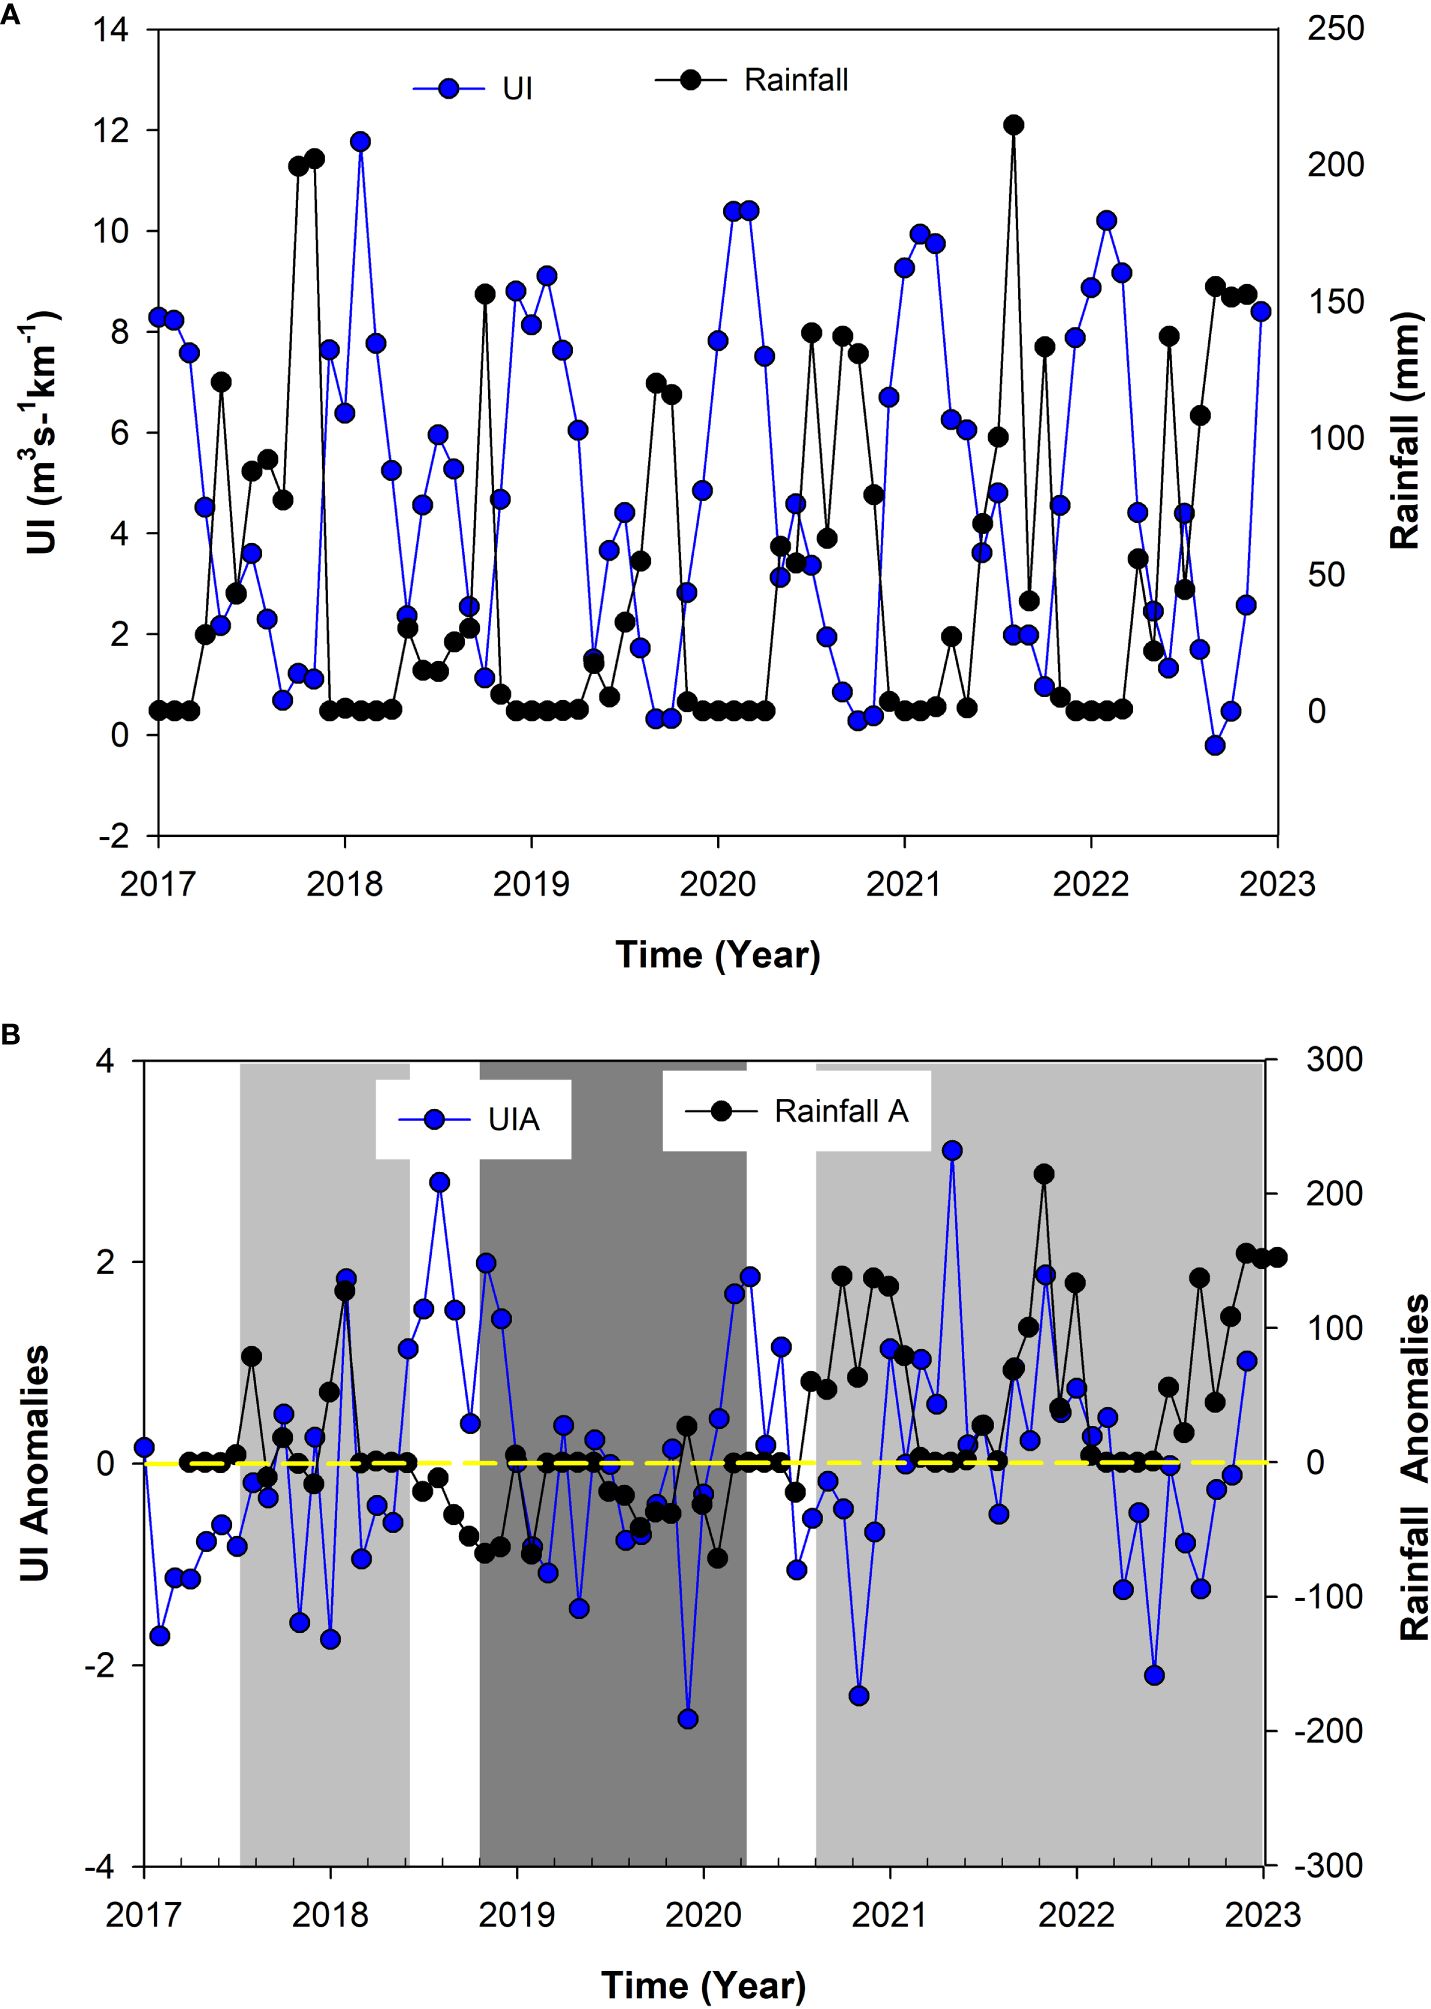
Figure 3. Upwelling index (UI) in the Tayrona National Natural Park (TNNP) and accumulated monthly rainfall at the Aeropuerto Simón Bolívar station between March 2017 and October 2022 (A). Deseasonalized anomalies of UI and rainfall over the study period (B). Light gray bars indicate La Niña, and dark gray bars indicate El Niño conditions.
In situ data of temperature and salinity revealed significant seasonal variations linked to changes in upwelling intensity and river runoff, associated with the presence of different water masses (Figure 4). During the dry season when upwelling was strongest, the lowest SST values were recorded (24–25°C), and modified Subtropical Underwater (SUWm) predominated, characterized by SA > 36.6 g kg-1 and Θ ~22–23°C (Giraldo, 1994; Hernandez-Guerra and Joyce, 2000). During the rainy season, warmer waters were present in the study area with features similar to Caribbean Surface Water (CSW, SA ~35.5 g·kg-1 and Θ ~28-30°C; (Hernandez-Guerra and Joyce, 2000). The water column showed minimal vertical variation in temperature, salinity, and dissolved oxygen, indicating uniform mixing (refer to Supplementary Material). However, the T-S mix data from different years revealed variations due to the impact of surface freshwater inputs and/or water masses (Figure 4) (CSW and SUWm).
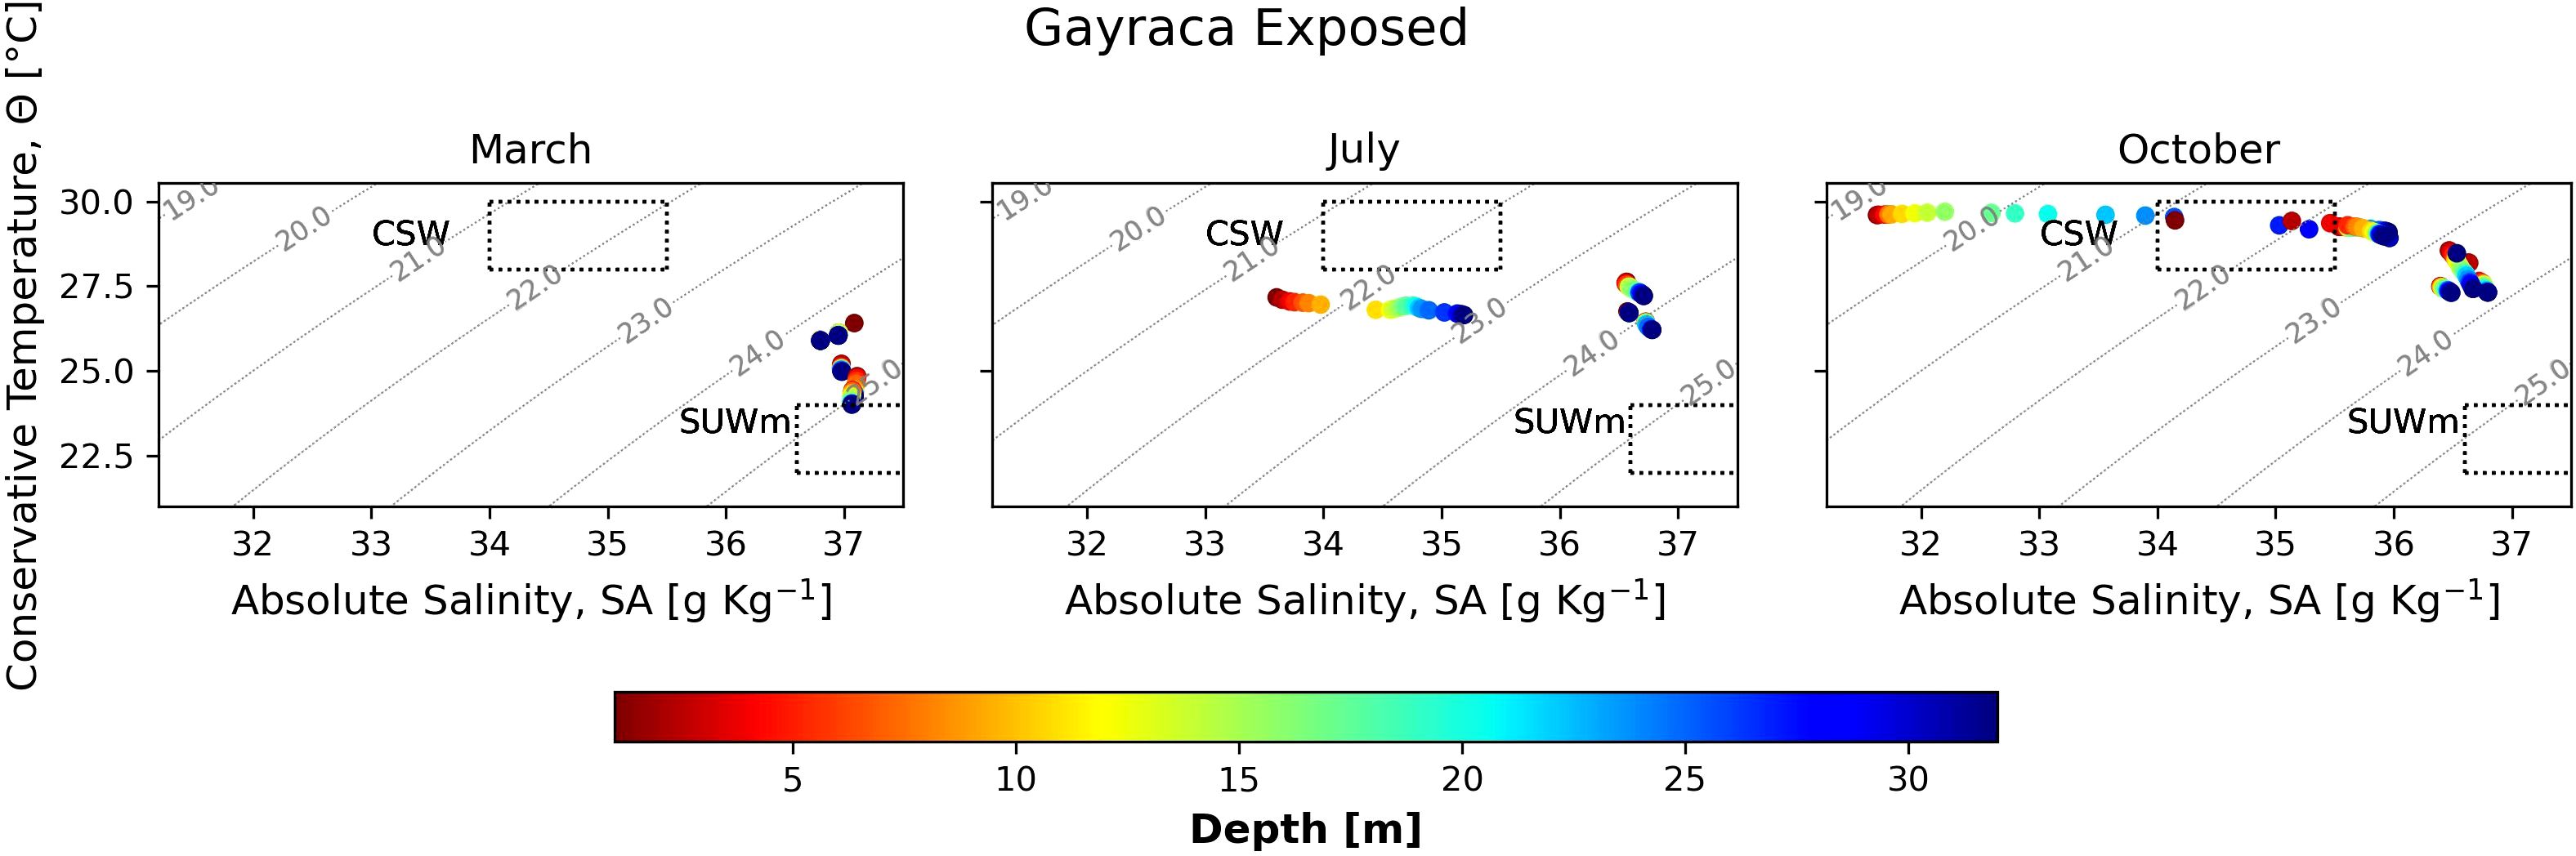
Figure 4. Θ-SA diagrams of the exposed area of Gayraca Bay in March, July, and October during 2017 and 2022. The dotted box indicates the conservative temperature and absolute salinity values of the water masses Caribbean Surface Water (CSW) and Subtropical Underwater modified (SUWm).
No vertical variability was present in the parameters because of the well-mixed water column. Therefore, we only describe surface patterns. The average, maximum, and minimum values are shown in Table 1. The differences in environmental conditions between the dry (enhance upwelling) and wet (increase river runoff) seasons were reflected in the differences in the carbonate system variables. The seasonal carbonate system climatologies showed low SST and pH, but high SSS, DO, DIC, and TA values during the upwelling season (dry conditions) and the opposite in the wet season (Figure 5A). Associated with the low rainfall period of Veranillo de San Juan, low SST; pH values below 8.1; high SSS, DIC and TA values; and low DO were observed in June, earlier than expected (July to August).
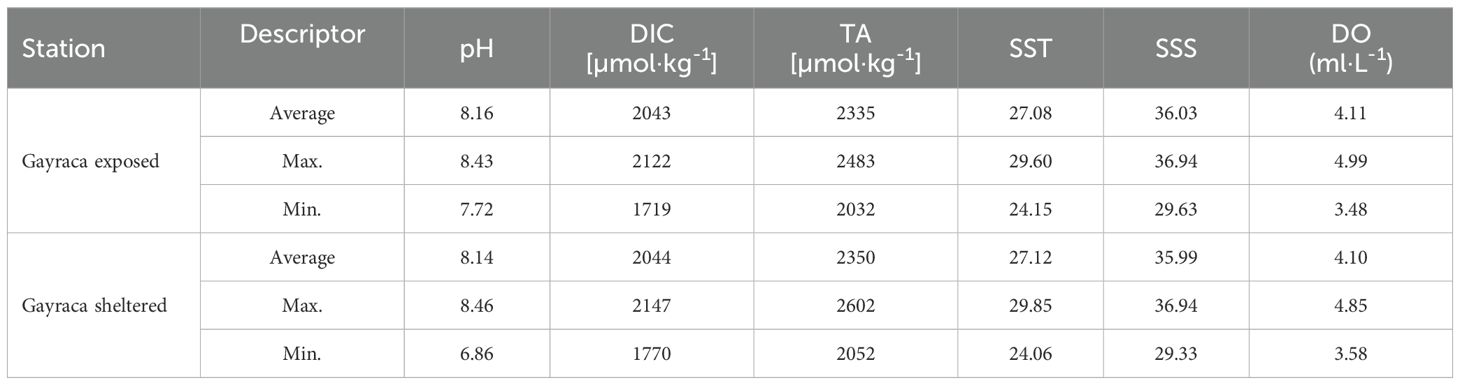
Table 1. Descriptors of pH, dissolved inorganic carbon (DIC), total alkalinity (TA), sea surface temperature (SST), sea surface salinity (SSS), and dissolved oxygen (DO).
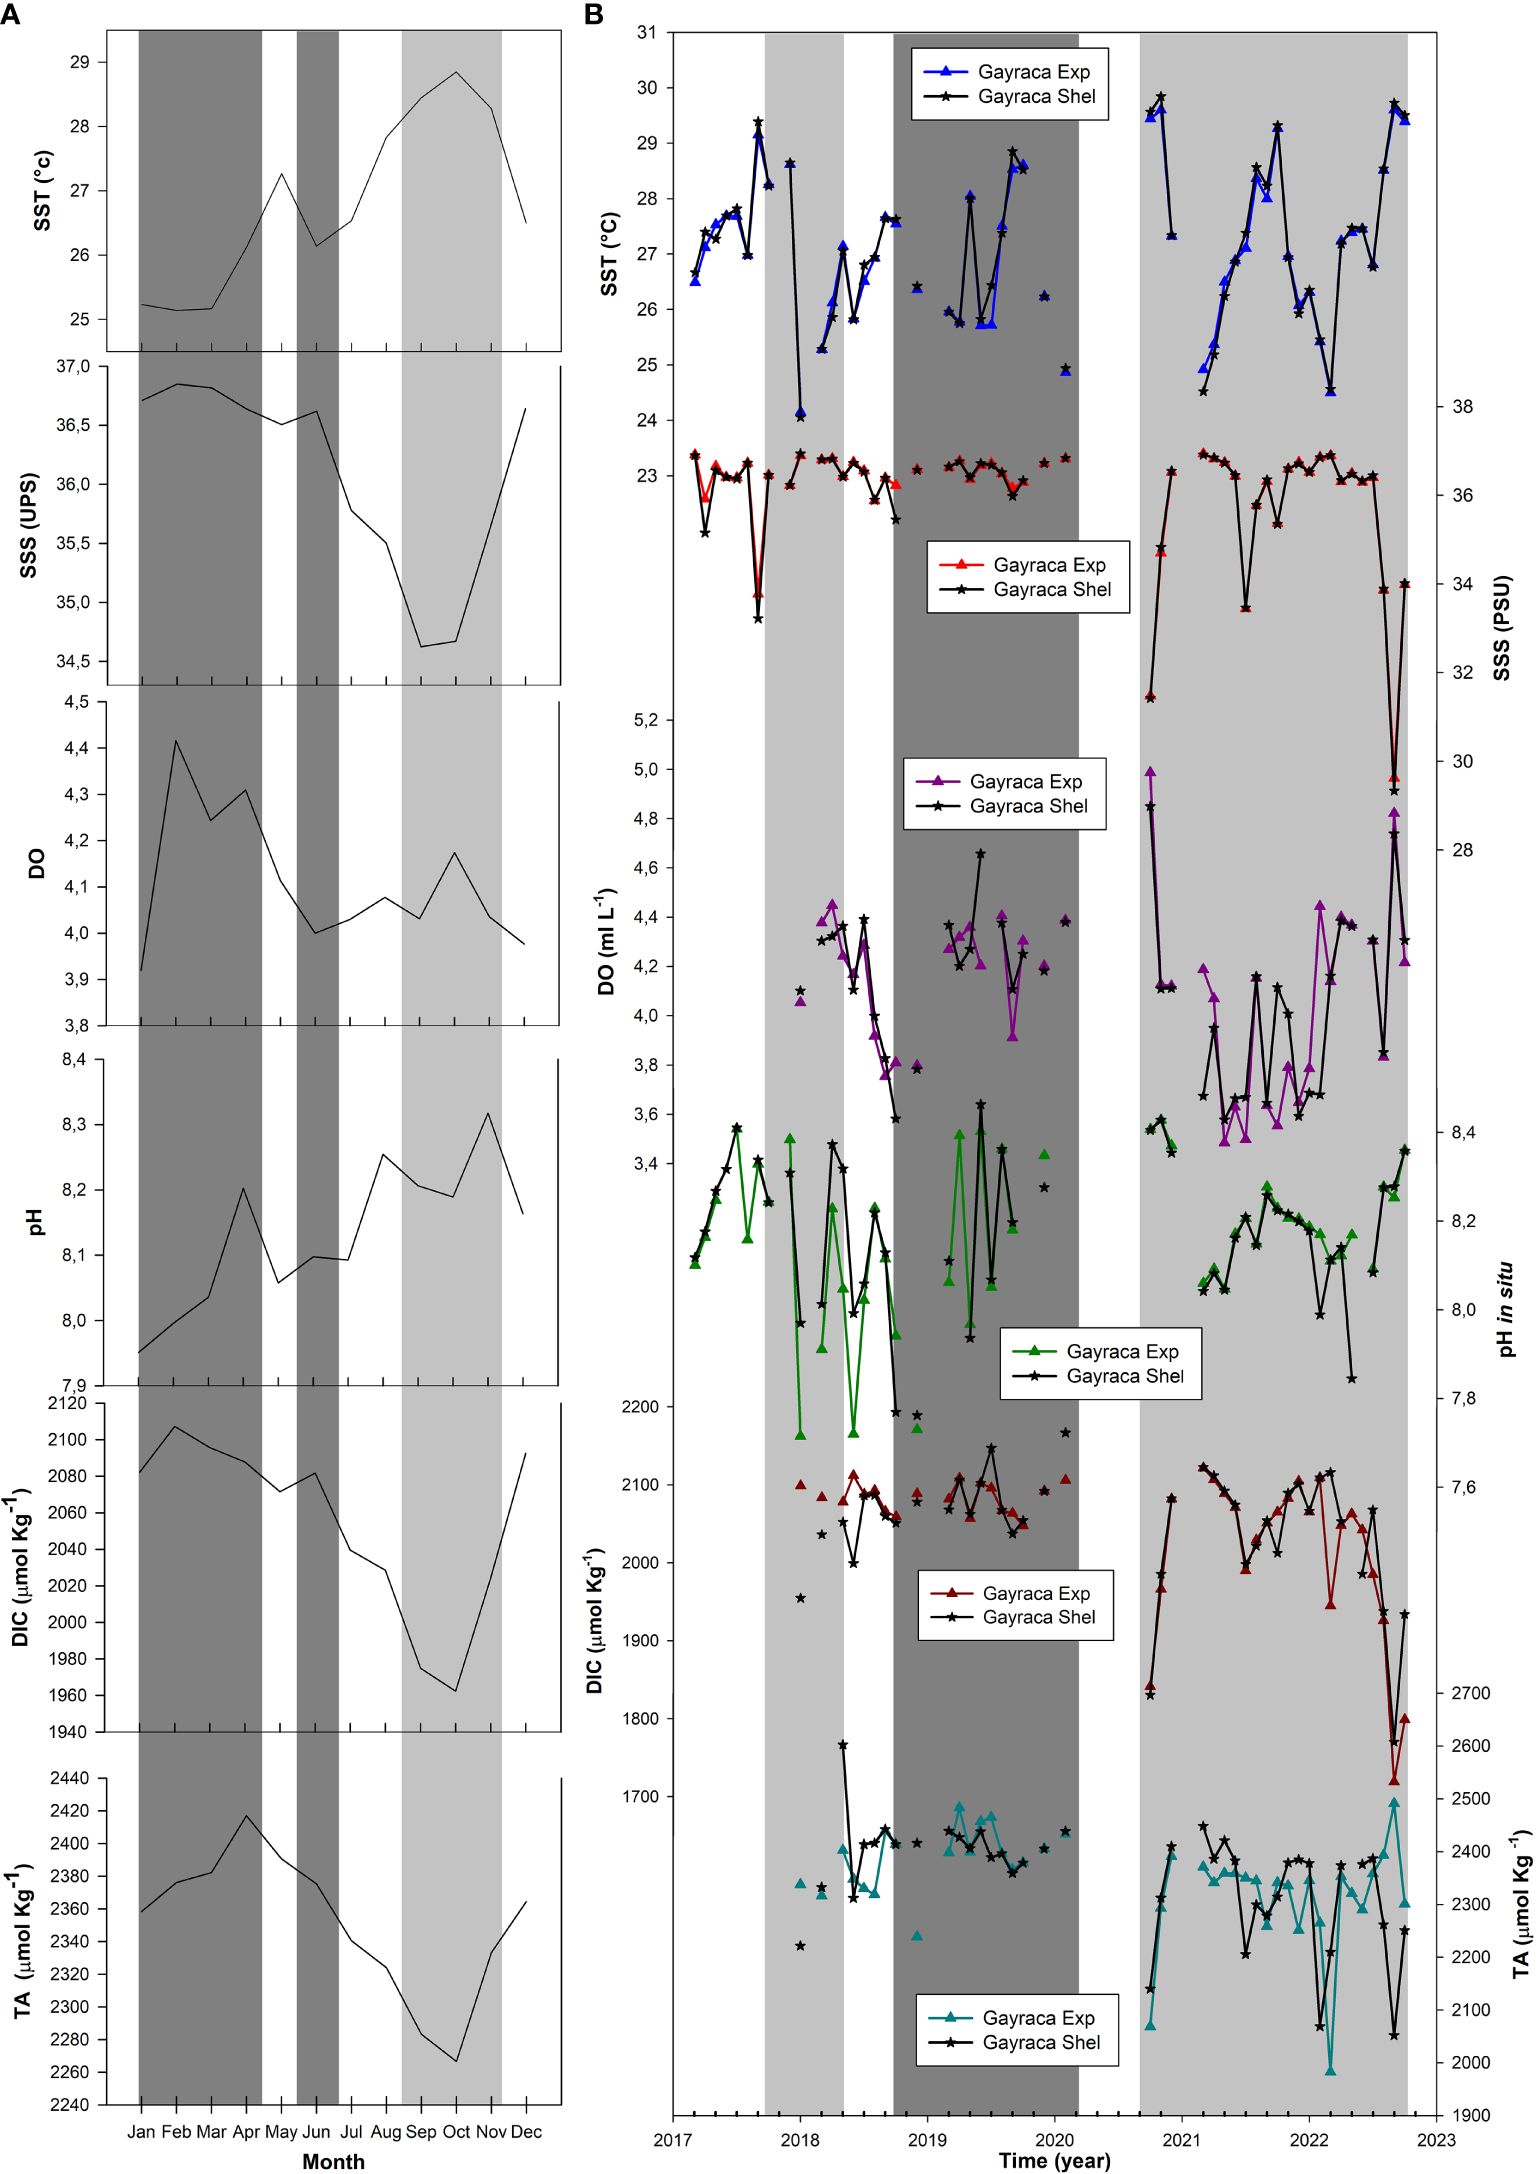
Figure 5. Seasonal climatology of sea surface temperature (SST), sea surface salinity (SSS), dissolved oxygen (DO), pH, dissolved inorganic carbon (DIC), and total alkalinity (TA) in Gayraca Bay (A). Dark gray bar indicates the dry season, and light gray bar indicates the wet season. Time series of SST, SSS, DO, pH, DIC, and TA (B). Light gray bars indicate La Niña, and dark gray bars indicate El Niño conditions.
The time series showed high interannual variability, with SST and SSS consistently exhibiting opposite behavior, marking the changes between dry and wet conditions. During periods of higher SST and lower SSS, lower DO values and higher pH levels were observed, associated with increased terrestrial runoff. As expected, DIC and TA followed a pattern similar to that of SSS, especially in the protected area of Gayraca Bay (Figure 5B).
The water masses observed in the study area exhibited characteristic DIC, TA, pH, and DO signatures, with lower pH (7.73–8.06) and higher DIC (2082–2122 µmol·kg-1), TA (2316 – 2433 µmol·kg-1), and DO (4.19 – 4.39 ml·L-1) values associated with SUWm, while higher pH (8.11–8.41) and lower DIC (1799–1990 µmol·kg-1), TA (2032–2172 µmol·kg-1), and DO (3.50 – 4.22 ml·L-1) values were associated with CSW (Table 2).
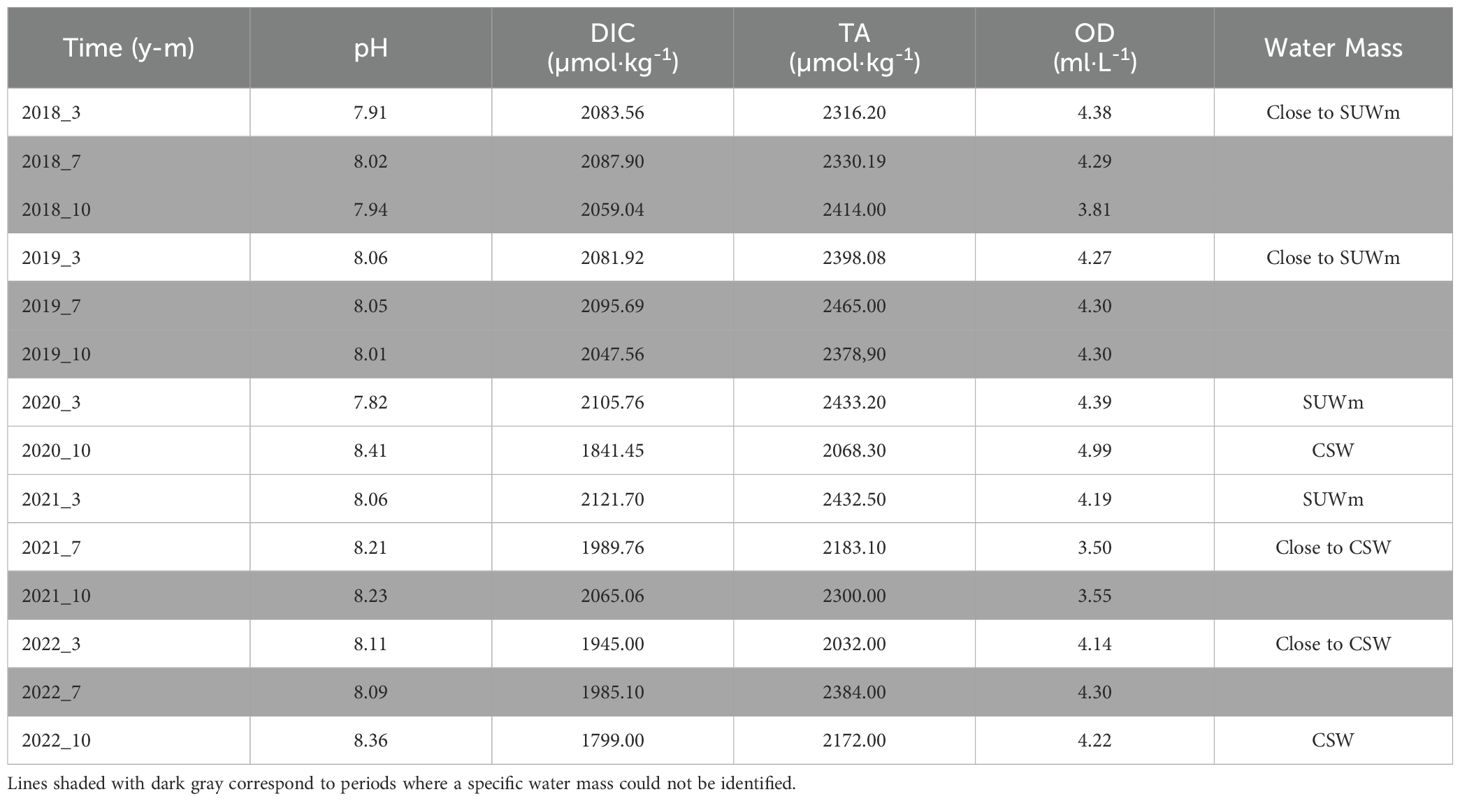
Table 2. Values of dissolved inorganic carbon (DIC), total alkalinity (TA) and pH in relation to the water masses recorded for the characteristic months of the climatic seasons in Gayraca Bay.
During 2018 and 2019, the water samples were classified as neither SUW nor CSW, although the values were close to those of SUW, with low pH and high DIC values. Meanwhile, in July and October 2021, a water mass with characteristics close to those of CSW was observed with high pH, low DIC, and low DO, although the DIC values were higher for October. Finally, in July 2022, no specific water mass could be identified because DIC and pH were low, while TA and DO were high.
The saturation values for Ωcalc ranged from 0.34 to 9.98 (average of 4.90), while those for Ωarag ranged from 0.23 to 6.63 (average of 3.35; Figure 6). Both Ωcalc and Ωarag exhibited values<1 during February 2022 (0.80 and 0.53, respectively), indicating corrosive conditions for calcium carbonate. These values coincided with waters of low pH (7.99), high DIC (2109 µmol·kg-1), and low TA (2069 µmol·kg-1) associated with the presence of mixing between SUWm and CSW.
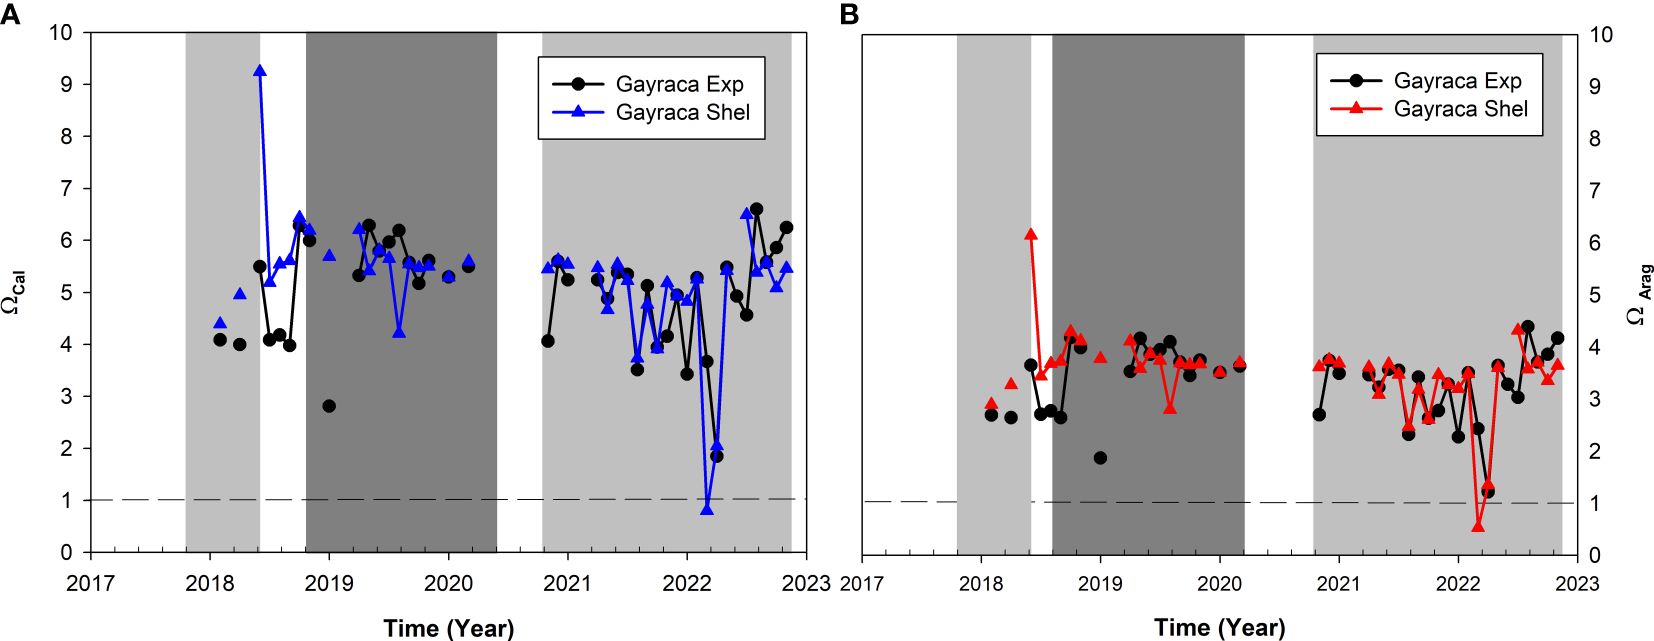
Figure 6. Calcium carbonate saturation state in Gayraca Bay: calcite (Ωcalc) (A) and aragonite (Ωarag) (B). Light gray bars indicate La Niña, and dark gray bars indicate El Niño conditions.
The carbonate system variables showed a significant association with ENSO (Figure 7). During the weak La Niña event, anomalies were predominantly positive for pCO2 and DIC but negative or near zero for TA and Ωarag. In contrast, during the moderate La Niña event, the anomalies alternated, with pCO2, DIC and TA showing predominantly negative values toward the end of the record, while Ωarag exhibited positive anomalies. Meanwhile, during the weak El Nino event, pCO2 anomalies were negative, whereas DIC, TA, and Ωarag anomalies were predominantly positive. Conversely, pH anomalies did not exhibit consistent patterns during La Niña or El Niño events.
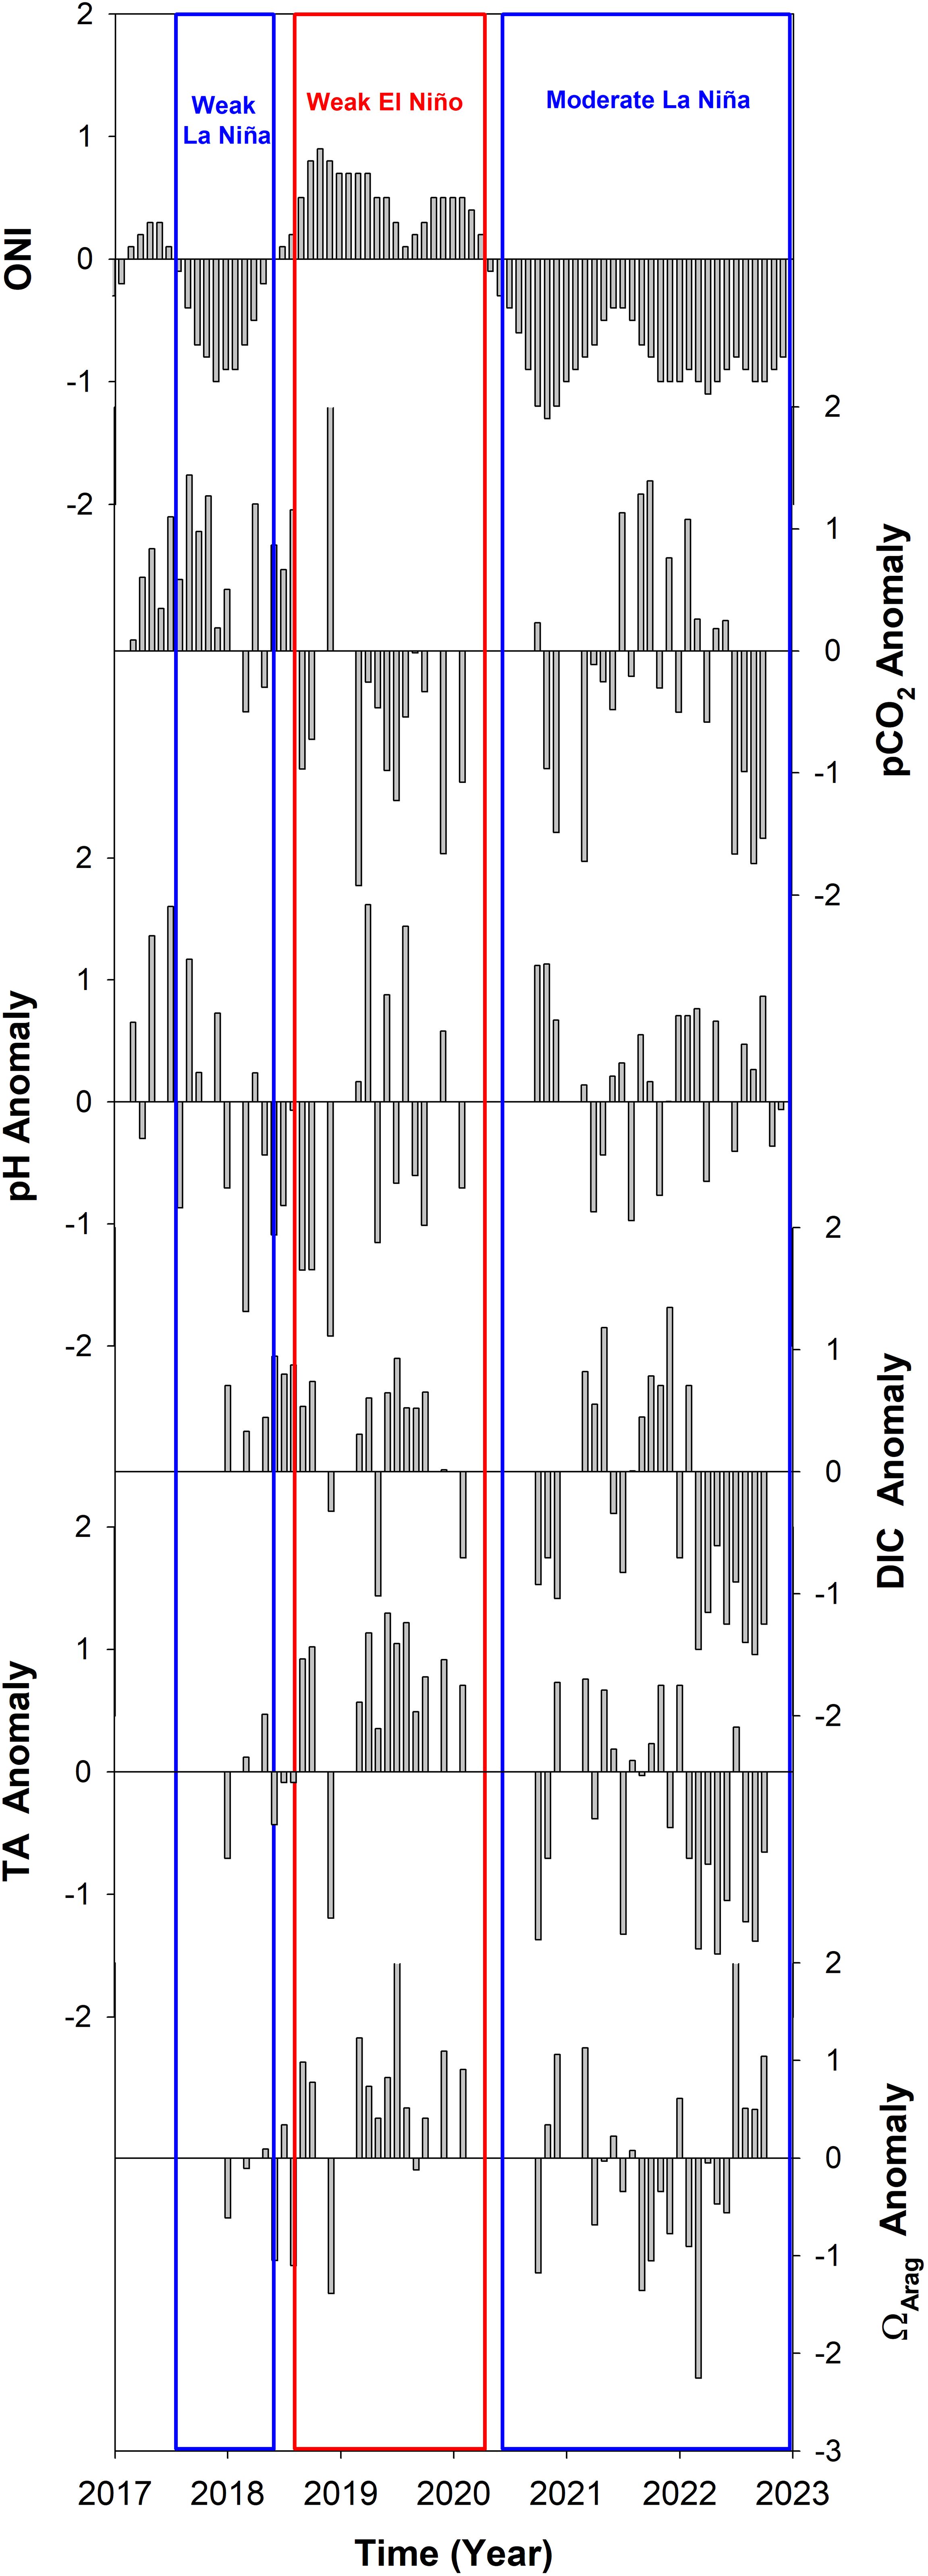
Figure 7. Oceanic El Niño Index (ONI) compared with partial pressure of CO2 (pCO2), pH, dissolved inorganic carbon (DIC), total alkalinity (TA), and omega aragonite (Ωarag) anomalies during 2017–2022.
Seasonally, the highest pCO2 values were found in the dry season when upwelling was active, while the lowest were in the season with maximum rainfall and river runoff (Figure 8A). At the interannual scale (Figure 8B), the lowest pCO2 values, close to atmospheric equilibrium (average of 411 µatm for 2019) at the Ragged Point station in Barbados (used as a reference in this study), were recorded during the weak El Niño event and in the second half of 2022, corresponding to the moderate La Niña period. Both periods were characterized by negative upwelling anomalies (Figure 3). The second period showed the lowest recorded values, with an average of 393 µatm. In contrast, the highest values (mean of 610 µatm) with higher amplitudes (~400 µatm) were observed during the weak La Niña (late 2017-mid 2018) and during the middle of the moderate La Niña (second half of 2021-first half of 2022).
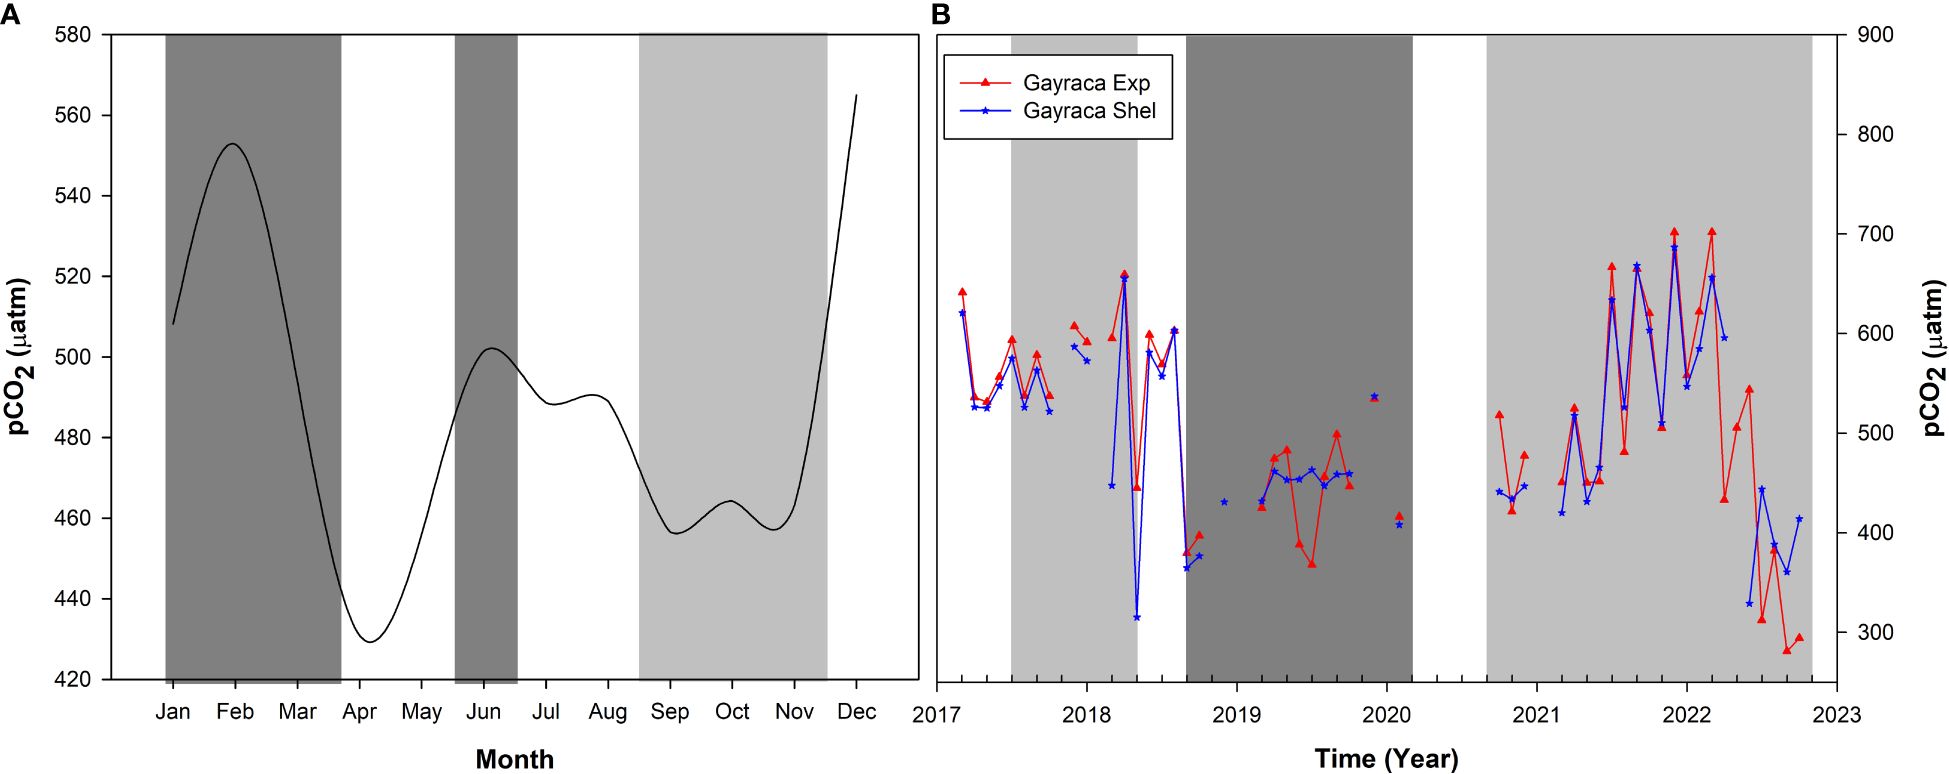
Figure 8. Seasonal climatology of the partial pressure of CO2 (pCO₂) at the surface of Gayraca Bay between 2017 and 2022 (A). Dark gray bars indicate the dry season, and light gray bars indicate the wet season. Time series of pCO₂ (B). Light gray bars indicate La Niña, and dark gray bars indicate El Niño conditions. Equilibrium values: 2017 (406 µatm), 2018 (408 µatm), 2019 (411 µatm), 2020 (413 µatm), 2021 (416 µatm), and 2022 (418 µatm).
The ocean-atmosphere CO2 flux values (Figure 9) analyzed between March 2017 and October 2022 were mostly positive. Thus, the area acted as a source of CO2. The CO2 fluxes were higher in the exposed zone (mean 35.4 mmol·m-2·day-1) than in the protected (mean 16.8 mmol·m-2·day-1) zone. Negative flux values (sink behavior) were very small (close to zero) and were observed mainly during the same periods of negative upwelling anomalies explained above (Figure 3) (i.e., during the weak El Niño and the second half of 2022 [the moderate La Niña period]).
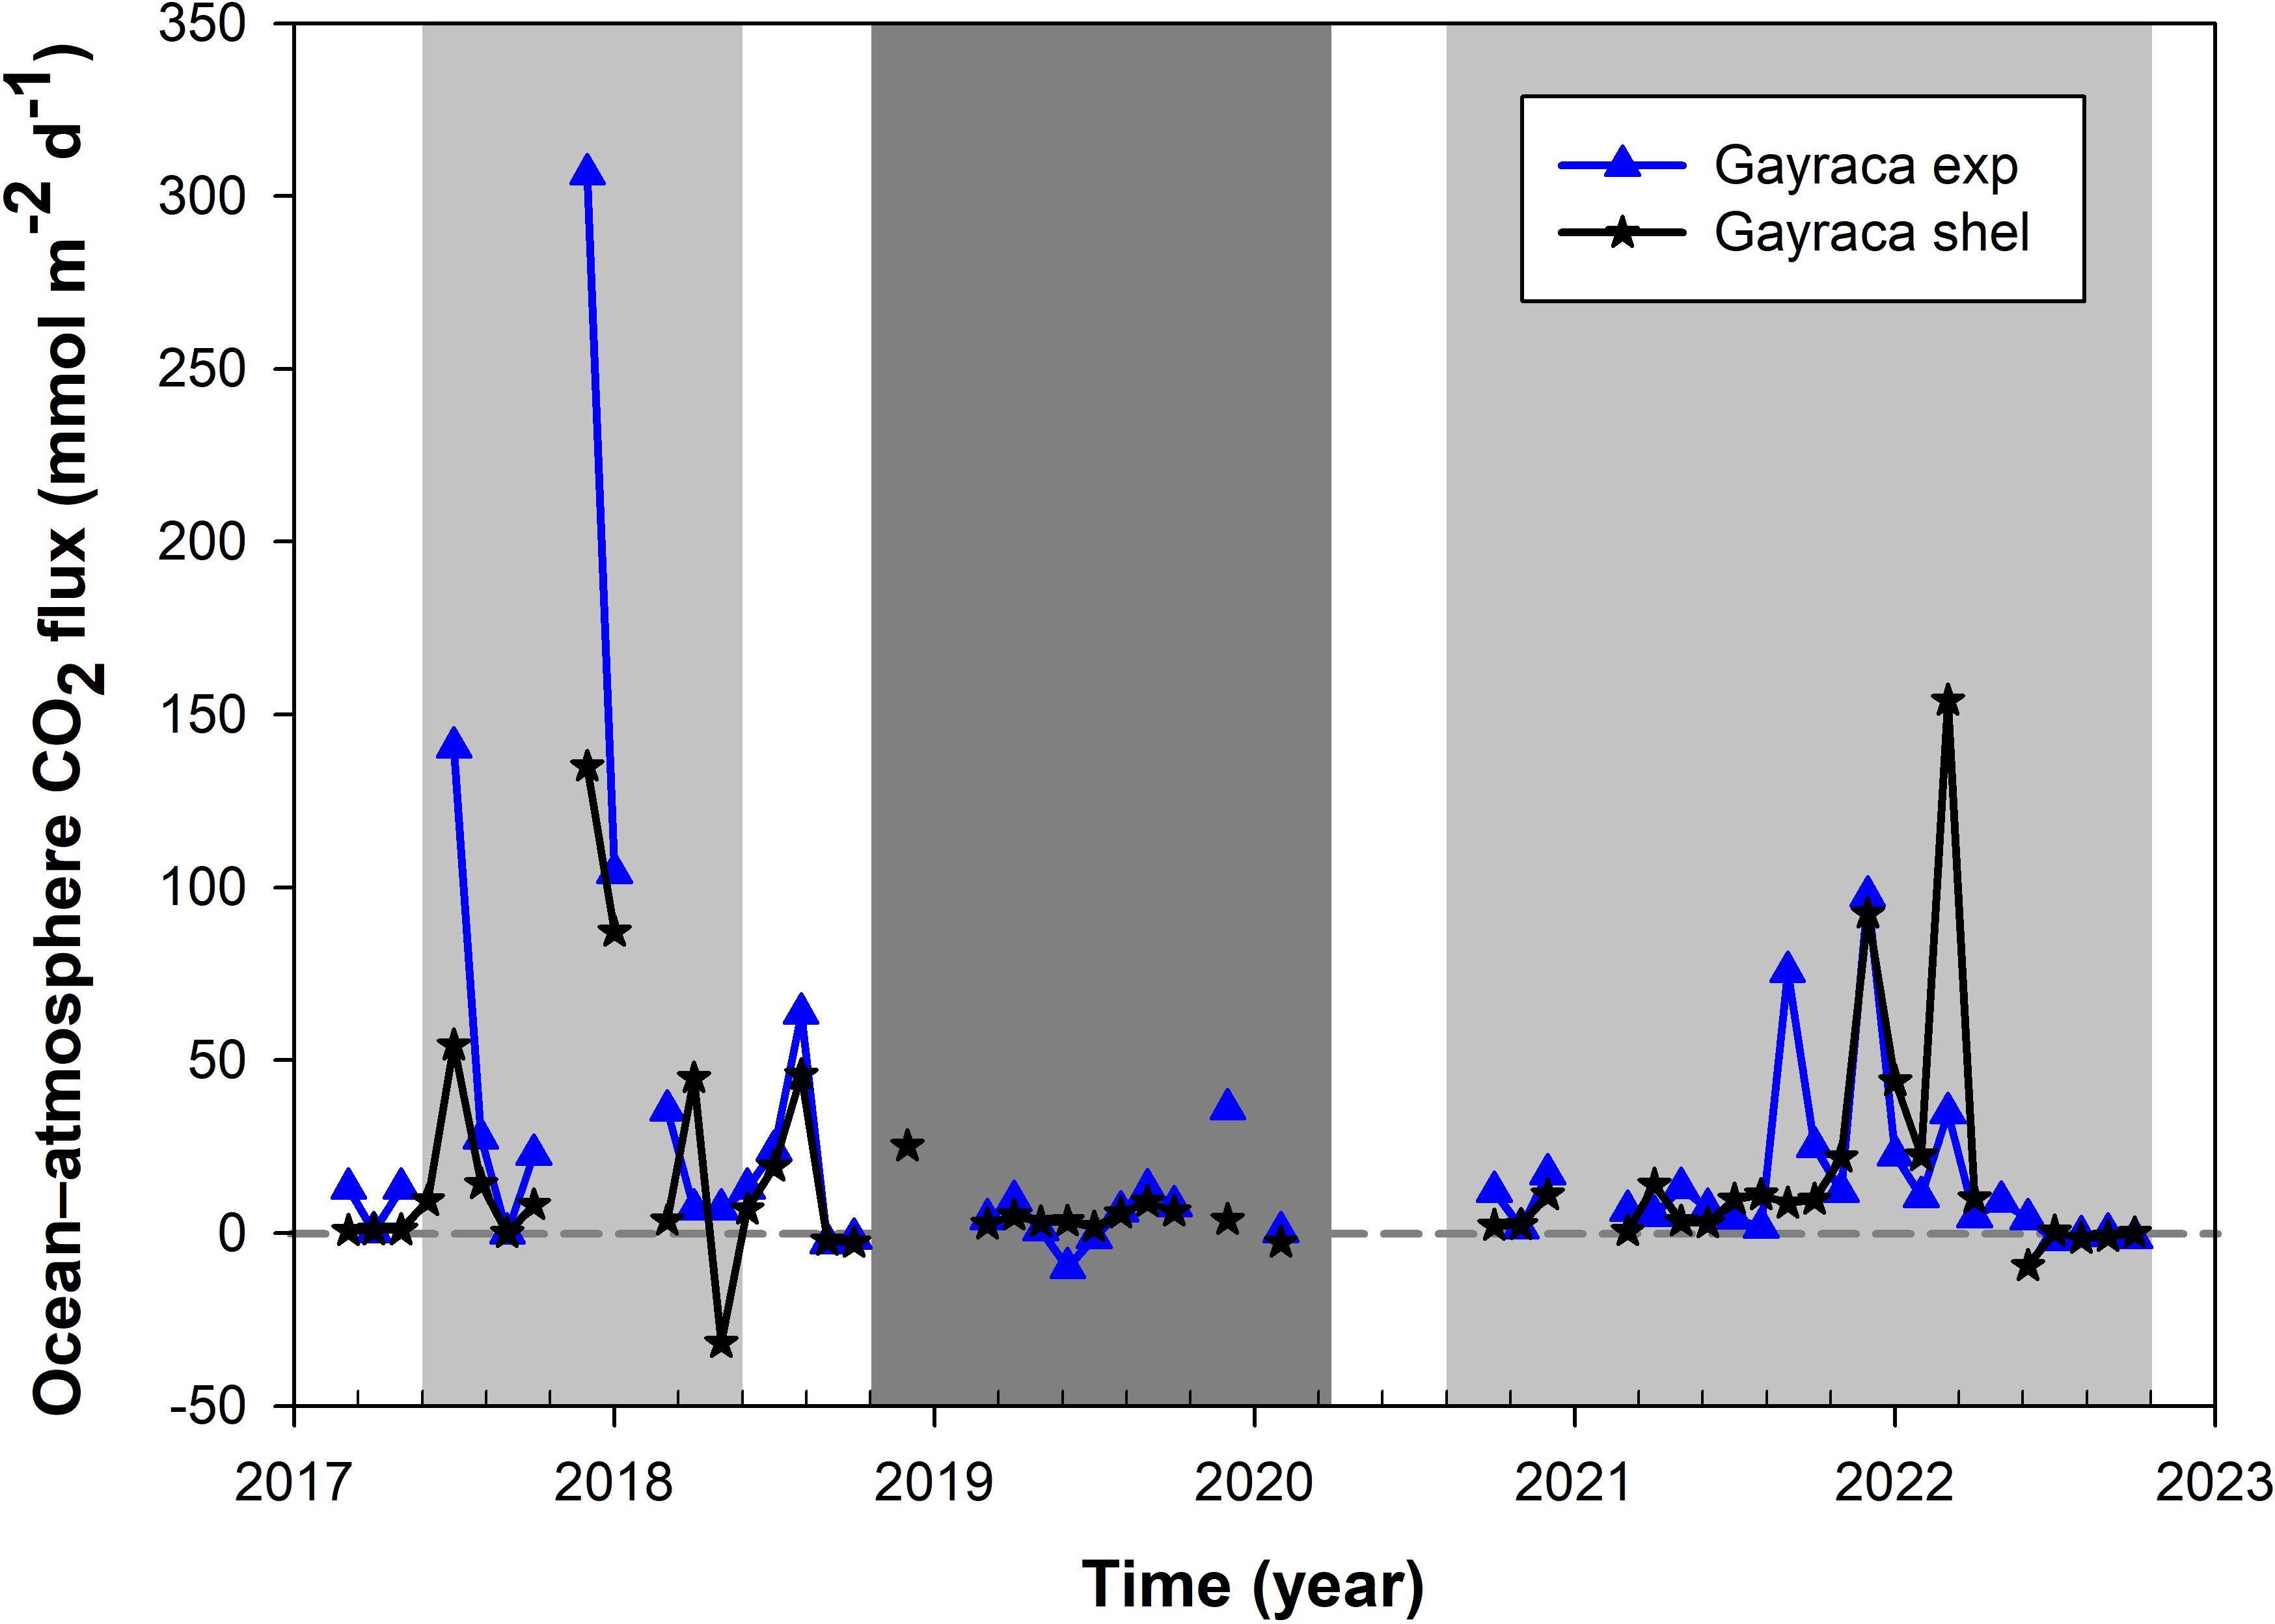
Figure 9. Ocean-atmosphere CO2 fluxes in the exposed and protected areas of Gayraca Bay.
Despite the increasing trend in the CO2 concentration at the Ragged Point (Bermuda) station (Figure 10A), the carbonate system variables showed mainly a decreasing trend over the study period (2017–2022) (Figure 10): pCO2 (-0.5464 μatm·y−1), nDIC (-0.6828 μmol·kg−1·y−1), DIC (-2.8685 μmol·kg−1·y−1), and TA (-2.74 μmol·kg−1·y−1) (Figures 10B, E, F and G, respectively). Only pH (Figure 10C) (0.0015) showed a slight increasing trend, while Ωarag (-0.0008) and nTA (-0.0768 μmol·kg−1·y−1) (Figures 10D, H) showed minimal decreasing trends.
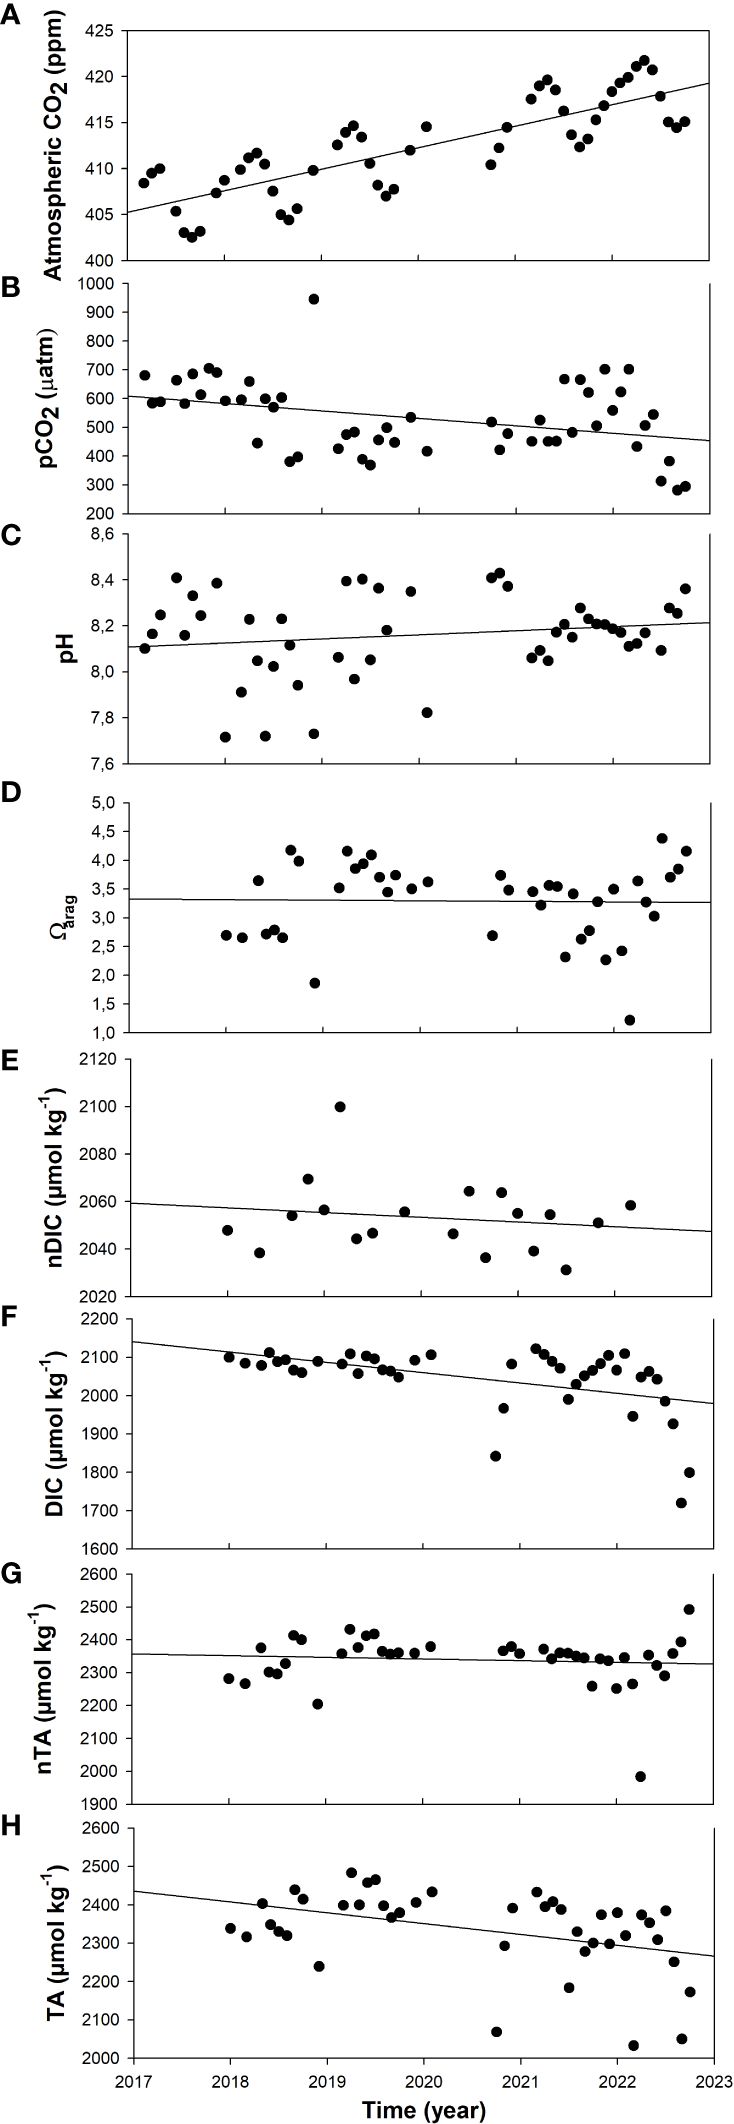
Figure 10. Trends in atmospheric CO2 records from the Ragged Point measuring station (Barbados) (A), and the carbonate system variables, partial pressure of CO2 (pCO2) (B), pH (C), calcium carbonate saturation state of aragonite (Ωarag) (D), salinity-normalized dissolved inorganic carbon (nDIC) (E), dissolved inorganic carbon (DIC) (F), salinity-normalized total alkalinity (nTA) (G), and total alkalinity (TA) (H) in the exposed and protected areas of Gayraca Bay.
At the seasonal scale, we observed that TA was an important driver of changes in pCO2 (Figure 11A). This was observed mainly in the dry season (December to April), although during February and July, which are months with high upwelling activity, DIC increased its positive effect on pCO2. In the wet season, the effect was negative, which coincided with the relationship between DIC-TA and SSS (see Supplementary Material). Also, SST exhibited an important contribution: it was the second most important driver in the dry season and the main driver at the end of the wet season (October to November).

Figure 11. Factors driving seasonal variability in carbonate system variables, partial pressure of CO2 (pCO₂) (A), pH (B), and calcium carbonate saturation state of aragonite (Ωarag) (C) in Gayraca Bay, corresponding to components of a Taylor series decomposition. Drivers of interannual variability in carbonate system variables: pCO2 (D), pH (E), and Ωarag (F). The contributions of sea surface temperature (black), freshwater (red), dissolved inorganic carbon (DIC, green), and total alkalinity (TA, yellow) are shown.
TA was an important driver of pH changes (Figure 11B), although DIC and freshwater, includes the direct effect of salinity changes due to freshwater input (SFW) also exhibited important contributions. DIC was the main driver in February, with its effect increasing from May to July. Freshwater was the main driver of change (positive effect) in pH during the wet season and in August. Finally, the main driver of changes in Ωarag was TA (Figure 11C), with important negative contributions to DIC in February, June, and July (dry season) and a positive contribution in March.
At the interannual scale, TA was the main driver of pCO2, pH, and Ωarag changes (Figures 11D, E, F), with some periods where DIC was the dominant driver. For pCO2, these two drivers had positive effects at the beginning of the record and between mid-2021 and 2022. The contribution of SFW to CO2 increased at the end of the record, between the end of 2020 and the end of 2022, which coincided with a moderate La Niña event. TA had a negative influence on pH at the beginning of the record but a positive influence between the end of 2020 and the middle of 2022. Finally, the contribution of TA to pCO2 was mainly negative at the beginning of the record, as well as between the end of 2020 and mid- 2022.
We analyzed the temporal variation of the TNNP carbonate system from 2017 to 2022. Upwelling and fluvial runoff influenced seasonal patterns, while interannual variability was modulated by ENSO events. These factors alternated between marine and estuarine conditions, shaping the chemistry of the carbonate system in the study area. The results highlight the high variability of oceanographic processes in coastal regions, emphasizing the need for a holistic understanding of the system that considers chemical, physical, and biological variables, as well as ocean-atmosphere interactions to identify the underlying mechanisms.
The TNNP is a principal site for seasonal La Guajira upwelling (Rueda-Roa and Muller-Karger, 2013). Alongshore winds during the dry season (December to April) and Veranillo de San Juan (July) result in an upwelling of a subsurface water mass (Sarmiento-Devia et al., 2013; Herrera-Fajardo et al., 2017; Correa-Ramirez et al., 2020, characterized by a low temperature and high salinity water mass identified as modified Subtropical Underwater (Correa-Ramirez et al., 2020). This water mass was associated with lower pH values (average 8.0), high DIC, and high TA that resulted in natural acidification conditions similar to those observed in other tropical upwelling regions, such as the Gulf of Papagayo (Sánchez-Noguera et al., 2018) and Gulf of Tehuantepec (Chapa-Balcorta et al., 2015). During the rainy season, when more river runoff was observed from the Magdalena River and other nearby rivers (September to November), pH values were higher (~8.2) than in the dry season, reflecting mixing in the coastal zone (Carstensen and Duarte, 2019). In this period, DIC and TA values were lower due to freshwater dilution (Salisbury et al., 2009), which was associated with increased river runoff due to more rainfall, contributing to the formation of Caribbean surface water. Cervantes-Díaz et al. (2022) reported similar results for the Gulf of Mexico, observing low DIC values associated with this water mass. The highest pH values (average pH of ~8.25) were recorded during transition periods (April and August), probably because upwelling relaxed and freshwater inputs were low. The results of this study also align with descriptions of other areas influenced by fluvial inputs that modulate ocean chemistry, particularly DIC and TA (Lefèvre et al., 2014, 2021).
The waters in the Gayraca and Chengue sites did not show the typical salinity and temperature values for CSW and SUW, probably due to changes due to evaporation and the influence of continental runoff (Guerrero and Piola, 1997; Tomczak, 1999; Cervantes-Díaz et al., 2022). Similarly, diffusion, lateral mixing, currents, and their fluctuations have been shown to modify salt and heat balances and alter water mass characteristics (Guerrero and Piola, 1997).
The seasonal behavior of pCO₂ showed the highest values during the dry season (December–March and June) coinciding with the season of highest wind speeds, upwelling conditions, lower SST, and higher DIC/TA. Hernández-Ayón et al. (2013) explained that upwelled water contains high concentrations of DIC, leading to higher seawater pCO₂ than atmospheric pCO₂, favoring a positive ocean-to-atmosphere.
The interannual variability patterns of the oceans are primarily modulated by the main atmospheric and ocean-atmosphere climate modes (Wang and Schimel, 2003). In the tropical Pacific, ENSO is the most important force in marine physics and biogeochemistry (Doney et al., 2009b). Also, the northeastern Colombian Caribbean coast exhibited interannual variability related to contrasting climatic conditions associated with ENSO events. River runoff, including water from the Ciénaga Grande de Santa Marta and Magdalena River, notably affects the oceanographic conditions of the TNNP, which has been generally only associated with upwelling. Nonetheless, river runoff inputs were a crucial determinant of the conditions in the area during the study period, which was evident due to the high rainfall recorded from 2017 to 2018 and from the end of 2020 to 2022 during La Niña events. An increase in river runoff during La Niña has been observed in several coastal areas adjacent to large rivers like the Magdalena River (Restrepo and Kjerfve, 2000; Restrepo et al., 2006), such as those adjacent to the Amazon and Congo Rivers (Lefèvre et al., 2014, 2021; Ibánhez et al., 2015), with consequences for the biogeochemistry of the nearby ocean (Bates and Hansell, 2004).
During El Niño, a decrease in rainfall and negative upwelling anomalies led to lower pCO2 and a lower ocean-atmosphere CO2 flux, which agrees with the observations of Feely et al. (1999, 2002) and Doney et al. (2009b) for the Pacific Ocean during El Niño events. These authors documented a strong correlation between the reduction of the CO2 flux into the atmosphere and the onset of El Niño. During this period, discrepancies between DIC/TA (high) and pCO2 (low) were observed, which arose primarily due to reduced upwelling, which limits the influx of CO₂ into surface waters (Feely et al., 1999). This results in lower pCO₂ levels, even when DIC and TA remain relatively high. Similarly, diminished CO₂-rich terrestrial runoff can contribute to this effect (Salisbury et al., 2009). Total alkalinity and DIC generally increases during El Niño due to changes in water mass properties due increase evaporation (Feely et al., 1999; Zeebe and Wolf-Gladrow, 2001). Elevated TA enhances the buffering capacity of a system, moderating pH changes and altering carbonate chemistry speciation (Sabine and Feely, 2007). This buffering can reduce the fraction of DIC existing as CO₂(aq) or pCO₂, even with higher overall carbon content. Additional influences include biological activity and temperature effects on CO₂ solubility (Takahashi et al., 2009).
During La Niña events, greater variability in conditions was observed related to increased river runoff and changes in upwelling patterns. During the weak La Niña and in the middle of the moderate La Niña, positive pCO2, TA, and DIC anomalies coincided with positive upwelling anomalies and an increase in the CO2 flux, which is consistent with the increase in the CO2 flux observed at the onset of La Niña in the Pacific Ocean (Feely et al., 1999, 2002; Doney et al., 2009b). However, at the beginning and end of the moderate La Niña event, the behavior was opposite to what was previously described, with negative anomalies in pCO₂, TA, and DIC observed, accompanied by a decrease in CO₂ flux. Additionally, during certain periods, a decoupling between DIC-TA and pCO₂ was evident. While DIC and TA were low due to freshwater dilution (Salisbury et al., 2009), pCO₂ remained high, possibly influenced by factors such as inputs from CO₂-rich rivers and upwelling, increased respiration, and reduced buffering capacity (Bates and Hansell, 2004; Sabine and Feely, 2007; Salisbury et al., 2009).
During the middle of the moderate La Niña event (July 2021), a water mass arrived at the surface with characteristics similar to those of SUWm but with low DIC. This suggests that the biogeochemical characteristics of the water reaching the surface during the upwelling season were influenced by continental inputs, which agrees with what was reported by Correa-Ramirez et al. (2020). In this study, the pH anomalies were found to be more irregular and less systematic compared to those of pCO₂, total alkalinity (TA), and dissolved inorganic carbon (DIC). This discrepancy stems from the complex interplay of factors influencing ocean pH. Unlike pCO₂, TA, and DIC, which generally align with large-scale, systematic processes (Takahashi et al., 2009a), pH is highly sensitive to localized, non-linear, and transient factors that can obscure clear patterns (Hofmann et al., 2011). Additionally, biological processes, such as photosynthesis, respiration, and calcification, drive rapid and localized changes in pH (Duarte et al., 2013). These processes often lack consistency due to their reliance on variables like light availability, organism distribution, and the time of day (Waldbusser and Salisbury, 2014; Waldbusser et al., 2016). In addition, the logarithmic nature of the pH scale further amplifies the effects of even small changes in [H⁺], resulting in notable pH shifts (Zeebe and Wolf-Gladrow, 2001). This property makes pH anomalies more pronounced and erratic compared to those of TA, DIC, or pCO2.
A notable variation was observed in the saturation states of aragonite and calcite due to the contrasting seasonal and interannual conditions of the region. Despite this variability, saturation states generally remained within optimal ranges for calcification. This contrasts with findings by Norzagaray-López et al. (2017) for coral reefs in Cabo Pulmo, Mexico, where low variability in saturation states was reported. These differences highlight that the northeastern Colombian Caribbean region experiences extreme conditions, necessitating a high level of adaptation by local coral communities.
On a seasonal scale, lower saturation states were recorded during the dry season, coinciding with natural acidification linked to the influx of upwelling waters, as previously noted. In contrast, higher saturation states occurred during the minor and major rainy seasons. At the interannual scale, saturation state anomalies for Ωarag were predominantly negative during La Niña events and positive during El Niño events. This interannual variability reflects shifts in nutrient availability, light intensity, and temperature, which are critical drivers of productivity in the reef zone of the TNNP. Despite these fluctuations, benthic primary productivity in the TNNP has been found to remain relatively stable (Eidens et al., 2014), which may contribute to the resilience of these coral communities to anthropogenic disturbances and climate change. However, changes in the environmental conditions of the region could result in high stress for reef formations.
During the moderate La Niña event in early 2022, undersaturated levels (<1) of Ωcalc and Ωarag were observed. These were linked to the mixing Subtropical Underwater (SUW, low pH) and Coastal Surface Water (CSW, low DIC). Such conditions could challenge coral calcification in the area, particularly under future climate change scenarios. Extreme events in the Caribbean Sea, including cold fronts from the north (Montoya-Sánchez et al., 2018) and tropical storms, are also expected to intensify. Although there is no consensus on the effects of climate change in upwelling areas, several studies suggest potential changes in their intensity, timing, and spatial structure (Bakun, 1990; Bakun et al., 2015; Wang et al., 2015).
In the TNNP, increased upwelling intensity could result in higher concentrations of DIC and elevated CO2 fluxes to the atmosphere during stronger winds, further reducing saturation states. Similarly, changes in hydrological cycles, including increased rainfall associated with global warming (Trenberth, 1998; Allan et al., 2020; Liu et al., 2020), may enhance mixing between SUW and coastal inputs low in DIC. This could create more corrosive water, posing risks to the survival of existing coral formations in the area.
During the study period, the calculated CO2 fluxes were predominantly positive, indicating that the area primarily acted as a CO2 source. The highest flux values were recorded when local wind speeds peaked, particularly during the Veranillo de San Juan (July to August), when water temperatures were also elevated. Furthermore, positive upwelling anomalies were linked to increased ocean-atmosphere CO2 fluxes. The relationship between wind speed and ocean-atmosphere gas exchange has been extensively reviewed by Wanninkhof (1992, 2014).
Using interpolated monthly mean surface ocean pCO₂ and atmospheric pCO₂ data for the Caribbean, Takahashi et al. (2014) reported that positive pressure differences between the ocean and atmosphere persisted throughout most of the year. Exceptions were observed from January to March, when values were slightly negative (>-30 μatm), although annual net fluxes remained positive.
Understanding the factors that drive changes in carbonate system variables is crucial for predicting their responses to both natural variability and climate change effects. In the surface waters of the study area, the behavior of pCO2, pH, and Ωarag was primarily influenced by seasonal and interannual variations in TA and DIC. This was attributed to freshwater inputs and their effects on the physical and chemical conditions of coastal areas near riverine runoff. The relationship between these drivers, TA and DIC, and their impact on CO2 exhibited shifts in coupling, influenced by the dominance of specific processes depending on the prevailing biogeochemical and physical dynamics of the system, such as biological activity and mixing processes.
At the seasonal and interannual scales, pCO2 variability was primarily driven by changes in DIC and TA. This is attributes to the fact that, under estuarine conditions, the buffer sensitivity factors by DIC and TA-induced are generally of similar magnitude., As a result, changes in DIC and TA during gas exchange and biogeochemical processes play a crucial role (Zeebe and Wolf-Gladrow, 2001; Waldbusser et al., 2016; Cai et al., 2021). In addition, the sensitivity of an estuarine water mass can differ depending on the TA value of the river endmember. Under conditions of low-salinity, estuaries that receive inputs from low-TA rivers show greater sensitivity to the addition of CO2 than estuaries that receive inputs from high-TA rivers; this has important implications for pCO2, pH, and Ωarag (Cai et al., 2021).
In this study, during months with increased upwelling activity, which resulted in colder subsurface water with higher DIC content at the surface, a slight damping of this factor on TA on pCO2 was observed. Furthermore, during La Niña, increased rainfall enhanced freshwater influx, resulting in dilution that notably impacted both DIC and TA.
The sensitivity of pH, pCO2, and Ωarag in an estuarine water body can vary greatly depending on the TA value of the river endmember. This is because the DIC: TA ratio of the river (~1.0) changes much more rapidly in estuaries that receive inputs from low-TA rivers than in those that receive inputs from high-TA rivers (Cai et al., 2021). Additionally, it has been found that long rivers in tropical areas, such as the Amazon River (Cai et al., 2021) and the Orinoco River, have low TA (Cai et al., 2021). In this study, we also detected a lower TA signal from the Magdalena River, which increased the sensitivity of the carbonate system variables. Furthermore, much of the seasonality of TA is driven by changes in seasonal SSS due to rainfall or ice melting (Gregor and Gruber, 2021).
The variability in pH was mainly modulated by TA followed by DIC and SFW. During the first part of the year, water with higher TA/DIC and lower SST entered the study area, negatively affecting pH. Additionally, higher SSS were recorded due to lower precipitation, less river runoff, and the contribution of upwelled water. Conversely, during the rainy season, the arrival of river runoff with low TA, DIC, and higher SST, along with dilution effects, resulted in an increase in pH. Increased nutrient inputs from rivers can lead to a high biological removal of CO2 and, consequently, alkalinization and an increased buffering capacity in surface waters (Borges and Gypens, 2010). Given that the seasonal cycle of TA in the study area exhibited a greater amplitude than that of SST, the change in pH was not primarily driven by the latter, as has been observed in other coastal areas (Doney et al., 2009b). During upwelling periods (Feb-Mar), DIC compensated TA. However, since the inputs were not as high and the upwelled water in the study area had lower DIC (younger) than that of the Pacific Ocean, they did not outweigh the effects of other variables.
Similarly, the variability of Ωarag at the seasonal scale was mainly modulated by TA, followed by DIC, the latter being the main driver of change during months of coastal upwelling, which provided subsurface water with low pH and low Ωarag content. The effect of DIC on pCO2, pH, and Ωarag has been widely documented for upwelling zones (Feely et al., 2008; Turi et al., 2016; Addey et al., 2021). In the latter part of the year, TA positively affected Ωarag due to weakened upwelling. At the interannual scale, the main driver of Ωarag change was also TA, confirming that alternating low and high river runoff conditions, due to changes in rainfall, modulated the system at this temporal scale. Lower Ω values occur naturally around most river mouths because they gather runoff from watershed soils, which typically contain carbonic acid, a by-product of organic decomposition (Salisbury et al., 2009). In addition, high rainfall can result in low SSS, and due to notable freshwater inputs, Ωarag can also be suppressed by the reduction of [Ca2+] and [CO32-] in low-salinity areas, as Ω depends on their concentrations (Salisbury et al., 2008; Feely et al., 2018).
Finally, the observed trends in pH and pCO₂ were primarily driven by a decrease in DIC and TA, attributed to an increased input of river runoff, despite rising atmospheric CO₂ levels. This behavior stands in contrast to the typical ocean acidification trends observed in other regions.
For the first time, a time series of the carbonate system variables is presented for the TNNP, along with a biogeochemical characterization of the shallow water masses of CSW and SUW. River runoff and Southern Caribbean upwelling influence this area on the northeastern coast of the Colombian Caribbean. The observed seasonal and interannual behavior revealed the complexity of oceanographic conditions in coastal regions where oceanic and continental influences alternate, especially in areas with notable fluvial freshwater inputs. In addition, patterns of variability in carbonate system variables were evident from year to year.
This study is important for understanding future ocean acidification scenarios in the context of climate change because characterizing the natural variability of a system is the first step in comprehending anthropogenic influences. A holistic understanding of the system (considering nutrient levels, biological activity, the redox state, and water mixing) is essential for identifying the underlying mechanisms. Therefore, it is necessary to continue monitoring the carbonate system of the TNNP to define an accurate baseline for the seasonal climatological cycle. Additionally, we recommend installing equipment to continuously monitor the TNNP to quantify high-frequency (e.g., daily and monthly) changes. Biological variables, such as those associated with respiration and photosynthesis, may influence the carbonate system; however, in this study, we cannot speculate how they may affect the carbonate system of the TNNP because we did not analyze biological data.
The raw data supporting the conclusions of this article will be made available by the authors, without undue reservation.
CR-V: Conceptualization, Data curation, Formal analysis, Funding acquisition, Investigation, Methodology, Project administration, Resources, Software, Supervision, Validation, Visualization, Writing – original draft, Writing – review & editing. MM-R: Data curation, Investigation, Methodology, Software, Visualization, Writing – review & editing. JH-A: Conceptualization, Data curation, Funding acquisition, Investigation, Methodology, Supervision, Writing – review & editing.
The author(s) declare financial support was received for theresearch, authorship, and/or publication of this article. This research was funded with resources from the National Investment Projects Bank (BPIN), project “Investigación científica hacia la generación de información y conocimiento de las zonas marinas y costeras de interés de la nación [Scientific research aimed at generating information and knowledge of the marine and coastal areas of national interest]”, project code 202300000000039 of the José Benito Vives de Andrèis Institute for Marine and Coastal Research (INVEMAR) of Colombia.
We thank the researchers of the Oceanography and Climate Line and the Marine Instrumentation Laboratory of the Marine and Coastal Geosciences program of INVEMAR, who contributed to collecting samples and data in the field. Special thanks to researcher María Camila Bernal for her field support, as well as to Sebastián Contreras Fernández, Wilberto Pacheco Paternina, and Lorenzo Portillo Cogollo for their assistance with figures. Additionally, we would like to express our gratitude to the researchers and technicians of the CO2 System Laboratory of the Oceanographic Research Institute (IIO) of Universidad Autónoma de Baja California for their assistance in laboratory analysis. We would also like to express our thanks to Researcher Ana Franco for her support in the Taylor Series Decomposition analysis. Finally, we want to express our gratitude to the reviewers, especially reviewer 1 who provided constructive feedback to improve this article.
The authors declare that the research was conducted in the absence of any commercial or financial relationships that could be construed as a potential conflict of interest.
All claims expressed in this article are solely those of the authors and do not necessarily represent those of their affiliated organizations, or those of the publisher, the editors and the reviewers. Any product that may be evaluated in this article, or claim that may be made by its manufacturer, is not guaranteed or endorsed by the publisher.
The Supplementary Material for this article can be found online at: https://www.frontiersin.org/articles/10.3389/fmars.2024.1305542/full#supplementary-material
Addey C. I., Jiang Z.-P., Chen J., Afelumo A. J., Adesina B. R., Osanyintuyi A. J. (2021). The variability of partial pressure of carbon dioxide (pCO2) in a river-influenced coastal upwelling system: A case of the northeast pacific coast. J. Geosci. Environ. Prot. 9, 133–148. doi: 10.4236/gep.2021.97009
Allan R. P., Barlow M., Byrne M. P., Cherchi A., Douville H., Fowler H. J., et al. (2020). Advances in understanding large-scale responses of the water cycle to climate change. Ann. N Y Acad. Sci. 1472, 49–75. doi: 10.1111/nyas.v1472.1
Astor Y. M., Lorenzoni L., Thunell R., Varela R., Muller-Karger F., Troccoli L., et al. (2013). Interannual variability in sea surface temperature and fCO2 changes in the Cariaco Basin. Deep Sea Res. Part II: Topical Stud. Oceanography 93, 33–43. doi: 10.1016/J.DSR2.2013.01.002
Astor Y. M., Scranton M. I., Muller-Karger F., Bohrer R., García J. (2005). fCO2 variability at the CARIACO tropical coastal upwelling time series station. Mar. Chem. 97, 245–261. doi: 10.1016/j.marchem.2005.04.001
Bakun A. (1990). Global climate change and intensification of coastal ocean upwelling. Sci. (1979) 247, 198–201. doi: 10.1126/science.247.4939.198
Bakun A., Black B. A., Bograd S. J., García-Reyes M., Miller A. J., Rykaczewski R. R., et al. (2015). Anticipated effects of climate change on coastal upwelling ecosystems. Curr. Clim Change Rep. 1, 85–93. doi: 10.1007/s40641-015-0008-4
Bates N. R., Hansell D. A. (2004). Temporal variability of excess nitrate in the subtropical mode water of the North Atlantic Ocean. Mar. Chem. 84, 225–241. doi: 10.1016/j.marchem.2003.08.003
Bayraktarov E., Pizarro V., Wild C. (2014). Spatial and temporal variability of water quality in the coral reefs of Tayrona National Natural Park, Colombian Caribbean. Environ. Monit Assess. 186, 3641–3659. doi: 10.1007/s10661-014-3647-3
Bayraktarov E., Wild C. (2014). Spatiotemporal variability of sedimentary organic matter supply and recycling processes in coral reefs of Tayrona National Natural Park, Colombian Caribbean. Biogeosciences 11, 2977–2990. doi: 10.5194/bg-11-2977-2014
Bernal C., Gómez Batista M., Sanchez-Cabeza J. A., Cartas-Aguila H., Herrera-Merlo J., Ruíz-Rodríguez G., et al. (2021). “Determinación de alcalinidad total en agua de mar utilizando dispensador manual,” in Método de titulación en celda abierta (Santa Marta).
Borges A. V., Gypens N. (2010). Carbonate chemistry in the coastal zone responds more strongly to eutrophication than ocean acidification. Limnol Oceanogr 55, 346–353. doi: 10.4319/lo.2010.55.1.0346
Cai W.-J., Feely R. A., Testa J. M., Li M., Evans W., Alin S. R., et al. (2021). Natural and anthropogenic drivers of acidification in large estuaries. Ann. Rev. Mar. Sci. 13, 23–55. doi: 10.1146/annurev-marine-010419-011004
Carstensen J., Duarte C. M. (2019). Drivers of pH variability in coastal ecosystems. Environ. Sci. Technol. 53, 4020–4029. doi: 10.1021/acs.est.8b03655
Cervantes-Díaz G. Y., Hernández-Ayón J. M., Zirino A., Herzka S. Z., Camacho-Ibar V., Norzagaray O., et al. (2022). Understanding upper water mass dynamics in the Gulf of Mexico by linking physical and biogeochemical features. J. Mar. Syst. 225, 103647. doi: 10.1016/j.jmarsys.2021.103647
Chapa-Balcorta C., Hernandez-Ayon J. M., Durazo R., Beier E., Alin S. R., Lõpez-Pérez A. (2015). Influence of post-Tehuano oceanographic processes in the dynamics of the CO2 system in the Gulf of Tehuantepec, Mexico. J. Geophys Res. Oceans 120, 7752–7770. doi: 10.1002/2015JC011249
Correa-Ramirez M., Rodriguez-Santana Á., Ricaurte-Villota C., Paramo J. (2020). The Southern Caribbean upwelling system off Colombia: Water masses and mixing processes. Deep Sea Res. 1 Oceanogr Res. Pap 155, 103145. doi: 10.1016/j.dsr.2019.103145
Da F., Friedrichs M. A. M., St-Laurent P., Shadwick E. H., Najjar R. G., Hinson K. E. (2021). Mechanisms driving decadal changes in the carbonate system of a coastal plain estuary. J. Geophys. Res.: Oceans 126, e2021JC017239. doi: 10.1029/2021JC017239
Díaz J., Barrios L., Cendales M., Garzón-Ferreira J., Geister J., López-Victoria M., et al. (2000). [amp]]Aacute;reas coralinas de Colombia. Ser. Publ. Esp. Invemar 5, 176.
Diaz-Pulido G., Garzón-ferreira J. (2002). Seasonality in algal assemblages on upwelling-influenced coral reefs in the Colombian caribbean. Botanica Marina 45, 284–292. doi: 10.1515/BOT.2002.028
Dickson A. G., Sabine C. L., Christian J. R. eds. (2007). Guide to best practices for ocean CO2 measurements. PICES Special Publication (Sidney, British Columbia: North Pacific Marine Science Organization). doi: 10.25607/OBP-1342
Doney S. C., Fabry V. J., Feely R. A., Kleypas J. A. (2009a). Ocean acidification: The other CO2 problem. Ann. Rev. Mar. Sci. 1, 169–192. doi: 10.1146/annurev.marine.010908.163834
Doney S. C., Lima I., Feely R. A., Glover D. M., Lindsay K., Mahowald N., et al. (2009b). Mechanisms governing interannual variability in upper-ocean inorganic carbon system and air–sea CO2 fluxes: Physical climate and atmospheric dust. Deep Sea Res. Part II: Topical Stud. Oceanography 56, 640–655. doi: 10.1016/j.dsr2.2008.12.006
Duarte C. M., Hendriks I. E., Moore T. S., Olsen Y. S., Steckbauer A., Ramajo L., et al. (2013). Is ocean acidification an open-ocean syndrome? Understanding anthropogenic impacts on seawater pH. Estuaries Coasts 36, 221–236. doi: 10.1007/s12237-013-9594-3
Eidens C., Bayraktarov E., Hauffe T., Pizarro V., Wilke T., Wild C. (2014). Benthic primary production in an upwelling-influenced coral reef, Colombian Caribbean. PeerJ 2014, e554. doi: 10.7717/peerj.554
Emery W. J., Meincke J. (1986). Global water masses-summary and review. Oceanologica Acta 9, 383–391.
Fabry V. J., Seibel B. A., Feely R. A., Orr J. C. (2008). Impacts of ocean acidification on marine fauna and ecosystem processes. ICES J. Mar. Sci. 65, 414–432. doi: 10.1093/icesjms/fsn048
Feely R. A., Boutin J., Cosca C. E., Dandonneau Y., Etcheto J., Inoue H. Y., et al. (2002). Seasonal and interannual variability of CO2 in the equatorial Pacific. Deep Sea Res. Part II: Topical Stud. Oceanography 49, 2443–2469. doi: 10.1016/S0967-0645(02)00044-9
Feely R. A., Okazaki R. R., Cai W.-J., Bednaršek N., Alin S. R., Byrne R. H., et al. (2018). The combined effects of acidification and hypoxia on pH and aragonite saturation in the coastal waters of the California current ecosystem and the northern Gulf of Mexico. Cont Shelf Res. 152, 50–60. doi: 10.1016/j.csr.2017.11.002
Feely R. A., Sabine C. L., Hernandez-Ayon J. M., Ianson D., Hales B. (2008). Evidence for upwelling of corrosive" acidified" water onto the continental shelf. Sci. (1979) 320, 1490–1492. doi: 10.1126/science.1155676
Feely R. A., Sabine C. L., Lee K., Berelson W., Kleypas J., Fabry V. J., et al. (2004). Impact of anthropogenic CO2 on the CaCO3 system in the oceans. Sci. (1979) 305, 362–366. doi: 10.1126/science.1097329
Feely R. A., Wanninkhof R., Takahashi T., Tans P. (1999). Influence of El Niño on the equatorial Pacific contribution to atmospheric CO2 accumulation. Nature 398, 597–601. doi: 10.1038/19273
Franco A. C., Ianson D., Ross T., Hamme R. C., Monahan A. H., Christian J. R., et al. (2021). Anthropogenic and climatic contributions to observed carbon system trends in the northeast Pacific. Global Biogeochem Cycles 35, e2020GB006829. doi: 10.1029/2020GB006829
Gallego M., Timmermann A., Friedrich T., Zeebe R. E. (2018). Drivers of future seasonal cycle changes in oceanic pCO 2. Biogeosciences 15, 5315–5327. doi: 10.5194/bg-15-5315-2018
Garzón-Ferreira J., Moreno-Bonilla M., Vásquez J. M. V. (2004). Condición actual de las formaciones coralinas de acropora palmatay A. cervicornis en el Parque Nacional Natural Tayrona (Colombia). Boletin Investigaciones Marinas y Costeras 33, 117–136.
Giraldo L. (1994). Análisis de masas de agua y control de calidad de la información oceanográfica. Boletín Científico C.L O.H. 15, 17–38. doi: 10.26640/22159045.71
Gledhill D. K., Wanninkhof R., Millero F. K., Eakin M. (2008). Ocean acidification of the greater caribbean region 1996-2006. J. Geophys Res. Oceans 113, 1–11. doi: 10.1029/2007JC004629
Good S., Fiedler E., Mao C., Martin M. J., Maycock A., Reid R., et al. (2020). The current configuration of the OSTIA system for operational production of foundation sea surface temperature and ice concentration analyses. Remote Sens (Basel) 12, 720. doi: 10.3390/rs12040720
Gregor L., Gruber N. (2021). OceanSODA-ETHZ: a global gridded data set of the surface ocean carbonate system for seasonal to decadal studies of ocean acidification. Earth Syst. Sci. Data 13, 777–808. doi: 10.5194/essd-13-777-2021
Guerrero R., Piola A. R. (1997). Masas de agua en la plataforma continental. El Mar. Argentino y sus recursos pesqueros 1, 107–118.
Gutiérrez F., Dracup J. A. (2001). An analysis of the feasibility of long-range streamflow forecasting for Colombia using El Niño–Southern Oscillation indicators. J. Hydrol (Amst) 246, 181–196. doi: 10.1016/S0022-1694(01)00373-0
Hauri C., Gruber N., Vogt M., Doney S. C., Feely R. A., Lachkar Z., et al. (2013). Spatiotemporal variability and long-term trends of ocean acidification in the California Current System. Biogeosciences 10, 193–216. doi: 10.5194/bg-10-193-2013
Hernández-Ayón J. M., Chapa-Balcorta C., Delgadillo-Hinojosa F., Camacho-Ibar V. F., Huerta-Díaz M. A., Santamaría-del-Angel E., et al. (2013). Dinámica del carbono inorgánico disuelto en la región de las grandes islas del golfo de California: Influencia de las masas de agua. Cienc Mar. 39, 183–201. doi: 10.7773/cm.v39i2.2243
Hernández-Ayón J., Zirino A., Marinone S. G., Canino-Herrera R., Galindo-Bect M. S. (2003). Relacíon pH-densidad en el agua de mar. Cienc Mar. 29, 497–508. doi: 10.7773/cm.v29i4.166
Hernandez-Guerra A., Joyce T. M. (2000). Water masses and circulation in the surface layers of the Caribbean at 66°W. Geophys Res. Lett. 27, 3497–3500. doi: 10.1029/1999GL011230
Herrera-Fajardo S., Bastidas-Salamanca M., Ordóñez-Zúñiga A. (2017). ““Región 5: la guajira-tayrona,”,” in Regionalización oceanográfica: una visión dinámica del Caribe. Eds. Ricaurte-Villota C., Bastidas-Salamanca M. L. (Invemar, Santa Marta), 94–105.
Hersbach H., Bell B., Berrisford P., Biavati G., Horányi A., Muñoz Sabater J., et al. (2023). ERA5 monthly averaged data on single levels from 1940 to present [Dataset] (Copernicus Climate Change Service (C3S) Climate Data Store (CDS).
Hofmann G. E., Smith J. E., Johnson K. S., Send U., Levin L. A., Micheli F., et al. (2011). High-frequency dynamics of ocean pH: a multi-ecosystem comparison. PloS One 6, e28983. doi: 10.1371/journal.pone.0028983
Ibánhez J. S. P., Diverrès D., Araujo M., Lefèvre N. (2015). Seasonal and interannual variability of sea-air CO2 fluxes in the tropical Atlantic affected by the Amazon River plume. Global Biogeochem Cycles 29, 1640–1655. doi: 10.1002/2015GB005110
Johnson K. M., Sieburth J. M., leB Williams P. J., Brändström L. (1987). Coulometric total carbon dioxide analysis for marine studies: automation and calibration. Mar. Chem. 21 (2), 117–133.
Lan X., Mund J. W., Crotwell A. M., Crotwell M. J., Moglia E., Madronich M., et al (2024). Atmospheric carbon dioxide dry air mole fractions from the NOAA GML carbon cycle cooperative global air sampling network, 1968-2022. Version: 2023-08-28. doi: 10.15138/wkgj-f215
Lefèvre N., Mejia C., Khvorostyanov D., Beaumont L., Koffi U. (2021). Ocean circulation drives the variability of the carbon system in the eastern tropical atlantic. Oceans-switzerland 2, 126–148. doi: 10.3390/OCEANS2010008
Lefèvre N., Urbano D. F., Gallois F., Diverrès D. (2014). Impact of physical processes on the seasonal distribution of the fugacity of CO2 in the western tropical Atlantic. J. Geophys Res. Oceans 119, 646–663. doi: 10.1002/2013JC009248
Lewis E., Wallace D., Allison L. J. (1998). Program developed for CO {sub 2} system calculations (No. ORNL/CDIAC-105). Brookhaven National Lab., Dept. of Applied Science (Upton, NY (United States): Oak Ridge National Lab., Carbon Dioxide Information Analysis Center, TN (United States)).
Liu B., Tan X., Gan T. Y., Chen X., Lin K., Lu M., et al. (2020). Global atmospheric moisture transport associated with precipitation extremes: Mechanisms and climate change impacts. Wiley Interdiscip. Reviews: Water 7, e1412. doi: 10.1002/wat2.1412
Lovenduski N. S., Gruber N., Doney S. C., Lima I. D. (2007). Enhanced CO2 outgassing in the Southern Ocean from a positive phase of the Southern Annular Mode. Global Biogeochem Cycles 21, 2026. doi: 10.1029/2006GB002900
Manzello D. P., Enochs I. C., Bruckner A., Renaud P. G., Kolodziej G., Budd D. A., et al. (2014). Galápagos coral reef persistence after ENSO warming across an acidification gradient. Geophys Res. Lett. 41, 9001–9008. doi: 10.1002/2014GL062501.Received
Millero F. J. (2010). Carbonate constants for estuarine waters. Mar. Freshw. Res. 61, 139–142. doi: 10.1071/MF09254
Miloslavich P., Díaz J. M., Klein E., Alvarado J. J., Díaz C., Gobin J., et al. (2010). Marine biodiversity in the caribbean: Regional estimates and distribution patterns. PloS One 5, e11916. doi: 10.1371/journal.pone.0011916
Montoya-Sánchez R. A., Devis-Morales A., Bernal G., Poveda G. (2018). Seasonal and intraseasonal variability of active and quiescent upwelling events in the Guajira system, southern Caribbean Sea. Cont Shelf Res. 171, 97–112. doi: 10.1016/j.csr.2018.10.006
Norzagaray-López O., Ávila-López M., del C., Chapa-Balcorta C., Luis C.-A., Hernández-Ayón M. (2013). Reducida producción de CaCO3 por Porites panamensis en tres comunidades arrecifales del Pacífico mexicano Sintesis a. 437–441.
Norzagaray-López C. O., Calderon-Aguilera L. E., Hernández-Ayón J. M., Reyes-Bonilla H., Carricart-Ganivet J. P., Cabral-Tena R. A., et al. (2015). Low calcification rates and calcium carbonate production in Porites panamensis at its northernmost geographic distribution. Mar. Ecol. 36, 1244–1255. doi: 10.1111/maec.12227
Norzagaray-López C. O., Hernández-Ayón J. M., Calderon Aguilera L. E., Reyes-Bonilla H., Chapa-Balcorta C., Ayala-Bocos A. (2017). Aragonite saturation and pH variation in a fringing reef are strongly influenced by oceanic conditions. Limnol Oceanogr 62, 2375–2388. doi: 10.1002/lno.10571
Omar A. M., Thomas H., Olsen A., Becker M., Skjelvan I., Reverdin G. (2019). Trends of ocean acidification and pCO2 in the northern North Sea, 2003–2015. J. Geophys. Res.: Biogeosci. 124 (10), 3088–3103.
Orr J. C., Epitalon J.-M., Dickson A. G., Gattuso J.-P. (2018). Routine uncertainty propagation for the marine carbon dioxide system. Mar. Chem. 207, 84–107. doi: 10.1016/j.marchem.2018.10.006
Orr J. C., Fabry V. J., Aumont O., Bopp L., Doney S. C., Feely R. A., et al. (2005). Anthropogenic ocean acidification over the twenty-first century and its impact on calcifying organisms. Nature 437, 681–686. doi: 10.1038/nature04095
Parard G., Lefèvre N., Boutin J. (2010). Sea water fugacity of CO2 at the PIRATA mooring at 6 S, 10 W. Tellus B: Chem. Phys. Meteorology 62, 636–648. doi: 10.1111/j.1600-0889.2010.00503.x
Poveda G., Mesa Ó.J. (1996). Las fases extremas del fenómeno ENSO (El Niño y La Niña) y su influencia sobre la hidrología de Colombia. Tecnología y Cienc. del agua 11, 21–37.
Poveda G., Mesa O. J. (1997). Feedbacks between hydrological processes in tropical South America and large-scale ocean–atmospheric phenomena. J. Clim 10, 2690–2702. doi: 10.1175/1520-0442(1997)010<2690:FBHPIT>2.0.CO;2
Pujos M., Pagliardini J.-L., Steer R., Vernette G., Oliver W. (1986). Influencia de la contracorriente norte Colombiana para la circulación de las aguas en la plataforma continental su acción sobre la dispersión de los efluentes en suspensión del Río Magdalena. Boletín científico CIOH 6, 3–15. doi: 10.26640/01200542.6.3_15
Restrepo J. D., Kjerfve B. (2000). Magdalena river: interannual variability (1975–1995) and revised water discharge and sediment load estimates. J. Hydrol. (Amst.) 235, 137–149. doi: 10.1016/S0022-1694(00)00269-9
Restrepo J. D., Zapata P., Díaz J. M., Garzón-Ferreira J., García C. B. (2006). Fluvial fluxes into the Caribbean Sea and their impact on coastal ecosystems: The Magdalena River, Related papers. Glob Planet Change 50, 33–49. doi: 10.1016/j.gloplacha.2005.09.002
Rheuban J. E., Doney S. C., McCorkle D. C., Jakuba R. W. (2019). Quantifying the effects of nutrient enrichment and freshwater mixing on coastal ocean acidification. J. Geophys Res. Oceans 124, 9085–9100. doi: 10.1029/2019JC015556
Ricaurte-Villota C., Bastidas-Salamanca M., Caicedo Carrascal F. M., Arbeláez Salazar J. D. (2018). Estudio integral de la Ciénaga Grande de Santa Marta -Fase II(B): modelaciones hidráulica, hidrosedimentológica y biogeoquímica. Instituto de Investigaciones Marinas y Costeras “José Benito Vives de Andreis” - INVEMAR & Corporación Autónoma Regional del Magdalena - CORPAMAG. 72 p.
Romero-Rodríguez D. A., Peña-Mejía C., Ordóñez-Zuñiga A., Ricaurte-Villota C., Bastidas-Salamanca M. L. (2017). ““Región 6: Ciénaga Grande de Santa Marta, río Magdalena, Bolívar,”,” in Regionalización oceanográfica: una visión dinámica del Caribe. Eds. Ricaurte-Villota C., Bastidas-Salamanca M. L. (Instituto de Investigaciones Marinas y Costeras José Benito Vives De Andréis (INVEMAR, Santa Marta), 106–123.
Rueda-Roa D. T., Muller-Karger F. E. (2013). The southern Caribbean upwelling system: Sea surface temperature, wind forcing and chlorophyll concentration patterns. Deep Sea Res. 1 Oceanogr Res. Pap 78, 102–114. doi: 10.1016/j.dsr.2013.04.008
Sabine C. L., Feely R. A. (2007). The oceanic sink for carbon dioxide. Chapter 3 In Greenhouse Gas Sinks, Reay D., Hewitt N., Grace J., Smith K. (eds.), (Oxfordshire, UK: CABI Publishing), 31–49.
Salisbury J., Vandemark D., Hunt C., Campbell J., Jonsson B., Mahadevan A., et al. (2009). Episodic riverine influence on surface DIC in the coastal Gulf of Maine. Estuar. Coast. Shelf Sci. 82, 108–118. doi: 10.1016/j.ecss.2008.12.021
Salzwedel H., Müller K. (1983). A summary of meteorological and hydrological data from the bay of Santa Marta, Colombian Caribbean. Anales Instituto Investigación Marina Punta Betín 13, 67–83.
Sánchez-Noguera C., Stuhldreier I., Cortés J., Jiménez C., Morales Á., Wild C., et al. (2018). Natural ocean acidification at Papagayo upwelling system (north Pacific Costa Rica): Implications for reef development. Biogeosciences 15, 2349–2360. doi: 10.5194/bg-15-2349-2018
Sarmiento-Devia R. A., López-Escobar Á.V., Mejías M. B., Dávila P. M., Franco-Herrera A. (2013). Intra-annual variation of climate regime on upwelling zones in the Southeast Caribbean Sea. Rev. Biol. Mar. Oceanogr 48, 471–485. doi: 10.4067/s0718-19572013000300006
Silverman J., Lazar B., Cao L., Caldeira K., Erez J. (2009). Coral reefs may start dissolving when atmospheric CO2 doubles. Geophys Res. Lett. 36, 1–5. doi: 10.1029/2008GL036282
Takahashi T., Sutherland S. C., Chipman D. W., Goddard J. G., Ho C. (2014). Climatological distributions of pH, pCO2, total CO2, alkalinity, and CaCO3 saturation in the global surface ocean, and temporal changes at selected locations. Mar. Chem. 164, 95–125. doi: 10.1016/j.marchem.2014.06.004
Takahashi T., Sutherland S. C., Sweeney C., Poisson A., Metzl N., Tilbrook B., et al. (2002). Global sea–air CO2 flux based on climatological surface ocean pCO2, and seasonal biological and temperature effects. Deep Sea Res. Part II: Topical Stud. Oceanography 49, 1601–1622. doi: 10.1016/S0967-0645(02)00003-6
Takahashi T., Sutherland S. C., Wanninkhof R., Sweeney C., Feely R. A., Chipman D. W., et al. (2009). Climatological mean and decadal change in surface ocean pCO2, and net sea-air CO2 flux over the global oceans. Deep Sea Res. 2 Top. Stud. Oceanogr 56, 554–577. doi: 10.1016/j.dsr2.2008.12.009
Tigreros P. C. (2013). La dinámica del co2 en el Caribe centro-norte Colombiano y su efecto sobre la comunidad fitoplanctónica (Colombia: Fundación Universidad de Bogotá Jorge Tadeo Lozano).
Tomczak M. (1999). Some historical, theoretical and applied aspects of quantitative water mass analysis. J. Mar. Res. 57, 275–303. doi: 10.1357/002224099321618227
Trenberth K. E. (1998). Atmospheric moisture residence times and cycling: Implications for rainfall rates and climate change. Clim Change 39, 667–694. doi: 10.1023/A:1005319109110
Turi G., Lachkar Z., Gruber N., Münnich M. (2016). Climatic modulation of recent trends in ocean acidification in the California Current System. Environ. Res. Lett. 11, 014007. doi: 10.1088/1748-9326/11/1/014007
Valerio A. M., Kampel M., Ward N. D., Sawakuchi H. O., Cunha A. C., Richey J. E. (2021). CO2 partial pressure and fluxes in the Amazon River plume using in situ and remote sensing data. Cont Shelf Res. 215, 104348. doi: 10.1016/j.csr.2021.104348
Waldbusser G. G., Hales B., Haley B. A. (2016). Calcium carbonate saturation state: on myths and this or that stories. ICES J. Mar. Sci. 73, 563–568. doi: 10.1093/icesjms/fsv174
Waldbusser G. G., Salisbury J. E. (2014). Ocean acidification in the coastal zone from an organism’s perspective: Multiple system parameters, frequency domains, and habitats. Ann. Rev. Mar. Sci. 6, 221–247. doi: 10.1146/annurev-marine-121211-172238
Wang D., Gouhier T. C., Menge B. A., Ganguly A. R. (2015). Intensification and spatial homogenization of coastal upwelling under climate change. Nature 518, 390–394. doi: 10.1038/nature14235
Wang G., Schimel D. (2003). Climate change, climate modes, and climate impacts. Annu. Rev. Environ. Resour 28, 1–28. doi: 10.1146/annurev.energy.28.050302.105444
Wanninkhof R. (1992). Relationship between wind speed and gas exchange over the ocean. J. Geophys Res. Oceans 97, 7373–7382. doi: 10.1029/92JC00188
Wanninkhof R. (2014). Relationship between wind speed and gas exchange over the ocean revisited. Limnol Oceanogr Methods 12, 351–362. doi: 10.4319/lom.2014.12.351
Wanninkhof R., Pierrot D., Sullivan K., Barbero L., Triñanes J. (2020). A 17-year dataset of surface water fugacity of CO2 along with calculated pH, aragonite saturation state and air–sea CO2 fluxes in the northern Caribbean Sea. Earth Syst. Sci. Data 12, 1489–1509. doi: 10.5194/ESSD-12-1489-2020
Weiss R. (1974). Carbon dioxide in water and seawater: the solubility of a non-ideal gas. Mar. Chem. 2, 203–215. doi: 10.1016/0304-4203(74)90015-2
Woosley R. J., Millero F. J., Wanninkhof R. (2016). Rapid anthropogenic changes in CO2 and pH in the Atlantic Ocean: 2003–2014. Global Biogeochem Cycles 30, 70–90. doi: 10.1002/2015GB005248.Received
Wright-Fairbanks E. K., Saba G. K. (2022). Quantification of the dominant drivers of acidification in the coastal mid-atlantic bight. J. Geophys Res. Oceans 127, e2022JC018833. doi: 10.1029/2022JC018833
Keywords: ocean acidification, upwelling, tropical oceans, coral reef areas, Caribbean surface water, subtropical subsurface water, riverine input, ENSO
Citation: Ricaurte-Villota C, Murcia-Riaño M and Hernádez-Ayón JM (2025) Dynamics and drivers of the carbonate system: response to terrestrial runoff and upwelling along the Northeastern Colombian Caribbean coast. Front. Mar. Sci. 11:1305542. doi: 10.3389/fmars.2024.1305542
Received: 02 October 2023; Accepted: 23 December 2024;
Published: 30 January 2025.
Edited by:
Laura Lorenzoni, National Aeronautics and Space Administration (NASA), United StatesReviewed by:
Gerardo Toro-Farmer, New College of Florida, United StatesCopyright © 2025 Ricaurte-Villota, Murcia-Riaño and Hernádez-Ayón. This is an open-access article distributed under the terms of the Creative Commons Attribution License (CC BY). The use, distribution or reproduction in other forums is permitted, provided the original author(s) and the copyright owner(s) are credited and that the original publication in this journal is cited, in accordance with accepted academic practice. No use, distribution or reproduction is permitted which does not comply with these terms.
*Correspondence: Constanza Ricaurte-Villota, Y29uc3RhbnphLnJpY2F1cnRlQGludmVtYXIub3JnLmNv
†ORCID: Constanza Ricaurte-Villota, orcid.org/0000-0003-1554-4994
Magnolia Murcia-Riaño, orcid.org/0000-0001-9076-5696
José Martín Hernádez-Ayón, orcid.org/0000-0001-6869-6225
Disclaimer: All claims expressed in this article are solely those of the authors and do not necessarily represent those of their affiliated organizations, or those of the publisher, the editors and the reviewers. Any product that may be evaluated in this article or claim that may be made by its manufacturer is not guaranteed or endorsed by the publisher.
Research integrity at Frontiers
Learn more about the work of our research integrity team to safeguard the quality of each article we publish.