 Ferenc Jordán
 Greta Capelli
 Raul Primicerio
 Antonio Bodini
- 1Department of Chemistry, Life Sciences and Environmental Sustainability, University of Parma, Parma, Italy
- 2KeyNode Research Ltd, Budapest, Hungary
- 3Department of Arctic and Marine Biology, The Arctic University of Norway, Tromsø University, Tromsø, Norway
Introduction: Increasing temperature of the global ocean alters the spatial behavior of a number of species. From the northern Atlantic Ocean, species may shift their area towards the poles. This results in the atlantification of the Barents Sea, raising questions about possible changes in species composition, community structure and community control.
Methods: We address the question whether possible changes in community control can be detected and quantified based on simple network analytical measures applied to the food web. Based on unweighted (binary) and undirected (symmetric) data, we quantify the strength of direct and indirect interactions in the network, represent the most asymmetric effects in the asymmetry graph composed of directed and weighted links and study the overlap among trophic niches of organisms.
Results and discussion: We support earlier findings suggesting that the ecosystem can possibly be characterized by wasp-waist control. This would mean that focusing management efforts on intermediate trophic levels is of high importance, providing indirect benefit for organisms also at lower and higher trophic levels.
1 Introduction
Organisms influence each other in ecological communities by strong and weak, direct and indirect, positive and negative, bottom-up and top-down as well as trophic and non-trophic effects. Complex behavior is a result of the multiplicity of these parallel, combined and overlapping effects, among others (e.g. the number of species, spatial heterogeneity, niche dimensionality). It is quite challenging to make predictions at this level of complexity, despite of massive progress in ecological modelling and related supporting bioinformatic techniques (Karsenti et al., 2011). Yet, testable predictions are essential for scientific understanding and management. Research towards simplifying and handling complexity is, thus, important if over-simplifications are avoided and predictability can be increased (Odenbaugh, 2006).
Network analysis is widely used and increasingly available tool in modelling various types of inter-connected ecological systems (Fath et al., 2007; Jordán, 2022). Most of the current methods focus on graph nodes in various contexts, including research on network modules (Gjata et al., 2012), diversity of functional groups (Lin et al., 2022), central nodes (Estrada, 2007), keystone species (Jordán, 2009), functional organization (Xu et al., 2023) but also the distribution of traits in various network positions (Endrédi et al., 2021). Other approaches focus more on interactions and the roles they play in community control. These include research on cycling (Finn, 1976), the analysis of distribution and variability of interaction strength (e.g. bimodal: Sala and Graham, 2002), the dominator tree structure of food webs (Allesina and Bodini, 2004; Allesina et al., 2006), the distinction between functional and redundant links (Allesina et al., 2006; Bondavalli and Bodini, 2014), quantifying direct and indirect control (Ulanowicz and Puccia, 1990), detecting long indirect interaction chain effects (Estes et al., 1998) and applying process-based modelling tools (Livi et al., 2011). It is clear that important nodes and crucial links cannot really be separated, so most approaches consider them equally, including Ecopath with Ecosim (Christensen and Walters, 2004), ATLANTIS (Audzijonyte et al., 2019) and OSMOSE (Shin and Cury, 1999). We use and develop our earlier approach that simplifies complexity by predicting critically important, predictable interactions, based on their topology-based asymmetry (Jordán et al., 2014). While quantifying and detecting either key nodes or key interactions is useful simplification, the price is loss of information and details.
For better understanding community dynamics, at a larger scale, one needs to know the dominant control regime in the system. Bottom-up control means the prevalence of dynamical regulation by resource availability, while top-down control implies the prevalence of regulative action by the consumers. The pattern of the two regimes is of particular interest (Hairston et al., 1960; Oksanen et al., 1981; Hunter and Price, 1992). Thus, one critically important property of an inter-specific interaction is its orientation from the viewpoint of trophic flows. Trophic interactions can be oriented in either bottom-up or top-down directions, while indirect interaction chains can be of mixed orientation. For example, a trophic cascade is composed of two top-down interactions (Ripple et al., 2016), while apparent competition is composed of one bottom-up and one top-down interactions (Holt and Bonsall, 2017). In particular ecosystems, either bottom-up or top-down effects may dominate, defining a control regime. In the case of wasp-waist control, the dominant controlling organisms exert both bottom-up and top-down effects on the food web. This mechanism is probably most typical in pelagic upwelling ecosystems, where a few species occupy the wasp-waist position (e.g. sardine, anchovy, jellyfish), exerting mixed-control (Cury et al., 2000), partly as a consequence of food web topology (Jordán et al., 2005). This regime has already been suggested also for the North Sea food web (Fauchald et al., 2011).
We suggest a novel approach to determining the dominant control regime, based on network analysis. Focusing on the most asymmetric relationships might be a way to reduce and manage complexity, by focusing on a few, quantitatively determined critical links in the interaction network (see a similar approach in Taruttis et al., 2015). In symmetric or only weakly asymmetric interactions between a pair of species i and j, effects can propagate in both directions, both from species i to species j and from species j to species i. This means that clearly identifying causes and effects in a large and complex network is not easy. However, strong asymmetry from i to j means that we expect flows mostly (if not excusively) only in one direction. Whether a „cause” in i will inevitably lead to an „effect” in j is not automatic, so in this sense „causality” is not guaranteed; it only helps interpretation. Yet, the flow of effects in these asymmetric interactions might be easier to predict, thus, the asymmetry graph may depict a subsystem with slightly more predictive food web models. For the majority of symmetric or only slightly asymmetric interactions, trophic effects propagate in every direction: indirect chain effects are less predictable. Understanding the structure to dynamics relationship is generally a notoriously difficult task (Endrédi et al., 2018) but there might be parts of the food web where topology correlates better with dynamics.
In the Barents Sea, human impact (mostly fisheries) is clearly unavoidable and increasingly important in ecosystem dynamics. This means that the future of this ecosystem depends to a large extent on wise decision-making based on simple and clear scientific support. In order to manage complexity, at least at the level of communication, strong simplifications are needed. One way to go is to quantitatively identify key elements (system components) governing ecosystem dynamics, with the hope that understanding and managing these key elements will have predictable and desirable effects. Earlier research on the Barents Sea food web focused on a number of key network properties, including node degree, connectance, clustering, modules and connectors (Kortsch et al., 2019). For quantifying the strength of indirect interactions among organisms, network analysis offers methods also beyond simply considering the number of neighbors (i.e. direct interactors, node degree). There is an increasing literature of key nodes in food webs (Jordán, 2009), here we focus on key interactions. These can be important because of their topological positions (Allesina and Bodini, 2004) or strength (Gjata et al., 2012). Also, we suggest that interactions of high asymmetric effects between species i and j can be critically important for predictability of single-species disturbances on community dynamics. While multiple direct and indirect effects may propagate between species i and j in complex food webs (in both directions), if the topological relationship between these species is highly asymmetric, identifying the cause (the species affecting the other) and the effect (the affected species) can be more predictable. Possibly neither these species nor the interaction(s) between them are of extreme importance, but at least this interaction can be highly predictable. Thus, these can be useful for establishing and communicating simple messages about complex systems.
Making fisheries sustainable would imply the protection of their resource base, avoiding an excess exploitation. This is a complex problem difficult to handle for policy-makers (ICES, 2022), mostly because of contrasting interests, and especially in a multi-species framework (e.g. MSY assessment, May et al., 1979). A contribution to this end may come from the understanding of the role species play as controlling factors. To this end, identifying critically important interactions and control regimes are of highest importance.
In this paper, we focus on the Barents Sea food web with the aim to quantify the strength and asymmetry of trophic effects, based on the topology of the food web. We determine the most asymmetric interactions composing the „asymmetry graphs”. We discuss the consequences of reciprocity in asymmetric interactions, we explain how it is related to predictability and the dominant control regime and we provide ecological interpretation in the context of the Barents Sea. The final aim is to support better understanding of the atlantification process and the effects of multiple drivers of change.
2 Methods
2.1 Study area
The Barents Sea is a highly productive shelf area of the Arctic Ocean, having two major zones, an arctic and a boreal one (see Pecuchet et al., 2020a). It sustains the fisheries of 12 nations although Norway and Russia have the greatest share of the resources. Fishing activity targets several species, being the capelin (Mallotus villosus) the largest pelagic fish population in this ecosystem. Also marine mammals such as seals and whales are targets of fisheries. Currently, the Barents sea ecosystem faces major challenges, including overfishing, invasion by alien organisms and the effects of climate change (Pedersen et al., 2021). Warming is twice as fast as the global average and invasion intensity is five times more than the global average (Fossheim et al., 2015). The atlantification of the local fauna, for example, manifest in changing species composition coupled with re-arrangement of inter-specific interactions (Fossheim et al., 2015; Pecuchet et al., 2020a; 2020b), with a transition zone between Atlantic and Arctic waters East of Greenland (Emblemswag, 2022). Changes in species composition and altered interactions may finally lead to switching the control regime. Thus, several local effects may sum up to different system-level properties.
2.2 Trophic data and network construction
Trophic data were described based on stomach content analyses of samples got from bottom trawl surveys (Pecuchet et al., 2020a; 2022b; Kortsch et al., 2019). The meta-network for the whole ecosystem, composed by all available data, contained N=238 nodes. We analyzed an aggregated version of N=21 nodes in which we collapsed the original 238 trophic components. Original nodes were assigned to these 21 functional groups as shown in Supplementary Material A. In this, lower-resolution, parsimonious version of the food web, graph nodes are functional groups typically containing several species (occasionally only a single one, e.g. CAP: capelin). Aggregation was based mostly on trophic similarity (e.g. PELF: pelagic planktivorous fish), with conservation (e.g. RED: redfish) and economic (HER: herring) viewpoints that we also considered. Table 1 lists all the 21 functional groups. Food web links are based on statistical co-occurrence in the samples, enabled by traditional ecological knowledge and literature data.
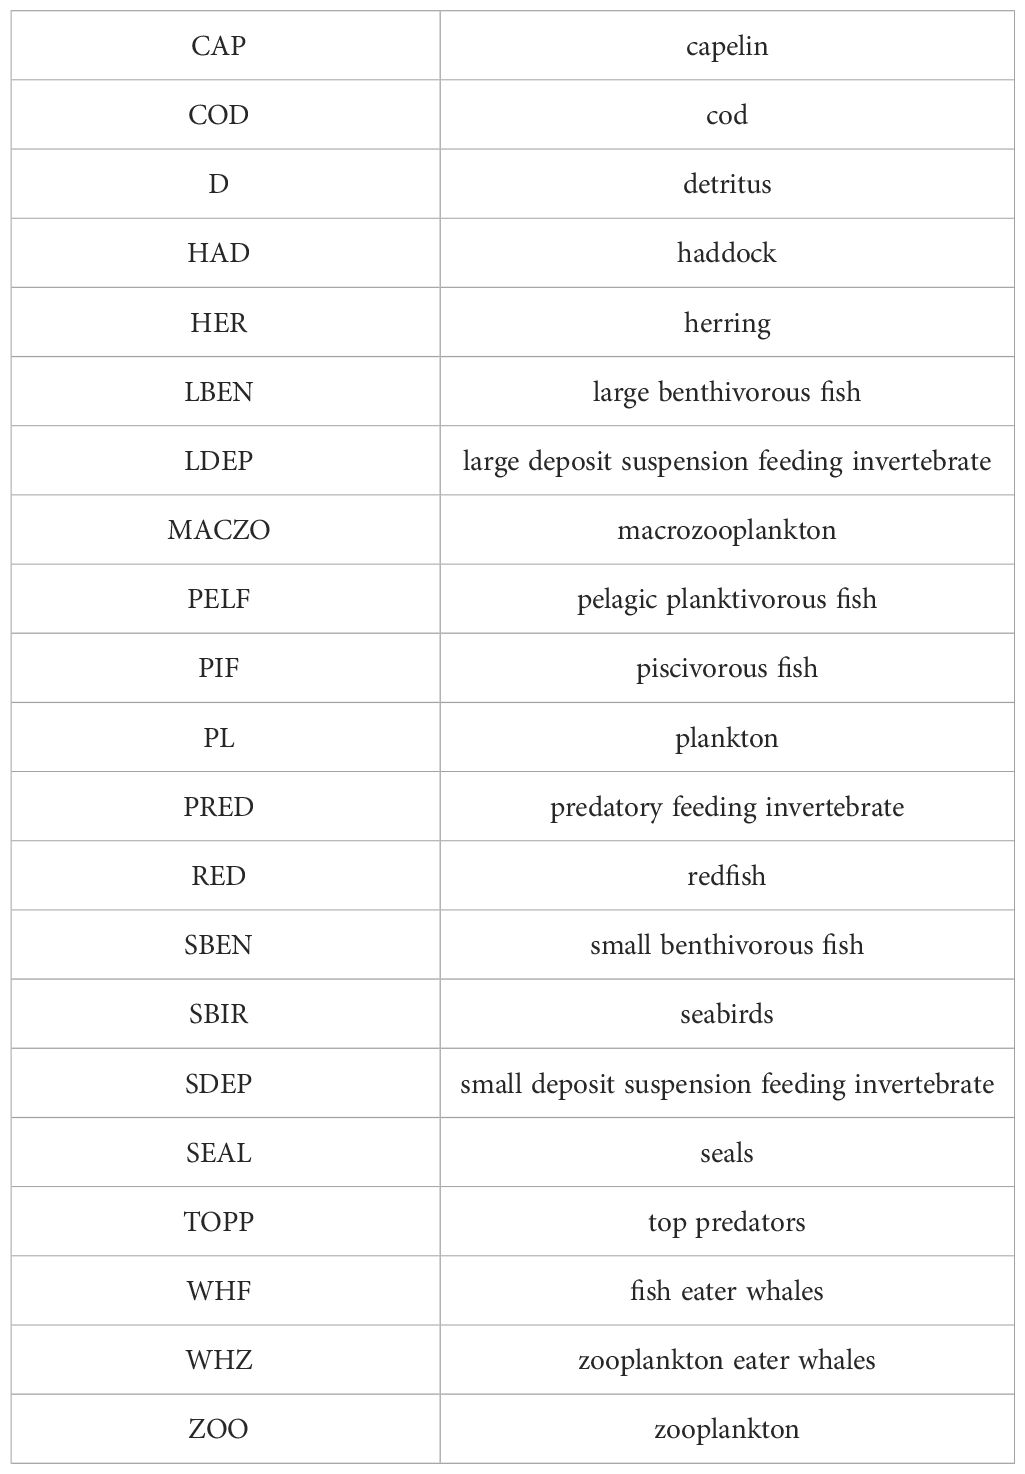
Table 1 The codes for the network nodes (functional groups).
2.3 Network analysis
In food webs, trophic links can be understood as either material transfers (with purely bottom-up effects) or reciprocal trophic effects between a pair of interacting populations (with one negative top-down and one positive bottom-up effects). In the latter sense, a web of interacting populations can be considered an undirected network, as control effects propagate in both directions. In any case, only the direct interactions are shown and indirect chain effects emerge as consequences of two or more direct links.
2.3.1 Interaction strength and centrality
Since strong indirect effects can appear in community dynamics, the number of direct partners offers only a limited view on network position (D: degree, the number of neighbors, connected by direct interactions). Indirect chain effects (Wootton and Emmerson, 2005) can be mapped and quantified in the network (see also Ulanowicz and Puccia, 1990). Based on an earlier approach focusing on apparent competition (Müller et al., 1999), calculating the strength and asymmetry of indirect effects was generalized (topological importance, TI, Jordán et al., 2003) for longer indirect chains (up to n steps). The binary (unweighted) version of the topological importance index measures the non-local (indirect up to n steps) position of species and uses undirected data. It provides complementary information to local scale (i.e., degree) and whole system approaches (i.e., closeness and betweenness). Topological importance was originally derived from the analysis of two-step long, horizontal, apparent competition interactions in host-parasitoid networks (Müller et al., 1999). When the species j can be reached from i in m steps, the effect is rm,ij. In case of a direct effect (m = 1), topological importance is expressed as the inverse of degree (TIm,ij = 1/Dj). Indirect effects are multiplicative and additive. In case of 2-step pathways (m = 2), if species j can be affected by i through two pathways that cross species k (i → k → j) and h (i → h → j), then the effect of each pathway is measured as the product of the direct effects (i.e., TI1,ik · TI1,kj and TI1,ih · TI1,hj; multiplicative property). The total effect of i on j is obtained by summing up the contribution of the two pathways passing through k and h in m steps: TI2,ij = TI1,ik · TI1,kj + TI1,ih · TI1,hj (additive principle). When all pathways are quantified up to m steps (each TIm,ij is known), one can quantify (1) the strength of interaction between a pair of nodes i and j, (2) the asymmetry of the interaction between the node pairs (see below) and (3) the sum of interactions for each node, providing a measurement of node centrality (as a function of m). This latter is called TIi, i.e. the topological importance of node i (Jordán et al., 2003; Jordán, 2009). It is noted that the same calculations can be performed for weighted networks (weighted importance, WI). Based on earlier research, indirect chain effects of 2 and 3 steps seem to be most relevant, both empirically and theoretically (see Brose et al., 2005), so we used m=3.
2.3.2 Interaction asymmetry and causality
In the TI matrix containing values of m-step-long mixed effects, asymmetry is quite typical between TIij and TIji values (unlike in the food web matrix, where consumer-resource effects most typically go in only one direction). This asymmetry is defined as
Applying a threshold value for A (c), we define the asymmetry graph as the subset of nodes and the most asymmetric effects between them such that
Theoretically, this threshold can be either a constant or a variable; if it is a constant, it could be determined empirically (for a similar approach, see Taruttis et al., 2015). However, values of TI, and thus of A, depend on N (network size), so it is better to define them as a function of the actual TI-matrix. We defined the c threshold as c = 2/3*Amax = 0.1 (Amax = 0.15) but we explored also several other threshold values to study the sensitivity of the results. At c = 0.1, the asymmetry graph contains 8 highly asymmetric interactions out of (21*20)/2 = 210 un-ordered pairs of nodes (3.8%). Earlier we considered the most asymmetric 5% of simulated effects, with Amax = 0.13, N = 48 and 56 effects in the asymmetry graph (Jordán et al., 2014). While these c values seem to be appropriate for finding meaningful patterns (not too few and not too many highly asymmetric links), others can still be informative (see Supplementary Materials C, D).
Applying a particular threshold level, the asymmetry graph can be obtained, containing the most asymmetric effects (direct and indirect, bottom-up and top-down). These interactions are probably important and predictable, while the nodes of the asymmetry graph form a core of the community that is likely to be important for control. The ratio of bottom-up effects in the asymmetry graph quantifies the dominant control regime from this simple topological perspective. Experimental results could best validate this approach and mesocosm experiments are in preparation (beyond the scope of the present theoretical exercise).
We emphasize that the topology of an originally undirected (since we are interested in trophic control regimes, we consider undirected effects, otherwise no top-down effects can be defined) and unweighted (the database has no information on the magnitude of trophic flows) network defines directed and weighted measures for both interaction strength and asymmetry.
2.3.3 Trophic niche overlap
To understand whether species with strongly asymmetric effects have overlapping roles and functions (Cirtwill et al., 2018), it may be of interest to see the similarity of their network positions. For quantifying the similarity of network positions, we used the measure of regular equivalence (REGE, Everett and Borgatti, 1991), used already in ecological research (Luczkovich et al., 2003; Endrédi et al., 2018). This measure quantifies the similarity between the positions of network nodes i and j based on their network neighborhood, providing information about functional redundancy and niche diversity. The two kinds of indirect competition (exploitative and apparent) are explicitly used for calculating REGE. We used the UCINET software and studied the dendrograms (Borgatti et al., 2002). Two nodes are said to be regular equivalent if they are connected with the same types of nodes. In ecology terms, two species are more regularly equivalent if they have similar (but not necessarily the same) predators and preys: for example, two canopy-living insects feeding on leaves and consumed by birds. A REGE matrix S is the output of such an analysis, where the ijth element, Sij, expresses the extent of similarity between nodes i and j. Based on an output dendrogram, we can apply cutoff levels in order to compare the number of branches for different networks. This is a measure of functional diversity (the number of functional groups), while the number of graph nodes in a branch quantifies redundancy within a group. If a single species constitutes a branch at a given cutoff level, it may be considered a keystone species (sensu Bond, 1994).
3 Results
3.1 Centrality
Based on the original trophic matrix (Supplementary Material B), we built up the associated food web (Figure 1A). The TI3-matrix (Supplementary Material B) shows the strength of mixed and indirect interactions up to 3 steps and the corresponding network is shown in Figure 1B In the TI-matrix, only 4 values are zero, out of 21*21 = 441 effects (considering direction and self-loops). These are from zooplankton eater whales to large benthivorous fish, from large benthivorous fish to top predators, from large benthivorous fish to zooplankton eater whales and from large benthivorous fish to small benthivorous fish. This means that zooplankton eater whales and large benthivorous fish is the only pair of nodes that are independent of each other if indirect effects are not considered beyond three steps.
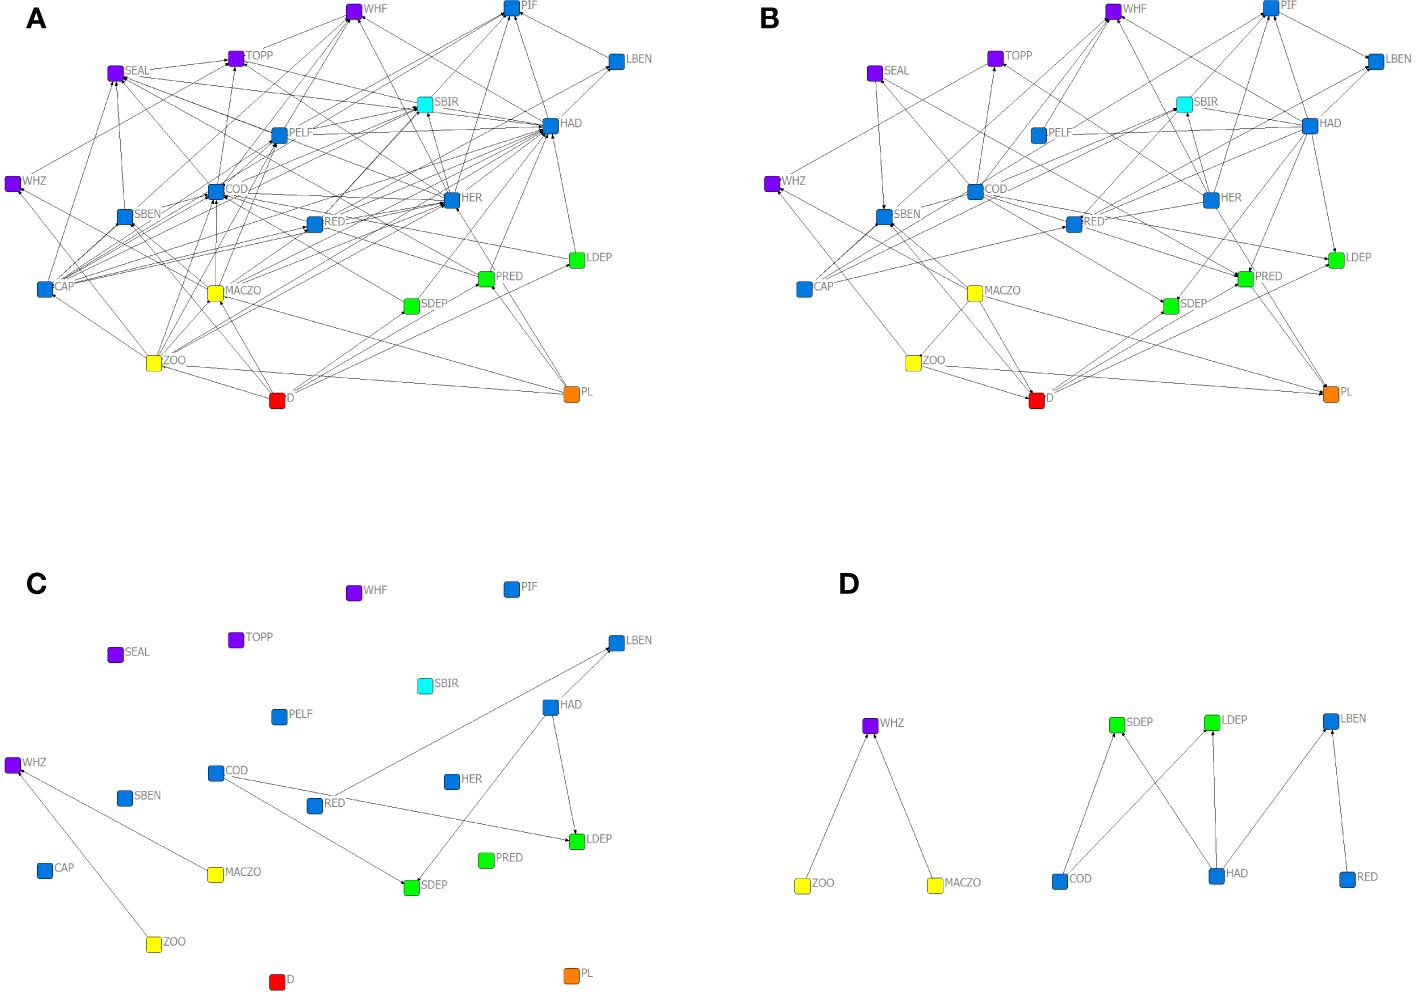
Figure 1 Interaction networks for the Barents Sea ecosystem: the food web (A), the network of topological interactions based on TI (B), the asymmetry graph at c = 0,1 (C) and the latter re-arranged for better visualization (D).
Based on the topological importance (TI3) index, the most central functional groups are shown in Table 2. The three mostly connected, key organisms are haddock, cod and herring, while the least central ones are large deposit suspension feeding invertebrates (LDEP), small deposit suspension feeding invertebrates (SDEP), zooplankton eater whales and large benthivorous fish. These are the strongest and weakest interactors in the system, respectively. Earlier studies showed that according to local, direct measures (i.e. D degree, the number of neighbors), the key players are cod, haddock and redfish in the boreal, while detritus, plankton, Boreogadus saida (assigned to pelagic planktivorous fish) and Pandalus borealis (assigned to predatory feeding invertebrates) in the arctic waters (Kortsch et al., 2019).
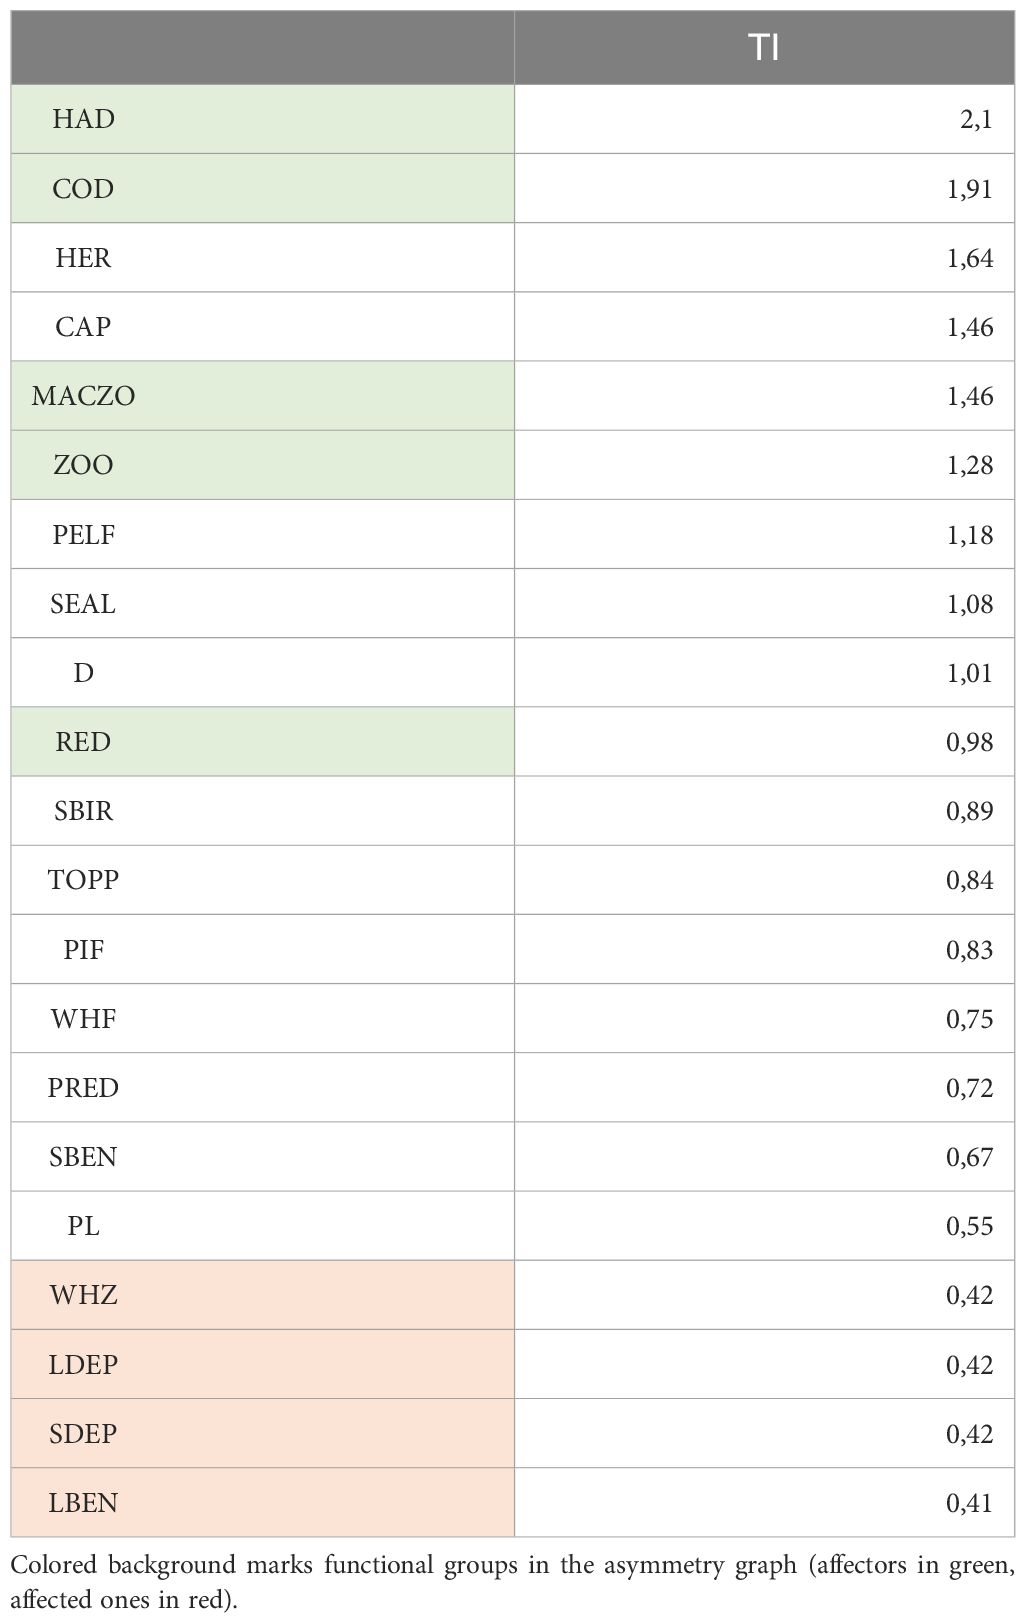
Table 2 The TI-rank for all functional groups in the Barents Sea food web.
3.2 Causality
Based on the asymmetry matrix (Supplementary Material B) at the c = 0,1 threshold level, the asymmetry graph is shown in Figure 1C (the list of links is given in Table 3, according to all A ≥ c). Here, nodes are arranged in the layout as in Figures 1A, B but Figure 1D shows a more intuitive layout for the asymmetry graph, clearly showing the affectors and the affected organisms in these mostly asymmetric relationships. Here, the spatial layout of the nodes does not follow that in the original food web; instead, affectors and affected are grouped at two different levels. The asymmetry graph contains 8 links at this threshold level (Figure 1D). These are from haddock to large benthivorous fish (A = 0,15), from haddock to LDEP, from haddock to SDEP, from cod to LDEP and from cod to SDEP (A = 0,13), macrozooplankton to zooplankton eater whales and from zooplankton to zooplankton eater whales (A = 0,11) and from redfish to large benthivorous fish (0,1). These 8 most asymmetric interactions link 5 affectors (haddock, cod, macrozooplankton, zooplankton, redfish) and 4 affected (large benthivorous fish, LDEP, SDEP, zooplankton eater whales) functional groups. These are close to the top and at the bottom of the TI-rank (respectively, see Table 2), the affectors being the most central and the affected nodes being the least central nodes in the food web. This pattern corresponds to wasp-waist community control in a structural sense.
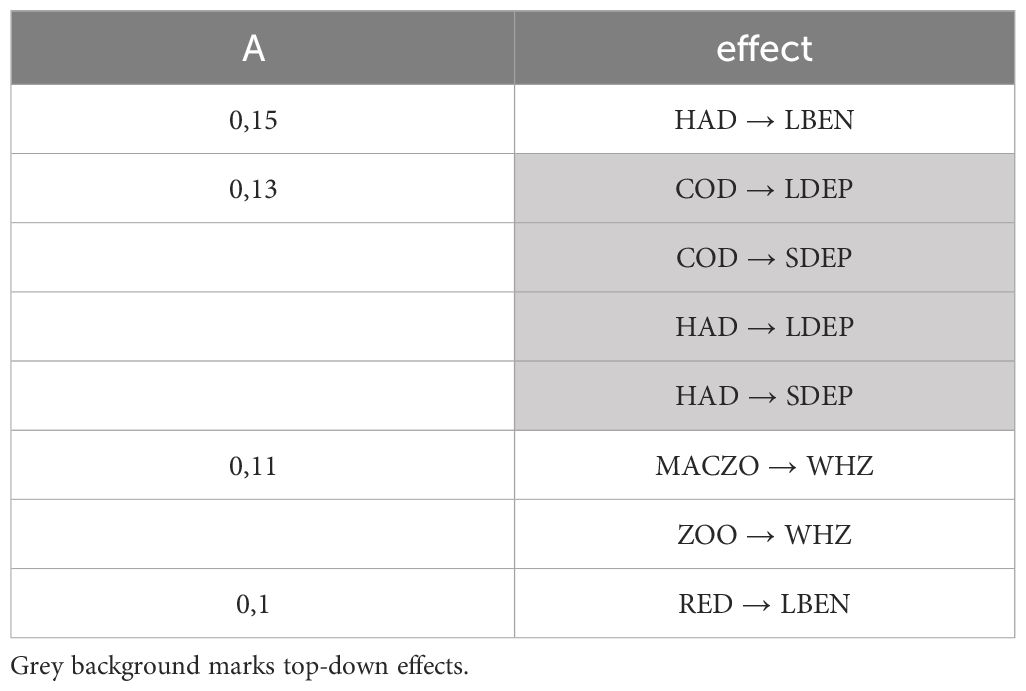
Table 3 The list of the 8 links in the asymmetry graph at c = 0.1.
Contrary to earlier results (Jordán et al., 2014), where the most asymmetric effect was an indirect one, all of the effects documented here are mixed (direct and indirect) interactions and there is no strong asymmetry between organisms that are only indirectly influencing each other.
Gradually decreasing the threshold level would add weaker and weaker links to the asymmetry graph, as shown in Supplementary Material C. Here, we also show the asymmetry graphs for c = 0,05 with 36 links (Supplementary Material D). This shows that results clearly depend on the value of the c threshold. The original purpose was to simplify network complexity to a level that can make communication clearer. The set of the most asymmetric effects should contain neither a single interaction nor a complex network of effects. Here, more information is shown but the original complexity of the food web is not reduced significantly.
3.3 Trophic niche overlap
The five affectors of the asymmetry graph are quite dispersed in the REGE dendrograms (Figure 2), haddock, cod and redfish (the invasive boreal species) having overlapping roles but zooplankton and macrozooplankton being isolated. The most unique organisms have the longest non-branching segments in the dendrogram, these are zooplankton eater whales, capelin and herring: their trophic roles are the least replaceable, these are key organisms in this sense. Considering the functional groups mostly sensitive to trawlers (LDEP, piscivorous fish), their strong perturbation can be partly compensated by other groups with high functional overlap (SDEP and top predators, respectively).
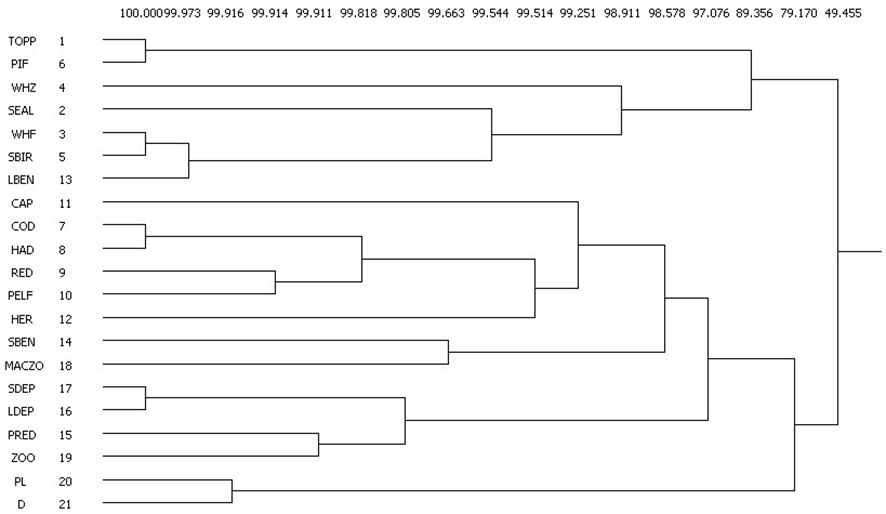
Figure 2 The REGE-based dendrogram showing the dissimilarities between the positions of organisms in the food web. For example, SDEP and LDEP are in very similar positions, while the positions of SDEP and WHF are quite different (values refer to similarity scores).
4 Discussion and conclusions
Our analysis is based on identifying the most asymmetric topological relationships in predator-prey interactions. This has been already explored also for plant-pollinator (Jordano, 1987) and host-parasite (Lafferty et al., 2006) interactions. We quantified asymmetry based purely on topology (unequal positions in the network) but it is noted that the approach presented here can be applied also for weighted interaction networks. Our results and conclusions are thus based on a modelling approach, based on solid field studies.
The asymmetry graph is composed of 4 top-down and 4 bottom-up effects, all originated from organisms at intermediate trophic levels. This might support earlier findings about the possibility of mixed, wasp-waist control (Cury et al., 2000) of haddock in this ecosystem (Fauchald et al., 2011). Wasp-waist control becomes more likely also with increasing biomass of krill and jellyfish (Pedersen et al., 2021) and the poleward shift of generalist species (Kortsch et al., 2015; Emblemswag, 2022).
Invasive fish species of Atlantic origin dominate in the topology of the meta-network, especially haddock and cod, but also redfish is quite central in the network. This supports that their invasion does really make an impact on the local community, as shown earlier (Kortsch et al., 2015).
Trawling influences a number of species in the Barents Sea ecosystem. These are assigned to 8 functional groups in our network model: LDEP and piscivorous fish with several sensitive species as well as 6 single species groups such as herring and capelin. LDEP is affected by strongly asymmetric effects of the invasive cod and haddock, so we can conclude that this functional group is the subject of double exposure (O’Brien and Leichenko, 2000).
The poleward shift of boreal species includes mostly generalists (Argentina silus in the pelagic planktivorous fish group and Brosme brosme in the large benthivorous fish group, see Supplementary Material A), while benthivorous Arctic fish populations are decreasing (Lycodes spp. in the small benthivorous fish group and Anarhichas denticulatus in the large benthivorous fish group, see Supplementary Material A). This may change food web structure to more connected and more vulnerable state (Emblemswag, 2022). The increase of one and the decrease of another species within the large benthivorous fish group can be considered as a turnover of species from a functional point of view (i.e. relative abundances change at the species level but no major change at the functional group level). In other cases (pelagic planktivorous fish and small benthivorous fish), the similarity of network positions (Figure 2) may help to identify the key partners involved in the change, for example, competitors. If the pelagic planktivorous fish group increases, mostly redfish is influenced negatively (they are neighbors, forming a little branch), and for the same reasons, if small benthivorous fish decreases, mostly macrozooplankton is influenced positively. The similarity dendrogram helps the interpretation of changes at the level of trophic groups, from a more functional point of view. The strength of the expected competitive effects is proportional to the length of the segments in the dendrogram (i.e. close neighbors with short segments may imply stronger competition, cf. top predators and piscivorous fish versus small benthivorous fish and macrozooplankton). This suggests that the positive effect of declining small benthivorous fish on macrozooplankton may be slightly weaker.
An important component of the atlantification in the Barents Sea community may be similar to the changing control regime in the North Sea. Here, from predominantly bottom-up control (Fauchald et al., 2011), the system seems to being shifted towards mixed control, including some mid-trophic level species exerting wasp-waist control (with key bottom-up and top-down effects such as from haddock to large benthivorous fish and from haddock to LDEP, respectively, in our model). Wasp-waist topology does not automatically imply wasp-waist control (mixed bottom-up and top-down impact of a few species, Cury et al., 2000) but both may imply strong indirect interactions among species in the middle of the food web. If this is further supported by future studies, the chance of regime shifts and their dynamical consequences can be higher and needs further research.
If strong indirect and, especially, asymmetrical interactions are detected among commercially important fish species, the need for multi-species MSY assessment (May et al., 1979) is even stronger and developing policies considering these is more urgent. Here, food web theory and simulations can support policy-making (Legovic and Gecek, 2010; Legovic et al., 2010; Móréh et al., 2021).
In this article, we do not report on testing the predictions (e.g. by mesocosm experiments, time-series analyses) but we note that the approach is simple enough to potentially support indicator development or decision-making. Predictions can be tested on time-series, wherever available (like for reciprocity in plant-pollinator and plant-seed disperser networks, see Jordano, 1987). For fishing zones, data are probably available for testing the time-dynamics of links suggested here as being critical and predictable. Making and testing predictions is a generally hard task, especially in multi-species models, yet, simple predictions can be useful theoretical results (e.g. in loop analysis, Bodini and Clerici, 2016; Rodriguez et al., 2021; Fábián et al., 2022) generating and informing further empirical research.
Our future research on the Barents Sea ecosystem will focus on the spatial (e.g. Southern vs Northern region) and temporal (e.g. before and after the invasion of Atlantic species) variability of the food web (Frelat et al., 2022). Depending on the availability of high-quality time series (e.g. Kortsch et al., 2021), temporal changes may be described also in more than 2 stages (Uribe et al., 2021; Scotti et al., 2022). Further, we need a better topological description of the mathematical aggregation of species into functional groups (Abarca-Arenas and Ulanowicz, 2002) and loop analysis providing an alternative approach to crucial effects. The methodology used here can be performed also for weighted networks and it is a key question to see whether there is a major difference between the results for binary and weighted food webs (Scotti et al., 2007; Kortsch et al., 2021). In order to better explore the role of the c cutoff value, one potential solution is to define c as the smallest value where the asymmetry graph is still a DAG (directed acyclic graph), standardizing the definition and keeping the approach suitable for identifying clear cause-effect relationships.
Policy-making is based on simplified results and system-level indicators. Community control is an important property of ecological systems, providing crucial information to systems-based conservation and fisheries management. Whether top-down or bottom-up processes dominate has a major influence on the possible outcome of overfishing, for example. Our study aimed to contribute to developing the theoretical support for more predictive food web modelling, simplifying complexity by focusing on a few critical links in complex interaction networks. Our results provide support to the wasp-waist control of haddock, suggesting that special attention needs to be paid for this species. The high centrality of the boreal invaders (haddock, cod, redfish) means that even if these species show increasing tendencies in population size, they already have major community-wide effects in these Northern ecosystems. Zooplankton eater whales and large benthivorous fish seem to be relatively unique in terms of their trophic niches. This suggests that overfishing these species may result in weak resilience, given the low level of overlap with other organisms.
Our results are based on a modelling exercise but, based on literature data and earlier findings, we suggest that these predictions may be quite feasible and realistic. Predictivity of results in food web research is always hard to justify, as experiments are of limited relevance in terms of spatio-temporal scales. We hope that our approach contributes to the development of systems-based, simple and quantitative toolkit of marine ecology.
Data availability statement
The original contributions presented in the study are included in the article/Supplementary Material. Further inquiries can be directed to the corresponding author.
Author contributions
FJ: Conceptualization, Methodology, Writing – original draft, Writing – review & editing. GC: Data curation, Methodology, Writing – review & editing. RP: Data curation, Investigation, Supervision, Writing – review & editing. AB: Funding acquisition, Methodology, Supervision, Writing – review & editing.
Funding
The author(s) declare financial support was received for the research, authorship, and/or publication of this article. The work of FJ was supported by the grant AtlantECO (H2020 BG-08-2018-2019, grant no. SEP-210591007) and also by a contract co-financed by the European Union - PON Research and Innovation 2014-2020 based on art. 24, paragraph 3, letter a) of the Law of 30 December 2010, Nr. 240 and subsequent amendments of Ministerial Decree of 10 August 2021 Nr. 1062.
Acknowledgments
We thank Marco Scotti for very useful advice on an earlier version of the manuscript and the anonymous reviewers for their excellent comments.
Conflict of interest
Author FJ was employed by the company KeyNode Research Ltd.
The remaining authors declare that the research was conducted in the absence of any commercial or financial relationships that could be construed as a potential conflict of interest.
Publisher’s note
All claims expressed in this article are solely those of the authors and do not necessarily represent those of their affiliated organizations, or those of the publisher, the editors and the reviewers. Any product that may be evaluated in this article, or claim that may be made by its manufacturer, is not guaranteed or endorsed by the publisher.
Supplementary material
The Supplementary Material for this article can be found online at: https://www.frontiersin.org/articles/10.3389/fmars.2024.1301612/full#supplementary-material.
References
Abarca-Arenas L. G., Ulanowicz R. E. (2002). The effects of taxonomic aggregation on network analysis. Ecol. Model. 149, 285–296. doi: 10.1016/S0304-3800(01)00474-4
Allesina S., Bodini A. (2004). Who dominates whom in the ecosystem? Energy flow bottlenecks and cascading extinctions. J. Theor. Biol. 230, 351–358. doi: 10.1016/j.jtbi.2004.05.009
Allesina S., Bodini A., Bondavalli C. (2006). Secondary extinctions in ecological networks: Bottlenecks unveiled. Ecol. Model. 194, 150–161. doi: 10.1016/j.ecolmodel.2005.10.016
Audzijonyte A., Pethybridge H., Porobic J., Gorton R., Kaplan I., Fulton E. A. (2019). Atlantis: A spatially explicit end-to-end marine ecosystem model with dynamically integrated physics, ecology and socio-economic modules. Methods Ecol. Evol. 10, 1814–1819. doi: 10.1111/2041-210X.13272
Bodini A., Clerici N. (2016). Vegetation, herbivores and fires in savanna ecosystems: A network perspective. Ecol. Compl. 28, 36–46. doi: 10.1016/j.ecocom.2016.10.001
Bond W. J. (1994). “Keystone species,” in Biodiversity and ecosystem function. Eds. Schulze E. D., Mooney H. A. (Springer, Berlin, Germany), 255–270.
Bondavalli C., Bodini A. (2014). How interaction strength affects the role of functional and redundant connections in food webs. Ecol. Compl. 20, 97–106. doi: 10.1016/j.ecocom.2014.09.004
Borgatti S. P., Everett M. G., Freeman L. C. (2002). Ucinet for windows: software for social network analysis (Harvard, MA: Analytic Technologies).
Brose U., Berlow E. L., Martinez N. D. (2005). Scaling up keystone effects from simple to complex ecological networks. Ecol. Lett. 8, 1317–1325. doi: 10.1111/j.1461-0248.2005.00838.x
Christensen V., Walters C. J. (2004). Ecopath with Ecosim: methods, capabilities and limitations. Ecol. Model. 172, 109–139. doi: 10.1016/j.ecolmodel.2003.09.003
Cirtwill A. R., Dalla Riva G. V., Gaiarsa M. P., Bimler M. D., Cagua E. F., Coux C., et al. (2018). A review of species role concepts in food webs. Food Webs 16, e00093. doi: 10.1016/j.fooweb.2018.e00093
Cury P., Bakun A., Crawford R. J. M., Jarre A., Quiñones R. A., Shannon L. J., et al. (2000). Small pelagics in upwelling systems: patterns of interaction and structural changes in “wasp-waist” ecosystems. ICES J. Mar. Sci. 57, 603–618. doi: 10.1006/jmsc.2000.0712
Emblemswag M. (2022). Climate warming impact on the deep demersal fish community East of Greenland. (PhD dissertation). The Arctic University of Norway, Tromsø.
Endrédi A., Patonai K., Podani J., Libralato S., Jordán F. (2021). Who is where in marine food webs? A trait-based analysis of network positions. Front. Mar. Sci. 8, 1315. doi: 10.3389/fmars.2021.636042
Endrédi A., Senánszky V., Libralato S., Jordán F. (2018). Food web dynamics in trophic hierarchies. Ecol. Model. 368, 94–103. doi: 10.1016/j.ecolmodel.2017.11.015
Estes J. A., Tinker M. T., Williams T. M., Doak D. F. (1998). Killer whale predation on sea otters linking oceanic and nearshore ecosystems. Science 282, 473–476. doi: 10.1126/science.282.5388.473
Estrada E. (2007). Characterization of topological keystone species: Local, global and “meso-scale” centralities in food webs. Ecol. Compl. 4, 48–57. doi: 10.1016/j.ecocom.2007.02.018
Everett M. G., Borgatti S. (1991). Role colouring a graph. Math. Soc Sci. 21, 183–188. doi: 10.1016/0165-4896(91)90080-B
Fábián V., Reguly I., Jordán F. (2022). Adding human impact to an ecological system model. Ecol. Compl. 50, 101000. doi: 10.1016/j.ecocom.2022.101000
Fath B. D., Scharler U. M., Ulanowicz R. E., Hannon B. (2007). Ecological network analysis: network construction. Ecol. Model. 208, 49–55. doi: 10.1016/j.ecolmodel.2007.04.029
Fauchald P., Skov H., Skern-Mauritzen M., Johns D., Tveraa T. (2011). Wasp-waist interactions in the North Sea ecosystem. PloS One 6, e22729. doi: 10.1371/journal.pone.0022729
Finn J. T. (1976). Measures of ecosystem structure and function derived from analysis of flows. J. Theor. Biol. 56, 363–380. doi: 10.1016/S0022-5193(76)80080-X
Fossheim M., Primicerio R., Johannesen E., Ingvaldsen R. B., Aschan M. M., Dolgov A. V. (2015). Recent warming leads to a rapid borealization of fish communities in the Arctic. Nat. Climate Change 5, 673–677. doi: 10.1038/nclimate2647
Frelat R., Kortsch S., Kröncke I., Neumann H., Nordström M. C., Olivier P. E. N., et al. (2022). Food web structure and community composition: a comparison across space and time in the North Sea. Ecography 2022, e05945. doi: 10.1111/ecog.05945
Gjata N., Scotti M., Jordán F. (2012). The strength of simulated indirect interaction modules in a real food web. Ecol. Compl. 11, 160–164. doi: 10.1016/j.ecocom.2012.01.005
Hairston N. G., Smith F. E., Slobodkin L. B. (1960). Community structure, population control, and competition. Am. Nat. 94, 421–425. doi: 10.1086/282146
Holt R. D., Bonsall M. B. (2017). Apparent competition. Ann. Rev. Ecol. Evol. Syst. 48, 447–471. doi: 10.1146/annurev-ecolsys-110316-022628
Hunter M. D., Price P. W. (1992). Playing chutes and ladders: heterogeneity and the relative roles of bottom-up and top-down forces in natural communities. Ecology 73, 724–732. doi: 10.2307/1940152
ICES (2022). “Barents Sea ecosystem – fisheries overview,” in Report of the ICES Advisory Committee, 2022. ICES Advice 2022, section 5.2. doi: 10.17895/ices.advice.21640814
Jordán F. (2009). Keystone species in food webs. Phil. Trans. R. Soc. London Ser. B 364, 1733–1741. doi: 10.1098/rstb.2008.0335
Jordán F. (2022). The network perspective: vertical connections linking organizational levels. Jörgensen review. Ecol. Model. 473, 110112. doi: 10.1016/j.ecolmodel.2022.110112
Jordán F., Liu W.-C., van Veen F. J. F. (2003). Quantifying the importance of species and their interactions in a host-parasitoid community. Commun. Ecol. 4, 79–88. doi: 10.1556/ComEc.4.2003.1.12
Jordán F., Liu W.-C., Wyatt T. (2005). Topological constraints on the dynamics of wasp-waist ecosystems. J. Mar. Syst. 57, 250–263. doi: 10.1016/j.jmarsys.2005.05.002
Jordán F., Scotti M., Mike Á., Ortiz M. (2014). Strong asymmetry indicating causality in food web simulations. Mar. Ecol. Prog. Ser. 512, 89–98. doi: 10.1016/j.jmarsys.2005.05.002
Jordano P. (1987). Patterns of mutualistic interactions in pollination and seed dispersal: Connectance, dependence asymmetries, and coevolution. Am. Nat. 129, 657–677. doi: 10.1086/284665
Karsenti E., Acinas S. G., Bork P., Bowler C., De Vargas C., Raes J., et al. (2011). A holistic approach to marine ecosystems biology. PloS Biol. 9, e1001177. doi: 10.1371/journal.pbio.1001177
Kortsch S., Frelat R., Pecuchet L., Olivier P., Putnis I., Bonsdorff E., et al. (2021). Disentangling temporal food web dynamics facilitates understanding of ecosystem functioning. J. Anim. Ecol. 90, 1205–1216. doi: 10.1111/1365-2656.13447
Kortsch S., Primicerio R., Aschan M., Lind S., Dolgov A. V., Planque B. (2019). Food-web structure varies along environmental gradients in a high-latitude marine ecosystem. Ecography 42, 295–308. doi: 10.1111/ecog.03443
Kortsch S., Primicerio R., Fossheim M., Dolgov A. V., Aschan M. (2015). Climate change alters the structure of arctic marine food webs due to poleward shifts of boreal generalists. Proc. R. Soc B 282, 20151546. doi: 10.1098/rspb.2015.1546
Lafferty K. D., Dobson A. P., Kuris A. M. (2006). Parasites dominate food web links. Proc. Natl. Acad. Sci. U.S.A. 103, 11211–11216. doi: 10.1073/pnas.0604755103
Legovic T., Gecek S. (2010). Impact of maximum sustainable yield on independent populations. Ecol. Model. 221, 2108–2111. doi: 10.1016/j.ecolmodel.2010.05.015
Legovic T., Klanjscek J., Gecek S. (2010). Maximum sustainable yield and species extinction in ecosystems. Ecol. Model. 221, 1569–1574. doi: 10.1016/j.ecolmodel.2010.03.024
Lin W. H., Lai S. M., Davis A. J., Liu W. C., Jordán F. (2022). A network-based measure of functional diversity in food webs. Biol. Lett. 18, 20220183. doi: 10.1098/rsbl.2022.0183
Livi C. M., Jordán F., Lecca P., Okey T. A. (2011). Identifying key species in ecosystems with stochastic sensitivity analysis. Ecol. Model. 222, 2542–2551. doi: 10.1016/j.ecolmodel.2010.09.025
Luczkovich J. J., Borgatti S. P., Johnson J. C., Everett M. G. (2003). Defining and measuring trophic role similarity in food webs using regular equivalence. J. Theor. Biol. 220, 303–321. doi: 10.1006/jtbi.2003.3147
May R. M., Beddington R. J., Clark C. W., Holt S. J., Laws R. M. (1979). Management of multispecies fisheries. Science 205, 267–277. doi: 10.1126/science.205.4403.267
Móréh Á., Endrédi A., Piross I. S., Jordán F. (2021). Topology of additive pairwise effects in food webs. Ecol. Model. 440, 109414. doi: 10.1016/j.ecolmodel.2020.109414
Müller C. B., Adriaanse I. C. T., Belshaw R., Godfray H. C. J. (1999). The structure of an aphid-parasitoid community. J. Anim. Ecol. 68, 346–370. doi: 10.1046/j.1365-2656.1999.00288.x
O’Brien K. L., Leichenko R. M. (2000). Double exposure: assessing the impacts of climate change within the context of economic globalization. Global Environ. Change 10, 221–232. doi: 10.1016/S0959-3780(00)00021-2
Odenbaugh J. (2006). The strategy of “The strategy of model building in population biology”. Biol. Philos. 21, 607–621. doi: 10.1007/s10539-006-9049-3
Oksanen L., Fretwell S. D., Arruda J., Niemelä P. (1981). Exploitation ecosystems in gradients of primary productivity. Am. Nat. 118, 240–261. doi: 10.1086/283817
Pecuchet L., Lindegren M., Kortsch S., Całkiewicz J., Jurgensone I., Margonski P., et al. (2020a). Spatio-temporal dynamics of multi-trophic communities reveal ecosystem-wide functional reorganization. Ecography 43, 197–208. doi: 10.1111/ecog.04643
Pecuchet L., Blanchet M.-A., Frainer A., Husson B., Jørgensen L. L., Kortsch S., et al. (2020b). Novel feeding interactions amplify the impact of species redistribution on an Arctic food web. Global Change Biol. 26, 4894–4906. doi: 10.1111/gcb.15196
Pedersen T., Mikkelsen N., Lindstrøm U., Renaud P. E., Nascimento M. C., Blanchet M.-A., et al. (2021). Overexploitation, recovery, and warming of the Barents Sea ecosystem during 1950–2013. Front. Mar. Sci. 8, 732637. doi: 10.3389/fmars.2021.732637
Ripple W. J., Estes J. A., Schmitz O. J., Constant V., Kaylor M. J., Lenz A., et al. (2016). What is a trophic cascade? Trends Ecol. Evol. 31, 842–849. doi: 10.1016/j.tree.2016.08.010
Rodriguez M., Bodini A., Escobedo F. J., Clerici N. (2021). Analyzing socio-ecological interactions through qualitative modeling: Forest conservation and implications for sustainability in the peri−urban Bogota (Colombia). Ecol. Model. 439, 109344. doi: 10.1016/j.ecolmodel.2020.109344
Sala E., Graham M. H. (2002). Community-wide distribution of predator–prey interaction strength in kelp forests. Proc. Natl. Acad. Sci. U.S.A. 99, 3678–3683. doi: 10.1073/pnas.052028499
Scotti M., Bondavalli C., Rossetti G., Bodini A. (2022). Flow network indices signal a directional change in ecosystems: Evidence from a small mountain lake (Lake Santo, Northern Italy). Ecol. Indic. 139, 108896. doi: 10.1016/j.ecolind.2022.108896
Scotti M., Podani J., Jordán F. (2007). Weighting, scale dependence and indirect effects in ecological networks: a comparative study. Ecol. Compl. 4, 148–159. doi: 10.1016/j.ecocom.2007.05.002
Shin Y. J., Cury P. (1999). “OSMOSE: a multispecies individual-based model to explore the functional role of biodiversity in marine ecosystems,” in Ecosystem approaches for fisheries management. (Fairbanks: University of Alaska Sea Grant), 593–607.
Taruttis F., Spang R., Engelmann J. C. (2015). A statistical approach to virtual cellular experiments: improved causal discovery using accumulation IDA (aIDA). Bioinformatics 31, 3807–3814. doi: 10.1093/bioinformatics/btv461
Uribe R. A., Ortiz M., Jordán F. (2021). Discrete steps of successional pathways differ in kelp forest and urchin barren communities. Commun. Ecol. 22, 41–54. doi: 10.1007/s42974-020-00035-2
Wootton J. T., Emmerson M. (2005). Measurement of interaction strength in nature. Ann. Rev. Ecol. Evol. Syst. 36, 419–444. doi: 10.1146/annurev.ecolsys.36.091704.175535
Keywords: bottom-up, top-down, wasp-waist control, food web, network centrality, asymmetric interactions, regular equivalence
Citation: Jordán F, Capelli G, Primicerio R and Bodini A (2024) Strongly asymmetric interactions and control regimes in the Barents Sea: a topological food web analysis. Front. Mar. Sci. 11:1301612. doi: 10.3389/fmars.2024.1301612
Received: 25 September 2023; Accepted: 08 April 2024;
Published: 22 April 2024.
Edited by:
Tian Xie, Beijing Normal University, ChinaReviewed by:
Marco Yévenes, University of Los Lagos, ChileDavide Agnetta, National Institute of Oceanography and Applied Geophysics, Italy
Copyright © 2024 Jordán, Capelli, Primicerio and Bodini. This is an open-access article distributed under the terms of the Creative Commons Attribution License (CC BY). The use, distribution or reproduction in other forums is permitted, provided the original author(s) and the copyright owner(s) are credited and that the original publication in this journal is cited, in accordance with accepted academic practice. No use, distribution or reproduction is permitted which does not comply with these terms.
*Correspondence: Ferenc Jordán, ZmVyZW5jdmFsdGVyLmpvcmRhbkB1bmlwci5pdA==