 Wei Wang
 Yong Fu Sun
 Wei Gao1
95% of researchers rate our articles as excellent or good
Learn more about the work of our research integrity team to safeguard the quality of each article we publish.
Find out more
ORIGINAL RESEARCH article
Front. Mar. Sci. , 27 February 2024
Sec. Ocean Observation
Volume 11 - 2024 | https://doi.org/10.3389/fmars.2024.1301024
Detecting deep-sea megabenthic organisms is of foremost importance for seabed resource surveys, typical habitat protection, and biodiversity surveys. However, the complexity of the deep-sea environment, uneven illumination, and small biological targets that are easily obscured all increase target detection difficulty significantly. To address these, this paper proposes a deep-sea megabenthic detection algorithm, DS-YOLO, based on YOLOv5s. To improve the detection ability of the model for deep-sea megabenthic organisms, the space-to-depth module and the spatial pyramid pooling cross stage partial channel module are introduced in the Backbone layer to enlarge the receptive field and enhance the retention of small-scale features. Then, the space-to-depth and normalization-based attention modules and the Add and Concat functions of the bidirectional feature pyramid network are introduced in the Neck layer to increase the multiscale fusion ability of the model and highlight the insignificant features. Finally, the two branches of the decoupling header output the category and location of the target, which causes the model to utilize the feature information to the maximum extent. Experiments showed that DS-YOLO improved mAP0.5 from 89.6% to 92.4% and mAP0.5:0.95 from 65.7% to 72.3% compared to the original YOLOv5s on the homemade dataset and outperformed other algorithms in the YOLO series. DS-YOLO reaches 84.7 FPS for deployment on mobile platforms. In addition, the combined DS-YOLO and DeepSORT algorithm can be used to calculate the abundance and community structure of deep-sea megabenthos. The model outperforms general target detection models for deep-sea megabenthos detection and is suitable for use in complex deep-sea environments.
The deep sea is rich in biological resources, including megabenthos, which can support research on the origin of life and global climate change and can also be used as raw materials for new medicines and industrial products. Reasonable development, research, and conservation of deep-sea megabenthos are of great significance to the health of marine ecology and resource development. The most intuitive and reliable way to obtain information on deep-sea organisms is to use high-definition cameras on submersibles to capture videos. However, due to the complexity of the deep-sea environment, the obtained video images are subject to many problems, such as off-color, fading, uneven illumination, and the small proportion of deep-sea megabenthos in the video images, all of which bring difficulties in the detection of organisms. Recognizing organisms manually is time-consuming and susceptible to subjective influences. This paper proposes a deep-sea biology detection method, DeepSea-YOLO (DS-YOLO), for automatically detecting deep-sea megabenthic organisms, investigating the structure of biological communities, and assessing marine ecological resources.
Deep-sea target detection is usually challenging due to complex natural environments, so collecting target information accurately and quickly is crucial. Traditional target detection methods use a strategy for selecting regions based on sliding window ports (Dalal and Triggs, 2005), which are untargeted and complex, and manually designed feature extractors do not apply to multiple classes of targets. In recent years, owing to the improvement in computer performance, especially GPUs, deep learning methods that require convolutional computation have gradually gained the attention of researchers. Convolutional neural network (CNN)-based models learn using backpropagation, and their excellent feature extraction ability and multi-layer convolutional learning render the models with good generalization ability (Krizhevsky et al., 2017). Based on whether a candidate frame is generated, target detection algorithms can be classified into two broad categories: one-stage and two-stage. One-stage detection algorithms achieve end-to-end training (i.e., simultaneously determining the target category and detection frame) and thus have faster detection speed. Typical one-stage algorithms include YOLO (Yi et al., 2019), SSD (Liu et al., 2016), Retina-Net (Lin et al., 2017a), and CornerNet (Law and Deng, 2018). Of these, the YOLO family of algorithms is the most commonly used and includes YOLO (Lin et al., 2017b), YOLO9000 (Redmon and Farhadi, 2017), YOLOv3 (Zhao and Li, 2020), YOLOv4 (Bochkovskiy et al., 2020), YOLOv5 (Zhu et al., 2021), YOLOv6 (Li C. et al., 2022), YOLOv7 (Wang et al., 2023), and YOLOv8 (Reis et al., 2023). They are characterized by high speed but are not effective in detecting small objects and are not accurate enough for localization. The two-stage target detection algorithm first generates a series of candidate bounding boxes as samples and then classifies these samples using a neural network. Two-stage detection algorithms include RCNN (Girshick et al., 2014), Fast-RCNN (Girshick, 2015), Faster-RCNN (Ren et al., 2015), and their improved series (Girshick, 2015). Faster-RCNN generates a candidate region through region preconditioning, then extracts features for the region with a neural network, classifies the target with a classifier, and finally fine-tunes the position with a register. With continuous improvement and innovation, the current one-stage target detection algorithms have guaranteed speed while considering detection accuracy.
The YOLO family of algorithms effectively learns and extracts key information, such as the target’s color, texture, shape, and background changes for detecting targets against complex backgrounds. Such algorithms are widely used in autonomous driving (Zhang et al., 2022), agricultural production (Zhao et al., 2021), and medical diagnosis (Samothai et al., 2022). Therefore, some scholars have also applied YOLO to underwater target detection. Underwater target detection is affected by many factors, such as difficulties in data acquisition, uneven illumination, interfering information, and photo fading (Ancuti et al., 2012; Azmi et al., 2019). Xia C. et al. selected images from a video clip for YOLOv2 training and achieved in-situ detection of Holothuroidea (Xia et al., 2018). Hu, J. et al. proposed a lightweight, improved method based on YOLOv3 and combined it with a lightweight underwater imaging system to detect fish (Hu et al., 2021). Moreover, Nixon, D. combined YOLOv4 and Darknet to achieve high detection performance with a small amount of fish image data (Nixon, 2021). Fan H. et al. borrowed the idea of GhostNet and introduced in YOLOv5 the GhostBottleneck and Attention Module (CBAM), which ensures the accuracy of the network while reducing the computation of the model (Fan et al., 2021). Li S. et al. designed a new lightweight Backbone network model using group convolution and inverse residual block instead of the original Backbone network of YOLOv5, which reduces the computation while increasing the detection accuracy (Li S. et al., 2022). Zhai X. et al. aiming at the problem of low contrast of underwater images of holothuroidea, introduced the Multiscale Color Recovery (MSRCR) algorithm to enhance the contrast of the images. They added a detection layer to the Backbone of YOLOv5, combined with CBAM to make detecting small targets more accurate (Zhai et al., 2022). Zhu J. et al. proposed a marine organism detection method based on a one-stage deep learning algorithm, YOLOv4- embedding, which can quickly detect different species of marine organisms (Zhu et al., 2022). Wang H. et al. improved YOLOv5 by incorporating multilevel features and increasing feature mapping. The algorithm solved the target tracking problem while maintaining a satisfactory level of accuracy and speed (Wang et al., 2022). Xu X. et al. proposed a marine benthic organism detection algorithm based on an improved YOLOv5 MAD-YOLO (Xu X. et al., 2023). It uses VOVDarkNet as the feature extraction backbone and AFC-PAN as the feature fusion network to enable the network to learn the features and location information of objects at different scales and improve its ability to perceive small objects. Despite some progress, there are still many difficulties in detecting benthic organisms in complex underwater environments (Al Muksit et al., 2022; Li H. et al., 2022). Shen X. et al. proposed an attention module based on multi-information perception (MIPAM) and explored a more suitable attention mechanism for underwater detection tasks (Shen et al., 2023). Li J. et al. proposed a novel detection model and tracking algorithm and achieved good tracking results on a laboratory homemade dataset, but the article did not further study in the in-situ environment than that (Li et al., 2023). Liu K. et al. added an attention module to YOLO and investigated a suitable image enhancement algorithm, achieving good results on a public dataset (Liu et al., 2023). Xuan K. et al. proposed a deep learning model for underwater small target recognition based on the YOLOv5 attention module, studied the suitable image enhancement algorithm, and achieved good results on public datasets (Xuan et al., 2023). Xu W. proposed a deep learning model SO-YOLOv5 for sea cucumber fusing coordinated attention and a bi-directional feature pyramid network for the DT-YOLOv5 intelligent recognition model (Xu W. et al., 2023). Complex underwater environments are prone to misses and misdetection of targets. Specifically, considerable human and material resources are required in the deep sea to obtain bio-visual information, posing challenges to deep-sea biological detection research.
Currently, underwater target detection is mostly limited to diving, with corals and sponges as typical species in the Pacific deep-sea seamount communities, but less research has been done on target detection methods for them. In deep-sea environments, natural light is almost attenuated, and artificially provided light sources become a necessary method for illumination. Under artificial light source conditions, the process of collecting deep-sea video data is susceptible to environmental influences. First, blue-green light with a wavelength in the 480 ± 30 nm band has the smallest attenuation coefficient in water, so most of the obtained videos are bluish-green, resulting in color distortion. Second, the contrast of deep-sea video data is usually low due to light scattering. Again, the water quality becomes turbid due to underwater submersible operations, resulting in severe blurring of the obtained video. Finally, various substances in the water column strongly absorb light energy, resulting in a general darkening of organisms at a distance from the light source and loss of their original colors and contours.
Based on the above, our study improved YOLOv5s, so the proposed DS-YOLO model is more effective when applied to detecting giant benthic organisms in complex deep-sea environments.
This study considered the problems of complex deep-sea environments, small image areas occupied by target organisms, and low resolution and introduced the SPD-Conv module in the Backbone and Neck layers of YOLOv5 to retain small-scale feature information and improve the feature learning efficiency.
Sediments stirred up by the bottom of the submersible and the complex seafloor topography have obscured the organisms to varying degrees. This research led to a smaller effective feature area, expanding the sensory field of the model by replacing the spatial pyramid pooling (SPP) module of the Backbone layer with the SPP cross stage partial channel (SPPCSPC), enriching the features in the region of the missing values, and strengthening the model’s feature fusion ability for partially occluded targets.
Deep-sea benthic organisms of the same type vary greatly in size; for example, in the hexactinellida class, large sponges can reach more than 1 meter while small sponges can be less than 10 centimeters. Models are needed that can focus on features at different scales to improve detection accuracy. Since the FPN+PAN structure used in the Neck layer of YOLOv5 could not make full use of the features between different scales, the Neck layer of this model drew on a bidirectional feature pyramid network (BiFPN) structure with cross-scale connectivity and weighted feature fusion. This layer used the Add and Concat functions to allow the model to better carry out multiscale feature fusion, thus improving detection accuracy.
Most deep-sea benthic organisms vary widely in characteristics from one another, and it is usually only necessary to focus on some of the organisms’ important characteristics to effectively classify them. To strengthen the network’s attention to deep-sea megabenthic targets and reduce the weights of insignificant features, a normalization-based attention module (NAM) was added at the end of the Neck layer to highlight features by calculating the variance of the weights of the training model and enhance the detection of small targets.
To address the lack of attention to the classification and localization tasks in YOLOv5, two branches were designed using decoupled detection heads for the localization and classification tasks to reduce the mutual interference and enable the model to make full use of the feature information.
YOLO is an innovative design concept for predicting a target’s type and bounding box by direct output. Much research in target detection focuses on improving optimization based on the YOLO family. YOLOv5, one of the famous one-stage target detection algorithms, has been widely used since it was proposed by Redmon J. in 2016 due to its simple network structure and extremely fast detection speed. Due to the limited computational capacity of deep-sea submersibles, which lack GPU devices, the computational requirements for the model are relatively low. In this study, we use YOLOv5 as the base model and further enhancing it to address the challenges of real-time processing and maintaining high accuracy in deep sea environments. The network structure of YOLOv5 is shown in Figure 1.

Figure 1 YOLOv5 network structure.
The YOLOv5 structure comprises Input, Backbone, Neck, and Head layers. First, the images in the training set are fed to the Backbone layer after processing, such as mosaic image enhancement, k-mean computation of anchor frames, and image scaling. The Backbone layer of the model is responsible for extracting the target features, which consist of Focus, Bottleneck CSP, and SPP. The Neck layer is responsible for augmenting the extracted target features, adopting the structure of PA Net, which can pass the target features of different scales for multiscale target detection. The Neck layer enhances the extracted target features and has the PA Net structure. Note that C3 in Figure 1 consists of BottleneckTrue in Backbone and BottleneckFalse in Neck. The output is processed by the GIOU function and a non-great suppression module, which can obtain three different scales of feature maps. If the prediction frame does not intersect the real frame, the GIOU function uses non-great suppression to enhance the detection of multi-targets and partially occluded targets. YOLOv5 ultimately outputs the position, category, and prediction probability of the objects in the original image and labels the targets.
Based on the difference in feature map width and convolution depth, the YOLOv5 family can be divided into YOLOv5s, YOLOv5m, YOLOv5l, and YOLOv5x (Li et al., 2021). These four algorithms have the same network structure as YOLOv5, with YOLOv5s having the smallest feature map width and convolution depth. The latter three algorithms are obtained by continuously widening and deepening the feature maps and convolution depths based on YOLOv5s, and their detection accuracy increases in order, but their speed decreases.
Although YOLOv5 performs better in common target detection algorithms, most video blurring and color distortions in deep-sea environments make detecting organisms difficult. To improve the detection effect, this paper proposes the DS-YOLO target detection algorithm, whose structure is shown in Figure 2. In the Backbone layer, a space-to-depth (SPD) module is located before each C3 module, which increases the retention of small-scale features in the channel dimension and improves the small target detection capability. The original SPP module is replaced with SPPCSPC to improve the feature extraction capability. In the Neck layer, the original Concat module is replaced with a weighted BiFPN module, and both Add and Concat are used to retain more feature information. The NAM is added at the end of the Neck network and calculates the variance of the weights of the training model to highlight features. Finally, a decoupled head separates the classification and regression tasks to reduce their mutual interference and improve the detection effect.
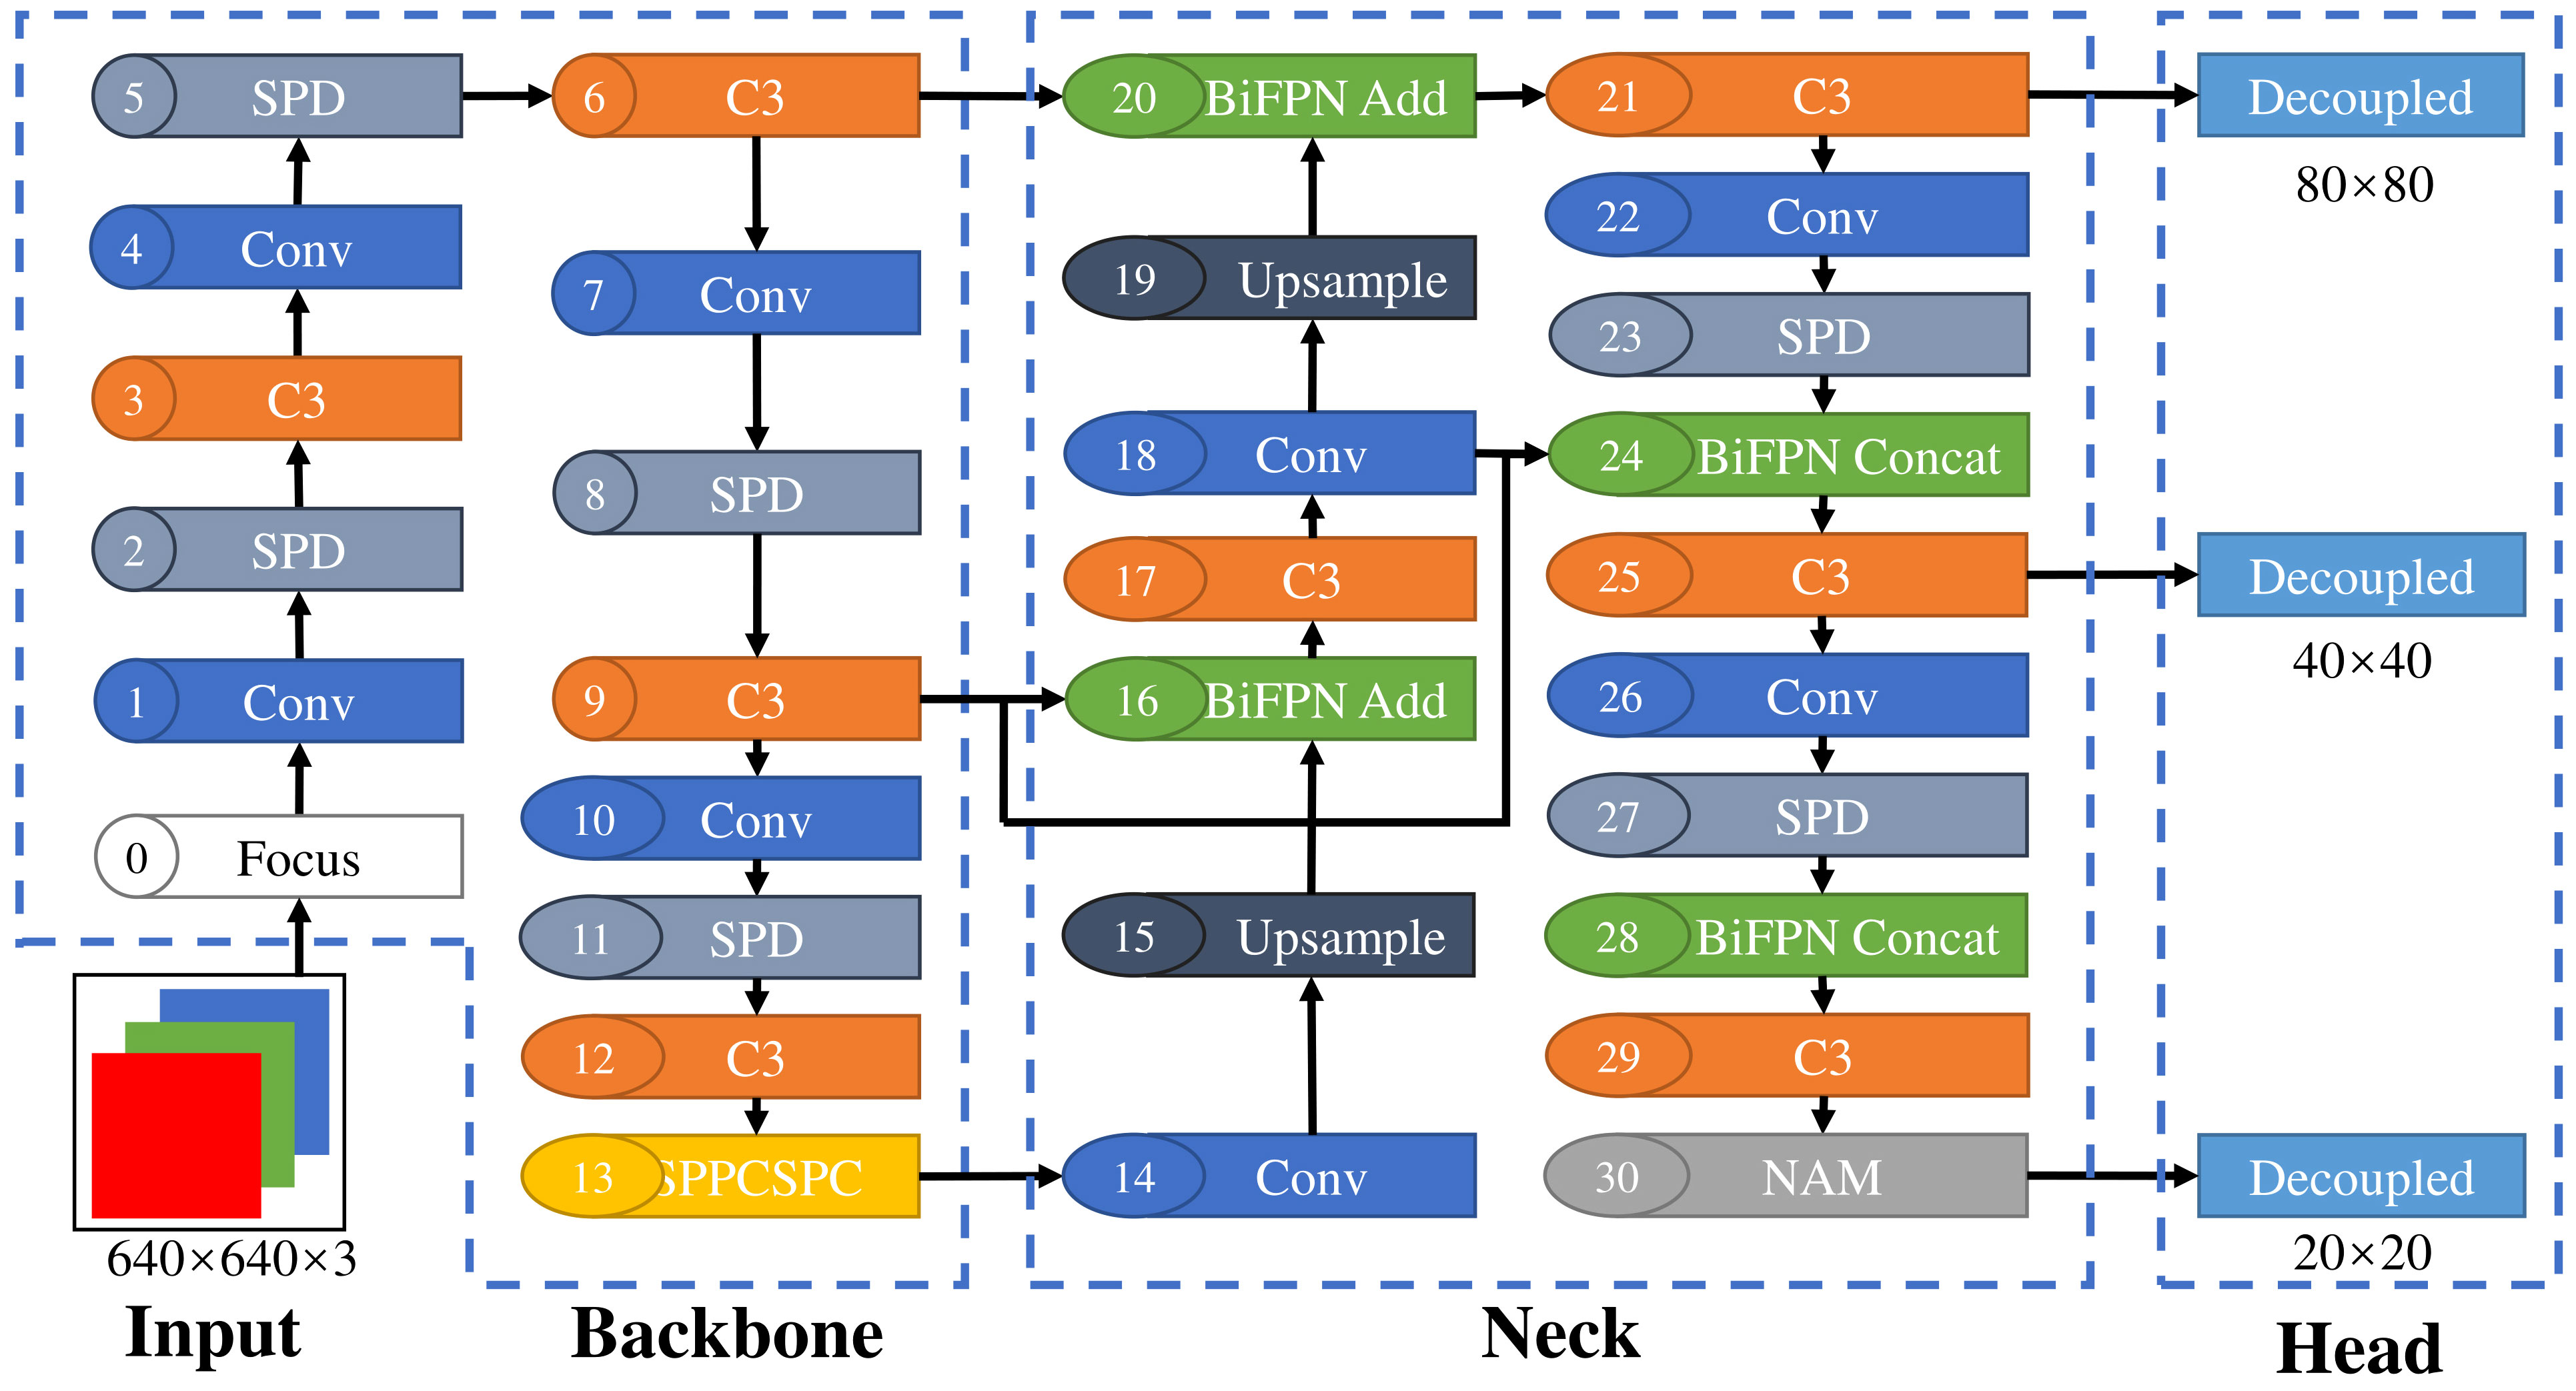
Figure 2 DS-YOLO network structure.
CNNs are often designed using convolutional steps and pooling layers, which can lead to inefficiencies in feature learning and loss of information at small scales. The SPD module consists of an SPD layer and a non-step-size convolutional layer that extends the image transformation technique to downsampling the feature maps within and across the CNN while preserving all features in the channel dimension, so there is no loss of information, and it works better on low-resolution images and small target detection tasks with better results (Sunkara and Luo, 2022). This is achieved by scale segmenting the original feature maps of arbitrary dimensions, X(S, S, C1). With an original feature map of any size, we can obtain scale*scale subfeature maps, all of which have a scale of , as shown in the following formulas (Equation 1):
When scale = 2, the feature maps X can be obtained with four subfeature maps all of size to downsample the subfeature maps. Downsampling is doubled when the subfeature maps are f0,0, f0,1, f1,0 and f1,1. Next, these four subfeature maps are connected along the channel dimension to obtain a new feature map. The spatial dimension X' is reduced by a factor of two, and the channel dimension is increased by a factor of two. After completing the above SPD transformations, the non-strided layer C2 filter can transform the intermediate feature map X' into and the step size of the transformation process is 1 so that the feature information is preserved to the maximum extent. The specific module of SPD is shown in Figure 3.

Figure 3 Structure of the space-to-depth module (shown in scale = 2).
The SPP module and, by drawing on the CSP structure, constitutes the SPPCSPC module. In this study, we replaced SPPCSPC with SPP (Wang et al., 2023). The SPP structure has four branches to perform MaxPool operations, with pooling kernel sizes of 1, 5, 9, and 13. These MaxPool operations enable the SPP structure to deal with four different sensory fields, which can better differentiate between large and small targets. CSP divides the output into two branches and performs different operations. The SPPCSPC structure is shown in Figure 4. It improves the model’s ability to recognize deep-sea megabenthic organisms through convolution, batch normalization, activation function, and pooling. SPPCSPC also improves the feature extraction of the target with a minor increase in the parameters and amount of computation.
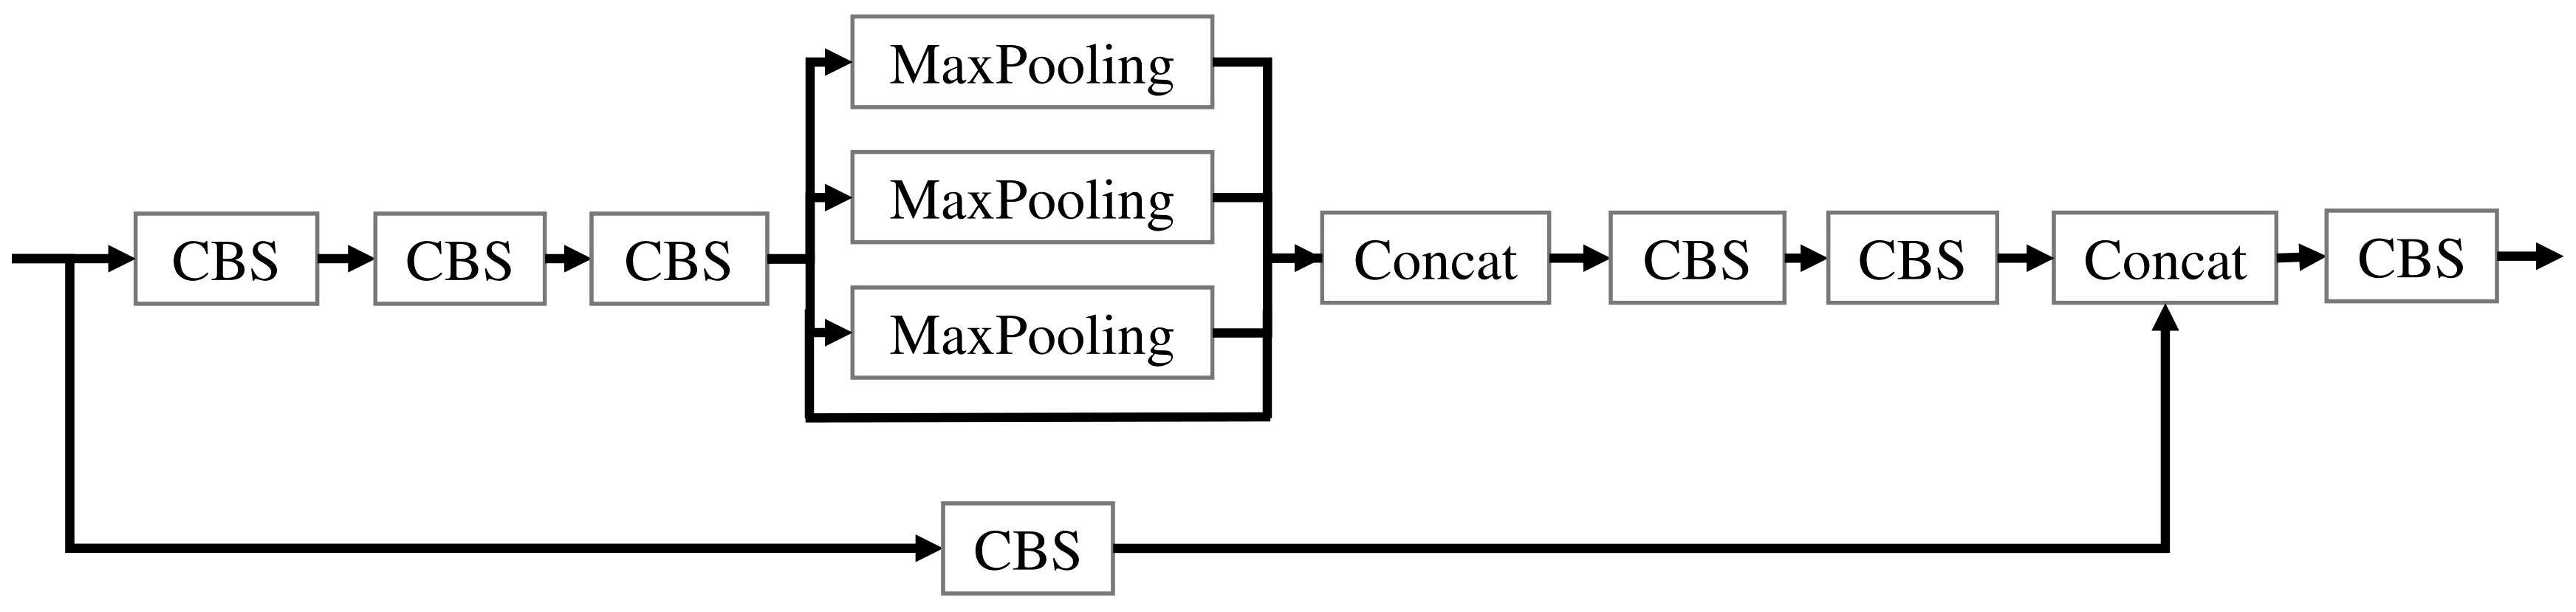
Figure 4 Spatial pyramid pooling cross stage partial channel structure.
The FPN structure in the original YOLOv5 network is substituted with BiFPN to fuse the deep, shallow, and input feature information, enhance feature fusion, and reduce the feature information loss in convolution, which improves the detection capability of the flexible target foreign objects (Tan et al., 2020). The FPN and BiFPN structures are shown in Figure 5. Since the nodes at the upper and lower input edges contribute little to the feature fusion, the nodes in the BiFPN structure are removed, which helps to simplify the network. For the case where the output and input nodes are in the same layer, adding an edge between the two nodes allows the network to fuse more features without increasing the computational load.
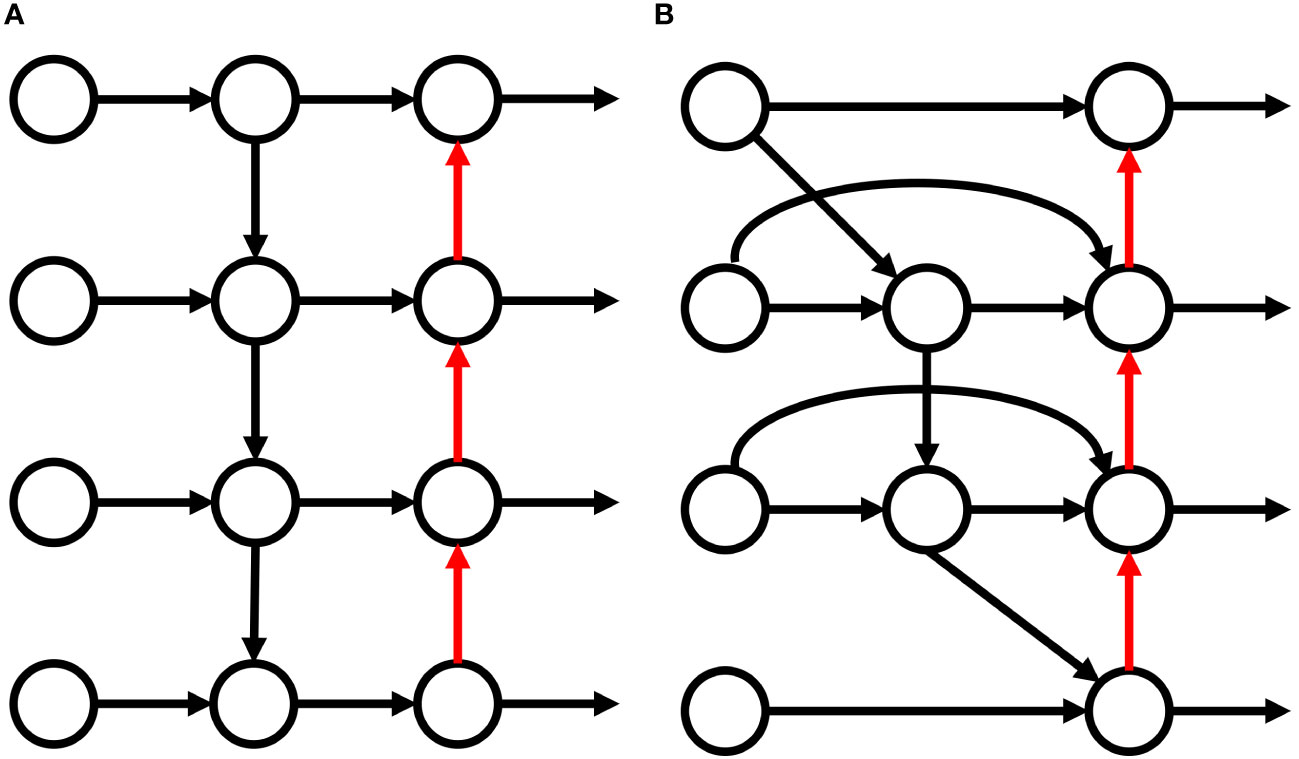
Figure 5 Structure of the feature pyramid network (A) and bidirectional feature pyramid network (B).
The network model divides, feature fusion into Add and Concat processes. The Add operation increases the amount of information describing the features of the image, but only the amount of information under each dimension is increased, and the number of dimensions describing the image is not increased. The Concat operation merges the number of channels, increasing the number of features describing the image, and the information under each feature is not increased. Therefore, the Add operation can be considered a special form of Concat, and its computation load is smaller than that of the general Concat. In this paper, the Add and Concat operations retain more feature information under the careful consideration of feature fusion and computation amount.
The NAM attention mechanism acts as an efficient, lightweight attention module that highlights features by calculating the variance of the weights of the training model. NAM adopts the modular integration of CBAM with a redesigned Channel Attention Module and Spatial Attention Module (Liu et al., 2021). The channel and spatial attention modules in the NAM are shown in Figure 6, respectively.
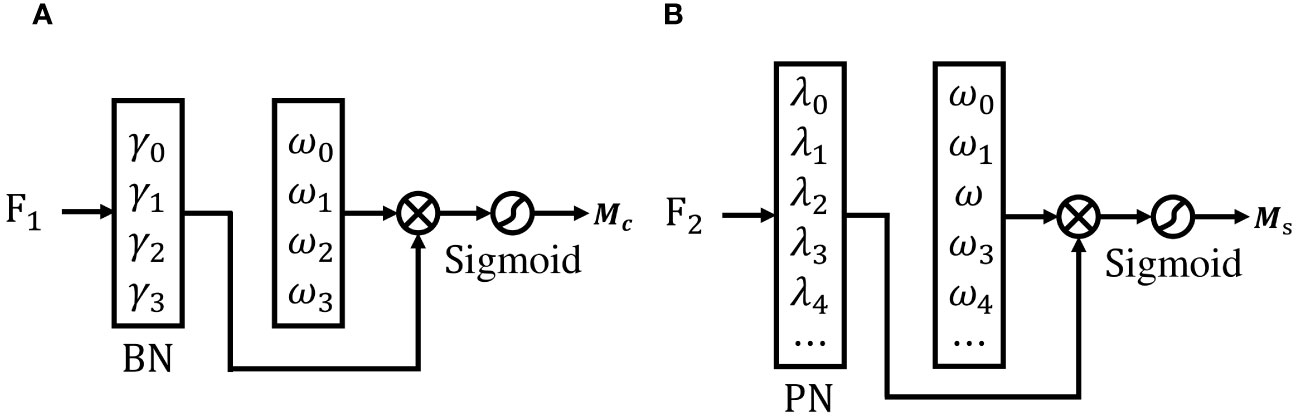
Figure 6 Channel attention module (A) and Spatial attention module (B).
In the Figures above, M c and M s denote the output characteristics of the channel and spatial modules, respectively. They are calculated by Equation 4 and Equation 5 respectively.
Of these, γi and λi are the channel and spatial scale factors, respectively, and Wγ and Wλ are their associated weighting factors. They are calculated by Equation 2 and Equation 3 respectively. The scale factor in the batch normalization is used for the channel attention sub-module, and the variance of the scale factor indicates the weight importance from Equation 6, i.e.,
μβ and σβ are the mean and standard deviation of β, respectively, and γ and β are trainable affine transformation parameters.
Coupled detection heads are used in the YOLOv5 algorithm, where both classification and regression tasks are performed in a single head. These two tasks interact with each other during model training. Depending on the classification confidence, redundant frames are removed during post-processing using non-maximal suppression. This may result in the erroneous deletion of some of the predicted frames due to the mutual interference of the classification and localization tasks. Because of this, the model has more difficulty classifying and regressing each target in the image. The decoupled head uses output feature maps with two different channels for category and location computation separately, which can improve the accuracy while reducing the miss-detection rate (Ge et al., 2021).
The specific structure of the decoupled detection head is shown in Figure 7, where the input feature map is first convolved by 1×1 to reduce the channel dimension to 256 and then input to the parallel branch with two 3×3 convolutions. Then, the result obtained by re-inputting the result of the previous step to the 3×3 convolution is used for the classification task. If the result of the previous step is re-input to two parallel 1×1 convolutions, it can be used for the regression for localization and confidence. After this, it is possible to output the classification, localization, and confidence tasks using different detection layers, which substantially improves the detection capability of the network and alleviates the leakage problem that occurs during non-maximal suppression.
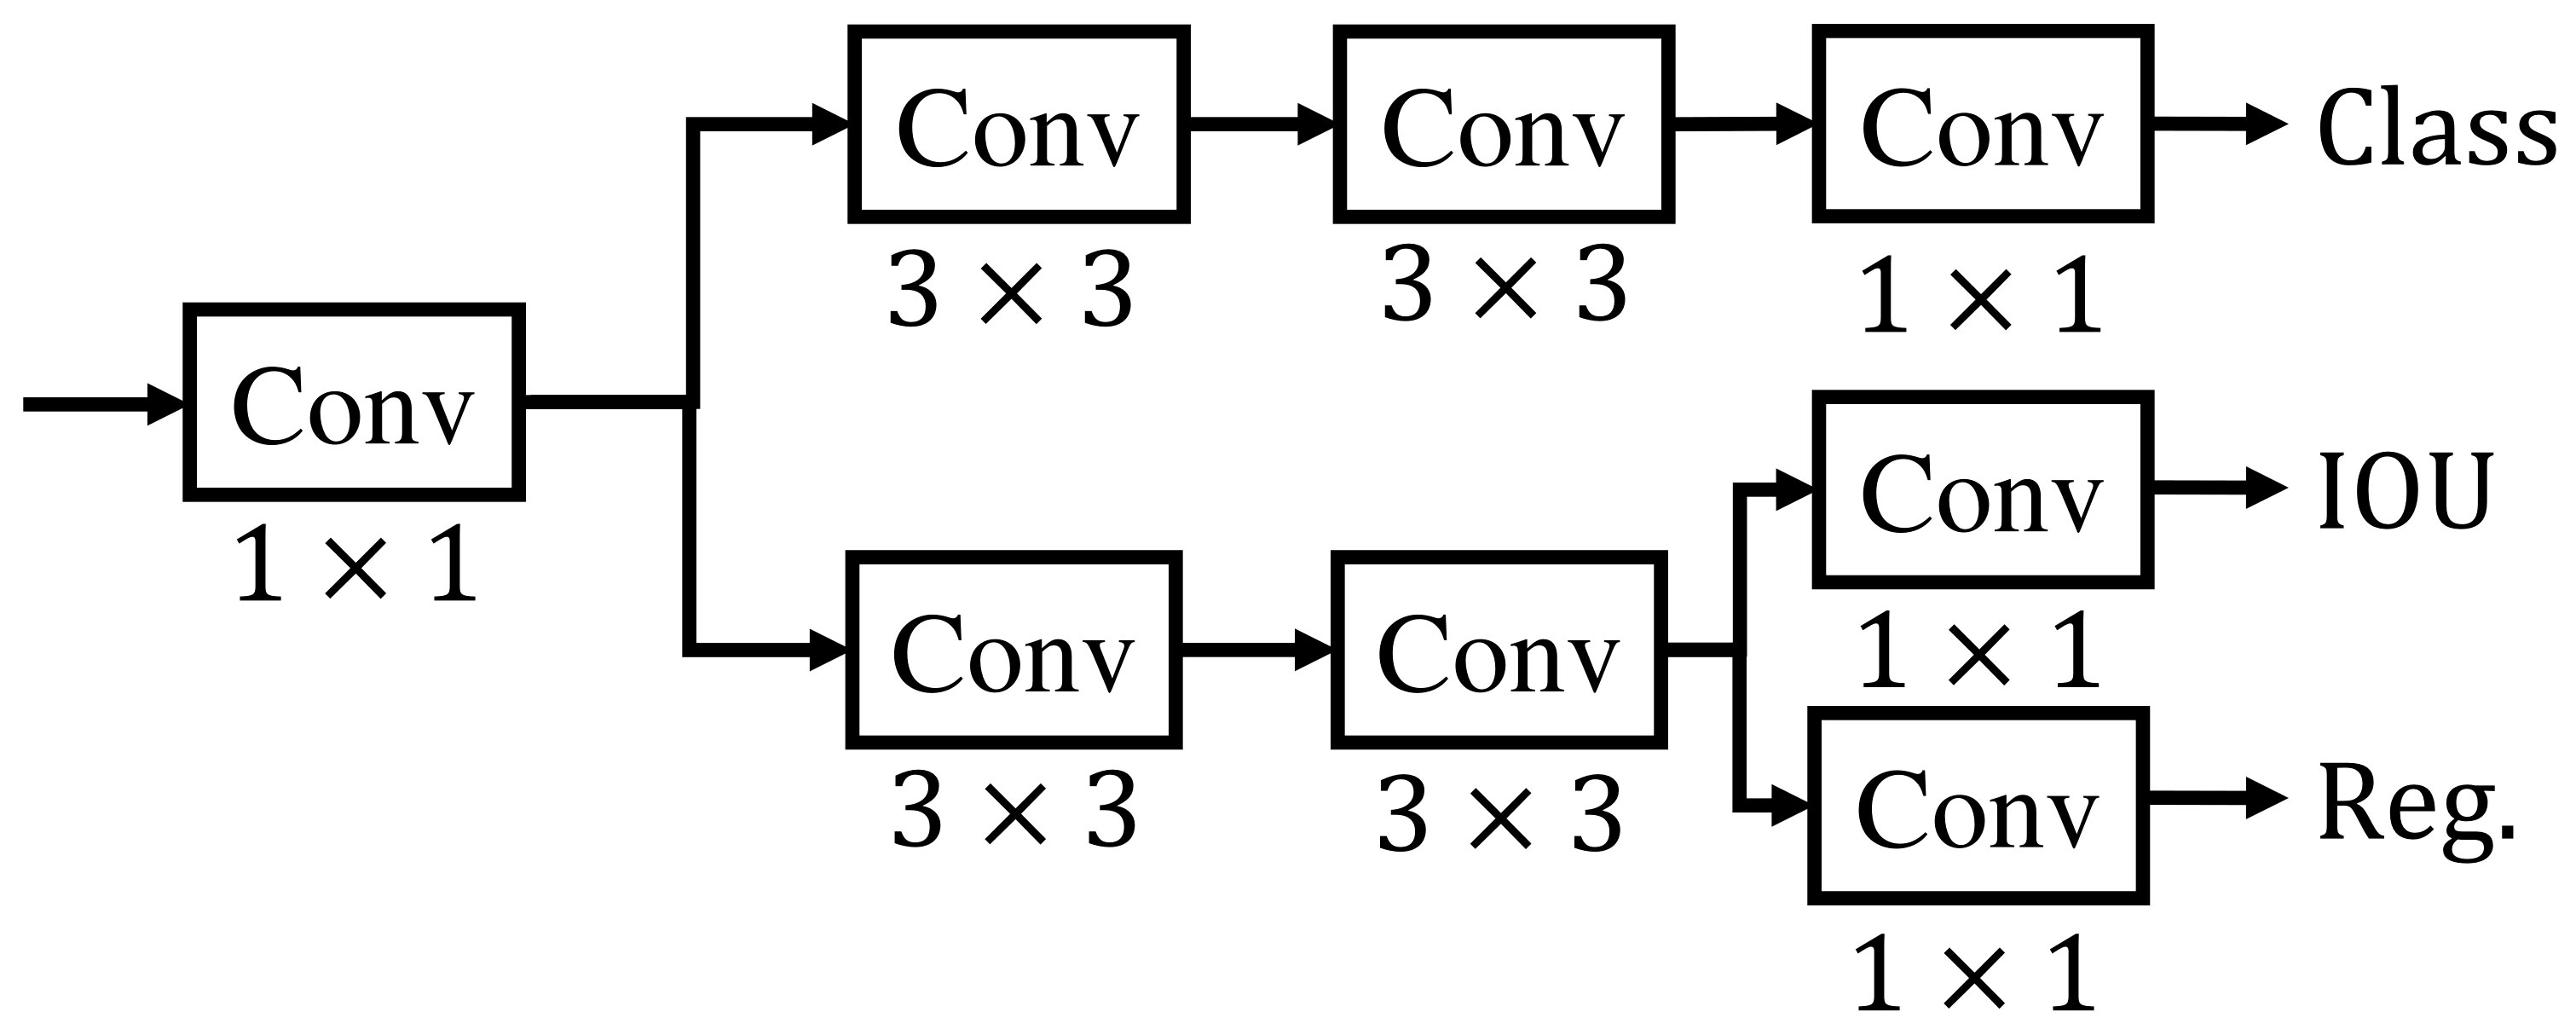
Figure 7 Decoupled head structure.
To verify the effectiveness of the proposed method in this paper, the dataset used for the experiment contains two parts: one part is from the video data obtained from the ROV dives during the China Oceanic 61 survey, and the other part is from the image data in the URPC2020 public dataset. Combining the filmed deep-seabed videos with the public data produces a dataset representing different seabed scenes.
During the China Oceanic 61 cruise, ROVs captured videos and still photos at a water depth of 1500–4500 m. A combination of video screenshots and photographs was used to obtain benthic biological information, including a total of 1115 high-definition video screenshots with a resolution of 1920×1080, 2040 still photographs with a resolution of 3648×2736, and 457 images selected from the URPC2020 public dataset with a resolution of 3840×2160. The whole dataset consists of 3612 images, including 13 different marine megabenthos: bolosominae, ophiuroidea, dead sponges, pheronematidae, lepidisis, pisces, nematocarcinidae, holothuroidea, isididae, plexauridae, tretopleura, echinus, and starfish, as shown in Table 1.
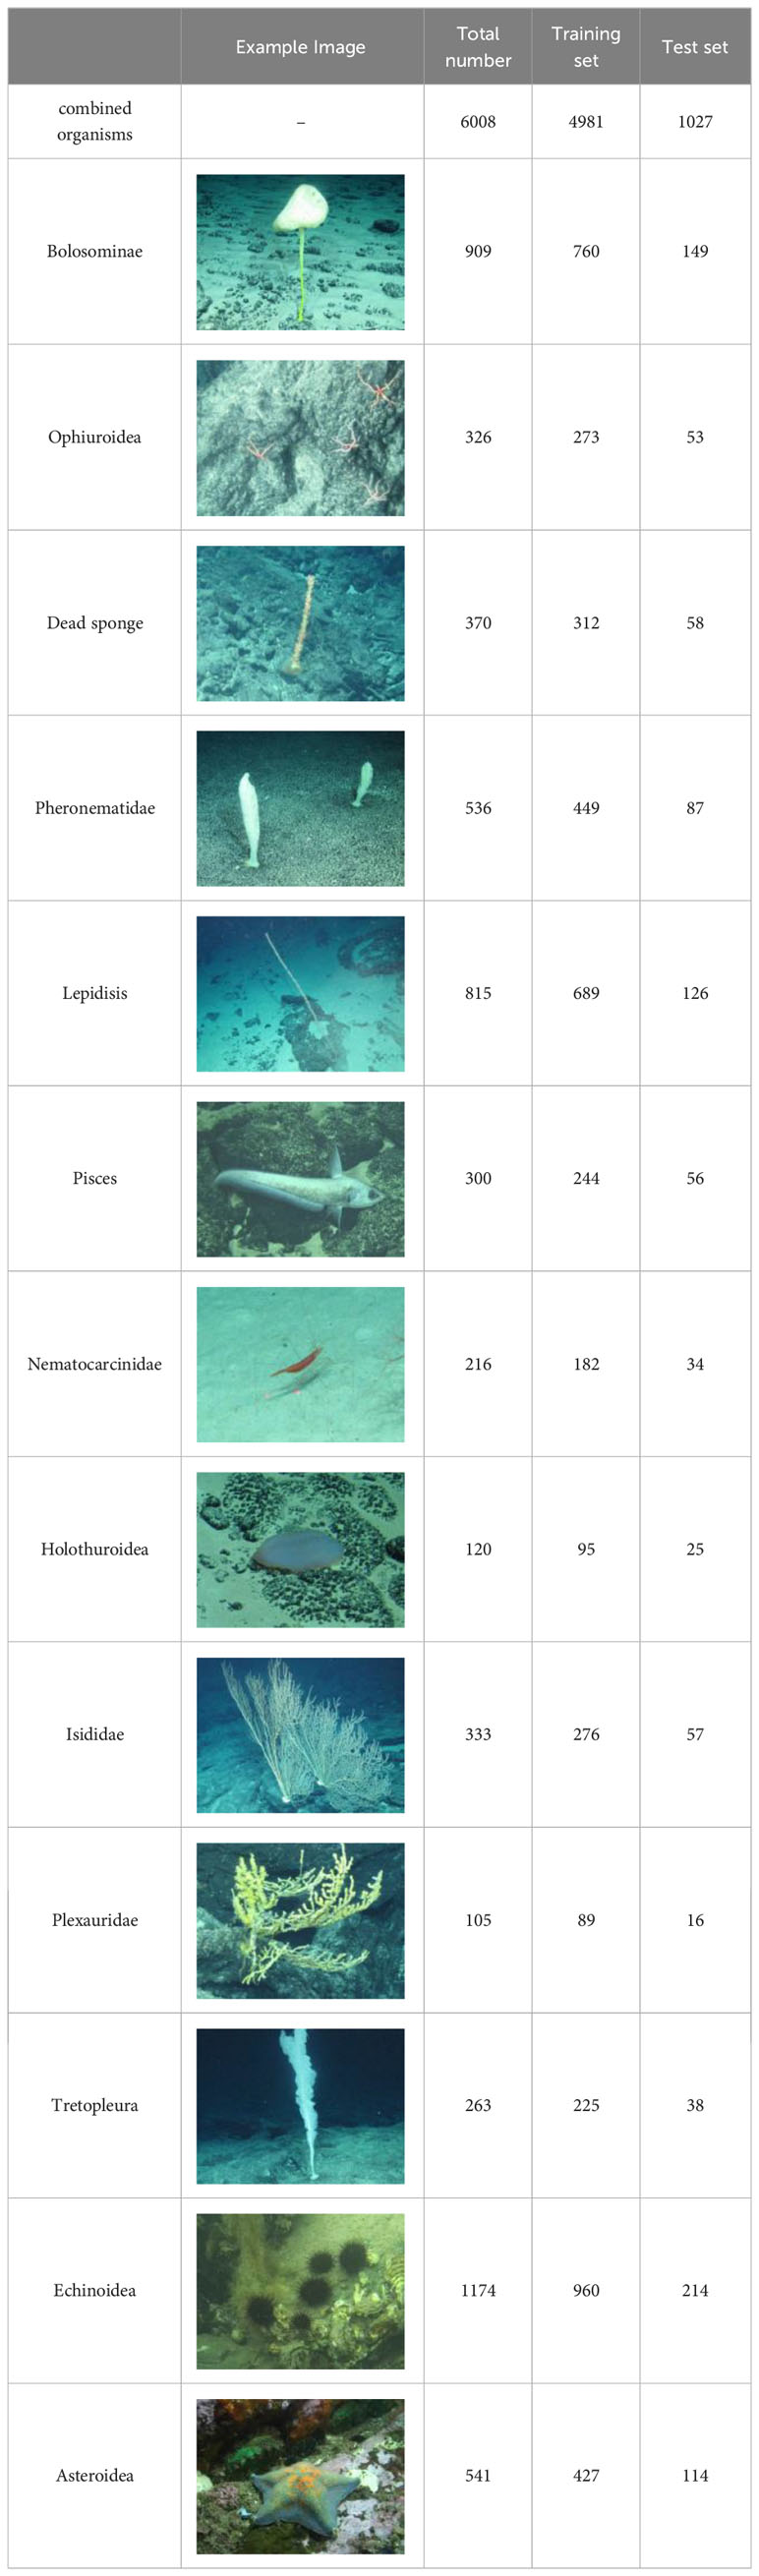
Table 1 Statistics on the number and example image of organisms.
It is worth noting that when the ophiuroidea were attached to corals and sponges, the morphological differences were large, and it was not easy to distinguish between individuals. As shown in Figure 8, only the ophiuroidea on the bedrock on the left side were examined. The ophiuroidea attached to other organisms on the right side were not studied for the time being. Lepidisis show greater morphological differences with age, as shown in Table 1, so they are discussed separately in this paper. The echinus and starfish are from the labeled data of URPC2020, and the other 11 organisms are from the ROV submersible survey. In this paper, the category and location information of the organisms from the ROV shots was annotated one by one using the Lamblme annotation tool and saved as a json file. Then, the json file was converted into a txt file suitable for YOLO, and the dataset was divided according to the ratio of the training set: test set=5:1, i.e., 3012 and 600 images were used as the training set and test set, respectively. The statistics of the number of organisms in each training set and test set are shown in Table 1.
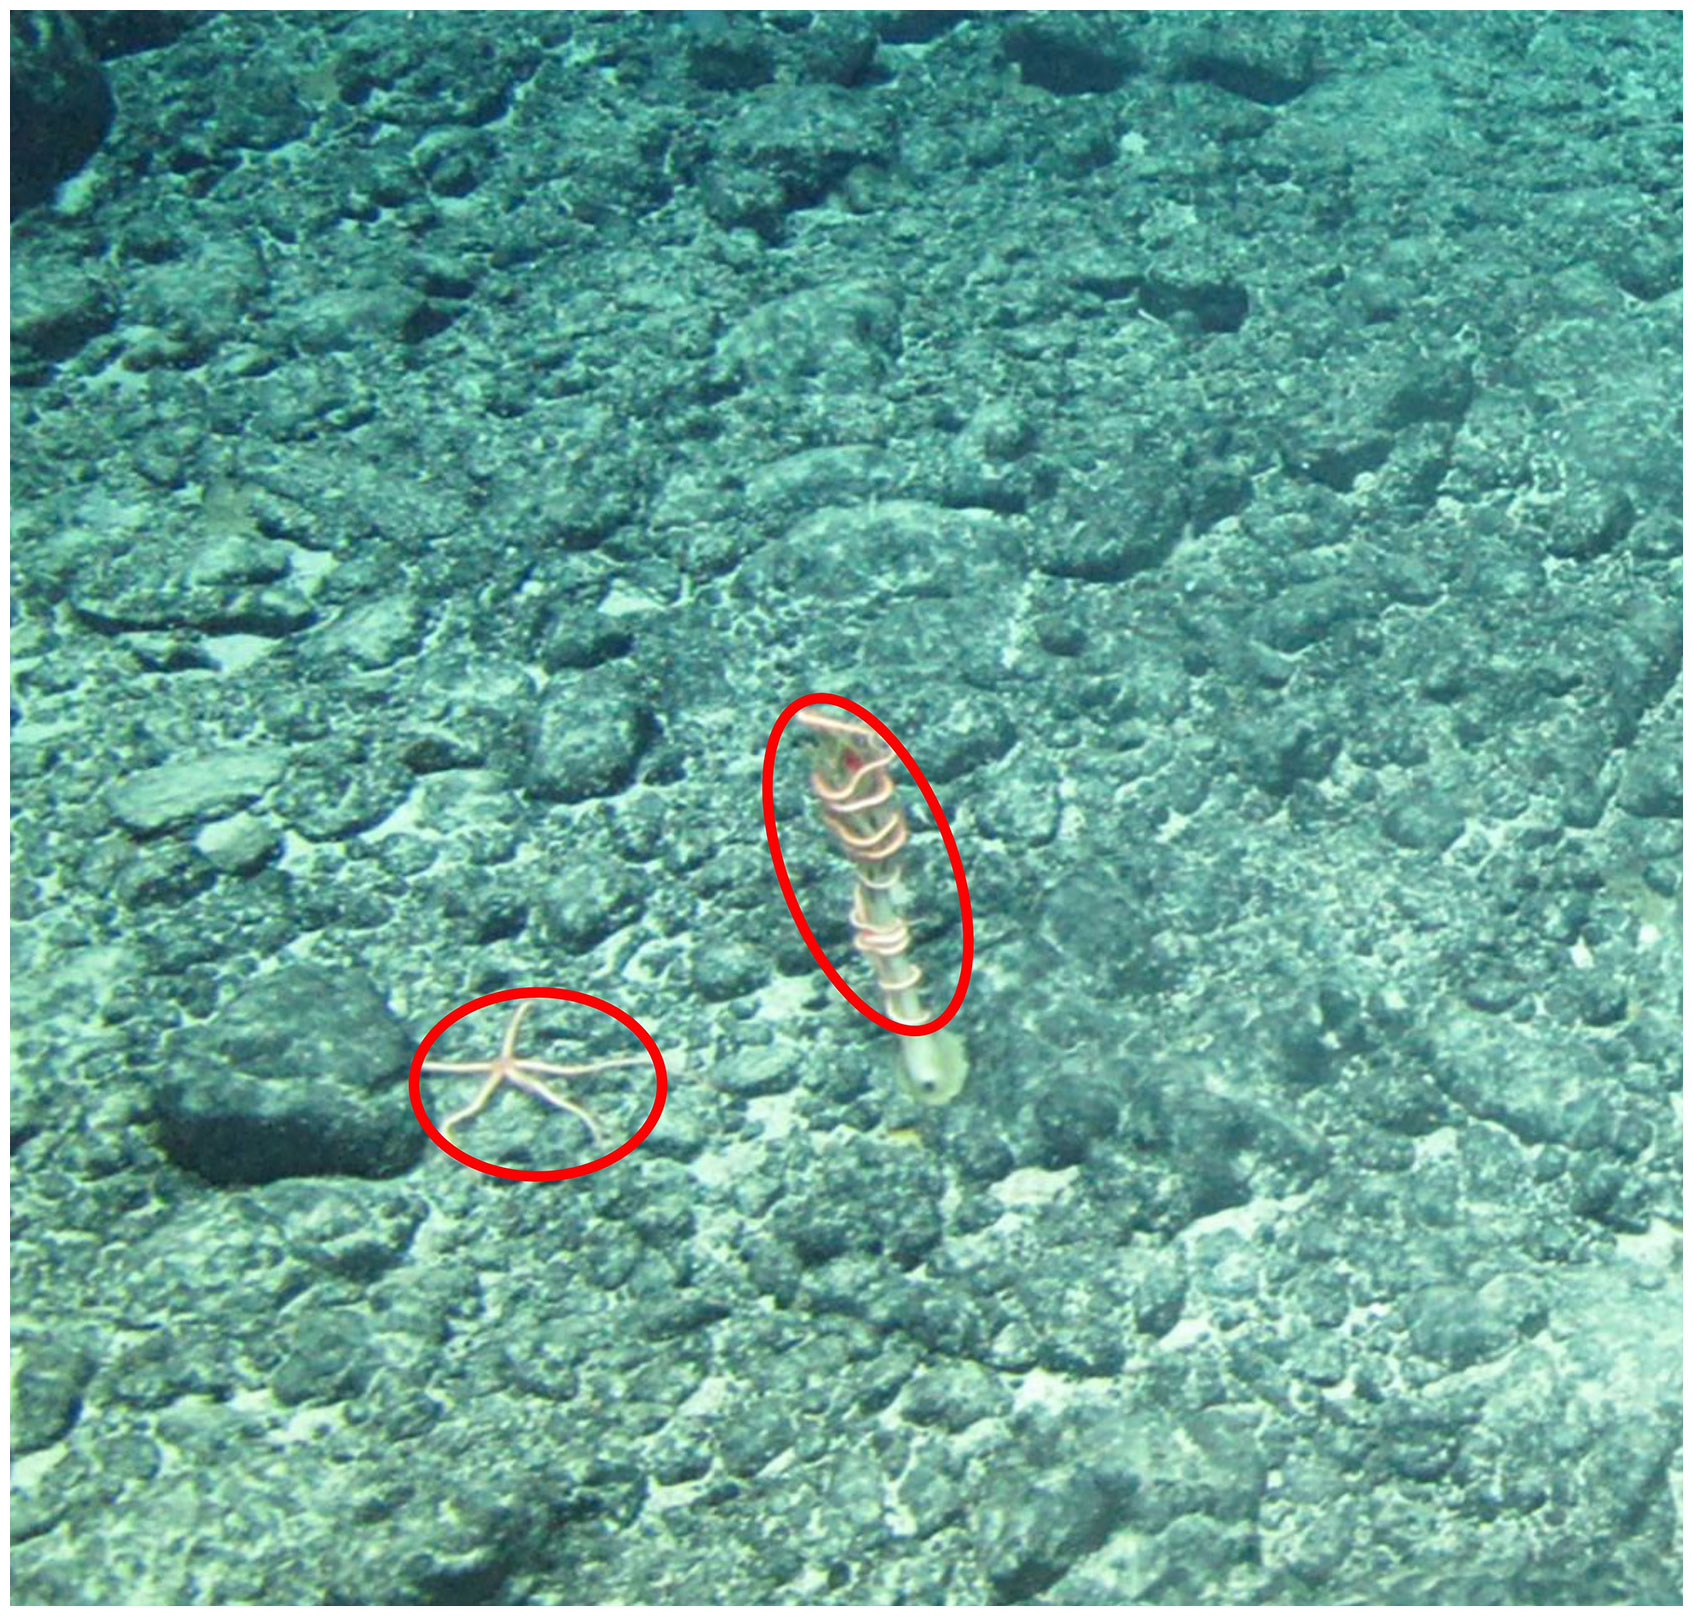
Figure 8 Ophiuroidea in different positions. The red circle on the left indicates the Ophiuroidea on the bedrock. The red circle on the right indicates the Ophiuroidea attached to other organisms.
This paper evaluates the effectiveness of the model using Average Precision (AP), two accuracy averages (mAP0.5 and mAP0.5:0.95), and Giga Floating-point Operations Per Second (GFLOPs). These criteria are widely used for evaluating target detection tasks.
AP refers to the area under the Precision-Recall (PR) curve as shown in the following Equations 7–9.
In the above equations, the True Positive (TP) represents correct detection, i.e., the number of detection frames with IOU greater than or equal to a certain set threshold value; False Positive (FP) represents false detection, i.e., the number of detection frames with IOU less than a set threshold; False Negative (FN) represents the number of targets not detected; P (Precision) stands for detection accuracy, i.e., the proportion of the results predicted by the model that are correct; and Recall (R) stands for the detection rate, i.e., the proportion of all real targets that the model correctly predicts.
mAP refers to the average of all category APs and is given by Equation 10
where m is the number of categories in the test set. In this study, mAP0.5 and mAP0.5:0.95 are used as the evaluation criteria. mAP0.5 represents the average value of APs of all categories when the IOU threshold is set to 0.5, which is mainly used to reflect the recognition ability of the model. mAP0.5:0.95 represents the average value of APs of all categories when the IOU threshold is set from 0.5 to 0.95 in steps of 0.05, which is mainly used to reflect the recognition ability of the model in predicting target locations and boundary regression. GFLOPs are the number of floating-point operations per second, representing the computational power of the model.
The hardware configuration used in this experiment was as follows: an Intel Core i9-9920X processor @ 3.50GHz and an NVIDIA Quadro P5000 graphics card. The software environment was CUDA 11.5 and cuDNN8.3.3, and the operating system was Windows 10. The network model was based on the Pytorch framework, and Python version 3.7 and Pytorch version 1.11.0 were used. In the experiment, the batch size was automatically set according to the number of model parameters and computation, the epoch was pre-set to 1500, and the training was stopped when the number of model iterations was greater than 100, and there was no improvement in the detection effect (mAP0.5 accounts for 5% of the total, and mAP0.5:0.90 accounts for 95% of the total). Using the SGD optimiser, the learning rate was set to 0.01, the momentum was set to 0.9, the initial learning rate was set to 0.01, the cosine annealing strategy was used to reduce the learning rate, and the weight decay was set to 0.0005.
To validate the detection performance of the algorithm proposed in this study and to explore the effect of a particular substructure of the network on the model, we designed nine sets of ablation experiments for DS-YOLO based on YOLOv5. Table 2 shows the results. In the table, “√” represents the introduced module, “-” represents the unquoted module, and bold indicates the optimal effect.
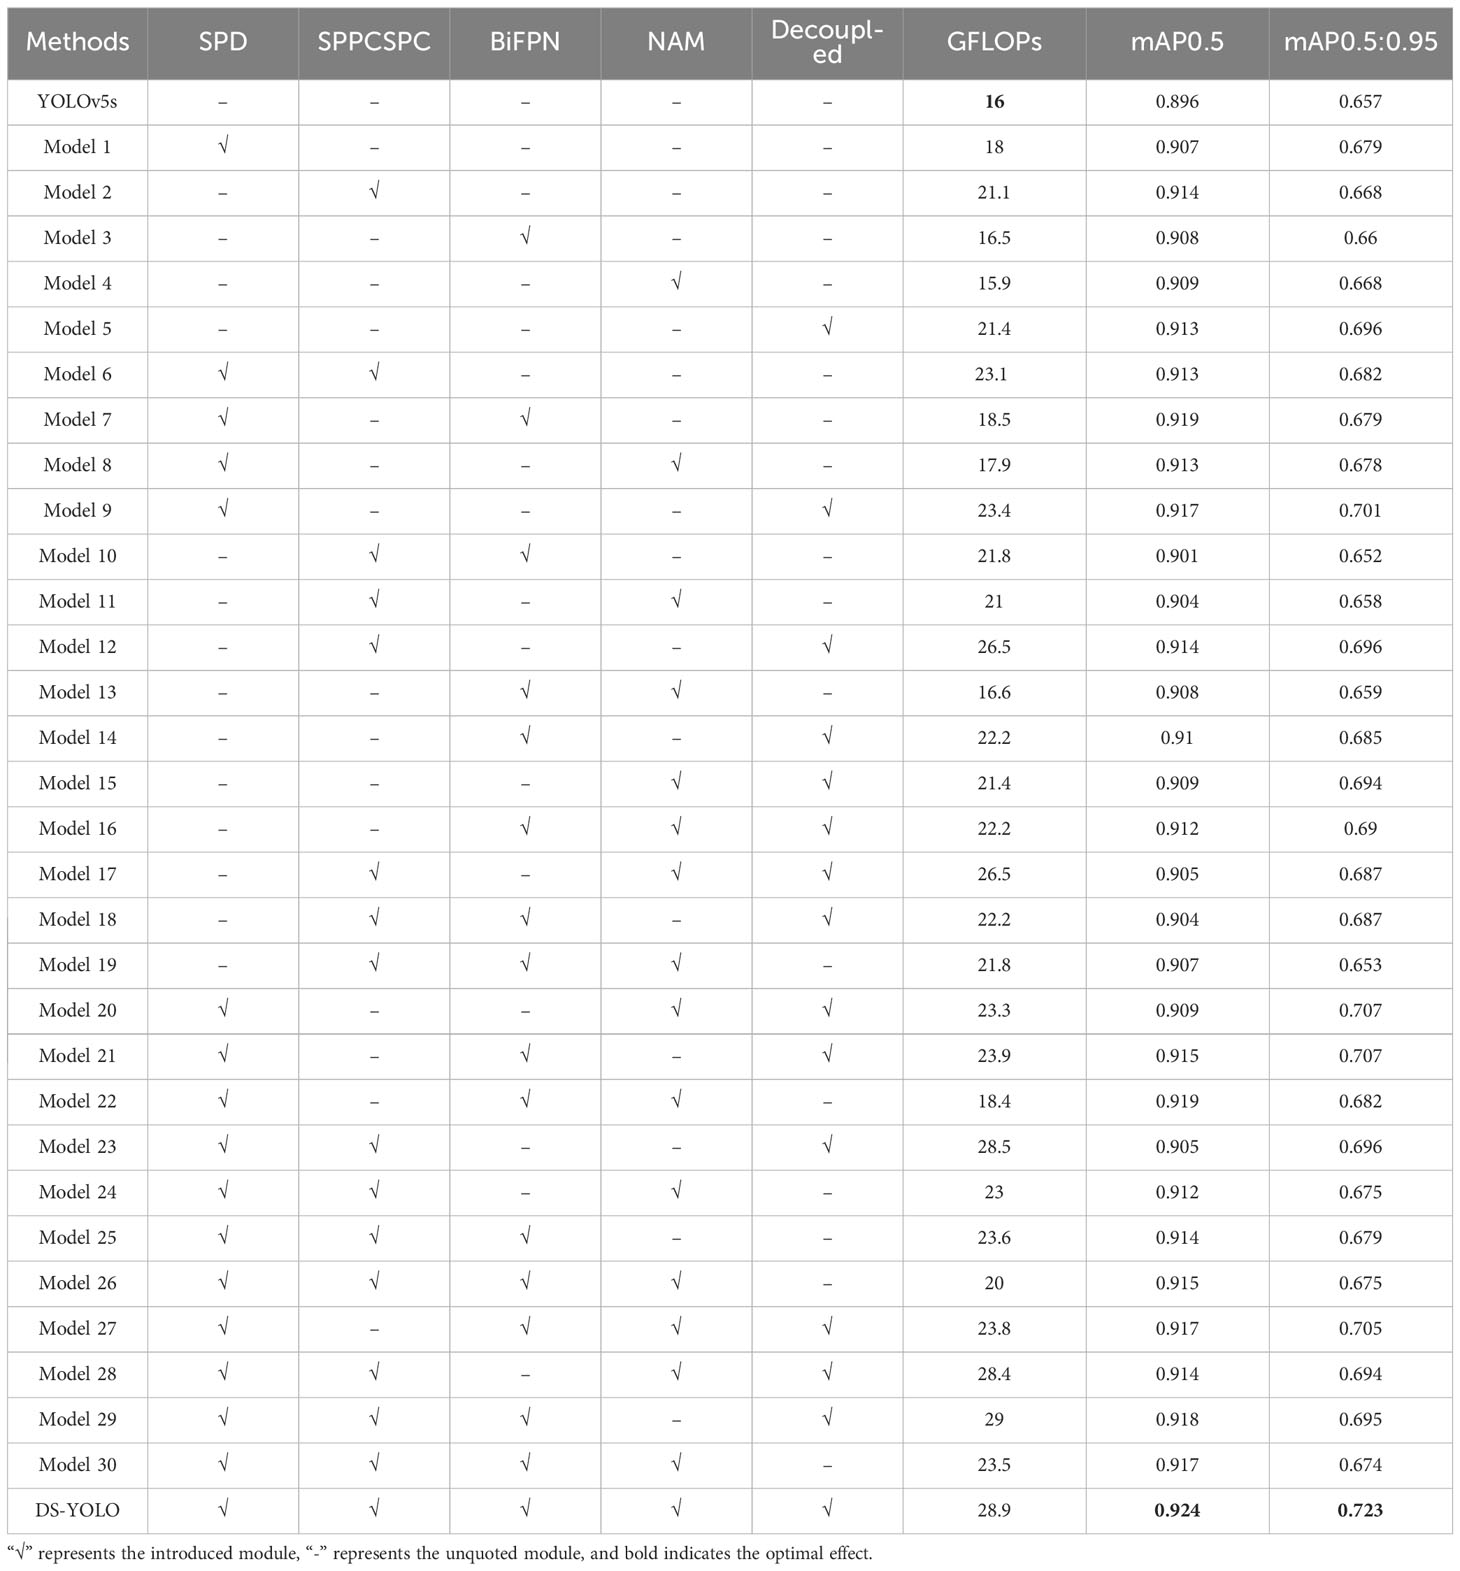
Table 2 Results of DS-YOLO ablation experiments.
The effectiveness of the proposed method can be seen in Table 2. Model 1 improved mAP0.5:0.95 by 2.2% and mAP0.5 by 1.1% after adding the SPD-Conv module, indicating that SPD-Conv could retain feature information to a larger extent. Model 2 replaced the original SPP module with the SPPCSPC module to expand the model’s sensory field with a small amount of computation. mAP0.5:0.95 and mAP0.5 improved by 1.1% and 1.8%, respectively. Model 3 increased mAP0.5:0.95 and mAP0.5 by 1.2% and 0.3%, respectively, while increasing the computation load by a small amount. After adding the decoupled detection head with adaptive partial occlusion to the model, Models 5 and 9 presented satisfactory performance, with mAP0.5:0.95 improving by 3.9% and 5.4%, respectively, indicating that the decoupled detection head reduced the problem of high missed detection rate due to overlap and occlusion during the detection process. By incorporating all the improved methods presented in the table, it can be seen that DS-YOLO improved mAP0.5:0.95 and mAP0.5 by 6.6% and 2.8%, respectively, relative to YOLOv5, suggesting that it is highly effective in detecting deep-sea megabenthic organisms.
Figure 9 shows that DS-YOLO converged faster, showed better detection performance, and had less loss during training than YOLOv5s. To further validate the effectiveness of DS-YOLO, this study compared the algorithm with YOLOv5s AP0.5:0.95 for various organisms, and the results are shown in Figure 10.
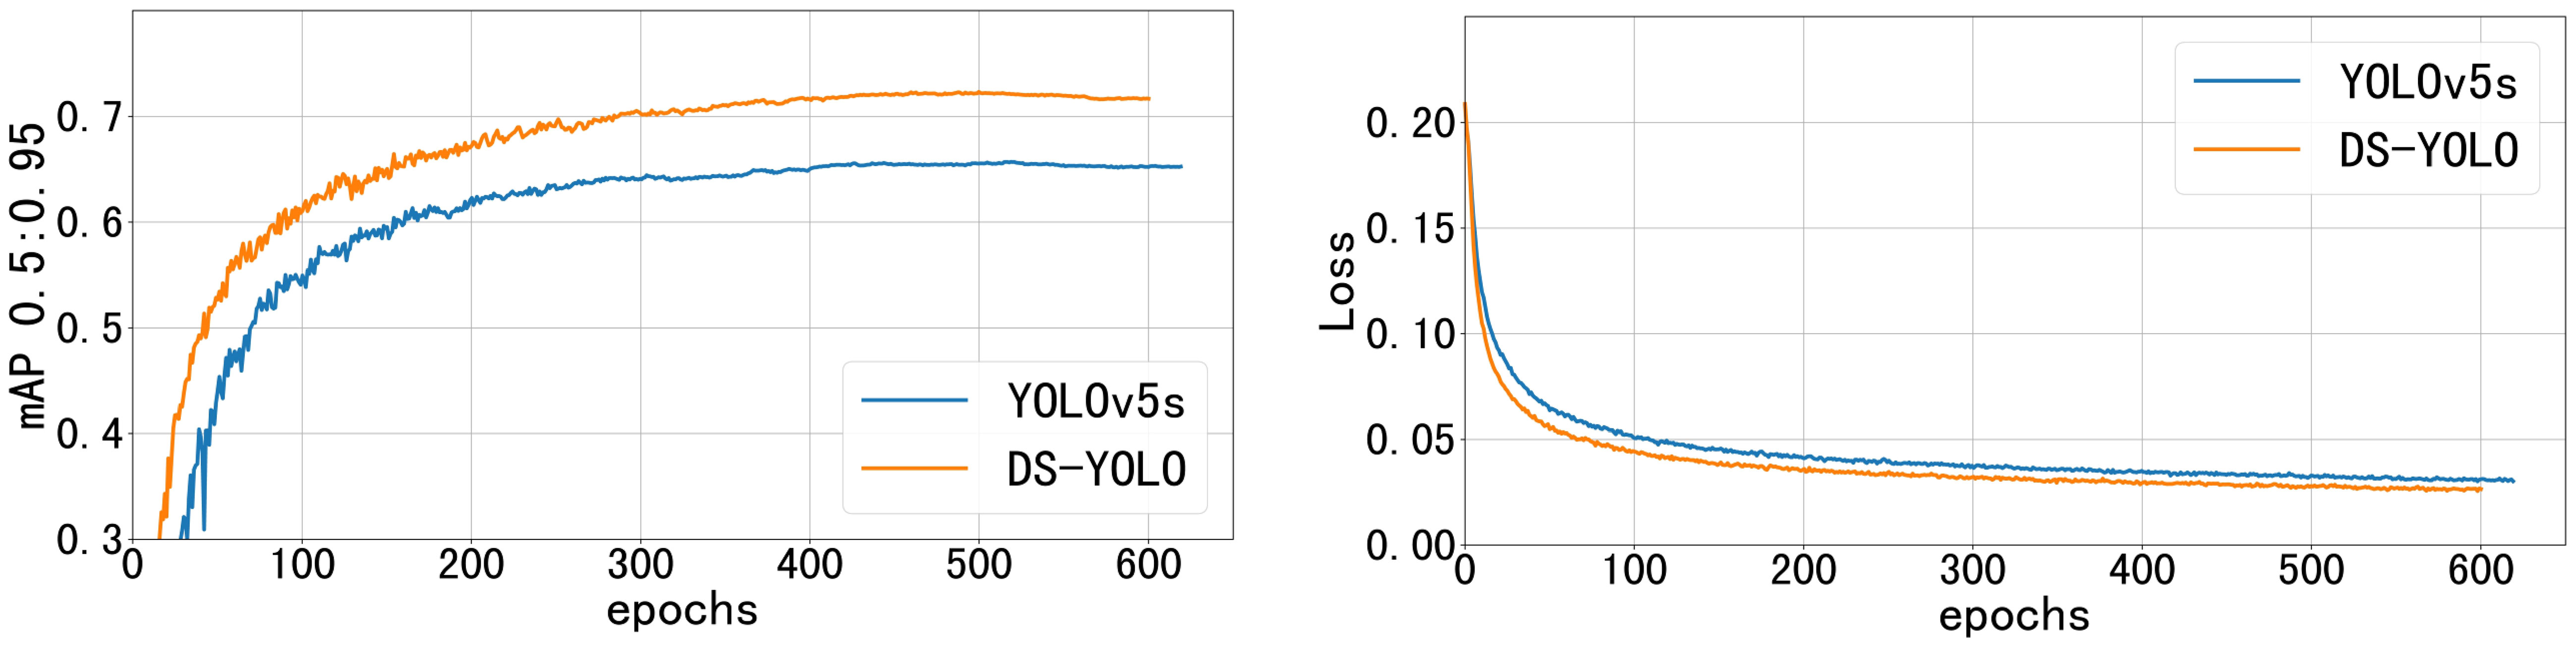
Figure 9 Fitting curves of YOLOv5s and DS-YOLO.
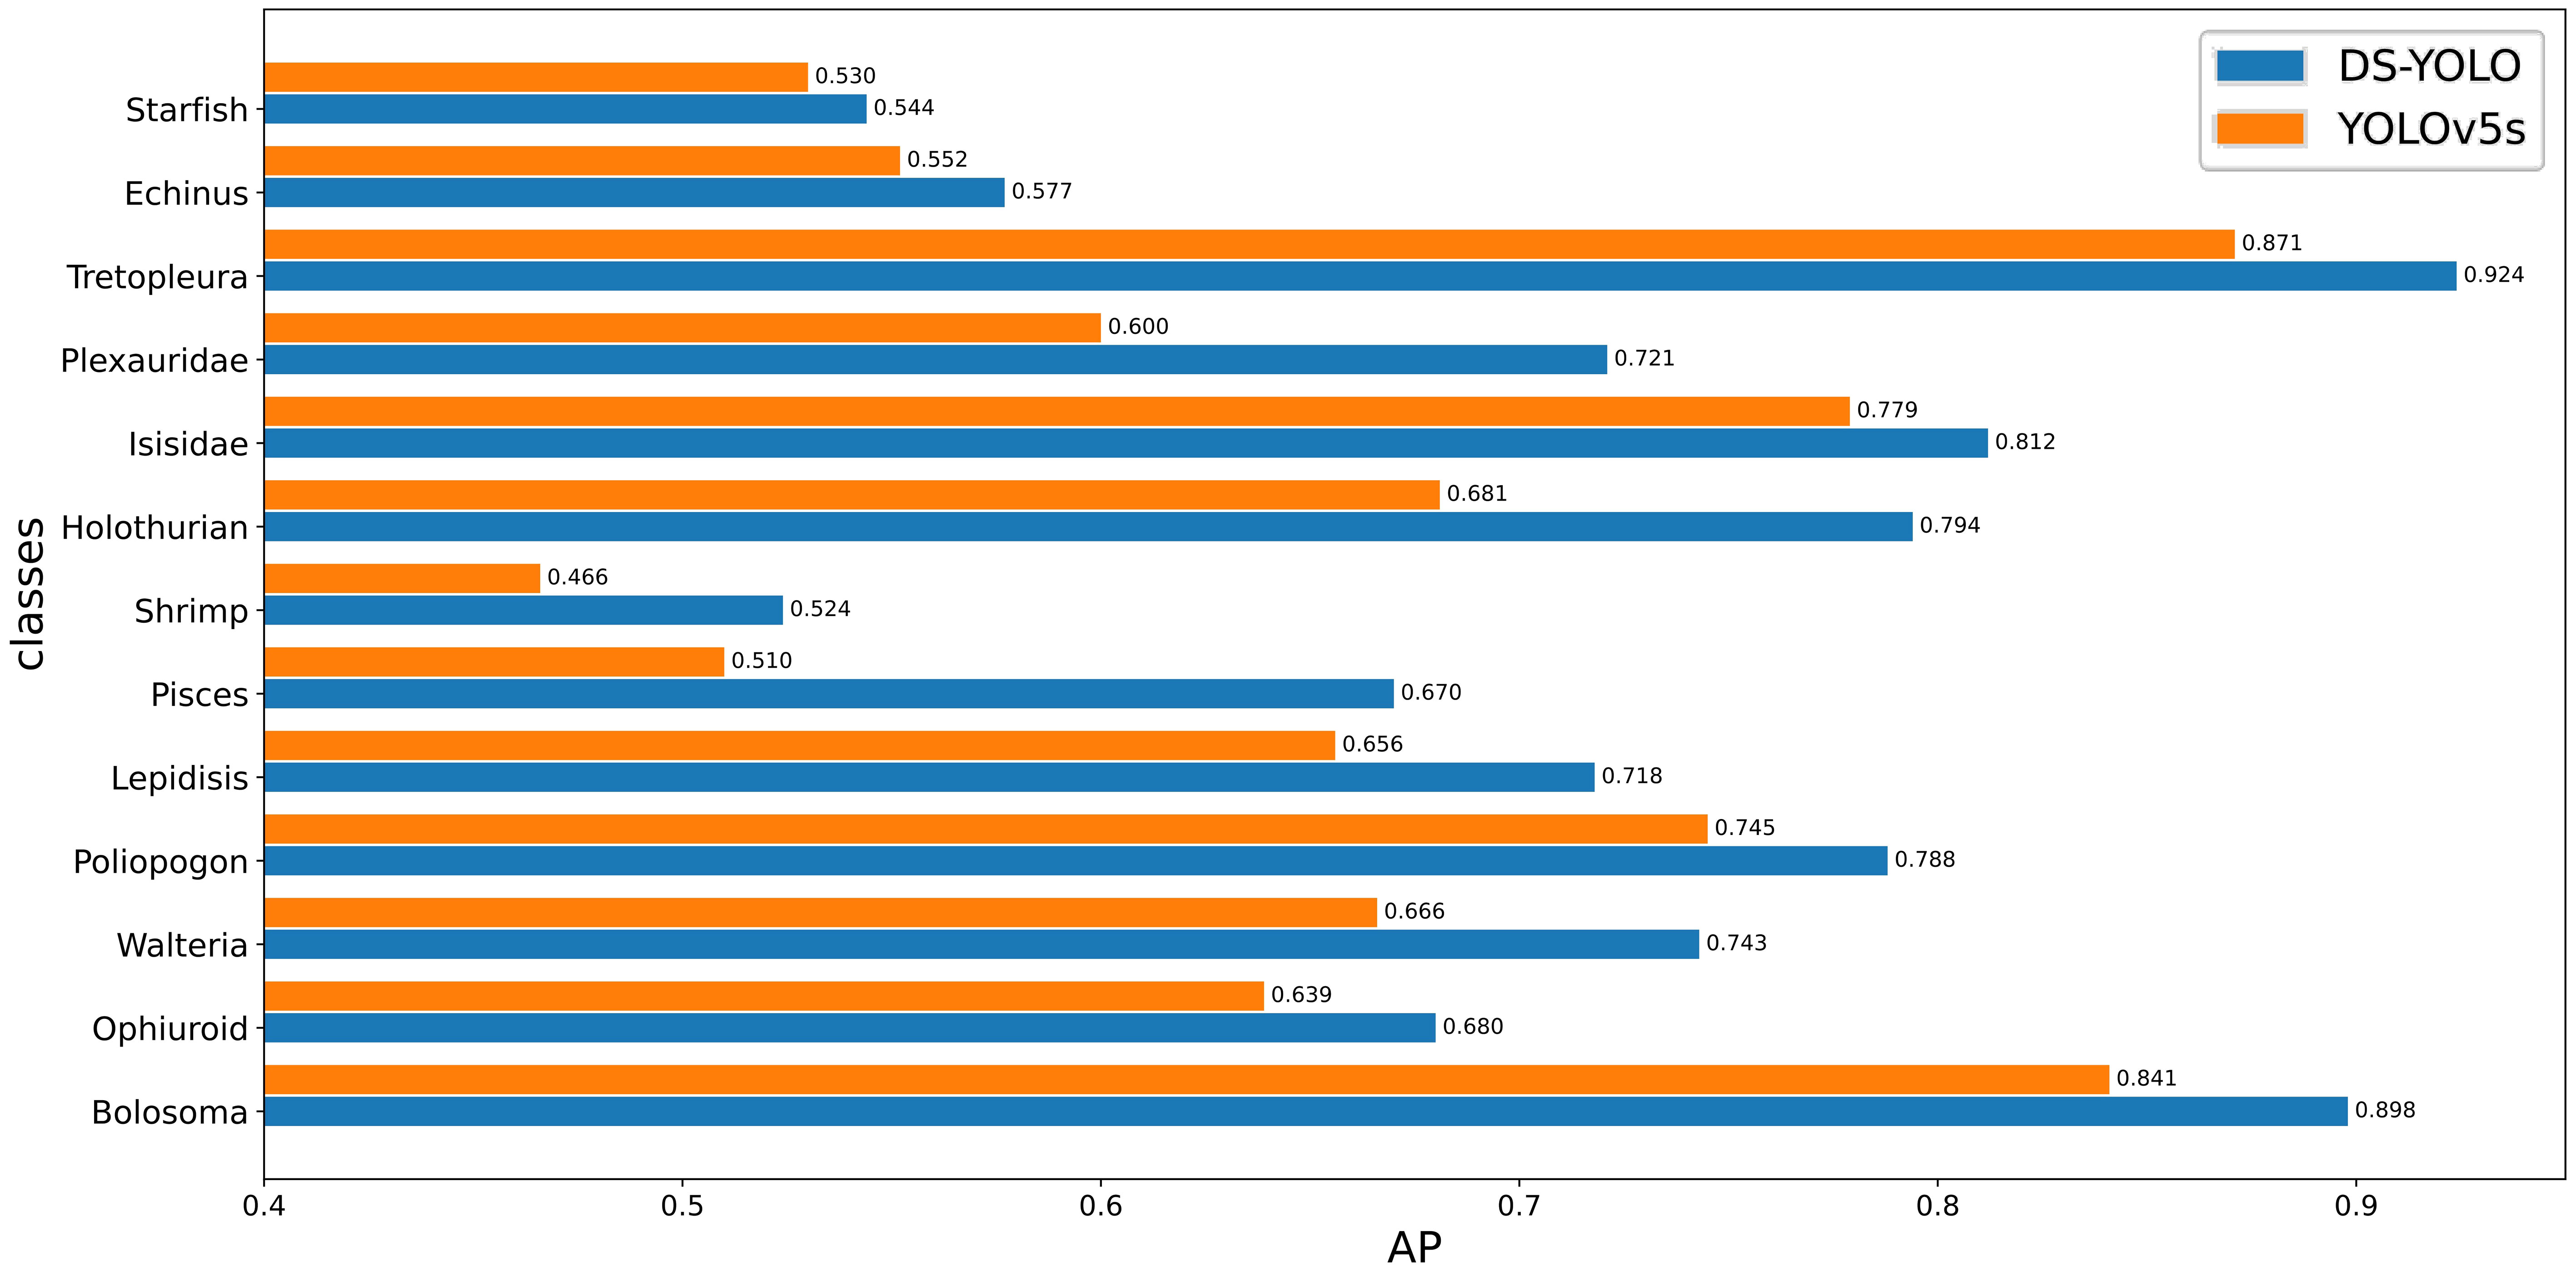
Figure 10 Comparison of AP values for various organisms.
As shown in Figure 10, the mAP0.5:0.95 of DS-YOLO proposed in this paper improved by 6.6% relative to YOLOv5s. Pisces showed the largest improvement of 16.0%, followed by plexauridae and holothuroidea, with 12.1% and 11.3%, respectively. For the detection of various other marine megabenthic organisms, the method proposed in this paper had different degrees of improvement. These experiments indicate that, relative to YOLOv5, DS-YOLO improved the classification and localization tasks and detection performance.
To verify the model performance and detection effect of DS-YOLO, five other models were selected for comparison experiments. All the YOLO series algorithms used in the experiments met the real-time detection requirements, and the results are shown in Table 3. The detection effect of DS-YOLO was the best in both mAP0.5:0.95 and mAP0.5 evaluation metrics. Regarding GFLOPs, DS-YOLO was better than YOLOv4-tine and YOLOv5s, but the increase in inference time is acceptable considering the enhanced performance. DS-YOLO reached 84.7 FPS, which makes the model suitable for deployment on mobile platforms. Based on the above, it can be concluded that the DS-YOLO algorithm outperforms the common YOLO family of algorithms for deep-sea megabenthic detection and meets real-time requirements.
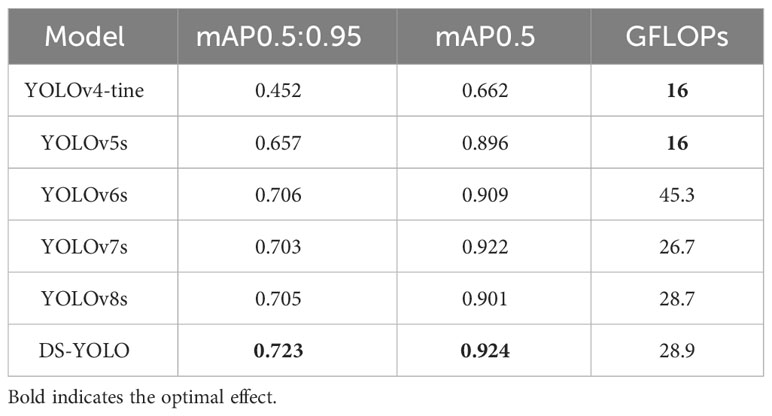
Table 3 Comparative experimental results.
The trained models were tested against small targets, poor illumination, partial occlusion, high exposure, target overlap, and special background conditions, and the organisms included bolosominae, ophiuroidea, dead sponges, pheronematidae, lepidisis, isididae, and echinus and starfish on the public dataset. The automatic collection of deep-sea megabenthic organisms requires high detection accuracy, so the confidence threshold of the detector was set to 0.7. Figure 11 shows some of the results for YOLOv5 and DS-YOLO. In the first set (A, B) of comparison plots, YOLOv5 did not detect the small-scale bolosominae and pheronematidae, and DS-YOLO successfully detected the two small, missed targets, demonstrating a strong capability in small target detection. The second group (C, D) shows that a large part of the echinus at the top of the comparison image was occluded, causing YOLOv5 to fail to detect it successfully, However, DS-YOLO detected its position correctly, showing that DS-YOLO had a better ability to detect organisms that are partially occluded. The third group (E, F), there is a cross between the two corals on the upper right. YOLOv5 misdetected them, but DS-YOLO successfully showed the edge area, demonstrating its excellent ability to detect overlapping organisms. In summary, the detection performance of DS-YOLO proposed in this paper outperforms that of the original YOLOv5 in multiple extreme scenarios in the deep sea and on public datasets, and DS-YOLO is therefore suitable for use in complex deep-sea environments.
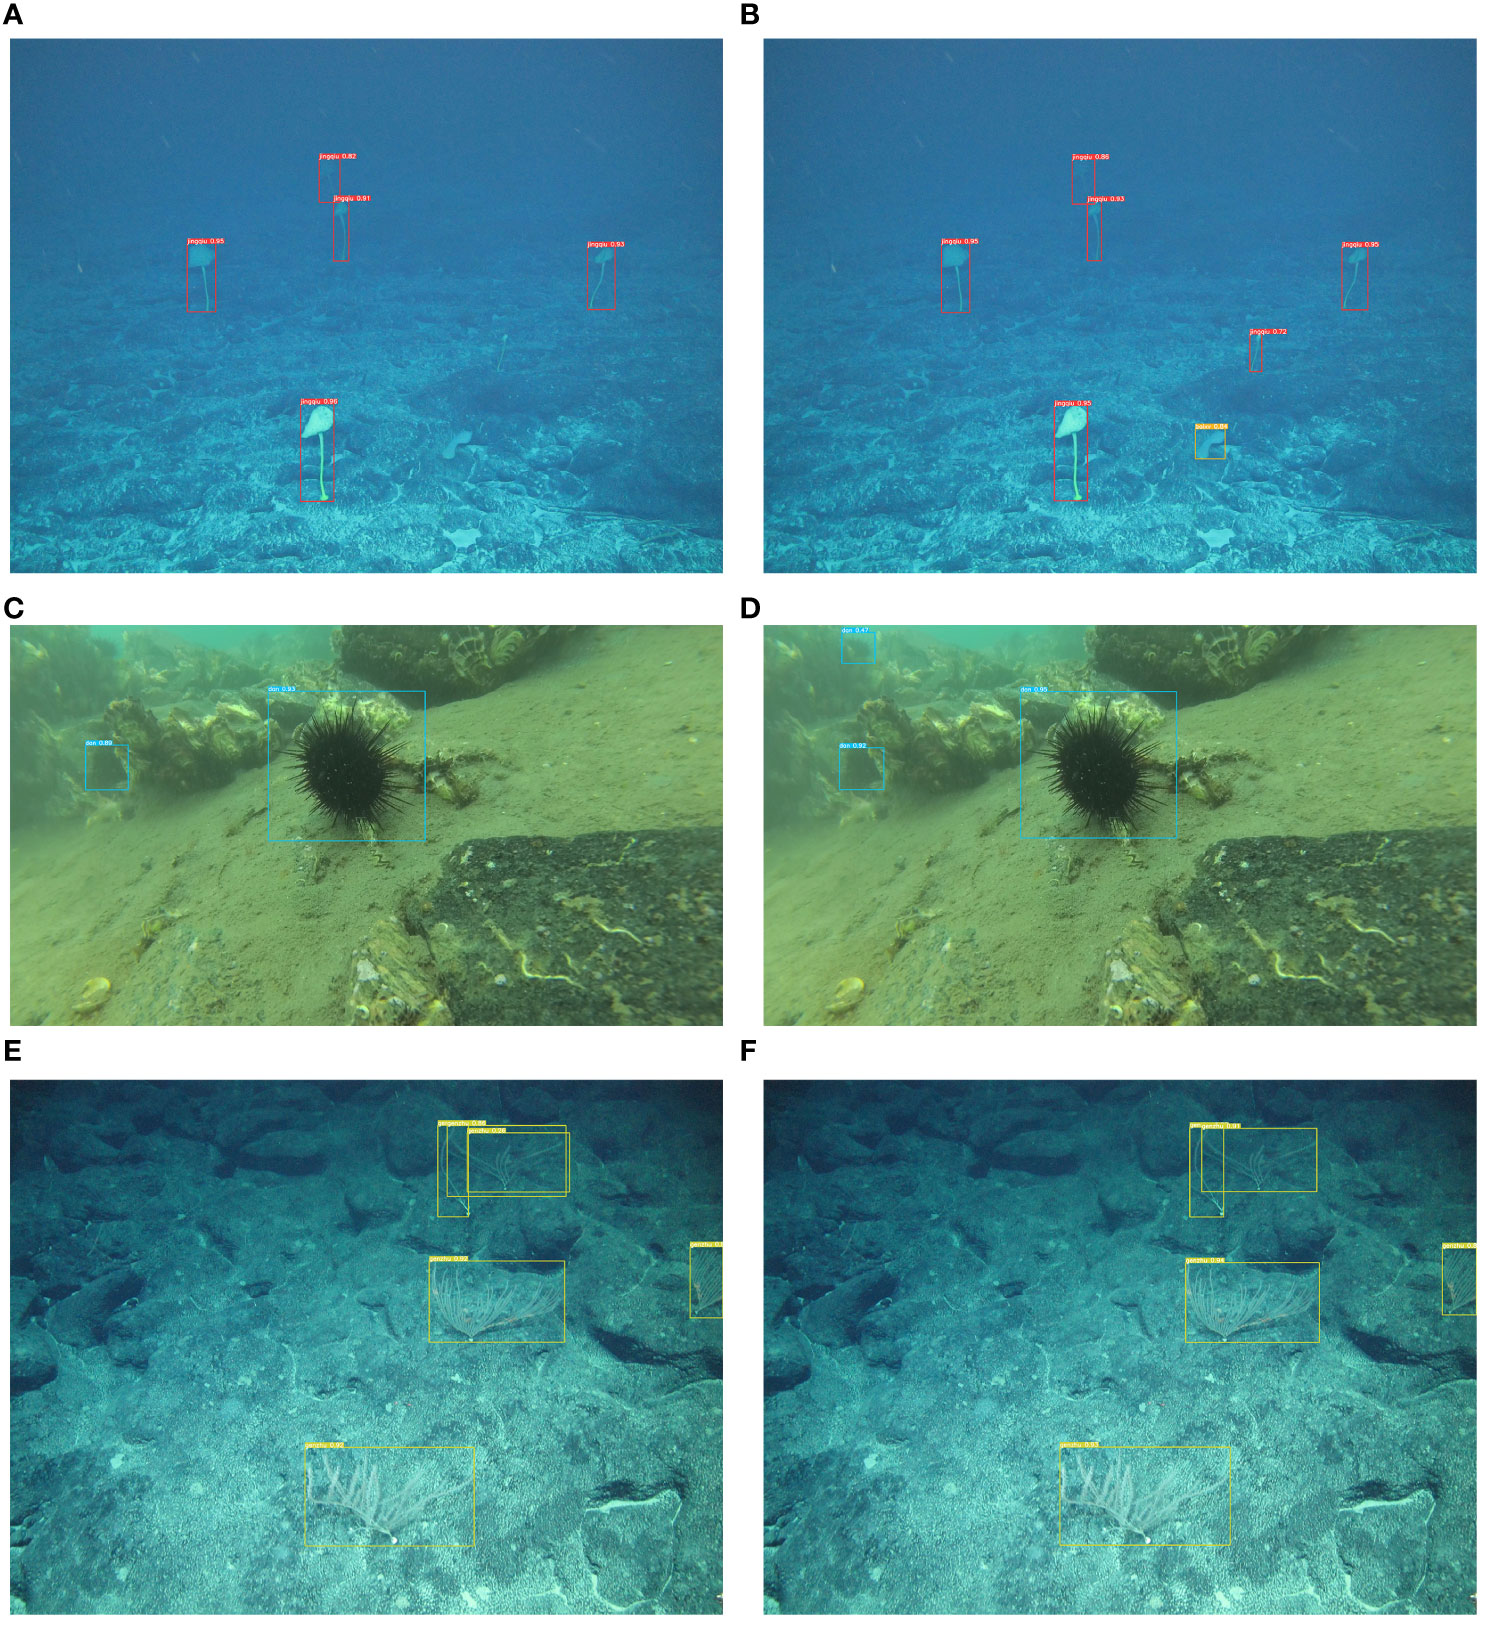
Figure 11 Comparison of detection results of different methods (A, C, E) results from YOLOv5, and (B, D, F) results from DS-YOLO.
To further validate the capability of DS-YOLO for video counting of deep-sea megabenthic organisms, this paper demonstrates the effectiveness of DS-YOLO+DeepSORT for biological target tracking. DeepSORT first obtains a predicted trajectory using the Kalman filter prediction module. Then, a Hungarian algorithm is used to determine how well the detection result of the current frame matches the predicted trajectory. The specific calculation Equation 11 is as follows:
Where ay is the position of the y target detected by the detection algorithm, tx is the position of the target predicted by the x tracker, and By is the covariance matrix, and the above formula indicates the fitting degree between the y detection result and the x motion trajectory. Finally, incorrect trajectories are eliminated during tracking to complete target tracking, and the Kalman filter module updates the corrected trajectories. The experimental video comes from two dives in the China Oceanic 80 voyage with a frame rate of 30, and this paper stipulates that the counting is valid when the number of frames in which the target appears exceeds 60. The object tracking results are shown in Table 4.
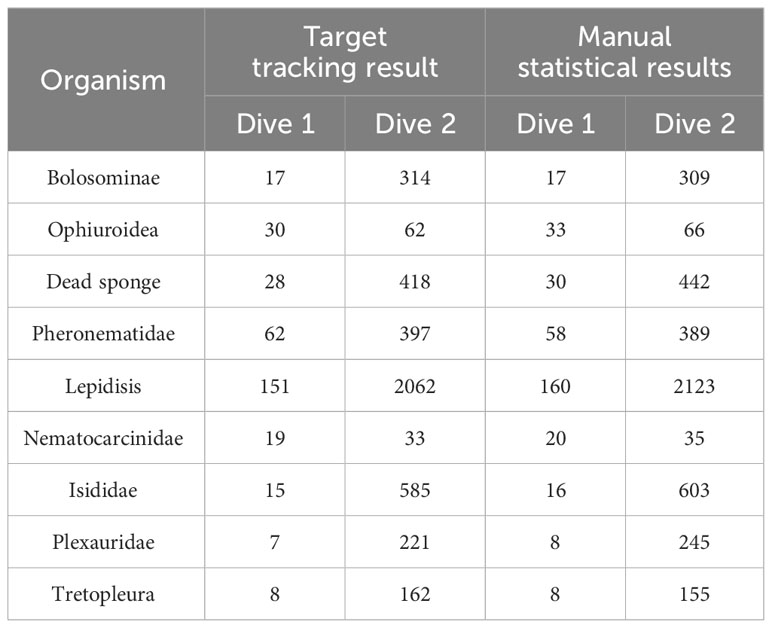
Table 4 Comparison between target tracking and manual statistical results.
When the organism is judged as an effective organism, the model will take the position information of the deep-sea submersible as the actual position of the organism. This method of determining the position will produce some errors, but the errors are usually regarded as within the acceptable range. Since the submersible can get its actual position every 7 seconds, we think that the submersible’s diving trajectory is a broken line obtained by connecting all the actual positions. When the deep-sea submersible completes a dive, the position of all creatures will be recorded on the dive trajectory. We calculate the length of the broken line from the time the submersible sees the seabed. When this length is approximately 100 meters, we calculate the density of the biological line once. The specific calculation method is shown in the following Equation 12:
In the above formula, ld represents the linear density of organisms, q represents the number of organisms, and d≈100 represents the diving distance of the actual submersible. The number of occurrences of organisms per 100 m, i.e., the line density, was used to represent the density of organisms. The results are shown in Figure 12, where the vertical axis represents the line density of organisms, and the horizontal axis indicates the distance traveled along the seafloor after the submersible bottomed, which was approximately 3270 and 2990 m for Dive 1 and Dive 2, respectively. Figures 12A, B shows the line densities of total organisms for dive 1 and dive 2, respectively, with the density of organisms in dive 2 being approximately 13.81 times that in dive 1 and with organisms occurring along the trajectory. Figures 12C, D shows the line densities of various organisms at dives 1 and 2, respectively, with lepidisis occurring the most (49.3%) at dive 1, followed by pheronematidae (18.4%); a small proportion of ophiuroidea (8.90%) and dead sponges (8.31%), as well as other organisms, were also present. Although the density of organisms in dive 2 was much higher than in dive 1, their community structures were similar. Both dives were dominated by lepidisis (62.2%), pheronematidae (9.33%), and dead sponges (9.83%). A small number of bolosominae and plexauridae were also present. This experiment demonstrates the utility of the DS-YOLO model proposed in this paper in combination with DeepSORT in calculating the bio-density. In addition, DS-YOLO+DeepSORT achieves a frame rate of 46.5 frames per second, which is suitable for deployment on underwater submersibles for real-time tracking and counting of organisms.
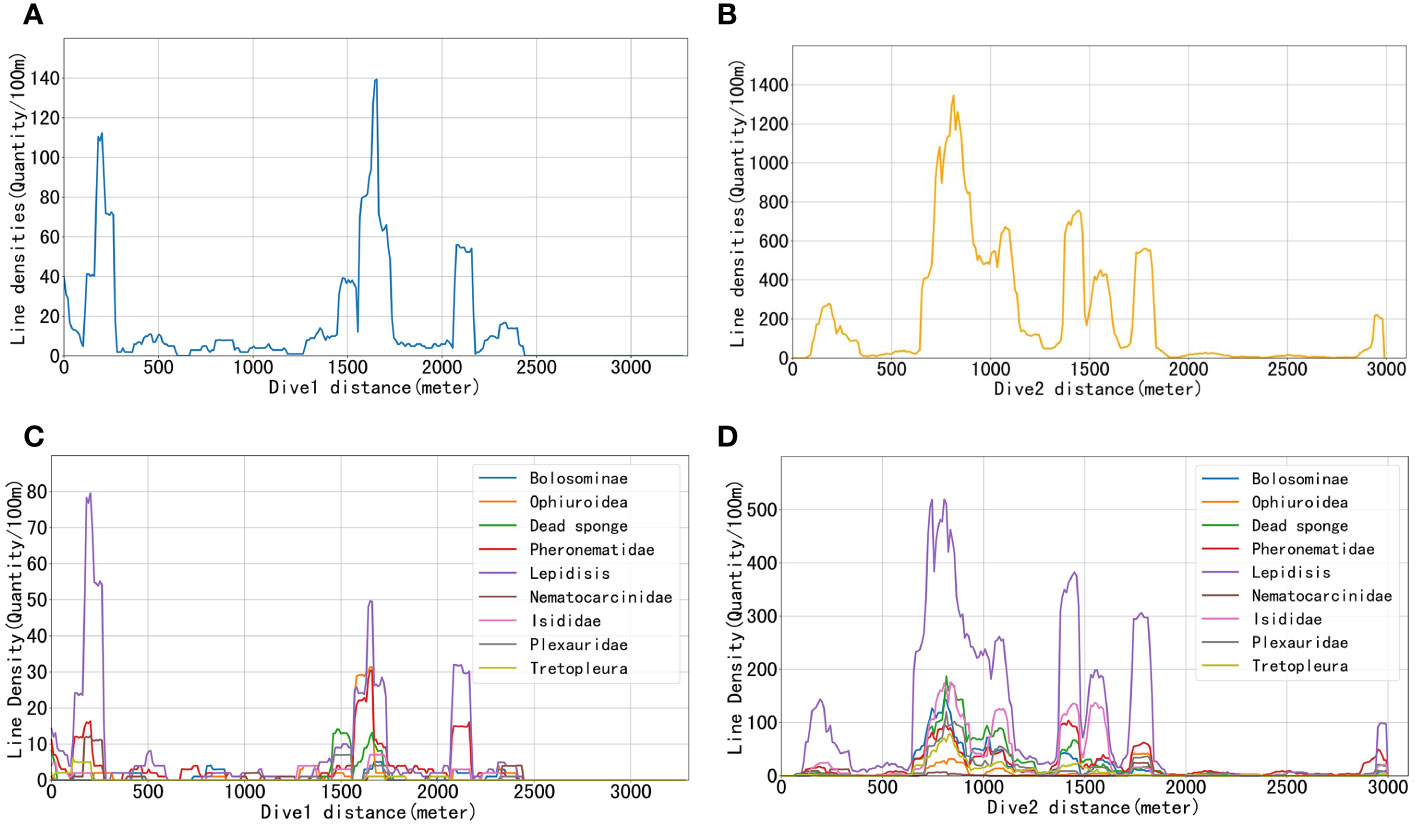
Figure 12 Schematic representation of biological density. (A, B) Line densities of organisms combined at dives 1 and 2, respectively. (C, D) Line densities of different organisms at dives 1 and 2, respectively.
Due to the rapid development of machine learning, its use is increasing in marine engineering, such as aquaculture, ship inspection, and plankton detection. Automatic identification of deep-sea megabenthic organisms through visual images is crucial for deep-sea ecological research. Compared with deep-sea images, deep-sea videos have good spatial extensibility and can better express the changes of deep-sea organisms in the positional dimension. Thus, deep-sea videos can contain more and more accurate biological information. It should be noted that different species in the dataset we produced do not have the same taxonomic rank, e.g., Ophiuroidea belongs to the class level, while Lepidisis belongs to the family level. This is due to the generally small size and similar features of the ophiuroidea, making it almost impossible to identify serpent tails from different families relying on video alone. Anthozoa are larger and have greater morphological differences between families. This characteristic means that the dataset must be produced with appropriate trade-offs between organisms at different taxonomic levels based on their morphological features. Better results can be obtained if a class of organisms is divided as finely as possible based on morphology. To prove this point, in this paper, we merged the bolosominae, pheronematidae, and tretopleura in the original dataset into the class hexactinellida, and we merged the lepidisis, isididae, and plexauridae into the class anthozoa. The combined dataset includes nine organisms ranked as phyla. In the western Pacific seamounts, hexactinellida and anthozoa are typical species, and we analyzed their line density variations using the methods of Section 3.4.4. Hexactinellida and anthozoa are the main macrobenthos in the mountainous areas of the western Pacific Ocean. Deep-sea hexactinellida are generally attached to hard substrates, and complex and abundant hydrodynamic forces bring organic matter produced in shallow waters to the deep sea to form large hexactinellida forests. Deep-sea seamounts and canyons are ideal areas for hexactinellida development because of their rich nutrition and complex topography. Cold-water hexactinellida communities attached to bedrock are similar to terrestrial forests, providing a good habitat for active animals. Anthozoa are also one of the important benthic organisms, which are distributed from intertidal zone to deep sea. In the deep sea, anthozoa is the dominant species in the deep sea, second only to hexactinellida. At the same time, anthozoa contains a large number of active substances and rich microorganisms, which is the focus of current research. Anthozoa symbiotic microorganisms are also considered to play an important ecological role in the carbon, nitrogen and sulfur cycle of the earth’s biosphere. This paper focuses on the target detection results of two typical organisms based on models of different data sets. Figures 13A, B respectively show the prediction results of training weights using data sets with different biological classification levels, respectively, and compare them with the results of the manual video analysis. It can be seen in Figure 13 that the dataset made by prioritizing biomorphology is closer to the manual results than the dataset made by considering only biological classification. In the target detection task, it is not possible to consider only biological classification and ignore the inherent morphology among organisms, and this idea can be extended to other fields as well.
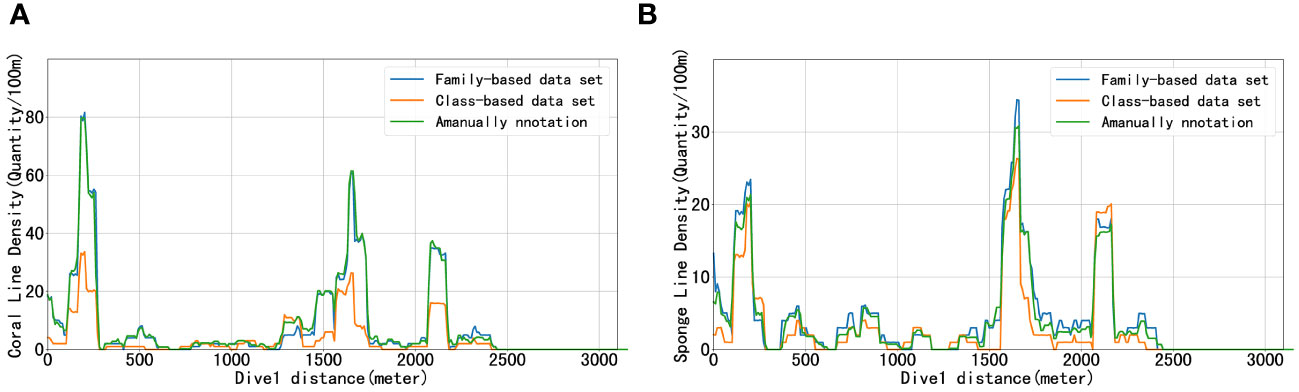
Figure 13 Dive1 linear density results based on different data sets. (A) is the linear density of coral. (B) is the linear density of sponge.
Considering the complex deep-sea seabed environment, this paper proposes a deep learning-based deep-sea megabenthic organism detection method, DS-YOLO, to provide accurate detection of deep-sea organisms. When investigating the structure of biological communities in deep-sea areas, it is necessary to photograph as many benthic organisms as possible. DS-YOLO has a better detection effect on organisms in a single image than YOLOv5s and can be combined with DeepSort to track and count organisms. The algorithm in this paper can be combined with the position information of the deep-sea submersible to show the bio-distribution points on the map in real time and further calculate the bio-density. The method proposed in this paper can initially reveal the distribution characteristics of biological resources and their community structure features in the investigated area and provide data support for the interrelationship between biodiversity and habitat.
DS-YOLO enables the detection of deep-sea organisms in small targets, uneven illumination, and special scenarios, and the model detection capability exceeds that of common detection methods. Compared with YOLOv5, DS-YOLO increases part of the computational load and detection time, so it still has room for improvement. There are four avenues for future research. First, a more lightweight model should be developed for lightweight deep-sea survey equipment to ensure acceptable detection accuracy. Second, it is necessary to expand the dataset by using data expansion technology because deep-sea megabenthic organisms generally grow below 1,000 m, and domestic and international visual survey data are scarce, resulting in little visual information and the biomass of different species not being balanced. Then, the network structure can be fine-tuned to adapt to different deep-sea organisms and lighting conditions to enhance the application range of the model. Finally, a laser scale should be developed to measure the size of huge benthic organisms and the distance from the camera, combined with intelligent control technology to automatically acquire organisms or other targets.
Obtaining biological samples is an indispensable step in deep-sea biological research. However, due to the special characteristics of the deep sea, conducting deep-sea investigations often requires greater costs than those in the shallow sea. In order to obtain a sufficient number of biological samples for each dive of a deep-sea submersible, we often use biodistribution prediction models to assess the density of various organisms based on the environmental information of the seafloor to further design the dive sites and routes. In future research, we plan to embed the biodistribution prediction model into the YOLO tail so that the predicted species of organisms for each dive result from the mutual integration of image features and the density of organisms. By doing so, it is expected that the false detection rate of YOLO can be further reduced. With the same dive cost, a more accurate biological composition of the area is obtained, providing data support for further ecosystem studies.
Deep-sea detection of megabenthic organisms is significant to marine life sciences and resource development. The research reported in this paper aims to improve the intelligent detection of megabenthic organisms in deep-sea environments. Considering the special environment and organisms in the deep sea, the proposed DS-YOLO was improved in five versions of YOLOv5. First, the SPD-Conv module was introduced to improve the model’s ability to detect small targets. Second, SPPCSPC enhances the model’s feature fusion capability when the organism is partially occluded. Then, BiFPN used both Add and Concat structures to increase the feature extraction ability of the model at different scales. Then, a NAM attention mechanism was added at the end of the Neck layer to increase the weight of salient features. Finally, the decoupled detection head reduced the mutual interference between classification and localization tasks, improved localization capability, and reduced the leakage detection problem. DS-YOLO had good detection results on homemade datasets fused with deep-sea video and URPC2020, with mAP0.5:0.95 reaching 72.3% and mAP0.5 reaching 92.4%. Compared with YOLOv5s, mAP0.5:0.95 and mAP0.5 improved by 6.6% and 2.8%, respectively, while the frame rate reached 84.7, which meets real-time requirements. DS-YOLO was combined with DeepSORT to estimate the density of deep-sea megabenthic organisms, which can be used to study the species richness and community structure in the deep sea. DS-YOLO is better than popular target detection methods and is most suitable for detecting deep-sea megabenthos.
The original contributions presented in the study are included in the article/supplementary material. Further inquiries can be directed to the corresponding author.
WW: Writing – original draft, Data curation, Methodology, Software. YS: Writing – review & editing, Conceptualization, Formal analysis, Resources, Supervision. WG: Formal analysis, Project administration, Resources, Writing – review & editing. WX: Funding acquisition, Supervision, Validation, Writing – review & editing. YZ: Visualization, Writing – review & editing, Validation. DH: Investigation, Writing – review & editing, Validation.
The author(s) declare financial support was received for the research, authorship, and/or publication of this article. 1. This research was supported by the National Key Research and Development Program of China (No.2022YFC2808305). 2. This research was supported by the National Key Research and Development Program of China (No.2023YFC2812903).
The authors declare that the research was conducted in the absence of any commercial or financial relationships that could be construed as a potential conflict of interest.
All claims expressed in this article are solely those of the authors and do not necessarily represent those of their affiliated organizations, or those of the publisher, the editors and the reviewers. Any product that may be evaluated in this article, or claim that may be made by its manufacturer, is not guaranteed or endorsed by the publisher.
Al Muksit A., Hasan F., Emon M., Haque M. R., Anwary A., Shatabda S. (2022). YOLO-Fish: A robust fish detection model to detect fish in realistic underwater environment. Ecol. Inf. 72, 101847. doi: 10.1016/j.ecoinf.2022.101847
Ancuti C., Ancuti C., Haber T., Bekaert P. (2012). “Enhancing underwater images and videos by fusion,” in Proceedings of the 2012 IEEE conference on computer Vision and pattern recognition. (Providence, RI, USA: IEEE), 81–88. doi: 10.1109/CVPR.2012.6247661
Azmi K., Ghani A., Yusof Z., Ibrahim Z. (2019). Natural-based underwater image color enhancement through fusion of swarm-intelligence algorithm. Appl. Soft Comput. 85, 105810. doi: 10.1016/j.asoc.2019.105810
Bochkovskiy A., Wang C., Liao H. (2020). Yolov4: Optimal speed and accuracy of object detection. arXiv. doi: 10.48550/arXiv.2004.10934
Dalal N., Triggs B. (2005). “Histograms of oriented gradients for human detection,” in 2005 IEEE computer society conference on computer vision and pattern recognition (CVPR'05), Vol. 1. (San Diego, CA, USA: Ieee), 886–893. doi: 10.1109/CVPR.2005.177
Fan H., Zhu D., Li Y. (2021). “An improved yolov5 marine biological object detection algorithm,” in 2021 2nd International Conference on Artificial Intelligence and Computer Engineering (ICAICE). (Hangzhou, China: IEEE), 29–34. doi: 10.1109/ICAICE54393.2021.00014
Ge Z., Liu S., Wang F., Li Z., Sun J. (2021). Yolox: Exceeding yolo series in 2021. arXiv. doi: 10.48550/arXiv.2107.08430
Girshick R. (2015). “Fast r-cnn,” in 2015 IEEE International Conference on Computer Vision (ICCV). (Santiago, Chile), 1440–1448. doi: 10.1109/ICCV.2015.169
Girshick R., Donahue J., Darrell T., Malik J. (2014). “Rich feature hierarchies for accurate object detection and semantic segmentation,” in 2014 IEEE Conference on Computer Vision and Pattern Recognition. (Columbus, OH, USA), 580–587. doi: 10.1109/CVPR.2014.81
Hu J., Zhao D., Zhang Y., Zhou C., Chen W. (2021). Real-time nondestructive fish behavior detecting in mixed polyculture system using deep-learning and low-cost devices. Expert Syst. Appl. 178, 115051. doi: 10.1016/j.eswa.2021.115051
Krizhevsky A., Sutskever I., Hinton G. (2017). ImageNet classification with deep convolutional neural networks. Commun. A. C. M. (N. Y. U. S. A.), 60 (6), 84–90. doi: 10.1145/3065386
Law H., Deng J. (2018). “Cornernet: Detecting objects as paired keypoints,” in Proceedings of the European conference on computer vision (ECCV). 734–750. doi: 10.1007/s11263-019-01204-1
Li C., Li L., Jiang H., Weng K., Geng Y., Li L., et al. (2022). YOLOv6: A single-stage object detection framework for industrial applications. arXiv. doi: 10.48550/arXiv.2209.02976
Li J., Chen W., Zhu Y., Xuan K., Li H., Zeng N. (2023). Intelligent detection and behavior tracking under ammonia nitrogen stress. Neurocomputing 559, 126809. doi: 10.1016/j.neucom.2023.126809
Li S., Li C., Yang Y., Zhang Q., Wang Y., Guo Z. (2022). Underwater scallop recognition algorithm using improved YOLOv5. Aquac. Eng. 98, 102273. doi: 10.1016/j.aquaeng.2022.102273
Li D., Xie Q., Yu Z., Wu Q., Zhou J., Wang J. (2021). Sewer pipe defect detection via deep learning with local and global feature fusion. Automat. Constr. 129, 103823. doi: 10.1016/j.autcon.2021.103823
Li H., Yu H., Gao H., Zhang P., Wei S., Xu J., et al. (2022). Robust detection of farmed fish by fusing YOLOv5 with DCM and ATM. Aquac. Eng. 99, 102301. doi: 10.1016/j.aquaeng.2022.102301
Lin T., Dollár P., Girshick R., He K., Hariharan B., Belongie S. (2017b). “Feature pyramid networks for object detection,” in Proceedings of the IEEE conference on computer vision and pattern recognition. (Honolulu, HI, USA), 2117–2125. doi: 10.1109/CVPR.2017.106
Lin T., Goyal P., Girshick R., He K., Dollár P. (2017a). “Focal loss for dense object detection,” in Proceedings of the IEEE international conference on computer vision. (Venice, Italy), 2980–2988. doi: 10.1109/ICCV.2017.324
Liu W., Anguelov D., Erhan D., Szegedy C., Reed S., Fu C., et al. (2016). Ssd: Single shot multibox detector. arXiv [Preprint]. doi: 10.1007/978-3-319-46448-0_2
Liu K., Peng L., Tang S. (2023). Underwater object detection using TC-YOLO with attention mechanisms. Sensors 23, 2567. doi: 10.3390/s23052567
Liu Y., Shao Z., Teng Y., Hoffmann N. (2021). NAM: Normalization-based attention module. arXiv. doi: 10.48550/arXiv.2111.12419
Nixon D. (2021). “Computer vision neural network using YOLOv4 for underwater fish video detection In Roatan, Honduras,” in 2021 IEEE International Conference on Machine Learning and Applied Network Technologies (ICMLANT). (Soyapango, El Salvador: IEEE), 1–5. doi: 10.1109/ICMLANT53170.2021.9690561
Redmon J., Farhadi A. (2017). “YOLO9000: better, faster, stronger,” in Proceedings of the IEEE conference on computer vision and pattern recognition. (Piscataway, NJ), 7263–7271. doi: 10.48550/arXiv.1612.08242
Reis D., Kupec J., Hong J., Daoudi A. (2023). Real-time flying object detection with YOLOv8. arXiv. doi: 10.48550/arXiv.2305.09972
Ren S., He K., Girshick R., Sun J. (2015). Faster r-cnn: Towards real-time object detection with region proposal networks. Adv. Neural Inf. Process. Syst. doi: 10.1109/TPAMI.2016.2577031
Samothai P., Sanguansat P., Kheaksong A., Srisomboon K., Lee W. (2022). “The evaluation of bone fracture detection of YOLO series,” in 2022 37th International Technical Conference on Circuits/Systems, Computers and Communications (ITC-CSCC). (Phuket, Thailand: IEEE), 1054–1057. doi: 10.1109/ITC-CSCC55581.2022.9895016
Shen X., Wang H., Cui T., Guo Z., Fu X. (2023). Multiple information perception-based attention in YOLO for underwater object detection. Visual Comput., 1–24. doi: 10.1007/s00371-023-02858-2
Sunkara R., Luo T. (2022). “No more strided convolutions or pooling: A new CNN building block for low-resolution images and small objects,” in Joint European Conference on Machine Learning and Knowledge Discovery in Databases (Cham: Springer Nature Switzerland), 443–459. doi: 10.48550/arXiv.2208.03641
Tan M., Pang R., Le Q. V. (2020). “Efficientdet: Scalable and efficient object detection,” in Proceedings of the IEEE/CVF conference on computer vision and pattern recognition. (Seattle, WA, USA), 10781–10790. doi: 10.1109/CVPR42600.2020.01079
Wang C., Bochkovskiy A., Liao H. (2023). “YOLOv7: Trainable bag-of-freebies sets new state-of-the-art for real-time object detectors,” in Proceedings of the IEEE/CVF Conference on Computer Vision and Pattern Recognition. (Piscataway, NJ), 7464–7475. doi: 10.48550/arXiv.2207.02696
Wang H., Zhang S., Zhao S., Wang Q., Li D., Zhao R. (2022). Real-time detection and tracking of fish abnormal behavior based on improved YOLOV5 and SiamRPN++. Comput. Electron. Agric. 192, 106512. doi: 10.1016/j.compag.2021.106512
Xia C., Fu L., Liu H., Chen L. (2018). “In situ sea cucumber detection based on deep learning approach,” in In 2018 OCEANS-MTS/IEEE Kobe Techno-Oceans (OTO). (Kobe, Japan: IEEE), 1–4. doi: 10.1109/OCEANSKOBE.2018.8559317
Xu X., Liu Y., Lyu L., Yan P., Zhang J. (2023). MAD-YOLO: A quantitative detection algorithm for dense small-scale marine benthos. Ecol. Inf. 75, 102022. doi: 10.1016/j.ecoinf.2023.102022
Xu W., Wang P., Jiang L., Xuan K., Li D., Li J. (2023b). Intelligent recognition and behavior tracking of sea cucumber infected with Vibrio alginolyticus based on machine vision. Aquac. Eng. 103, 102368. doi: 10.1016/j.aquaeng.2023.102368
Xuan K., Deng L., Xiao Y., Wang P., Li J. (2023). SO-YOLOv5: Small object recognition algorithm for sea cucumber in complex seabed environment. Fisheries Res. 264, 106710. doi: 10.1016/j.fishres.2023.106710
Yi Z., Yongliang S., Jun Z. (2019). An improved tiny-yolov3 pedestrian detection algorithm. Optik 183, 17–23. doi: 10.1016/j.ijleo.2019.02.038
Zhai X., Wei H., He Y., Shang Y., Liu C. (2022). Underwater sea cucumber identification based on improved YOLOv5. Appl. Sci. 12, 9105. doi: 10.3390/app12189105
Zhang Y., Guo Z., Wu J., Tian Y., Tang H., Guo X. (2022). Real-time vehicle detection based on improved yolo v5. Sustainability 14, 12274. doi: 10.3390/su141912274
Zhao L., Li S. (2020). Object detection algorithm based on improved YOLOv3. Electronics 9, 537. doi: 10.3390/electronics9030537
Zhao J., Zhang X., Yan J., Qiu X., Yao X., Tian Y., et al. (2021). A wheat spike detection method in UAV images based on improved YOLOv5. Remote Sens. 13, 3095. doi: 10.3390/rs13163095
Zhu J., He W., Weng W., Zhang T., Mao Y., Yuan X., et al. (2022). An embedding skeleton for fish detection and marine organisms recognition. Symmetry 14, 1082. doi: 10.3390/sym14061082
Zhu X., Lyu S., Wang X., Zhao Q. (2021). “TPH-YOLOv5: Improved YOLOv5 based on transformer prediction head for object detection on drone-captured scenarios,” in Proceedings of the IEEE/CVF international conference on computer vision. (Montreal, BC, Canada), 2778–2788. doi: 10.1109/ICCVW54120.2021.00312
Keywords: computer vision, deep sea object detection, megabenthos, YOLOv5, automatic counting
Citation: Wang W, Sun YF, Gao W, Xu W, Zhang Y and Huang D (2024) Quantitative detection algorithm for deep-sea megabenthic organisms based on improved YOLOv5. Front. Mar. Sci. 11:1301024. doi: 10.3389/fmars.2024.1301024
Received: 24 September 2023; Accepted: 12 February 2024;
Published: 27 February 2024.
Edited by:
Haiyong Zheng, Ocean University of China, ChinaReviewed by:
Juan Li, Qingdao Agricultural University, ChinaCopyright © 2024 Wang, Sun, Gao, Xu, Zhang and Huang. This is an open-access article distributed under the terms of the Creative Commons Attribution License (CC BY). The use, distribution or reproduction in other forums is permitted, provided the original author(s) and the copyright owner(s) are credited and that the original publication in this journal is cited, in accordance with accepted academic practice. No use, distribution or reproduction is permitted which does not comply with these terms.
*Correspondence: Yong Fu Sun, c3VueW9uZ2Z1QG5kc2Mub3JnLmNu
Disclaimer: All claims expressed in this article are solely those of the authors and do not necessarily represent those of their affiliated organizations, or those of the publisher, the editors and the reviewers. Any product that may be evaluated in this article or claim that may be made by its manufacturer is not guaranteed or endorsed by the publisher.
Research integrity at Frontiers
Learn more about the work of our research integrity team to safeguard the quality of each article we publish.