
94% of researchers rate our articles as excellent or good
Learn more about the work of our research integrity team to safeguard the quality of each article we publish.
Find out more
ORIGINAL RESEARCH article
Front. Mar. Sci., 06 February 2024
Sec. Ocean Observation
Volume 11 - 2024 | https://doi.org/10.3389/fmars.2024.1298641
This article is part of the Research TopicImpact of Oceans on Extreme Weather Events (Tropical Cyclones)View all 8 articles
 Sok Kuh Kang1*
 Eun Jin Kim1
 Sunghun Kim1
 Joseph Cione2Dongkyu Lee3Sebastian Landwehr4
 Hyoun-Woo Kang1
 Kyeong-Ok Kim1Chang Su Hong1Min Ho Kwon1
 Kyung-Hee Oh1
 Jae Hak Lee1,3
 Suyun Noh1Jae Kwi So1
 Dong-Jin Kang1
 Dongseon Kim1Jae-Hyoung Park5
 SungHyun Nam6Yang Ki Cho6Brian Ward4Isaac Ginis7
An air-sea interaction field campaign was conducted in September of 2017 within the warm and cold eddy region of the western Northwest Pacific (WNP) (17.5˚-20.5˚N, 127.5˚E-133.5˚E). Both near-surface oceanic and atmospheric conditions in addition to ocean heat content (OHC) were examined to better understand the mechanisms governing high heat flux magnitudes responsible for rapidly intensifying tropical cyclones. Observations from this experiment indicate that the latent heat flux (LHF) under modest wind conditions reached 400 W m-2 within the vicinity of a warm eddy, with OHC higher than 100 kJ cm-2 of warm eddy region being 2~3 times as large as that of cold eddy region. These high OHC and a resultant high LHF in the warm eddy, comparable to the magnitude of LHF in the North Equatorial Current, may explain the mechanism of why tropical cyclones over a warm eddy in eddy-rich zones often rapidly intensify in the WNP. A month later typhoon Lan rapidly intensified into a super typhoon, while passing over the boundary region of warm and cold eddies during the observation period. Results from this study illustrate that both the wind-normalized LHF and the difference (Qs-Qa) between the specific humidity at air (Qa) and at the sea surface (Qs), closely correlate with OHC patterns, which suggests that the ocean looks likely to control the spatial pattern of LHF. Overall, both the ocean and weather conditions govern the pattern of specific humidity difference between the air-sea interface, with large OHC over the warm eddy controlling higher Qs and the pattern of Qa depending on the pattern of wind direction. Qa as a factor impacting LHF magnitude is strongly linked to wind direction in the experimental area, that is, the drier northwesterly flow and southeasterly moist wind, resulting in the enhanced contrast of specific humidity at cold eddy region.
It is well known that warm eddies or warm ocean anomalies promote rapid intensification (RI) of tropical cyclones (TCs) that can reach super typhoon intensity (Shay et al., 2000; Lin et al., 2005; Lin et al., 2009). Previous studies show that the subsurface ocean structure plays an important role in modulating air-sea fluxes during hurricane passage which affects intensity change (e.g. Shay and Brewster, 2010). The interaction of TCs with warm ocean eddies frequently occurs around the eddy-rich zone of the Northwestern Pacific (NWP), while the deep thermocline of the North Equatorial Current (8˚N-17˚N) is shown to be the major heating source to rapidly intensify TCs leading to super typhoon (Kang et al., 2024).
The interaction of TC and ocean warm eddies is a special case of air-sea interaction, which was extensively reviewed by Small et al. (2008); According to their work, recent observations of the nature of air–sea interaction over oceanic fronts and eddies have revealed a positive correlation of near-surface wind speed and SST (Liu et al., 2000 ; Chelton et al., 2001; Hashizume et al., 2001). This finding contrasts with the often negative correlation observed on larger basin scales (Mantua et al., 1997; Okumura et al., 2001). The variances in these results highlight the complexity of the interaction between TCs and the ocean, revealing a multifaceted, bidirectional ocean-atmosphere response rather than a simple, linear one.
In relation to air-sea fluxes of TCs over mesoscale eddy feature, Shay and Uhlhorn (2008) report that the ocean heat content (OHC) in the loop current exceeds 100 kJ cm-2, while, estimated surface enthalpy flux at Isidore’s eyewall was 1.8 kW m-2, where the maximum observed wind was 49 m s-1, while the maximum estimated surface enthalpy flux during hurricane Lili was 1.4 kW m-2, associated with peak surface winds of 51 m s-1. These show that a high surface enthalpy flux over 1 kW m-2 could easily happen during TCs, while a large spatial gradient of LHF anomaly up to 75.7 Wm−2km−1 was reported due to the submesoscale processes (Song et al., 2022).
Latent heat flux (LHF) “linearly” depends on three components, wind speed, sea surface temperature (SST), and specific humidity in the air (Qa). Within the hurricane environment, wind magnitude, SST and Qa are all potentially important. When SST conditions were similar for two groups of storms, the atmosphere was primarily responsible for modifying the near-surface thermodynamic environment (and ultimately surface moisture flux conditions) (Cione et al., 2013).
Jaimes et al. (2015) described that bulk enthalpy fluxes during Hurricane Earl were controlled by the thermodynamic disequilibrium between the sea surface and the near-surface air, independently of wind speed. Jaimes et al. (2016) studied the air-sea interactions as the hurricane Isaac in 2012 intensified into a hurricane over a warm oceanic mesoscale eddy. Using airborne oceanographic and atmospheric profilers, they found that the increase in bulk enthalpy fluxes resulted from a growing moisture imbalance between the ocean and the atmosphere during the TC intensification. This disequilibrium was strongly influenced by underlying warm oceanic features, suggesting that the importance of three components (wind speed, SST, and Qa) depends upon the cases. To improve our understanding of complex interactions of the near-surface thermodynamic conditions around warm oceans in the eddy-rich zone of the NWP, this study investigates the air-sea environment under less violent, non-storm conditions. It would be particularly interesting to examine the heat flux process around a warm eddy as a simplified representation of air-sea interaction under moderate wind conditions. It is also important for understanding TCs RI to investigate what LHF over the warm eddy looks like before TC’s arrival since a large LHF with high OHC is very favorite for TCs to get rapidly intensified. This is also related to understanding the mechanism why TCs passing over warm eddies in the eddy-rich zone are often rapidly intensified in the WNP (Kang et al., 2024).
Using the field measurement data in warm and cold eddies in the NWP during Sep.14-24, 2017, we examine LHF patterns and the factors controlling such patterns within the eddy region. The atmospheric and oceanic measurements of relative humidity, sea surface pressure, air temperature, sea temperature, and salinity were collected and examined to better understand the mechanisms governing surface moisture flux exchange. Accurate documentation of LHF conditions over eddies without TCs could lead to an improved understanding of the heat exchange processes that help to maintain and intensify TCs.
Measurements of oceanic and weather parameters were carried out over the warm and cold eddy region (17.5˚-20.5˚N, 127.5˚E-133.5˚E) in the NWP during September 2017 (Figure 1). The field experiment covered the East China Sea and NWP during Sep.8 - 29, 2017, while the field experiment at the stations in the NWP was carried out during Sep.14 - 24. Figure 1 shows the locations of CTD casting down to 2000 m, ship track along which the oceanic and atmospheric data were collected. Relative humidity, air temperature, and air pressure were sampled from the instrument of Campbell weather station at approximately 10 m height above sea surface on the bow of the R/V Isabu, with a sampling interval of 1 Hz, yielding 1-minute mean values for LHF. SST with a 10-s interval was measured using a thermosalinograph attached to the vessel at 4 m below the sea surface, yielding 1-minute average values. The 1-minute mean wind speed and wind direction were obtained from the meteorological system of R/V Isabu at a height of 32.6 m, measured at 1 Hz sampling, from which the wind speed is converted to 10 m wind speed. 1-minute and 15-minute averaged SST, air temperature, air pressure, relative humidity, wind speed, and wind direction are presented in Figure 2.
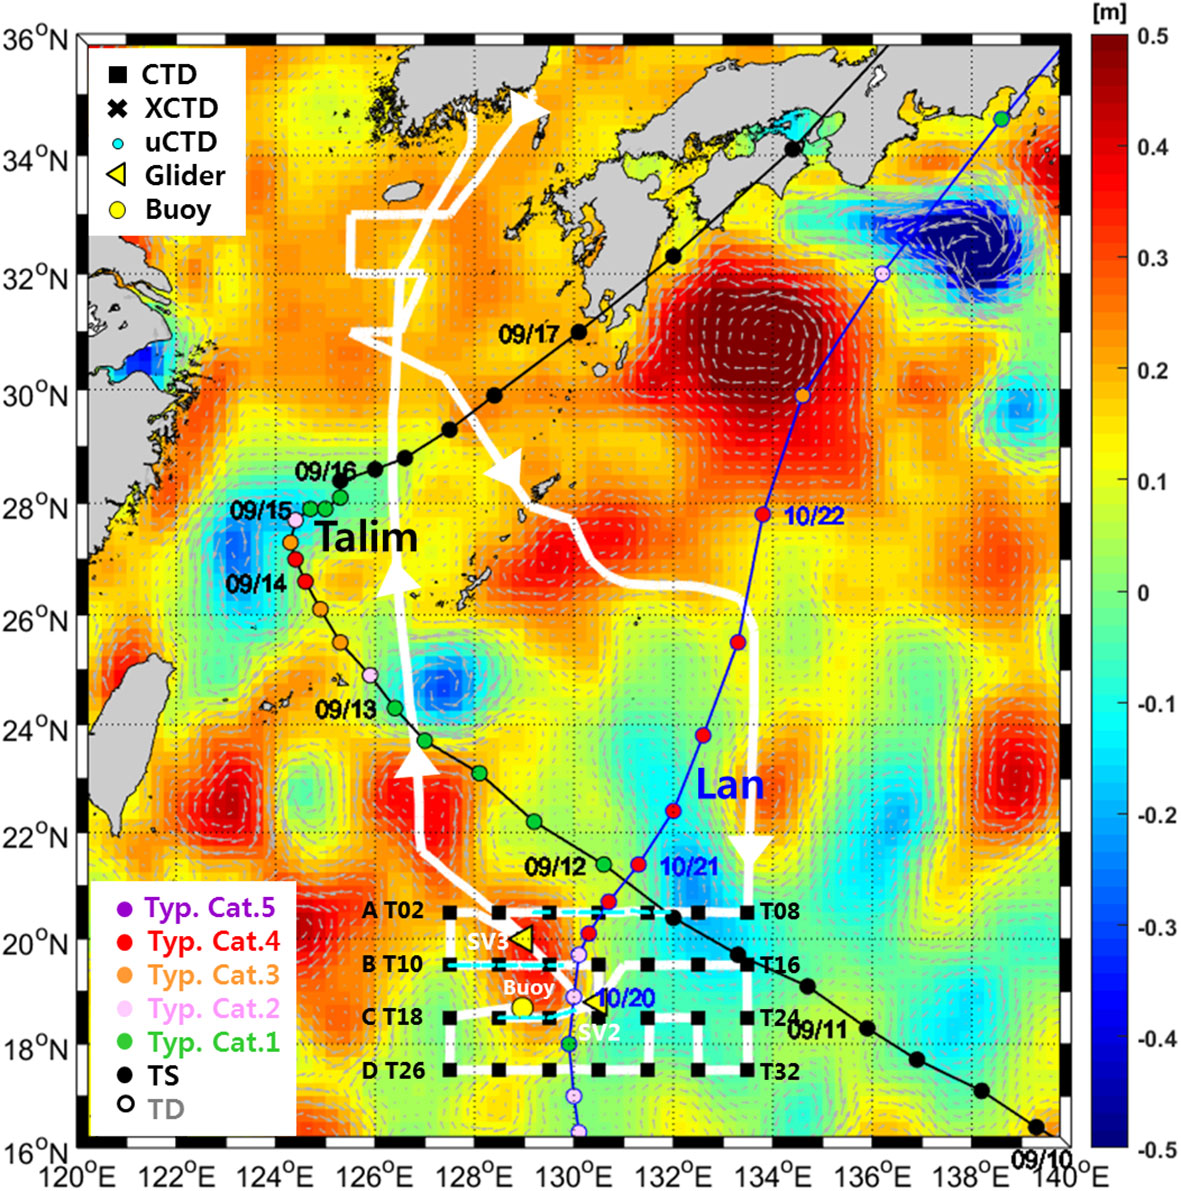
Figure 1 Field experiments along the ship track (thick white line) were carried out from Sep.14 to 25 in the NWP. CTD (rectangular points), uCTD points (sky-color linelike points) are seen, and radiosondes are deployed on every CTD casting point. Yellow triangle points denote the locations of two wave gliders (SV2 and SV3) deployed. Air temperature, air pressure, and relative humidity data with 1Hz sampling are continuously measured from various sensors attached to the bow of the R/V Isabu at approximately 10 m height above the sea surface. Tracks of typhoons Talim and Lan are denoted by solid lines with dates when TC passes through the location. The colors on the tracks denote the intensity of TC (green color of category 1 to red color by category 4) from the best track data from the Joint Typhoon Warning Center (JTWC). Station numbers are written only at western and eastern points. The background color denotes the sea surface height anomaly (m) on Sep.15, from the Copernicus website. The station number of CTD is 30 and the number of uCTD is 163.
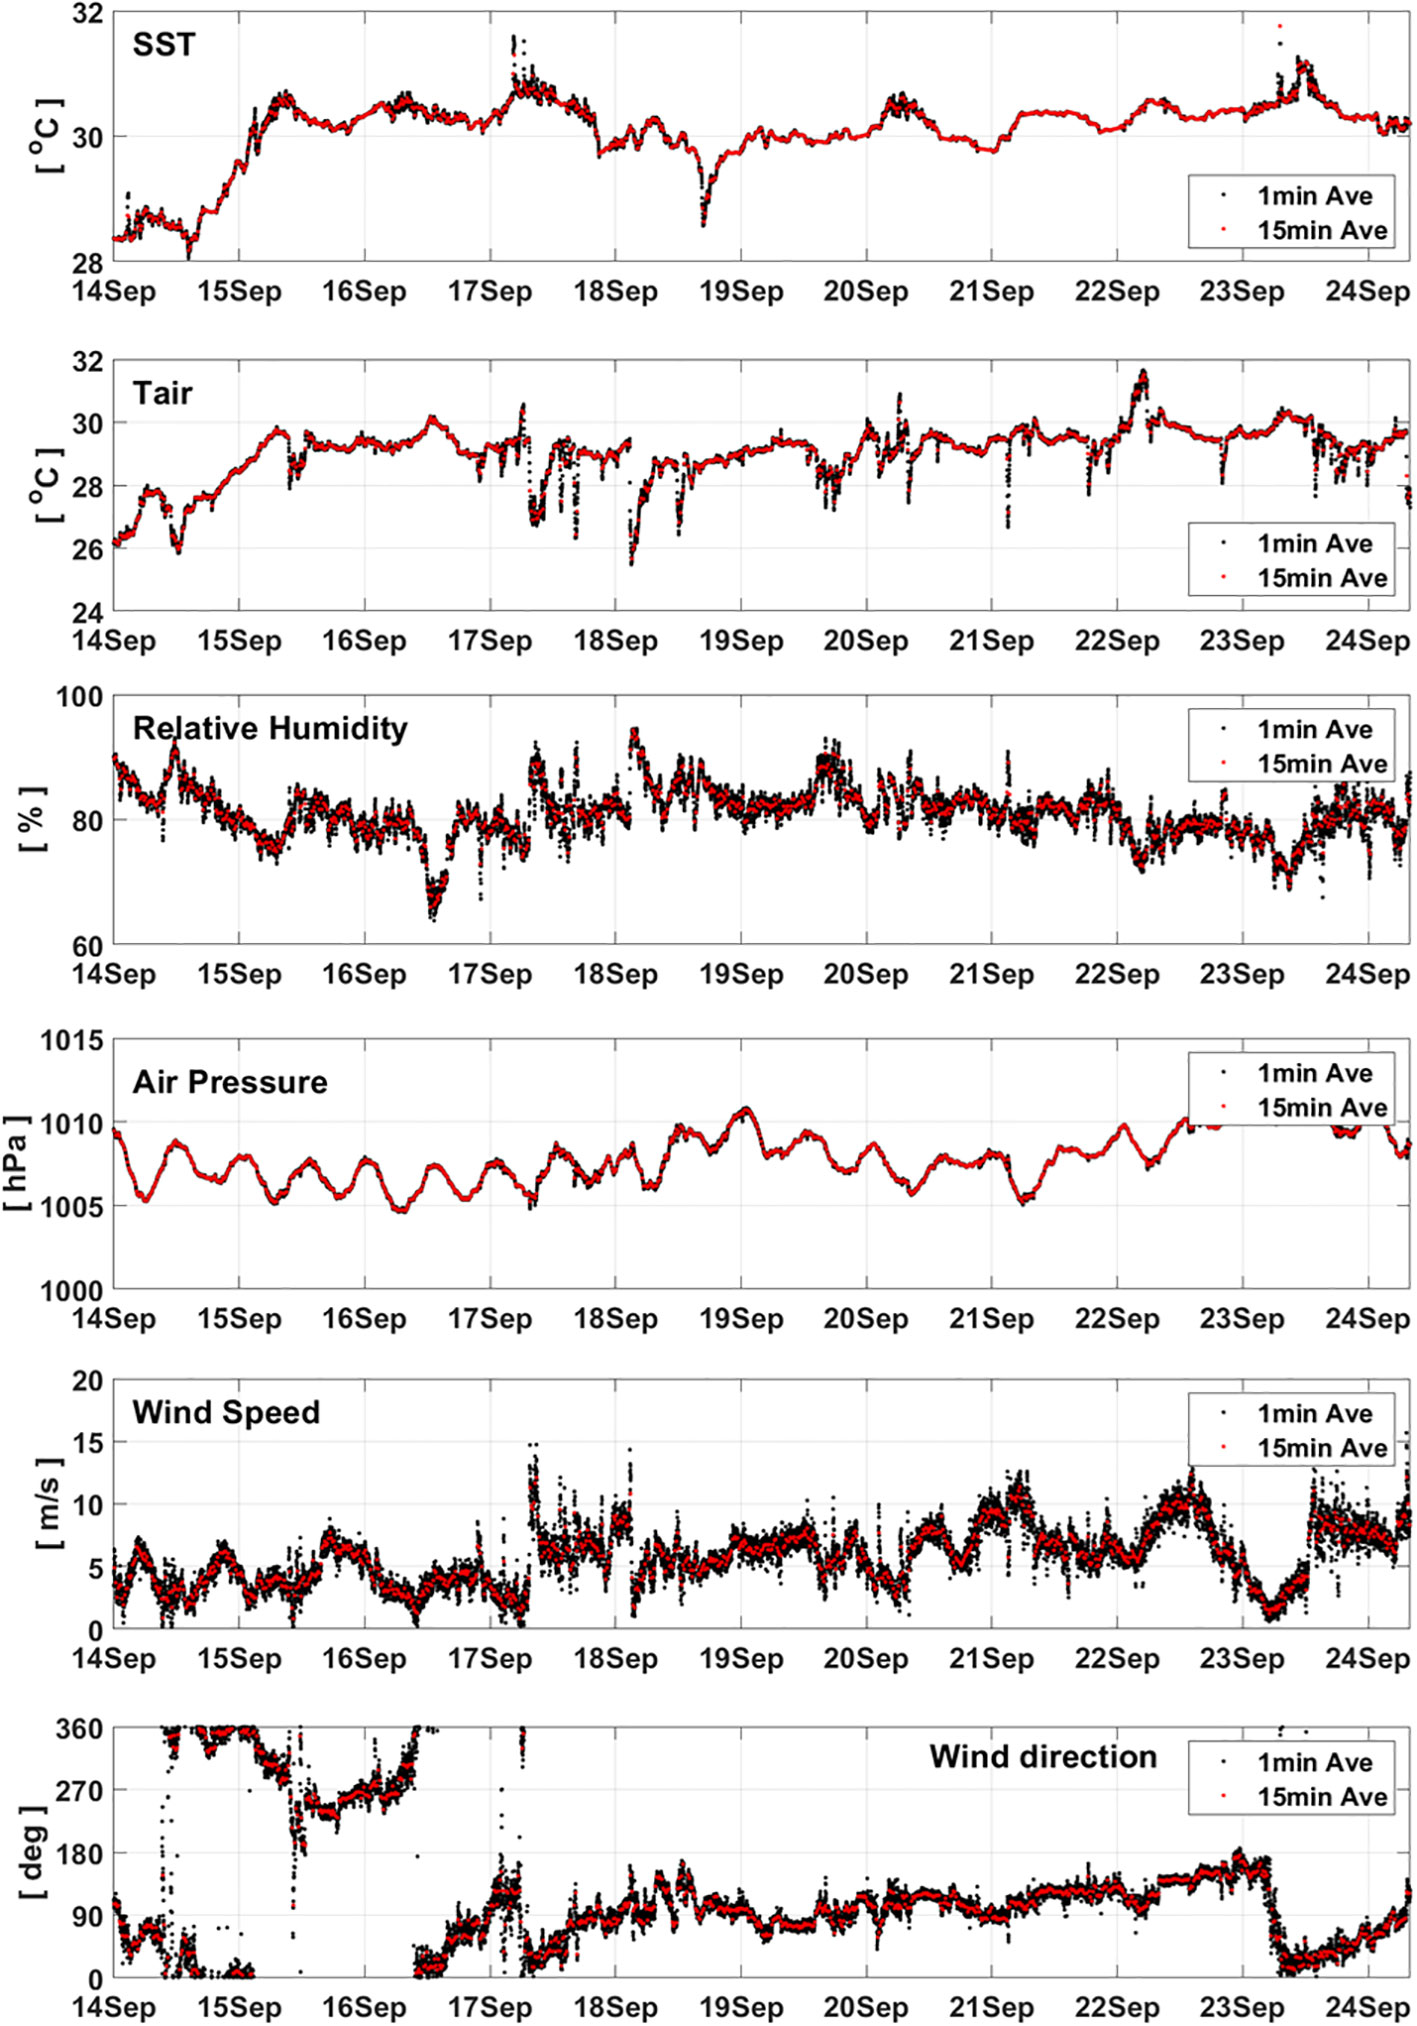
Figure 2 Temporal variations of 1-minute and 15-minute averaged sea surface temperature (SST), air temperature (Tair), relative humidity, air pressure, wind speed, and dominant wind direction. Dominant wind direction is a mean of dominating-direction components among components in 16 directions. Air pressure, relative humidity, and air temperature are measured using instrument CR6 newly installed on the bow of R/V Isabu, while other parameters are measured by instruments installed on the ship.
Temperature and salinity data from CTD casting was made down to 2000 m at each station, at 1-m intervals. The OHC was integrated from a depth of 26°C to the sea surface where 26°C was defined by Palmen (1948) and used by Shay and Brewster (2010) as follows.
where is the specific heat of seawater at constant pressure, 3.85 kJ kg-1 (˚C)-1, and H26 is the isothermal depth of 26°C of seawater and is seawater density. LHF is calculated following and/or Jaimes et al. (2015).
where = air density, = heat of vaporization, J kg-1 (Wang and Liang, 2008), exchange coefficient for moisture, 0.0013 (Friehe and Schmitt, 1976), =wind speed at 10 m height, = specific humidity at the sea surface, = specific humidity at 10 m. The windspeed dependencies of heat exchange components of the air-sea flux equations are well shown in the figures of the HWRF manual (Biswas et al., 2017), also for the heat exchange coefficient. It varies according to wind speed specifically under 10 m/s. The present study uses the heat exchange coefficient as 0.0013 following Friehe and Schmitt (1976), which is more or less a good approximation for moderate and stronger wind speeds.
Vertical sections of temperature from CTD castings along four latitude lines are presented in Figure 3. The vertical temperatures near the center of warm eddy reveal that the 30˚C isotherm appears at a depth of 50 m in sections A, and B in Figure 3, while the 26˚C isotherm appears down at 100 m depth. The OHC in each latitudinal section is shown in Figure 4. The highest OHC values around the eddy center reach 130-140 kJ cm-2, which is comparable or higher than OHC values of 80 to 130 kJ cm-2 in warm eddies observed before the passage of super typhoon Maemi in 2003 (Lin et al., 2005), estimated using argo data, and OHC values of 77-105 kJ cm-2 observed in a pre-existing warm ocean anomaly within the Bay of Bengal before cyclone Nargis’s RI (Lin et al., 2009). It is also worth noting that one month after this field experiment, typhoon Lan’s intensification to super typhoon (>130 knots) occurred soon after passing through the domain (refer to the track and intensity of Lan in Figure 1). The lower OHC values observed within the cold eddy region are likely a direct result of enhanced ocean cooling due to the passage of typhoon Talim on Sep.11, 2017 (Figure 1): The upwelling in the cyclonic cold eddy around station T07 (above section A in Figure 1), revealed by lower SLA, coincides with the cold temperature profile (Figure 3A), causing lower OHC of 45 kJ cm-2 in Figure 4A. The upwelling is likely to show more enhanced cooling by the passage of typhoon Talim, resulting in further lower OHC. The variability of surface LHF during the field campaign is investigated in the following sections.
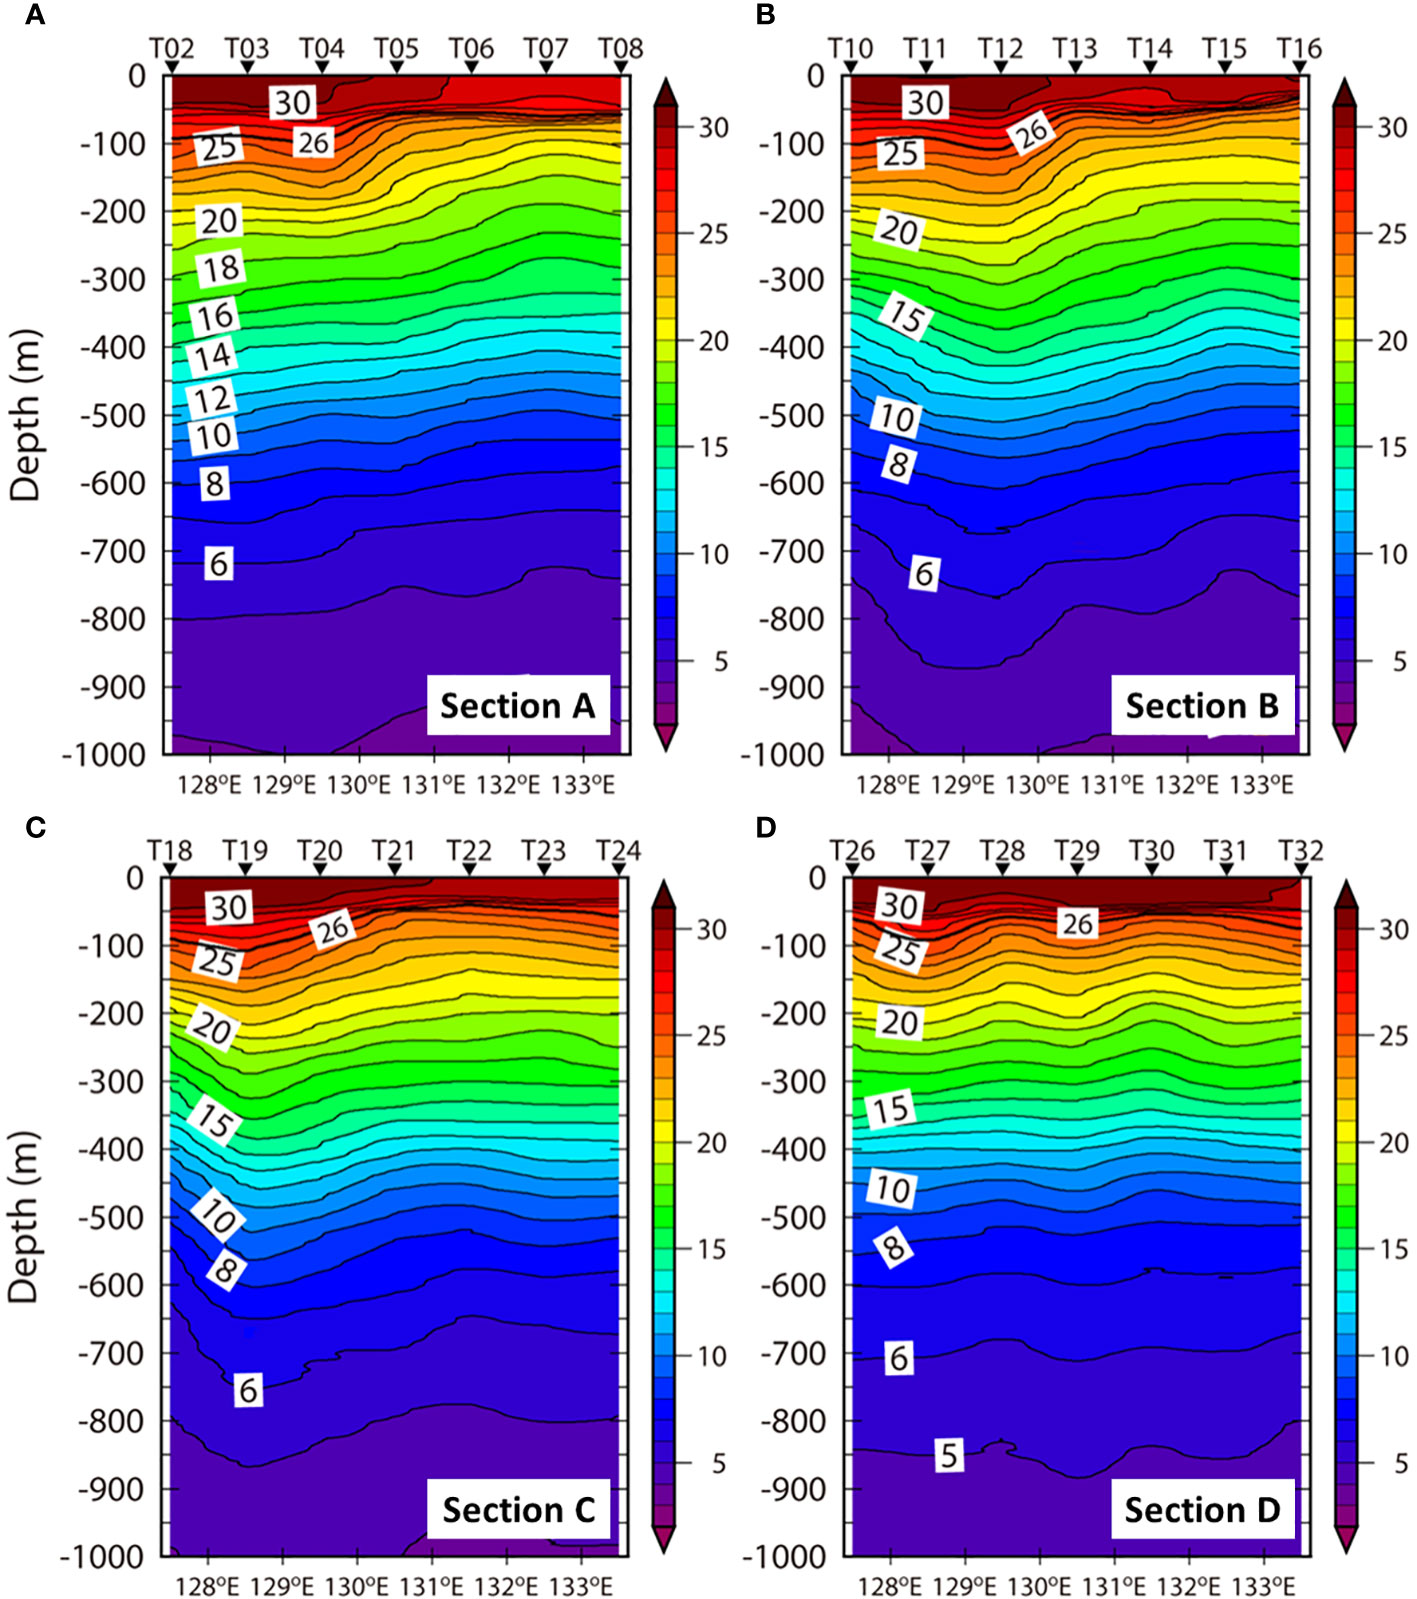
Figure 3 Vertical sections of temperature from CTD casting along the latitude sections of (A–D) in Figure 1.
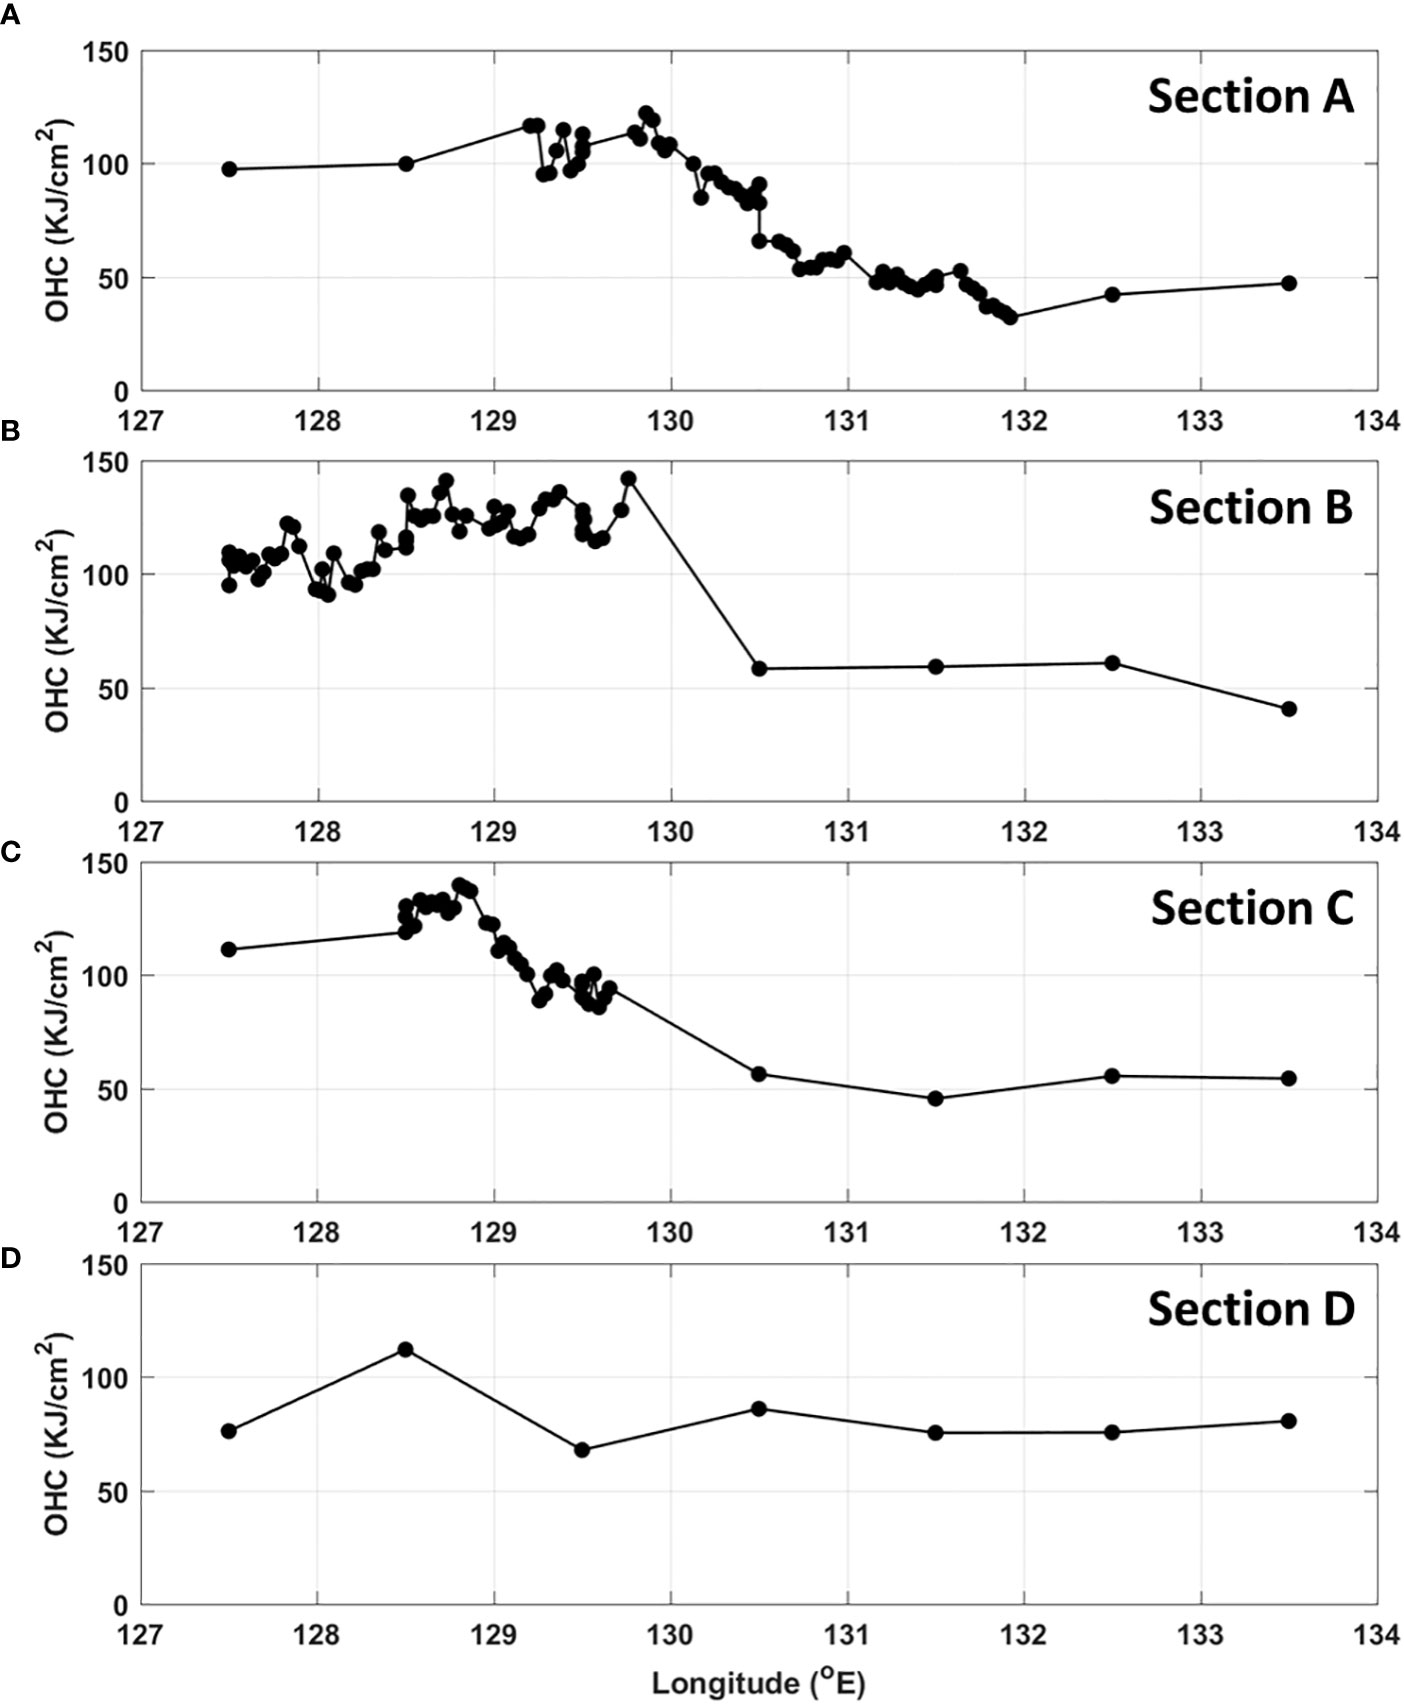
Figure 4 Ocean heat content (OHC) along the latitude sections of (A–D) (S). The data from CTD and uCTD are also utilized for OHC in sections A, B, C, and (D) uCTD lines are marked in blue-sky color in Figure 1.
Using the observed data during the field experiment by R/V Isabu, surface LHF along the tracks of the vessel from Sep.14 to 24, 2017 were calculated. Figure 5 illustrates 1- and 15-minute average LHF along each section from A to D. Here, LHF values range from 0 to 450 W m-2. Values of 400 W m-2 appear near the center of the warm eddy in section B with values between 200-400 W m-2 found near sections C and D. Lower values of LHF below 100 W m-2 were observed near the cold eddy in section A with values of near 200 W m-2 found within the vicinity of the cold eddy in section C. It is unclear if LHF has any special relation to OHC, even though our analysis indicates larger LHF values were found near the warm eddy. The distribution of LHF can be affected by the spatial variability of the wind (Figure 5, blue dots). Given this, the wind effect needs to be excluded to effectively examine the impact of the warm and cold eddies on the magnitude of surface LHF. Wind-normalized LHF (wnLHF) is analyzed below. Sensible heat flux values were observed to be approximately 10 W m-2 lower (not shown). Wind speed and SST from R/V are shown in Figure 6.
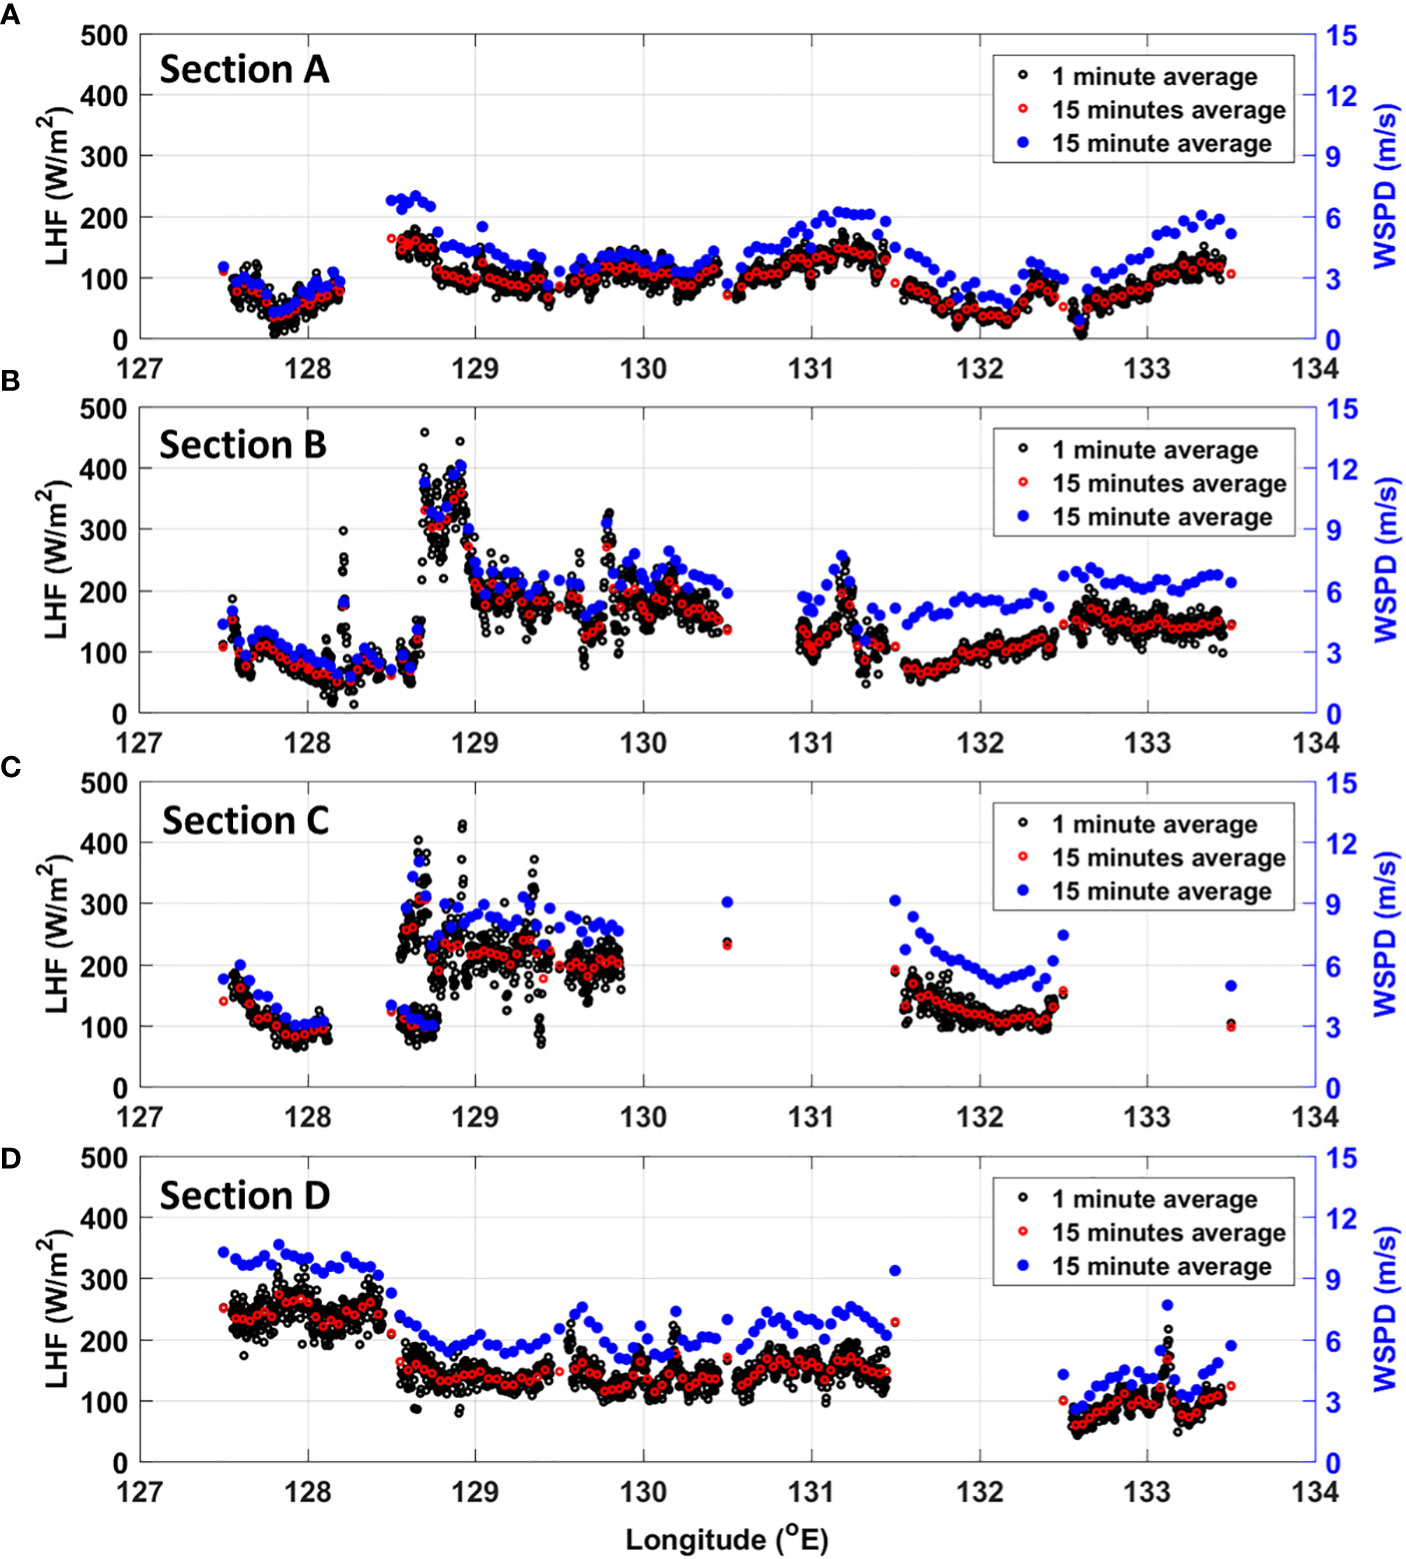
Figure 5 1-minute (black dot) and 15-minute (red dot) averaged latent heat flux from the bulk formula, with wind speed (blue dot), along the latitude sections (A–D).
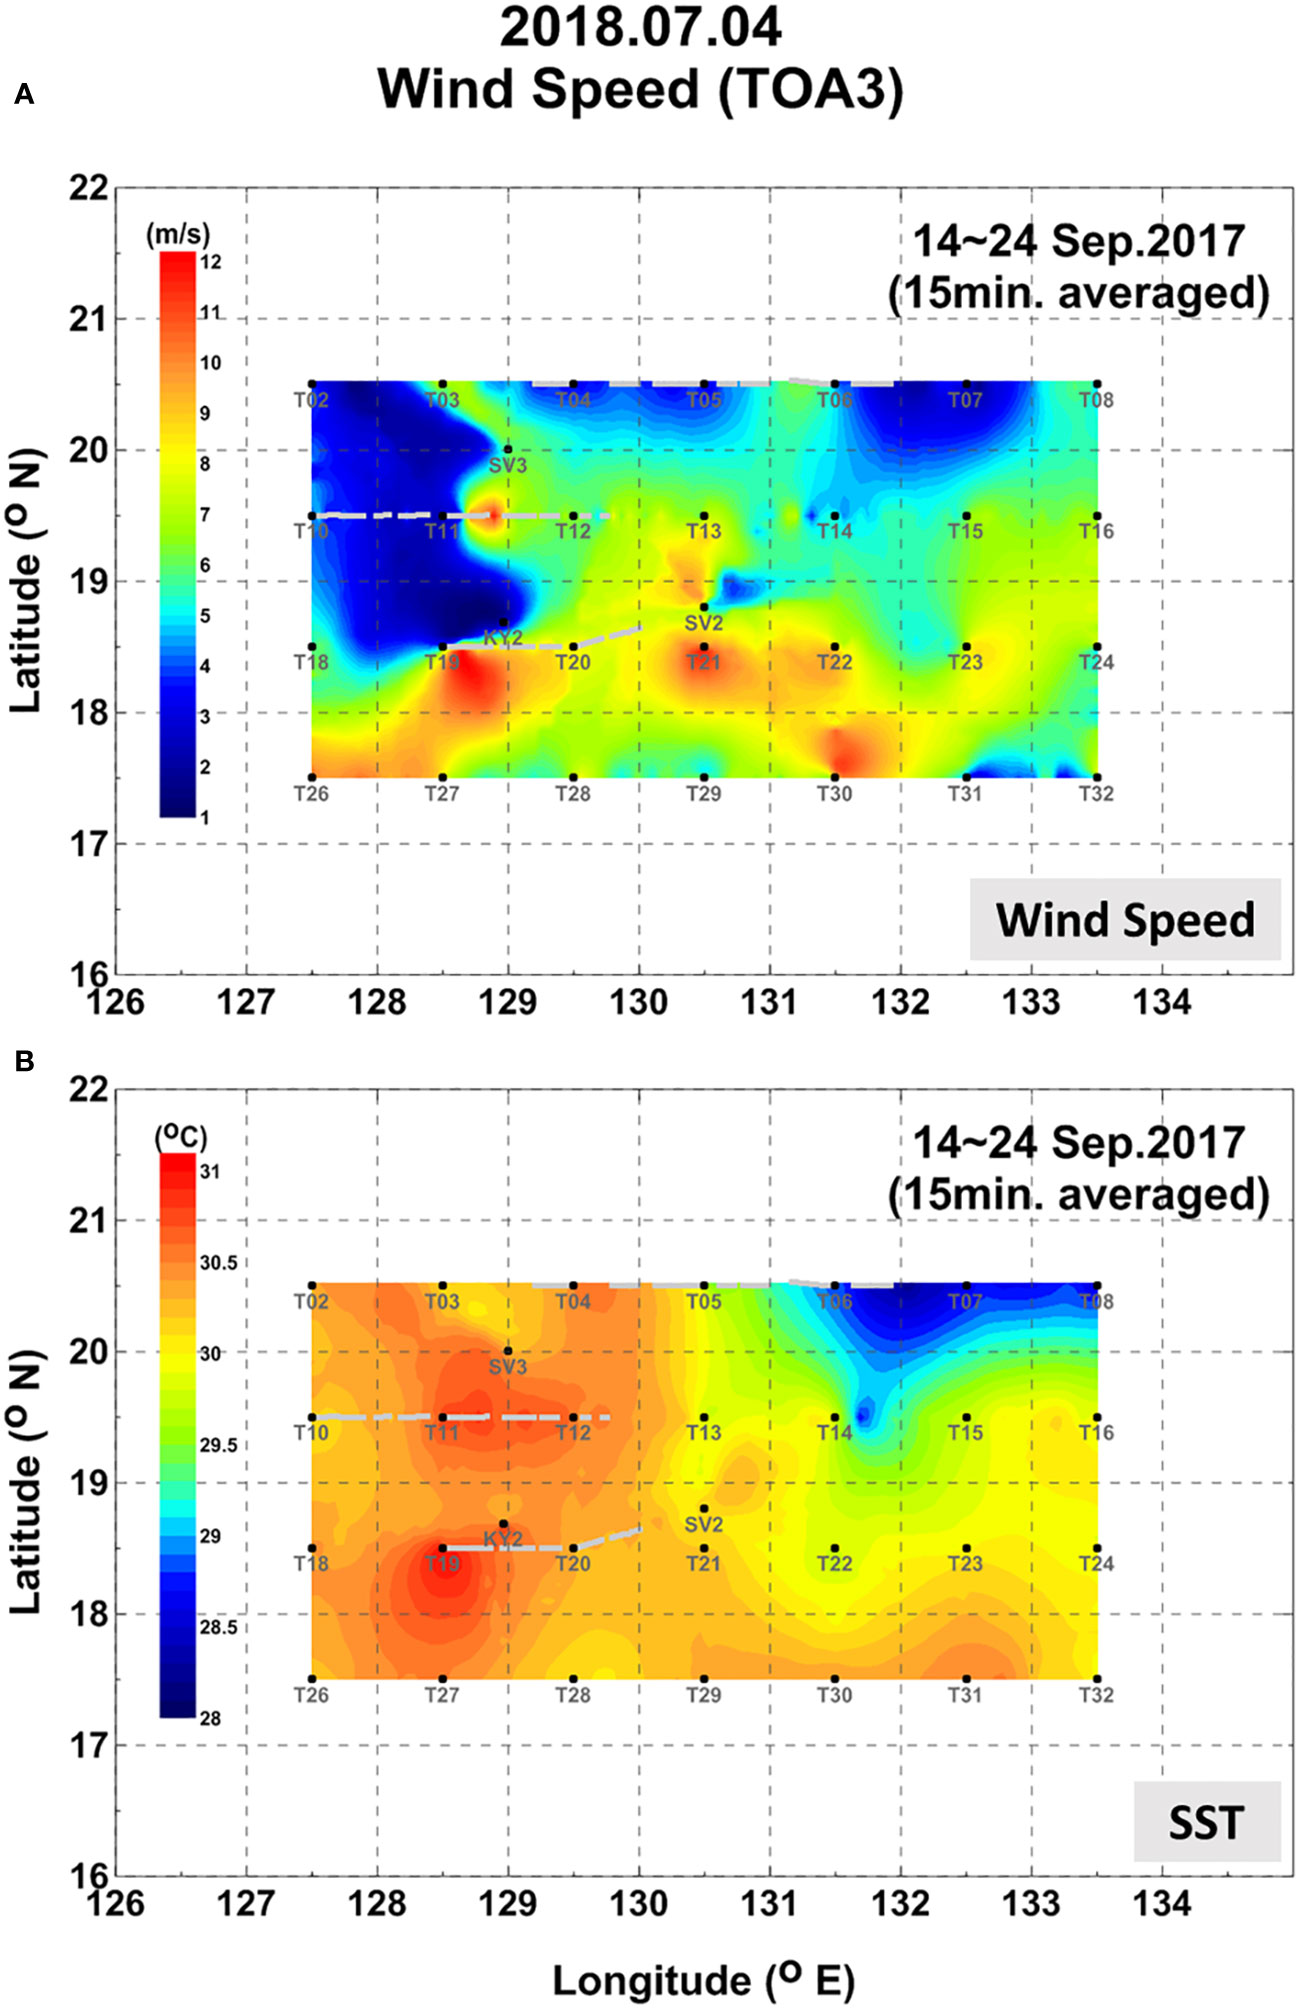
Figure 6 (A) Mean wind speed at experimental region and (B) sea surface temperature (SST) below 4m sea surface using thermoslinograph installed under R/V Isabu. 15-minute mean values along the ship track for SST and wind speed are used to interpolate the values for plotting in the domain.
To evaluate the details of LHF magnitude without the contribution of wind, bulk LHF was divided by wind speed. The resulting quantity is defined as the wnLHF. The primary remaining term (Qs-Qa), (i.e. the difference in near-surface specific humidity) was calculated. Figures 7A–D present the spatial distributions of LHF, OHC, wnLHF, and (Qs-Qa), respectively. The wnLHF is shown to the values of 20-28 W m-2(or m s-1) around the warm eddy, with lower values between 5-15 W m-2 (or m s-1) near the cold eddy environment. These illustrations depict clear similarities of a high correlation coefficient of 0.75 between wnLHF and OHC distributions that show large values of OHC and wnLHF within the vicinity of the warm eddy with lower estimates of OHC and wnLHF near the cold eddy. In addition, the similarity between the vertical moisture gradient (Qs-Qa) (Figure 7D) and the OHC (Figure 7B) looks also clear, while the vertical moisture gradient and the LHF show also some similarity, as expected from weak wind, with some deviation due to weak wind in the northwestern area (Figure 6A).
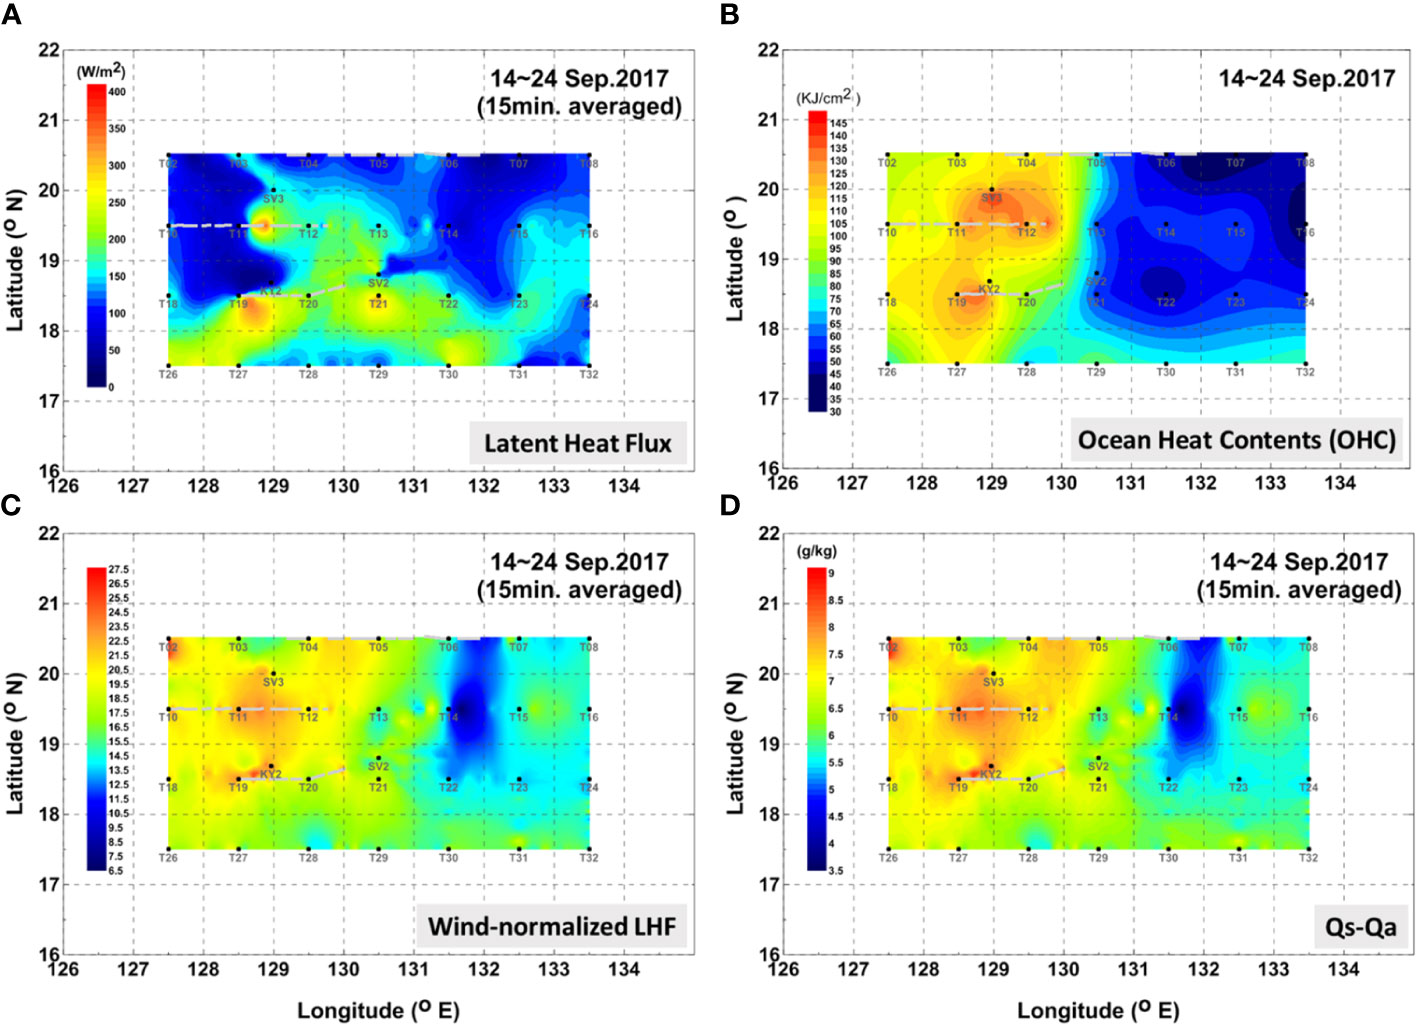
Figure 7 (A) Latent heat flux (LHF), (B) ocean heat content (OHC), (C) wind-normalized latent heat flux, (D) specific humidity difference (specific humidity at the sea surface (Qs) minus specific humidity at air (Qa). Figure 4B is plotted using interpolated values of estimates from all CTD, uCTD, buoy, and glider locations, and Figures.4A, C, D are plotted using interpolated values of the estimated values along the track lines.
The specific humidity difference (Qs-Qa) (Figure 7D) shows the spatial pattern of higher values in the warm eddy region and lower values within the cold eddy region. Not surprisingly this pattern is very similar to the spatial distribution shown for wnLHF (Figure 7C) given the fact that (Qs-Qa) is the major component used to calculate the wnLHF. As such, it is likely that wnLHF or the difference of specific humidity is not independent of OHC, at least as it pertains to the air-sea conditions observed during the field experiment described in this research. In order to examine how and why (Qs-Qa) shows features similar to OHC we investigated Qs and Qa individually in the following section.
Qs and Qa were individually examined to better understand the link between specific humidity differences and OHC. Figure 8 presents specific humidity at the sea surface (Qs) (Figure 8A) and specific humidity at 10 m (Qa) (Figure 8B). It is clear that Qs show larger than 27 g kg-1 around the warm eddy, while values less than 25.5 g kg-1 prevail near the cold eddy. The spatial pattern of Qs, by definition, reflects the magnitude of the SST (Figure 6B), with higher values in the warm eddy region and lower values in the cold eddy environment. Lower Qs in the cold eddy may be enhanced due to the cooling effect of typhoon Talim which passed through the neighboring region (Figure 1) several days earlier (Sep.11, 2017). Looking at the horizontal distribution of Qa, values between 20.5-21.5 g kg-1 can be found in the southeastern area, while lower values between 17.5-19 g kg-1 are observed in the northwestern area of the experimental domain. Taken together, the higher values of (Qs-Qa) in the warm eddy area are a product of the combined result of higher Qs and lower Qa, while the lower values of (Qs-Qa) in the cold eddy area are the result of the lower Qs and higher Qa.
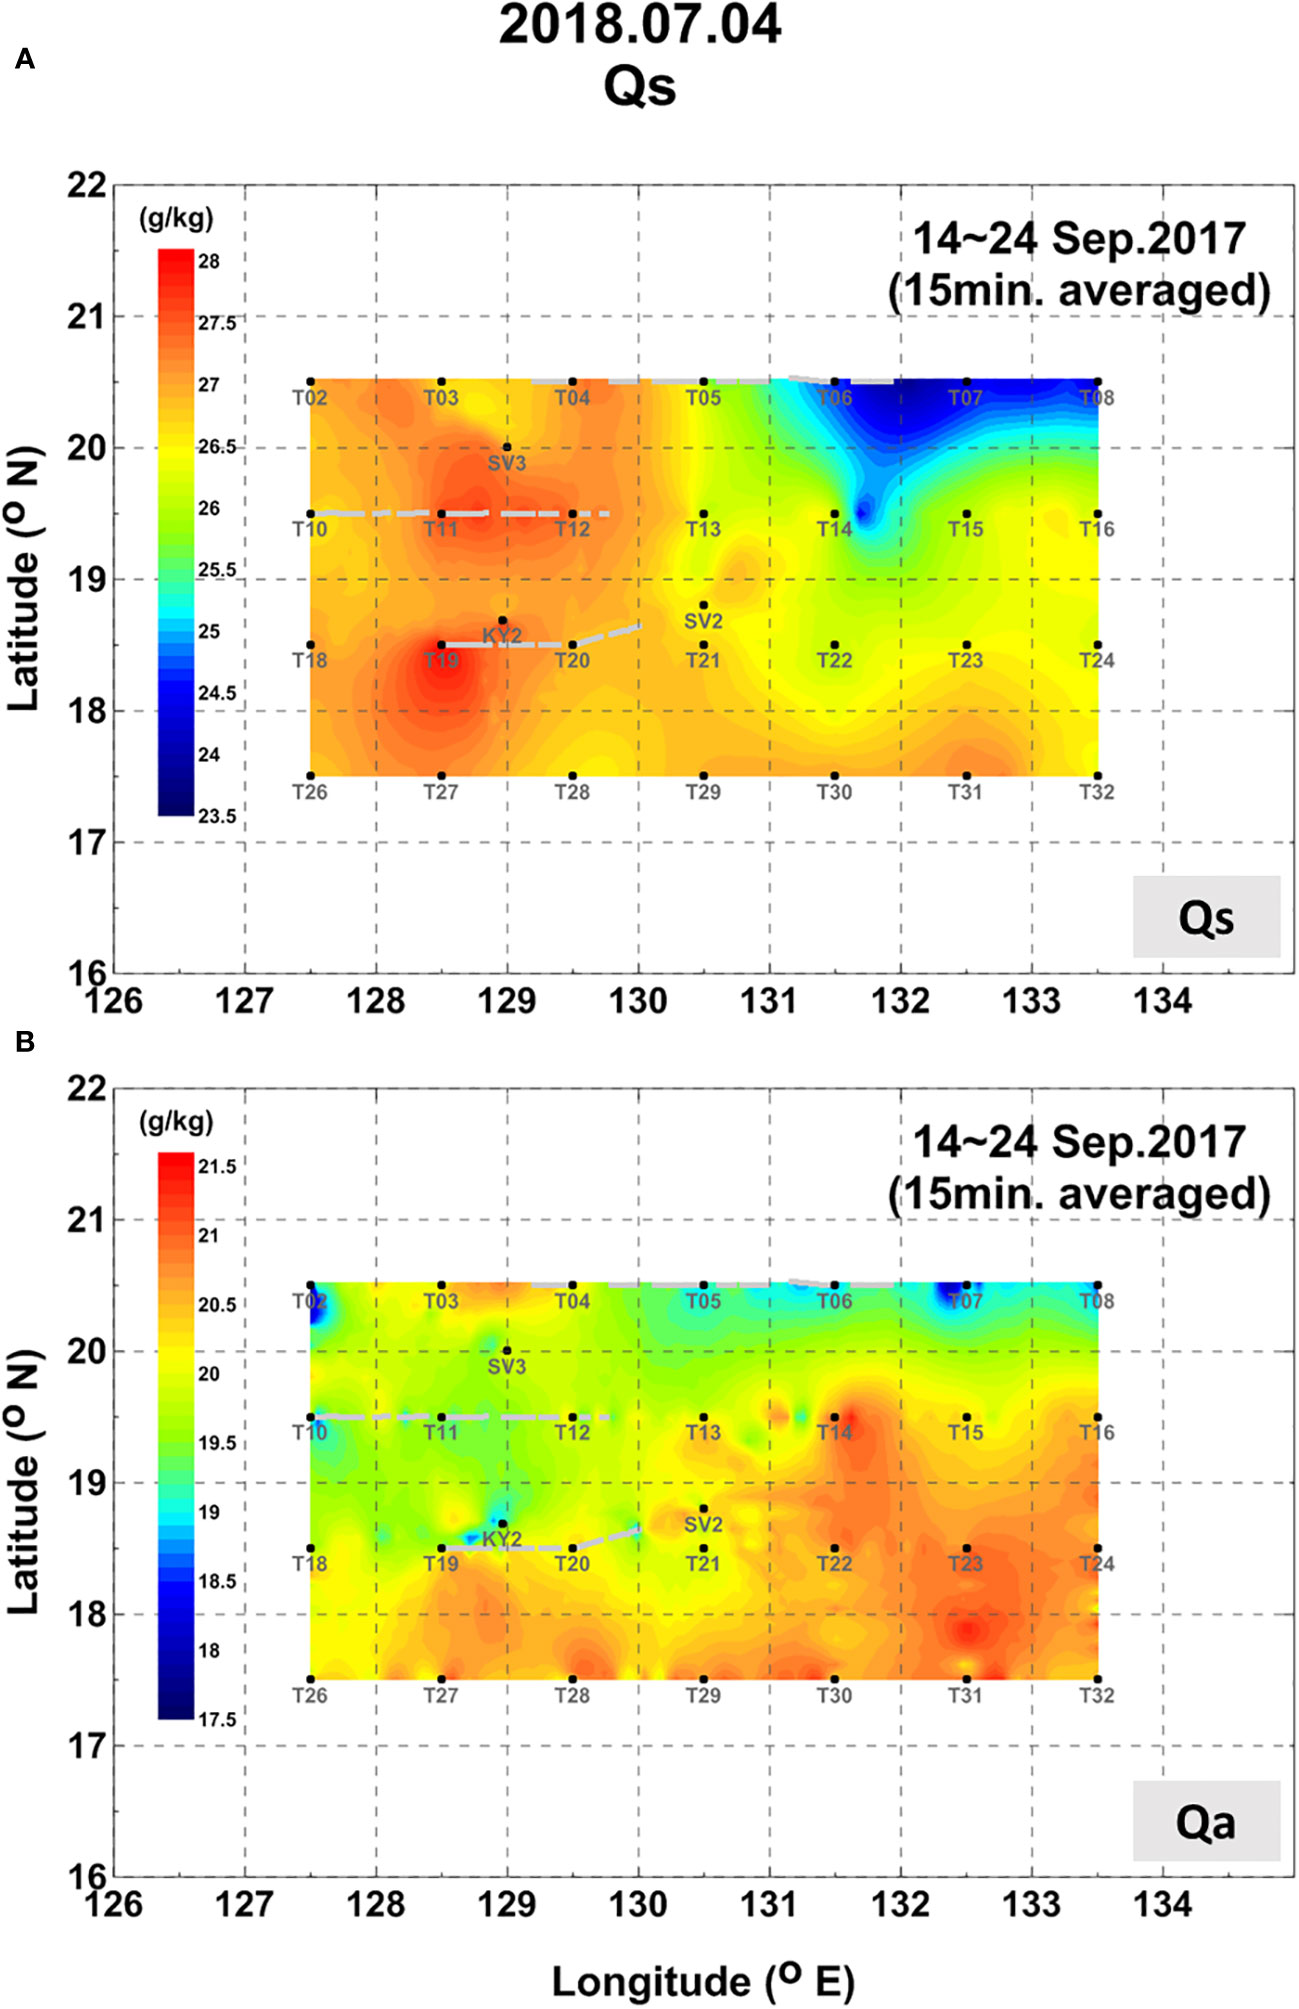
Figure 8 Specific humidity at the sea surface (Qs) (A) and specific humidity at air (Qa) (B). Qs shows higher values higher than 27 g kg-1 around warm eddy, with lower values less than 25 g kg-1 around cold eddy. Values of Qa are divided into two groups of generally higher values than 20 g kg-1 in the southeastern area, and lower values less than 19 g kg-1 in the northwestern region with some exceptions.
This analysis reveals that the horizontal pattern of OHC as an oceanic process is similar to that of specific humidity difference (Qs-Qa) as an atmospheric process around the warm and cold eddies. The vertical ocean heat storage is likely linked to the air processes around the warm and cold eddies, at least as it pertains to the air-sea environment observed during this field campaign.
To further understand the atmospheric condition within the study area, the relationship between the direction of wind and Qa is examined. Figure 9 shows specific humidity in the air and wind direction at CTD, buoy, and glider locations. The Qa values tend to be lower in northerly winds, while Qa values tend to be higher in southerly winds. The correlation coefficient is 0.45. It is increased to 0.59 without 3 outlier locations (T3, T4, and SV3) showing deviation in wind direction. This seems plausible from the point of view that the dry air blows down from the north, while moist air comes from the south or tropics.
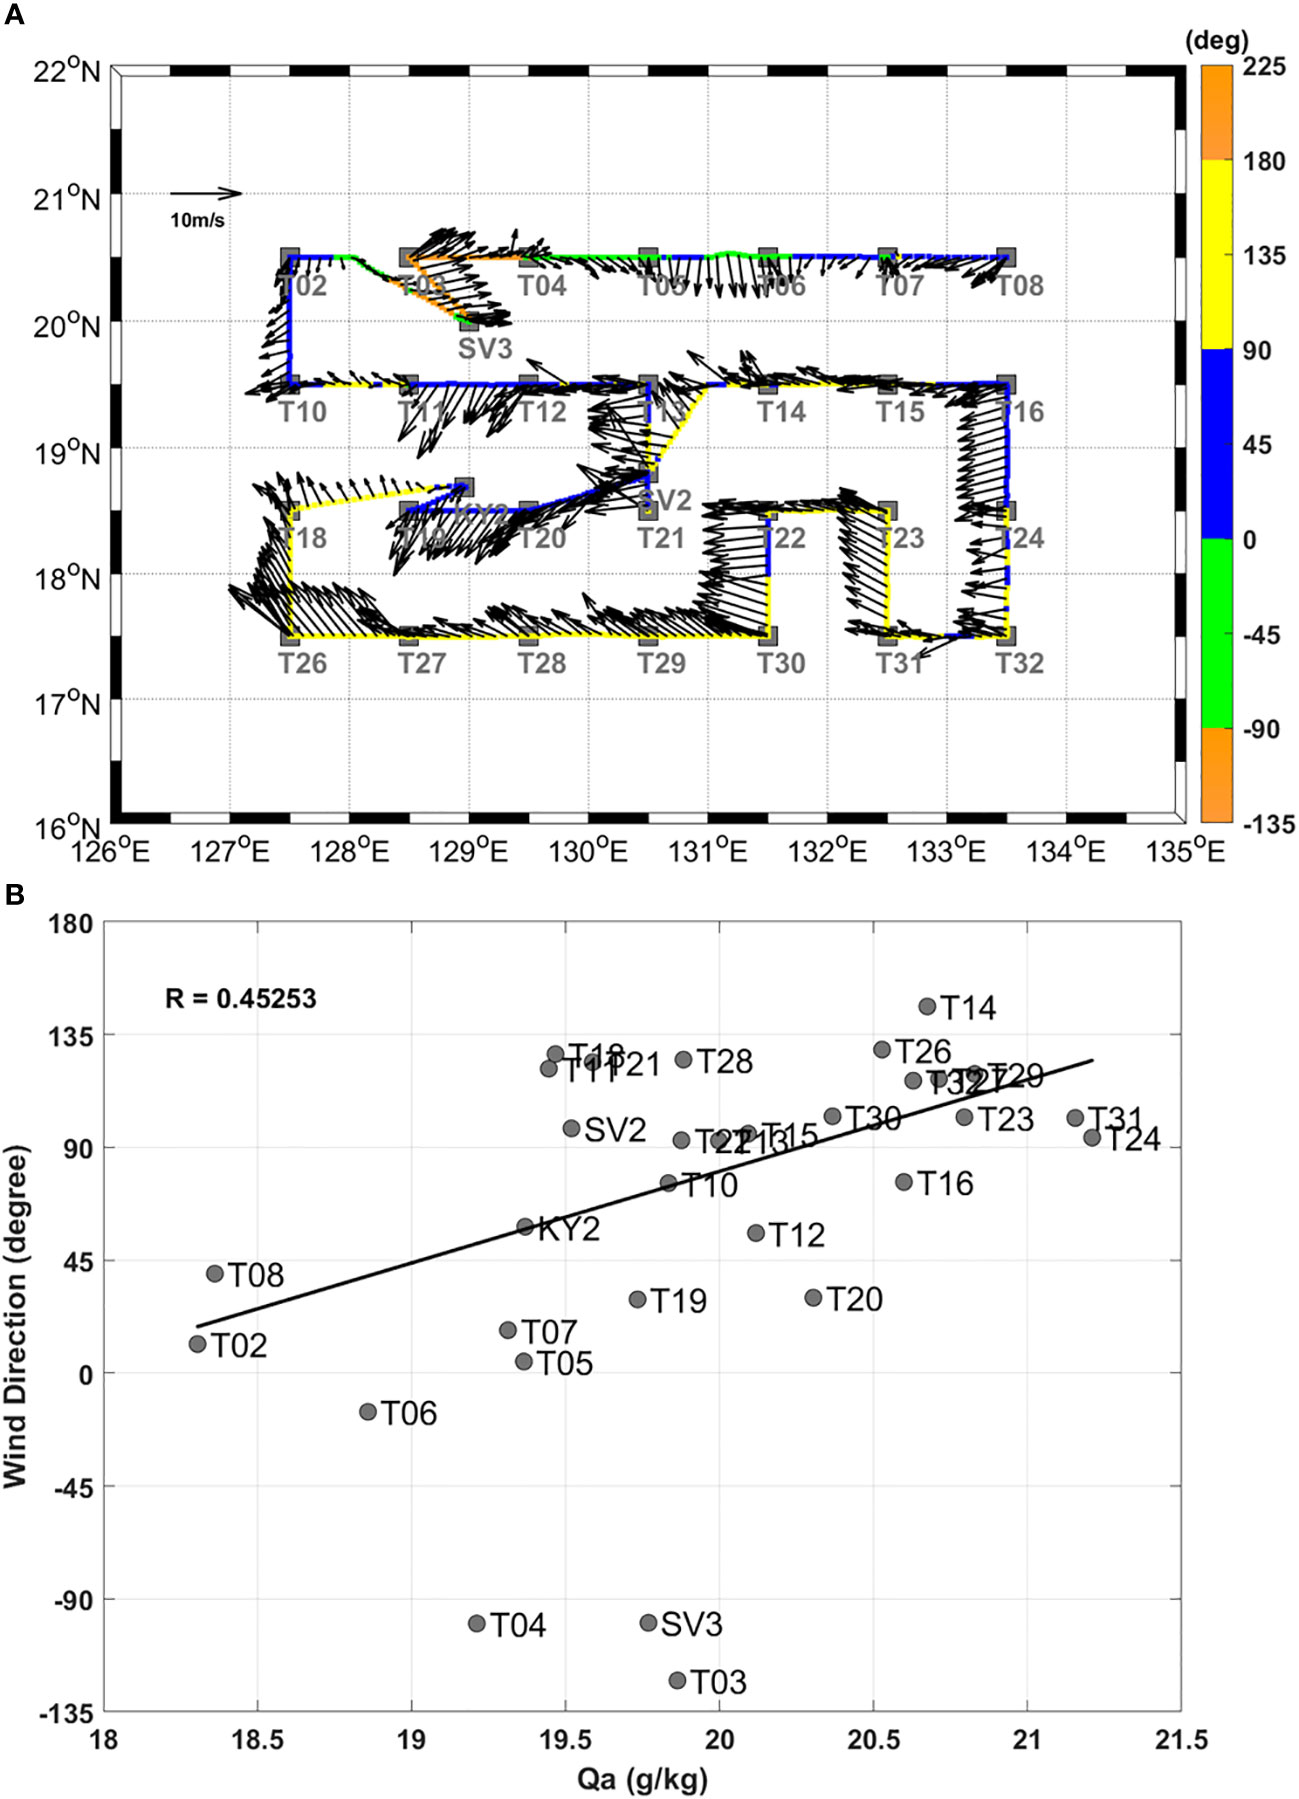
Figure 9 (A) Wind speed and direction from the sensor along the track of R/V Isabu. (B) Specific humidity at air against wind direction from the meteorological system of R/V Isabu at a height of 32.6 m. The Qa value tends to be lower in the northerly or northeasterly wind, while Qa value tends to be higher in the southerly or southeasterly wind. The line denotes a linear fitting line. The correlation coefficient R of 0.45 increased to about 0.59 without 3 locations (T3, T4, and SV3) showing deviation in direction. Wind directions at a height of 60-170 m from radiosondes data casted above at all CTD locations also show a similar trend from ship (not shown).
Therefore, the enhanced normalized LHF around the warm eddy is a result of high Qs and low Qa under northerly wind conditions which acts to advect relatively dry continental air over the higher SST, warm eddy region. In contrast, lower normalized LHF values around the cold eddy are associated with low Qs and high Qa conditions that occur during relatively moist southerly wind conditions. These analyses help explain how relatively moderate wind speeds of 10 m s-1 or less within the warm eddy region exhibit large values of LHF (300-400 W m-2) typically observed under higher wind conditions.
The warm eddy region even under low wind conditions can serve as a strong upward heat flux source as long as “favorable” offshore wind direction conditions are present. In this case, the near-surface specific humidity is maximized because SST is high but due to the relatively drier near-surface air associated with the flow coming off the land (versus the sea), the larger values of LHF are realized.
An extensive ocean field campaign using the research vessel Isabu was carried out within the eddy-rich region of the NWP during the summer of 2017. During this experiment, analysis revealed anomalously high surface LHF values between 300-00 W m-2 during periods of modest to low wind speed. These values are surprising given previous results from Cione et al. (2000; 2013) and more recent findings where near-surface LHF values on the order of 850 W m-2 were estimated directly within the eyewall of Hurricane Maria under much higher wind conditions (45-55 m s-1). These results remind us that surface LHF is linearly dependent upon wind speed, SST, and near-surface atmospheric moisture conditions and that any one of those components, under the right circumstances, can dominate. In this particular instance, large values of LHF were observed under relatively low wind conditions because SST values were high in the warm eddy region while the offshore dry air simultaneously resulted in Qa values that were anomalously low. The resulting air-sea thermodynamic conditions of this specific set of circumstances produced anomalously high values of surface LHF within the vicinity of the warm ocean eddy located within the experimental domain. These high OHC and a resultant high LHF in the warm eddy, comparable to the magnitude of LHF in the North Equatorial Current, may explain the mechanism of why TCs over a warm eddy in eddy-rich zones often rapidly intensify in the WNP (Kang et al., 2024). The OHC affects the SST which then affects the wind-normalized LHF by Qs. SST is a balance between the underlying ocean mesoscale (the warm and cold eddies), the solar heating, and the wind-driven upwelling/downwelling/mixing. The high SST from high OHC finally explains the mechanisms of how OHC impacts LHF and how warm eddies impact storm intensification.
We consider the dynamic nature of the ocean. Under strong wind surface mixed layer becomes gradually well mixed by vertical wind-driven shear initiated at the sea surface, and again the mixed layer experiences mixed layer deepening or entrainment by thickening of the mixed layer at the bottom of the mixed layer, or thermocline mixing from upper part of thermocline. Therefore, the temperature of the thicker mixed layer loses heat and becomes cool, or SST experiences cooling. This occurs while TC passes over the ocean, and if the ocean has a warm deep mixed layer, the cooling is much restricted due to a warm thick mixed layer for the same thermocline mixing, contributing to TCs intensification with higher LHF around warm eddy. Since the bulk LHF depends upon the wind speed (Equation 2), LHF will be higher around warm eddy regions keeping high Qs.
This study supports the contention that air-sea interactive physical processes are indeed coupled over both warm and cold ocean eddy features. A high correlation between OHC and wnLHF, large OHC and wnLHF values around the warm eddy in contrast to lower OHC and wnLHF around the cold eddy, suggests that ocean feature drives surface latent heat flux, closely linked to air feature of high specific humidity by prevailing warm southerly wind. In summary of scientific findings for this, the observations document a case where the mesoscale variability of the high SSTs over a warm eddy combined with dry air from over land can produce LHF value as large as those experienced with high tropical cyclone wind speeds and moist air from over water.
This study implies that the enhanced latent heat flux under moderate wind speed resulting from the contribution of a typical warm eddy and favorable weather effects can easily jump to higher values if winds increase in magnitude. The TC intensified into a super typhoon (Typhoon Lan) one month later as it passed through this region, as shown in Figure 10. The RI may have been caused by the observed warm eddy with high LHF, despite its westward movement of approximately 250 km. Warm eddies characterized by high LHF may cause RI under favorable atmospheric conditions. The warm eddy located west of Typhoon Lan’s eye on Sep. 20, 2017, may have contributed to the tropical cyclone’s RI, as illustrated in Figure 11. Using a normalized LHF value of 20 W m-2 for every 1 m s-1 wind speed (Figure 7C), a wind speed of 30 m s-1 corresponds to an LHF of approximately 600 W m-2. RI is typically associated with LHF values ranging from 600 to 900 W m-2 (Lin et al., 2009; Jaimes et al., 2015; Kang et al., 2024). It shows that Lan experiences a relatively warm ocean of OHC ranging from 60-80 kJ cm-2 during the rapid intensification from 80 kts at 18:00 (Oct. 19, UTC) to 130 kts at 18:00 (Oct. 20). Therefore, the ocean may release heat into the atmosphere as Typhoon Lan passed over the warm region, although there is some uncertainty from the reanalysis data. Generally, an OHC of at least 50 kJ cm-2 is considered necessary for the rapid intensification of tropical cyclones, including typhoons. However, OHC values exceeding 100 kJ cm-2 are often associated with significant rapid intensification of typhoons.
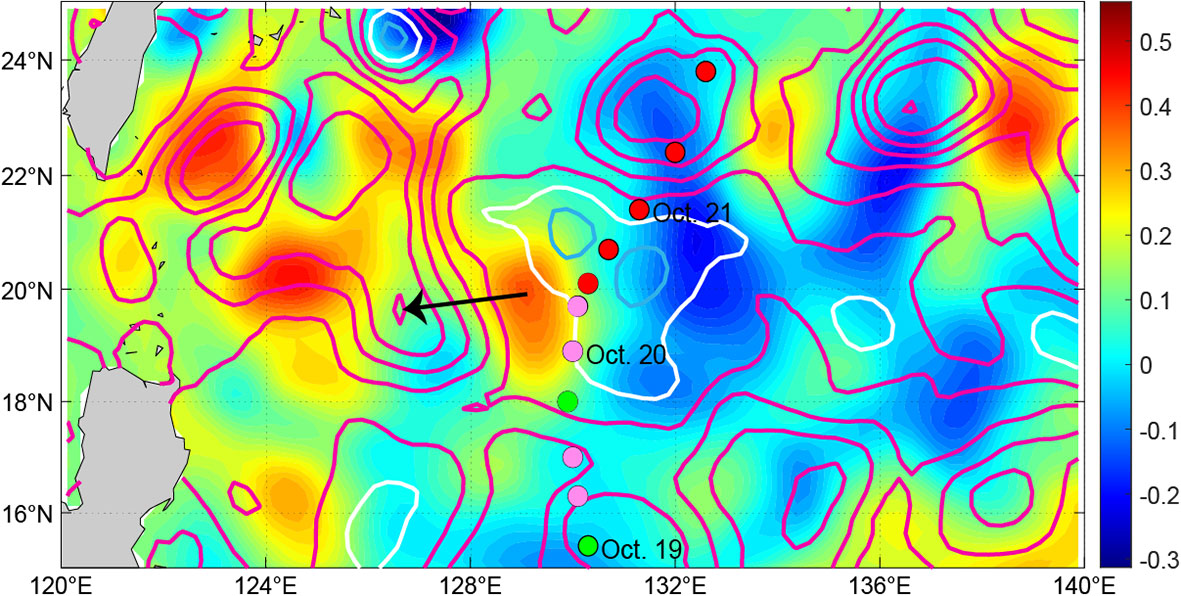
Figure 10 Contour lines of Sea Level Anomaly (SLA) on October 20, 2017. The white contour lines indicate the approximate boundary between the warm eddy (in magenta) and the cold eddy (in blue). The background color contours represent the SLA on September 15, 2017. The westward movement of the warm eddy is indicated by the arrow. The locations of Typhoon Lan are shown as circles. The colors indicate the typhoon’s category: green for Category 1, pink for Category 2, and red for Category 4 (super typhoon with winds equal to or greater than 130 kts).
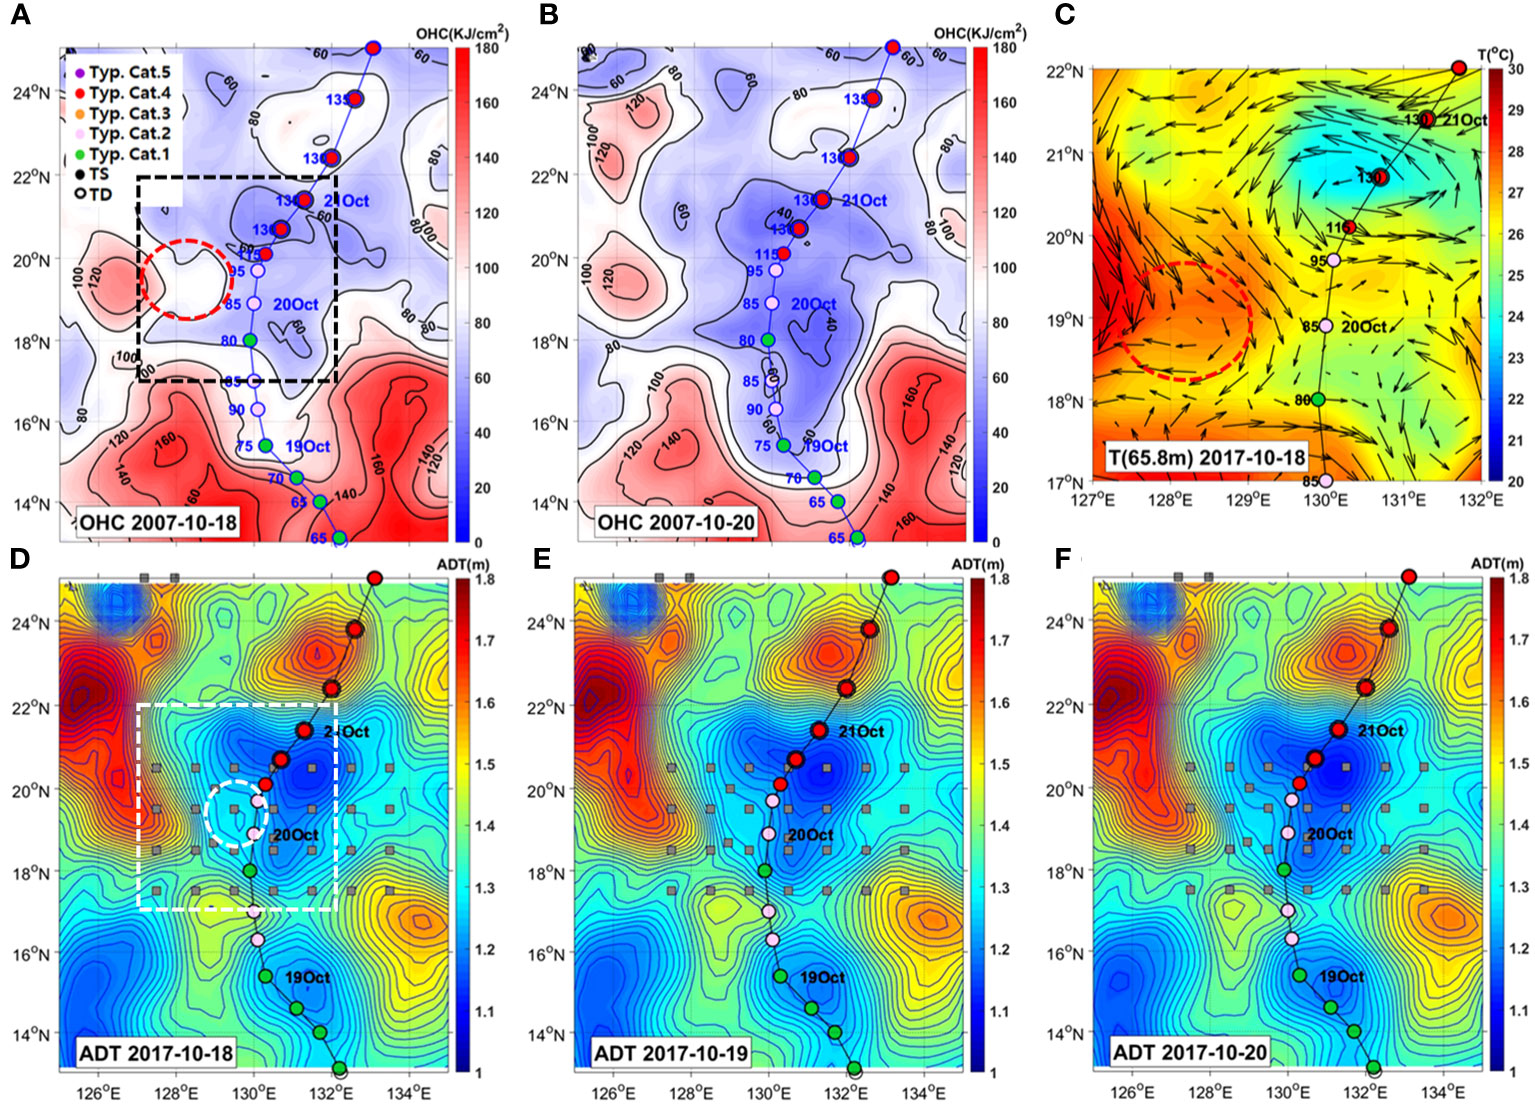
Figure 11 Variations of Ocean Heat Content (OHC) estimated from GLORYS reanalysis data associated with Typhoon Lan over three days: Oct. 18 (A), and Oct. 20 (B). The ocean temperature with current vectors (C) from GLORYS reanalysis data at 68m depth on Oct. 18. Satellite observed Absolute Dynamic Topography (ADT) on Oct. 18 (D), Oct. 19 (E), and Oct. 20 (F). Locations of Typhoon Lan are marked with circles, indicating wind speed (kts) and time. The dotted circles highlight a submerged small anticyclonic eddy.
From the GLORYS reanalysis data, as illustrated in Figure 11, varying OHC values ranging from 60 to 80 kJ/cm² were shown before (Figure 11A, Oct.18) and during the RI (Figure 11B, Oct.20). An OHC exceeding 80 kJ/cm² before the RI, by a western warm eddy, was shown over 80 kJ/cm² approximately 100 km west of the typhoon’s eye (red dotted circle region, Figure 11A) when TC reached Category 4. The maximum RI occurred from 18:00 (Oct.19) to 18:00 (Oct.20), when RI will be driven due to surrounding high OHC as an ocean factor. We discuss the presence of the high OHC area in the western side of the TC Lan track during RI, which is interesting since LAN was rapidly intensified to Category 4 super typhoon under moderate OHC of 60 to 80 kJ/cm².
We notice that the submerged eddy feature from absolute dynamic topography (ADT)(white dotted region, Figure 11D), corresponding to the red dotted region in the model (Figure 11A), keeps existing along the track until RI occurs (Figure 11F). The submerged eddy appears as anticyclonic eddy in the thermocline layer of 65.8m depth with high temperature of about 28˚C in model (Figure 11C). The presence of the submerged warm eddy is likely to result in an asymmetric distorted pattern of cold eddy region (Figures 11D–F).
As discussed, we would like to focus on the persisting effect of the small warm eddy we described. The detailed contour lines (Figures 11D–F) show that the submerged small eddy or warm anomaly (Figure 11D, white dotted circles) is likely to be linked to the western warm eddy, as seen in Figures 11A, D. This submerged eddy seems to keep a high OHC of 80 kJ/cm² eastward (Figure 11A). Slightly high anomalous OHC appears to exist from the reanalysis model for the last several days before RI (Figures 11D, E), keeping surely linked to the western warm eddy. The submerged eddy is located nearer along the track than the model is, then more contributing to RI with high OHC.
Therefore, it is likely to say that the warm eddy, which keeps moving westward, keeps playing a role in intensifying TC passing the region one month later, through the linkage of the warm eddy to the small scale of submerged eddy by the unresolved mechanism.
Publicly available datasets were analyzed in this study. This data can be found here: https://www.ncei.noaa.gov/data/international-best-track-archive-for-climate-stewardship-ibtracs/v04r00/access/netcdf/.
SK: Conceptualization, Writing – original draft, Writing – review & editing. EK: Formal analysis, Methodology, Writing – review & editing. SK: Data curation, Methodology, Writing – review & editing. JC: Conceptualization, Writing – review & editing. DL: Validation, Writing – review & editing. SL: Methodology, Writing – review & editing. H-WK: Validation, Writing – review & editing. K-OK: Validation, Writing – review & editing. CH: Methodology, Writing – review & editing. MK: Formal analysis, Writing – review & editing. K-HO: Methodology, Writing – review & editing. JHL: Validation, Writing – review & editing. SN: Formal Analysis, Writing – review & editing. JS: Writing – review & editing. D-JK: Writing – review & editing, Methodology. DK: Writing – review & editing, Formal analysis. J-HP: Writing – review & editing, Data curation. SN: Writing – review & editing, Validation. YK: Supervision, Writing – review & editing.. BW: Supervision, Writing – review & editing. IG: Supervision, Writing – review & editing.
The author(s) declare financial support was received for the research, authorship, and/or publication of this article. This research was a part of the project titled “Study on Northwestern Pacific warming and genesis and rapid intensification of typhoon”, funded by the Ministry of Oceans and Fisheries, Korea (20220566). This research was supported by Korea Institute of Marine Science & Technology Promotion (KIMST) funded by the Ministry of Oceans and Fisheries (20220566, 20220033).
The authors declare that the research was conducted in the absence of any commercial or financial relationships that could be construed as a potential conflict of interest.
All claims expressed in this article are solely those of the authors and do not necessarily represent those of their affiliated organizations, or those of the publisher, the editors and the reviewers. Any product that may be evaluated in this article, or claim that may be made by its manufacturer, is not guaranteed or endorsed by the publisher.
Biswas M. K., L. Bernardet S., Abarca I., Ginis E., Grell E., Kalina Y., et al. (2017). Hurricane Weather Research and Forecasting (HWRF) Model: 2017 Scientific Documentation, NCAR Technical Note NCAR/TN-544+STR, doi: 10.5065/D6MK6BPR
Chelton D. B., Esbensen S. K., Schlax M. G., Thum N., Freilich M. H., Wentz F. J., et al. (2001). Observations of coupling between surface wind stress and sea surface temperature in the Eastern Tropical Pacific. J. Climate 14, 1479–1498. doi: 10.1175/1520-0442(2001)014<1479:OOCBSW>2.0.CO;2
Cione J. J., Black P. J., Houston S. (2000). Surface observations in the hurricane environment. Mon. Wea. Rev. 128, 1550–1561. doi: 10.1175/1520-0493(2000)128<1550:SOITHE>2.0.CO;2
Cione J. J., Kalina E. A., Zhang J. A., Uhlhorn W. W. (2013). Observations of air-sea interaction and intensity change in hurricane. Mon. Weather Rev. 141, 2368–2382. doi: 10.1175/MWR-D-12-00070.1
Friehe C. A., Schmitt K. F. (1976). Parameterization of air-sea interface fluxes of sensible heat and moisture by the bulk aerodynamic formulas. J. Phys. Ocanogra. 6, 801–809. doi: 10.1175/1520-0485(1976)006<0801:POASIF>2.0.CO;2
Hashizume H., Xie S.-P., Takeuchi K. (2001). Local and remote response to tropical instability waves: a global view from space. J. Geophys. Res. 106, 10173–10185. doi: 10.1029/2000JD900684
Jaimes B., Shay L. K., Brewster J. K. (2016). Observed air-sea interactions in tropical cyclone Isaac over Loop Current mesoscale eddy features. Dyn. Atmos. Ocean 76, 306–324. doi: 10.1016/j.dynatmoce.2016.03.001
Jaimes B., Shay L. K., Uhlhorn E. W. (2015). Enthalpy and momentum fluxes during Hurricane Earl relative to underlying ocean features. Mon. Wea. Rev. 143, 111–131. doi: 10.1175/MWR-D-13-00277.1
Kang S. K., Kim S. H., Lin I.-I., Park Y. H., Choi Y., Ginis I., et al. (2024). The north equatorial current and rapid intensification of super typhoons. Nat. Comms.
Lin I.-I., Chen C.-H., Pun I.-F., Liu W. T., Wu C.-C. (2009). Warm ocean anomaly, air sea flux, and the rapid intensification of tropical cyclone Nargis, (2008). Geophy. Res. Lett. 36, Lo3817. doi: 10.1029/2008GL035815
Lin I.-I., Wu C.-C., Emanuel K. A., Lee I.-H., Wu C.-R., Pun I.-F. (2005). The interaction of supertyphoon Maemi, (2003) with a warm ocean eddy. Mon. Weather Rev. 133, 2635–2649. doi: 10.1175/MWR3005.1
Liu W. T., Xie X., Polito P. S., Xie S.-P., Hashizume H. (2000). Atmospheric manifestation of tropical instability wave observed by QuikSCAT and tropical rain measuring mission. Geophys. Res. Lett. 27, 2545–2548. doi: 10.1029/2000GL011545
Mantua N. J., Hare S. R., Zhang Y., Wallace J. M., Francis R. C. (1997). A Pacific Interdecadal Climate Oscillation with Impacts on Salmon Production*. Bulletin of the American Meteorological Society, 78 (6), 1069–1080. doi: 10.1175/1520-0477(1997)078<1069:APICOW>2.0.CO;2
Okumura Y., Xie P., Numaguti A., Tanimoto Y. (2001). Tropical Atlantic air-sea interaction and its influence on the NAO. Geophysical Research Letters, 28 (8), 1507–1510. doi: 10.1029/2000GL012565
Shay L. K., Uhlhorn E. W. (2008). Loop Current Response to Hurricanes Isidore and Lili. Monthly Weather Review 136 (9), 3248–3274. doi: 10.1175/2007MWR2169.1
Shay L. K., Brewster J. K. (2010). Ocean heat content variability in the Eastern Pacific Ocean for hurricane intensity forecasting. Mon. Weather Rev. 138, 2110–2131. doi: 10.1175/2010MWR3189.1
Shay L. K., Goni G. J., Black P. G. (2000). Effects of a warm oceanic feature on Hurricane Opal. Mon. Weather Rev. 128, 1366–1383. doi: 10.1175/1520-0493(2000)128<1366:EOAWOF>2.0.CO;2
Small R. J., deSzoeke S. P., Xie S. P., O’Neill L., Seo H., Song Q., et al. (2008). Air-sea interaction over ocean fronts and eddies. Dyn. Atmos. Ocean 45, 274–319. doi: 10.1016/j.dynatmoce.2008.01.001
Song X., Xie X., Qiu B., Cao H., Xie S.-P., Chen Z., et al. (2022). Air-sea latent heat flux anomalies induced by oceanic submesoscale processes: an observational case study. Front. Mar. Sci. 9. doi: 10.3389/fmars.2022.850207
Keywords: latent heat flux, eddy-rich zone, ocean heat content, specific humidity, tropical cyclone-ocean interaction
Citation: Kang SK, Kim EJ, Kim S, Cione J, Lee D, Landwehr S, Kang H-W, Kim K-O, Hong CS, Kwon MH, Oh K-H, Lee JH, Noh S, So JK, Kang D-J, Kim D, Park J-H, Nam S, Cho YK, Ward B and Ginis I (2024) Anomalously large latent heat fluxes in low to moderate wind conditions within the eddy-rich zone of the Northwestern Pacific. Front. Mar. Sci. 11:1298641. doi: 10.3389/fmars.2024.1298641
Received: 22 September 2023; Accepted: 22 January 2024;
Published: 06 February 2024.
Edited by:
Scott Glenn, The State University of New Jersey, United StatesCopyright © 2024 Kang, Kim, Kim, Cione, Lee, Landwehr, Kang, Kim, Hong, Kwon, Oh, Lee, Noh, So, Kang, Kim, Park, Nam, Cho, Ward and Ginis. This is an open-access article distributed under the terms of the Creative Commons Attribution License (CC BY). The use, distribution or reproduction in other forums is permitted, provided the original author(s) and the copyright owner(s) are credited and that the original publication in this journal is cited, in accordance with accepted academic practice. No use, distribution or reproduction is permitted which does not comply with these terms.
*Correspondence: Sok Kuh Kang, c2trYW5nQGtpb3N0LmFjLmty
Disclaimer: All claims expressed in this article are solely those of the authors and do not necessarily represent those of their affiliated organizations, or those of the publisher, the editors and the reviewers. Any product that may be evaluated in this article or claim that may be made by its manufacturer is not guaranteed or endorsed by the publisher.
Research integrity at Frontiers
Learn more about the work of our research integrity team to safeguard the quality of each article we publish.