 Dapeng Zhang
 Bowen Zhao
 Jiyuan Sun3
- 1Ship and Maritime College, Guangdong Ocean University, Guangdong Zhanjiang, China
- 2Department of Applied Mathematics and Mathematical Modeling, Saint-Petersburg State Marine Technical University, Saint-Petersburg, Russia
- 3Ocean College, Zhejiang University, Zhejiang, Zhoushan, China
In this study, the SUBOFF UUV is numerically modelled in order to investigate the hydrodynamic features and effects of submerged navigation near the free surface. At various speeds and depths below the surface, the hydrodynamic behaviors of the SUBOFF UUV are examined. From the CFD results, we can deduce that submergence depth significantly affects total resistance of SUBOFF navigation nearby free surface. Because the Kelvin wake of SUBOFF creates wave-making resistance when approaching the open surface head-on, the fraction of pressure difference resistance becomes dramatically with an increase in Fr. The principle of superposition of the divergent wave system and the transverse wave system gradually reveals the divergent wave system as Fr grows larger. The wave making energy is greater, and the UUV needs more power to overcome the wave making resistance.
1 Introduction
As the number of ships increases, concerns about the effects of wakes on coastal infrastructure and nearshore ecosystems are growing and underwater vehicles have shown significant growth over an extended period. (Herbert et al., 2018; Scarpa et al., 2019; Luo et al., 2022). Ship and underwater vehicle speed and size, water depth, bottom morphology, and distance from shore all affect the size, shape, speed, and direction of the wakes (Liu et al., 2021; Xue et al., 2021; Zhou et al., 2022; Ding et al., 2023). In deep, open waters, ships and undersea vehicles typically produce wakes that correspond to linear solutions (Pethiyagoda et al., 2014; Pethiyagoda et al., 2017), yet waves from close-to-shore or free-surface might behave nonlinearly. (Sadat-Hosseini et al., 2011; Caplier et al., 2016; Dempwolff et al., 2023; Song et al., 2023). Wake formation can be a consideration in ship and underwater vehicle layout is necessary since their wakes can endanger coastal infrastructure and ecosystems and act as a fuel drain for ships. (Kelpšaite et al., 2009).
UUVs are kind of underwater vehicles which can both navigate on the surface and dive underwater (Zhao et al., 2022; Zhao et al., 2023). Due to the operational environment and tactical limitations, conventional powered UUVs sailing near the free surface often need to complete tactical actions such as near surface ventilation, power generation, rescue, missile launch, and periscope depth observation. Compared to deep water diving, UUVs sailing near the surface are affected by the Venturi effect, and their hydrodynamic forces show significant changes with depth and speed (Wang et al., 2019; Ling et al., 2022a; Ling et al., 2022b; Li et al., 2021; Dong et al., 2022; Huang et al., 2022). This requires UUVs to have good stealth technology. However, even an UUV with good silence and stealth will generate a wake in its trajectory when sailing near the free surface. The eddy currents, internal waves, and other information in the wake contain flow velocity information, which can be maintained in the free surface for a long time. Therefore, the position and direction of the UUV can be determined based on the shape characteristics and speed changes of the wake (Polis et al., 2013; Torunski, 2018; Kim, 2021). As a carrier for disseminating UUV motion information, the flow analysis of the UUV wake area has very important military significance.
During an UUV movement near the shallow water, a distinctive wake will be generated behind the UUV. While an UUV is in proximity to the open ocean, a waveform similar to that of a ship will be generated on the free surface (Amiri et al., 2019a; Wang et al., 2020; Yang et al., 2023). The influence of viscous wake will exist for a long time. The waves with special shapes generated on the free surface during UUV navigation will expose the UUV’s tracks. When UUVs move underwater, there is yet a Kelvin wake on the far field water surface composed of transverse and divergent waves, enveloped at an angle of 19.5°. In the early research of UUV hydrodynamics (Griffin, 2002; Chang et al., 2006), scholars have recognized the changes in underwater hydrodynamic performance when sailing near the surface. They believe that when the depth of submergence H ≤ 3D (D is the diameter of the UUV), the hull is subjected to significant suction and moment, and the suction decays exponentially with the increase of submergence depth. With the continuous improvement of UUV design technology, scholars have been suggesting that the hydrodynamic performance of UUVs close to the free surface can be resolved using strip theory and potential flow techniques for a long time (Crook, 1994; Liu and Jin, 2017). Currently, there are still many related studies on UUV hydrodynamic properties close to the free surface considering complex conditions such as wave effects based on potential flow methods such as Havelock source (Dawson, 2014; Gourlay and Dawson, 2015) and Frank source (Dai et al., 2007). However, the above methods ignore the influence of fluid viscosity, and their applicability is regularly controlled by operating environment and calculation capability.
With increasing improvement of computing efficiency, it is feasible to study the hydrodynamic performances of UUVs based on viscous flow theory (Toxopeus, 2008; Chase, 2012; Chase and Carrica, 2013; Chase et al., 2013). CFD (Computational Fluid Dynamic) technology provides a fast and accurate method for studying the hydrodynamic proficiency of UUVs in vicinity to broad open surface, demonstrating an increasingly important position and role (Ling et al., 2023; Cao et al., 2023). Different scholars have investigated the hydrodynamic exposition of the UUV navigation near the open ocean plane. For instance, Shariati and Mousavizadegan (2017) studied the impacts of adjuncts on the SUBOFF UUV’s hydrodynamic performance while submerged at varying depths while sailing across the open surface. The results showed that when travelling near the open surface at a depth of less than 4.4 times the vehicle’s diameter, the overall resistance of an undersea transportation was negligible for Froude numbers equal to 0.2 and 0.36 because of the beneficial interference of produced wave systems. Amiri et al. (2018, 2019b, 2020a; 2020b) used the URANS (Unsteady Reynolds Average Navier-Stokes) method to simulate the direct, oblique, and rotating behavior of the SUBOFF UUV model at different depths, and studied the effects of free surface on the maneuverability of the UUV. Lungu (2022) studied the movement of the DARPA SUBOFF, which is self-propelled and operating below the free surface. Surface gravity waves that are stationary with regard to the hull were calculated to be caused by the interplay between the modified dynamic distribution of pressure throughout the UUV hull and the proximity of the hull to the free surface. Ma et al. (2020) numerically analyzed the impact of the pycnocline, UUV depth, and speed on both internal and floating surface waves. The findings demonstrated that increasing UUV depth could lessen the internal wave’s potential impact and postpone the development of the vortex that would follow the internal wave. The propagation depth of the internal wave and the vortex’s radius, however, were barely impacted by the UUV depth. According to certain studies, the free surface wave’s wavelength significantly decreased and its Kelvin angle increased relatively when the UUV’s speed decreased.
Many efforts have been made in recent years to use CFD method to solve hydrodynamics of the UUV navigation near the open sea surface. The hydrodynamic performance and wake study are constantly being researched. A brief analysis of the most recent research reveals, the physical process involved is still unexplained in several respects. In this paper, the SUBOFF UUV sailing near the free surface is numerically simulated and hydrodynamic performance as well as wake study under different sailing speeds and submerge depths are supported out. The rest of this paper is organized as follows. Section 2 presents the CFD methodology used in this paper. Section 3 presents the numerical model of SUBOFF UUV seafaring near the free surface, which is established in a commercial CFD software Star-CCM+ using SST k-ω turbulent model and VOF method. Verification study is carried out in Section 4, including the grid independence study and validation. Hydrodynamic performance as well as wake study are discussed in Section 5, covering hydrodynamic forces and moment, dynamic pressure distribution and wakes on the free surface. The hydrodynamic forces and moment are intuitively reflected by the hydrodynamic performance of UUV sailing near free surface. The aim of dynamic pressure distribution is to further investigate the mechanism in the hydrodynamic change. The free surface and wake generated by the UUV is captured by VOF method. Finally, conclusions draw form this paper are presented in Section 6.
2 Methodology
2.1 Governing equation
In this paper, the CFD code used for the simulations is Star-CCM+. The conservation of mass, linear momentum, angular momentum, and energy are the four fundamental rules that govern the mechanics of fluids and solids. The Navier-Stokes and continuity equations are the most complete system of equations for fluid motion. The Reynolds Averaged Navier Stokes (RANS) equations, which control the propagation of the average flow quantities in CFD simulation, have closure relations provided by turbulence models. By breaking down each solution variable into its mean value and its fluctuating component, the Reynolds-Averaged Navier-Stokes equations are created from the instantaneous Navier-Stokes equations (ϕ’), as shown in Equation 1:
where ϕ stands for the various elements of velocity, pressure, energy, or species concentration.
For steady-state settings, be an average of procedure would be reasoned of as averaging-time, and for repeating transient events, as ensemble averaging. Equations for the mean quantities may be obtained by substituting the Navier-Stokes equations with the decomposed solution variables. For the average mass and momentum, use these equations transit as shown in Equations 2, 3:
where, ρ, , , I, I, , represents density, mean (velocity, pressure, identity tensor and viscous stress tensor) and fb is resultant forces (gravitational and centrifugal).
Except for the inclusion of a new component in the momentum and energy transfer equations, re almost similar to the original Navier-Stokes equations. The following Equation 4 is a definition for the stress tensor, a new concept introduced here:
where k is the turbulent flow’ kinetic energy.
As a result, solving the governing equations by modeling T’ in relation to the median flow variables is challenging. The foremost equations are solved by using the eddy viscosity model in given research. The eddy viscosity model is established on the similarity between the turbulent motion and molecular gradient-diffusion mechanism. The turbulent eddy viscosity notion allows for the representation of the pressure tensor as a function of average flow variables.
2.2 Turbulence model
The turbulent eddy viscosity (Wilcox, 1998; 2008) is calculated using two-equation model, mainly including k-ω model and k-ε model. The k-ω model has been shown to perform better for boundary layers when there are negative pressure gradients than the k-ε model. The biggest benefit, however, is that it may be used without additional modification in the viscous-dominated portion of the boundary layer as well.
The SST k-ω model is employed as the turbulence model in this study. The converted equation resembles the Standard k-ω model equation, but it also includes a new non-conservative cross-diffusion component that contains the dot product ∇k·∇ω. The k-ω model may provide results that are the same as the k-ε model if this term is added to the transport equation. Menter (1994) advocated the use of a blending function (which incorporates wall distance functions) that would incorporate a cross-dispersion factor not close to the wall but distant from walls. This method successfully combines a k-ε model in the distant field with a k-ω model close to the wall. The carriage equations for the specific dissipation rate k and the kinetic energy ω are shown in Equations 5, 6:
where, , and μ, are mean velocity dynamic viscosity. σk, and σω, Cε1, and Cε2 are model coefficients. Pk and Pω are production values. fβ∗ and fβ are vortex-stretching and vortex-stretching modification factor. Sk and Sω are user-specified source relations. k0 and ω0 are ambient disorder standards that stabilize disorder dwindling.
2.3 Volume of fluid method
The development of free surface using the volume of fluid (VOF) method, for a two-stage flow is captured. The actualization of VOF multiphase model is a member of a group of interface-capturing techniques that forecast when immiscible phase interfaces would move and disseminate. This modeling strategy presupposes that the mesh resolution sufficient for identifying the location and geometry of the phase interactions. The phase volume fraction and ai fields, respectively, characterize the phase distribution and interface location. The following Equation 7 describes the volume fraction of phase i:
where V is cell’s volume and Vi is volume of phase I within the cell. It is generalized that volume fractions phases are sum a maximum value of 1, as shown in Equation 8.
where N represents total phases.
The existence of distinct phases or fluids in a cell may be identified based on the volume fraction’s value:
αi =0 complete negated of phase i;
αi =1 occupied with phase i;
0 < αi < 1 denotes the difference between the two limits point to the existence of a phase interface.
The substantial properties of the component fluids are taken into account when calculating the material properties of the cells comprising the interface. In a cell with many interfaces, all of the fluids are considered to be part of a single mixturem as shown in Equations 9, 10:
where ρi, and μi are density and dynamic viscosity of phase i.
3 Numerical model set-ups
3.1 Calculation model and domain
The calculation model in the present article is the standard model SUBOFF UUV suggested by the DARPA (Defense Advanced Research Projects Agency) and contains appendage combinations such as axisymmetric bodies and tail rudders. The calculation model and related function are given in Figure 1 and Table 1, correspondingly.
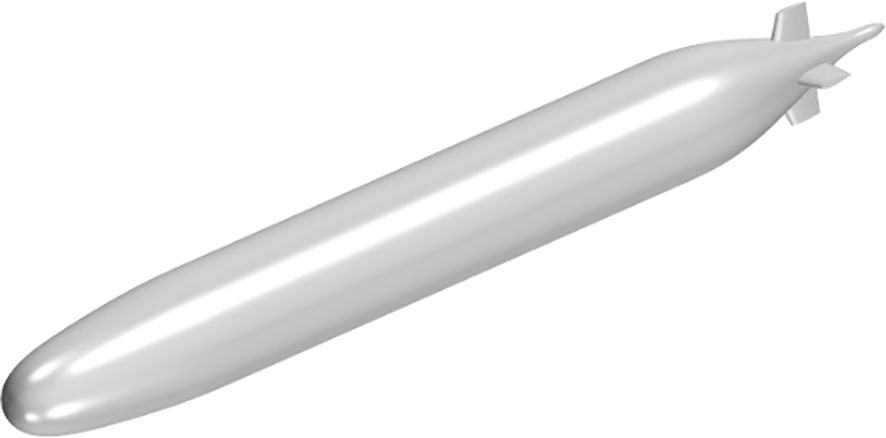
Figure 1 Calculation model of SUBOFF with tail rudders.
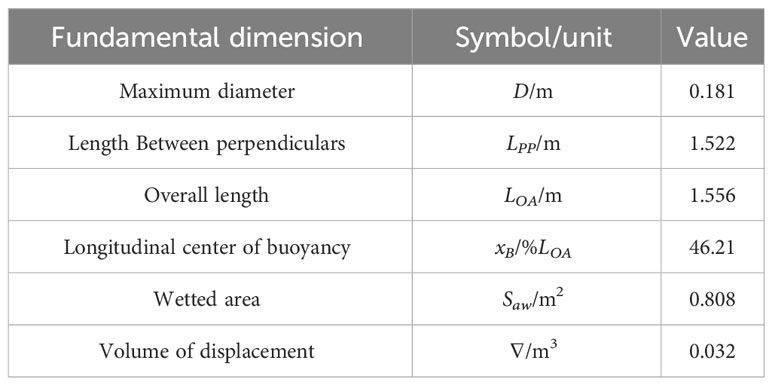
Table 1 Fundamental components of the SUBOFF.
The SST k-ω model is employed as the turbulence model in this study. The velocity range of SUBOFF is 0.205<Fr<0.512. Fr refers Froude number, defined as Equation 11:
Where, V is the velocity of SUBOFF, g is the gravity. The computation domain is a three-dimensional rectangular tank whose axis matches the symmetry axis of the SUBOFF model. The computation range size is 9LOA ×40D× 40D. The principle for selecting the size of the computation domain should be to capture a complete Kelvin wave system while ensuring that no wave reflection occurs at the boundaries. However, it should also be noted that the larger the computational domain size, the larger the computational grid, and the greater the computation difficulty.
The front, top, and bottom of the calculation domain are set as velocity inlets, and the velocity of SUBOFF is given. The rear of the calculation domain is set as the pressure outlet, and the standard atmospheric is taken as reference pressure. The left and right sides are set as symmetry planes. The surface of the hull is set as a non-slid wall surface. The calculation domain and boundary conditions are shown in Figure 2. The numerical calculation adopts a two-phase flow VOF model, with water as the liquid phase and the density of 997.561 kg/m3, and air as the gas phase and the density of 1.184 kg/m3. Two submergence depths are selected, 1.1D and 2.1D, as depicted in Figure 3.
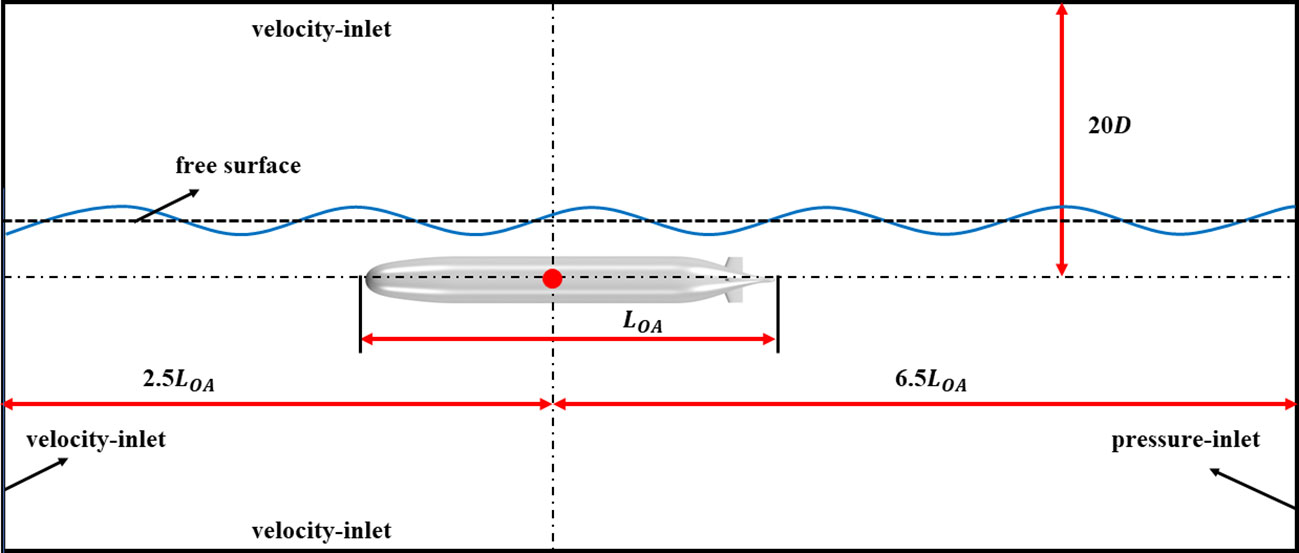
Figure 2 The boundary conditions and calculation domain.
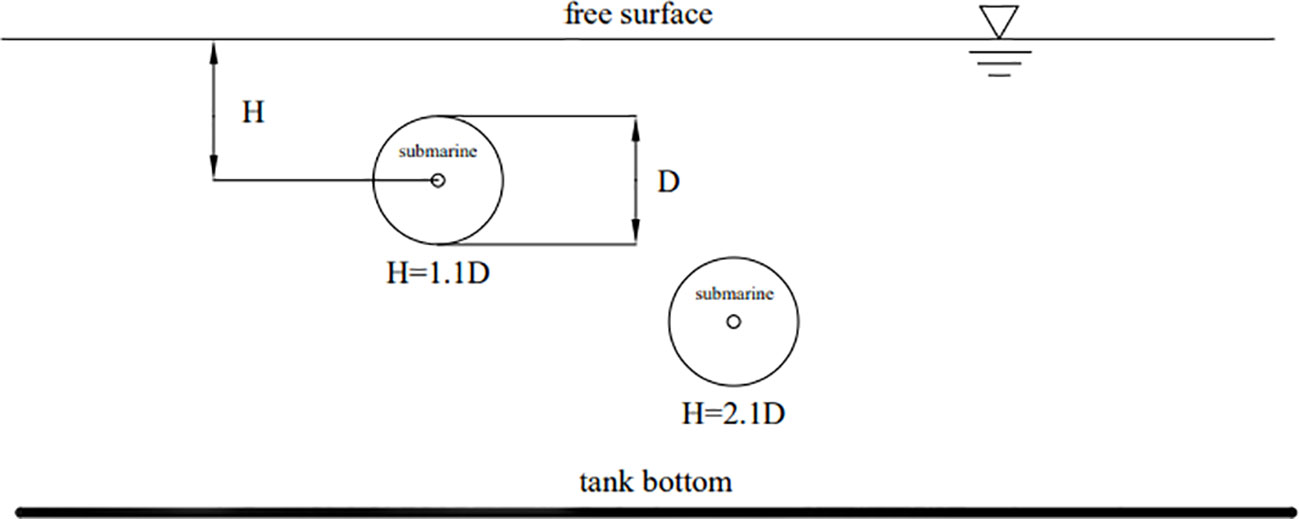
Figure 3 Graphic representation of submergence depth.
3.2 Grid generation
In this study, the grid division is mainly based on hexahedral structured grids, and a prism layer grid is set around the SUBOFF hull. The thickness of the prism layer element mesh grows with geometric development, and the constant expansion coefficient is equal to 1.2. An array of orthogonal prism grid units, the prism layer grid is used to represent the boundary layer just beneath the skin. Furthermore, local mesh refinement is used to capture the SUBOFF-generated surface waves and the pressure decrease in the wake zone. At least 15-unit grids are set vertically at the open surface to fully capture the wave system produced by SUBOFF. To better capture the flow details, the mesh around the hull and its wake must be refined repeatedly. The final results is given in Figures 4, 5 illustrates a local diagram of the hull surface grid. Figure 6 depicts the Y+ distribution over the surface of the body. The Y+ distribution over most surfaces of the hull is around 1, with only higher Y+ near the stern rudders with larger curvature. Such Y+ distribution meets the computational requirements of the SST k-ω model.
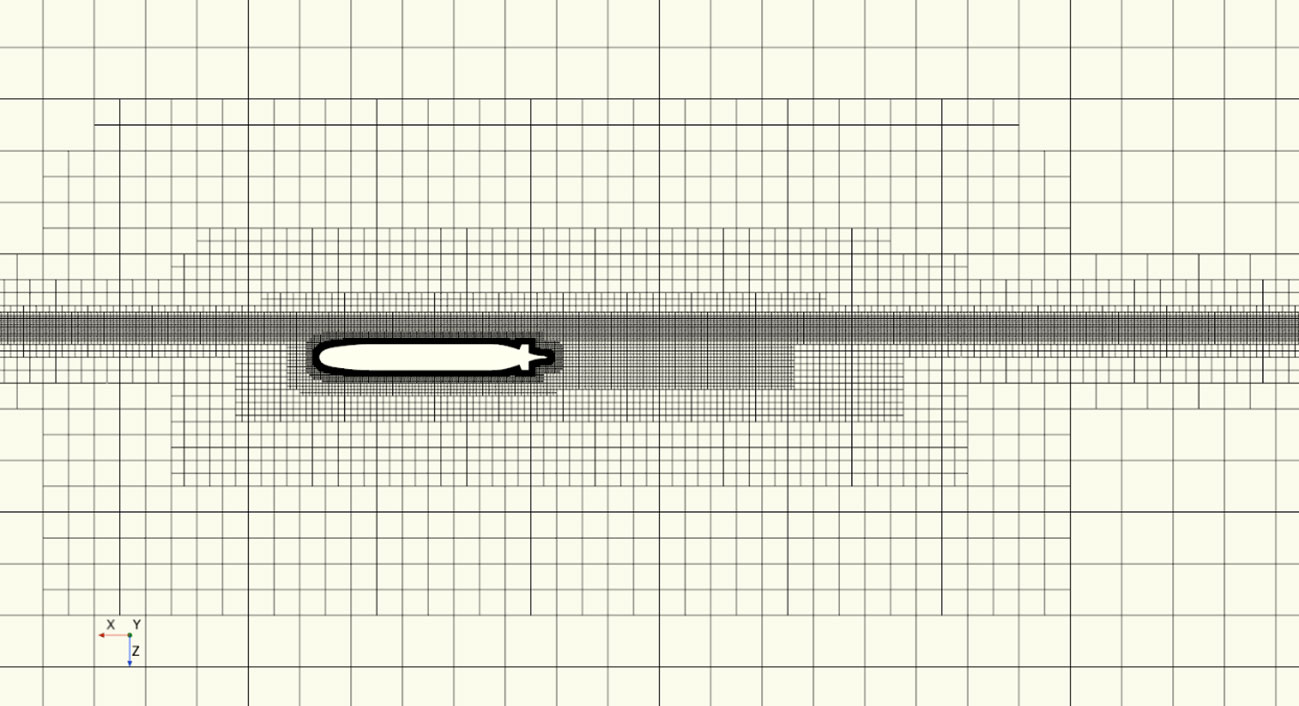
Figure 4 Grid in the XOZ plane.
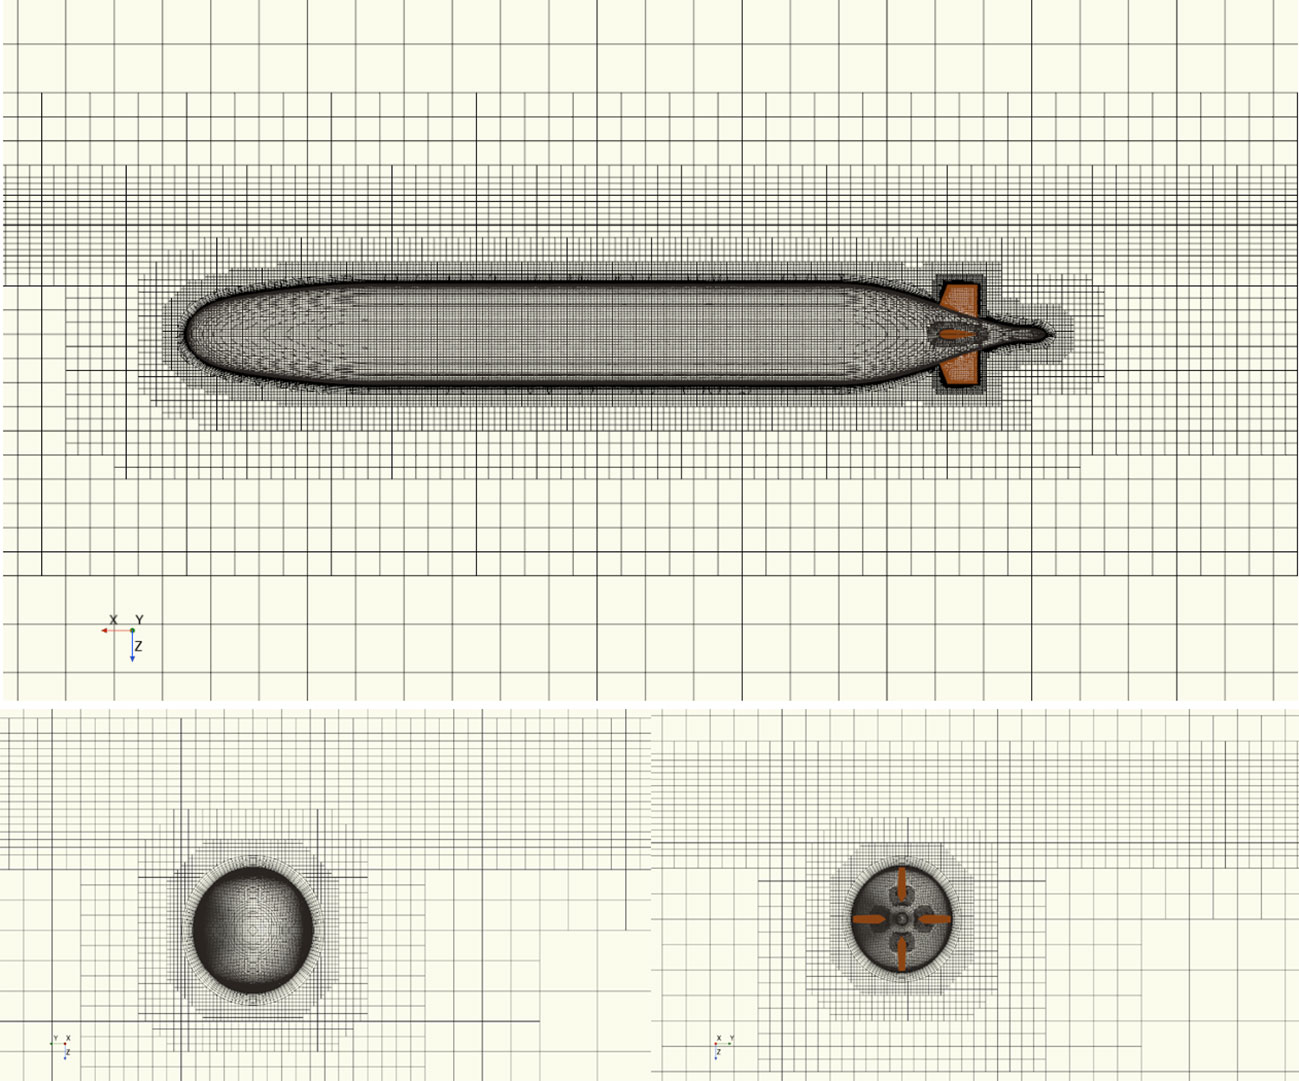
Figure 5 Local diagram of the hull surface grid.
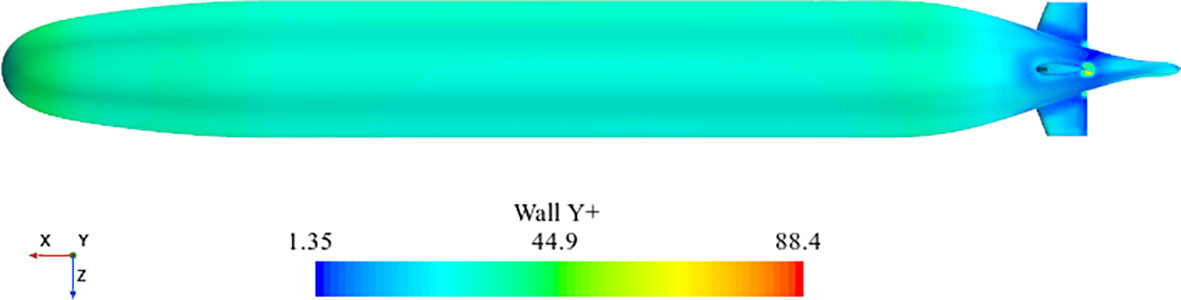
Figure 6 Y+ distribution over the surface of the body.
4 Verification and validation
4.1 Grid independence
Before carrying out numerical calculations, it is necessary to conduct research and discussion on grid independence. This section presents the grid independence verification on the bare hull at a velocity of 1.15m/s and a submergence depth of 1.1D to determine the optimal grid size suitable for calculation. The GCI (Grid Convergence Index) approach provides the foundation for the grid independence verification. Mathematical discretization methods generate discretization errors, which are caused by the selection of finite time and spatial resolutions. The GCI technique efficiently evaluated the effects of splitting inaccuracies on the outcomes of calculations. At least three different types of grids, ranging from coarse to fine, are chosen for analysis when using the GCI technique. The selection of grid refinement factor r in section is 1.2 is used. Since the hydrodynamic calculation of underwater vehicles near the free surface is a non-steady solution, the time step size also needs to be correspondingly reduced while refining the grid. The time discretization is first-order format, and the spatial discretization is second-order format. The specific grid size, the time step and number of grids are shown in Table 2.
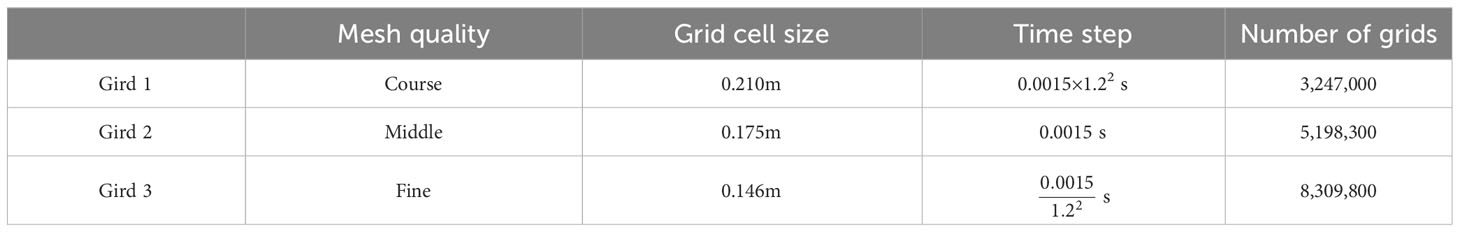
Table 2 Gird independence verification.
The convergence ratio RG is calculated as shown in Equation 12:
Where, εG32=S3-S2, represents the variation between grid and 2grid 3 calculation results. Similarly, εG21=S2-S1, represents the variation between grid 2and grid 3 calculation results. There are 4 scenarios for calculating RG, and the convergence can be determined based on the value of RG.
(1) -1< RG <0, oscillatory convergence;
(2) 0< RG <1, monotonic convergence;
(3) 1< RG, monotonic divergence;
(4) RG <-1, oscillating divergence.
For instance, the number of RG is within the range of case (3) and case (4), it indicates that it is impossible to quantify the uncertainty and that the grid needs to be modified. If (2) is met, the grid uncertainty UG is determined as shown in Equation 13.
Where, SL and SU are the minimum and maximum values of the subsequent calculated results, respectively.
Equation 14 through Equation 16 are used to compute the grid uncertainty in Case (1) when the grid merges consistently and the outcome is within the asymptotic range.
The convergence order of the grid PG is as shown in Equation 15.
Finally, the grid uncertainty UG is calculated as shown in Equation 16.
Where, Fs is safety factor, the recommended value is 1.25. The value of UG represents the variation between the outcomes of the simulated values and the precise value. Hence, a lower numerical number signifies a closer approximation of the precise value in the simulation, often falling below 5%. This demonstrates that the grid set adequately fulfils the computational criteria. Table 3 displays the outcomes of the grid independence study conducted in this section. Notably, the pitch moment of SUBOFF near the free surface converges in vibration, resulting in the non-value of PG. This conclusion is consistent with Amiri’s research (Amiri et al., 2018). Figure 7 depicts the free surface waves generated by SUBOFF for the three grids. Intuitively, the free surface wave generated by grid 1 (course) occurs a very noticeable dissipation, while the other two did not. In summary, to ensure computational accuracy and efficiency, the numerical calculations adopt grid 2 (middle) for subsequent calculations.
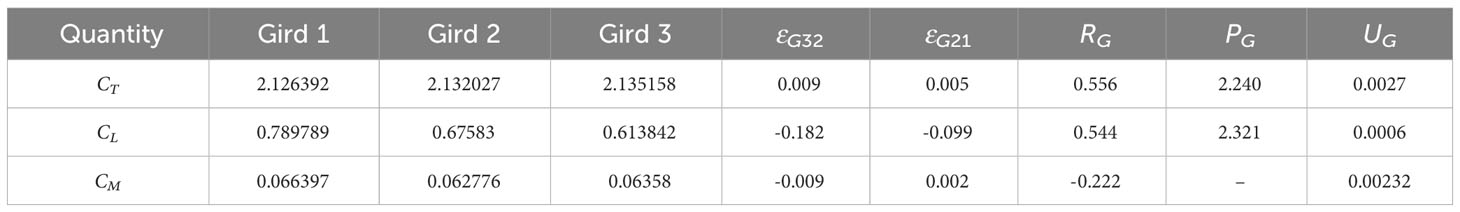
Table 3 Gird independence analysis.
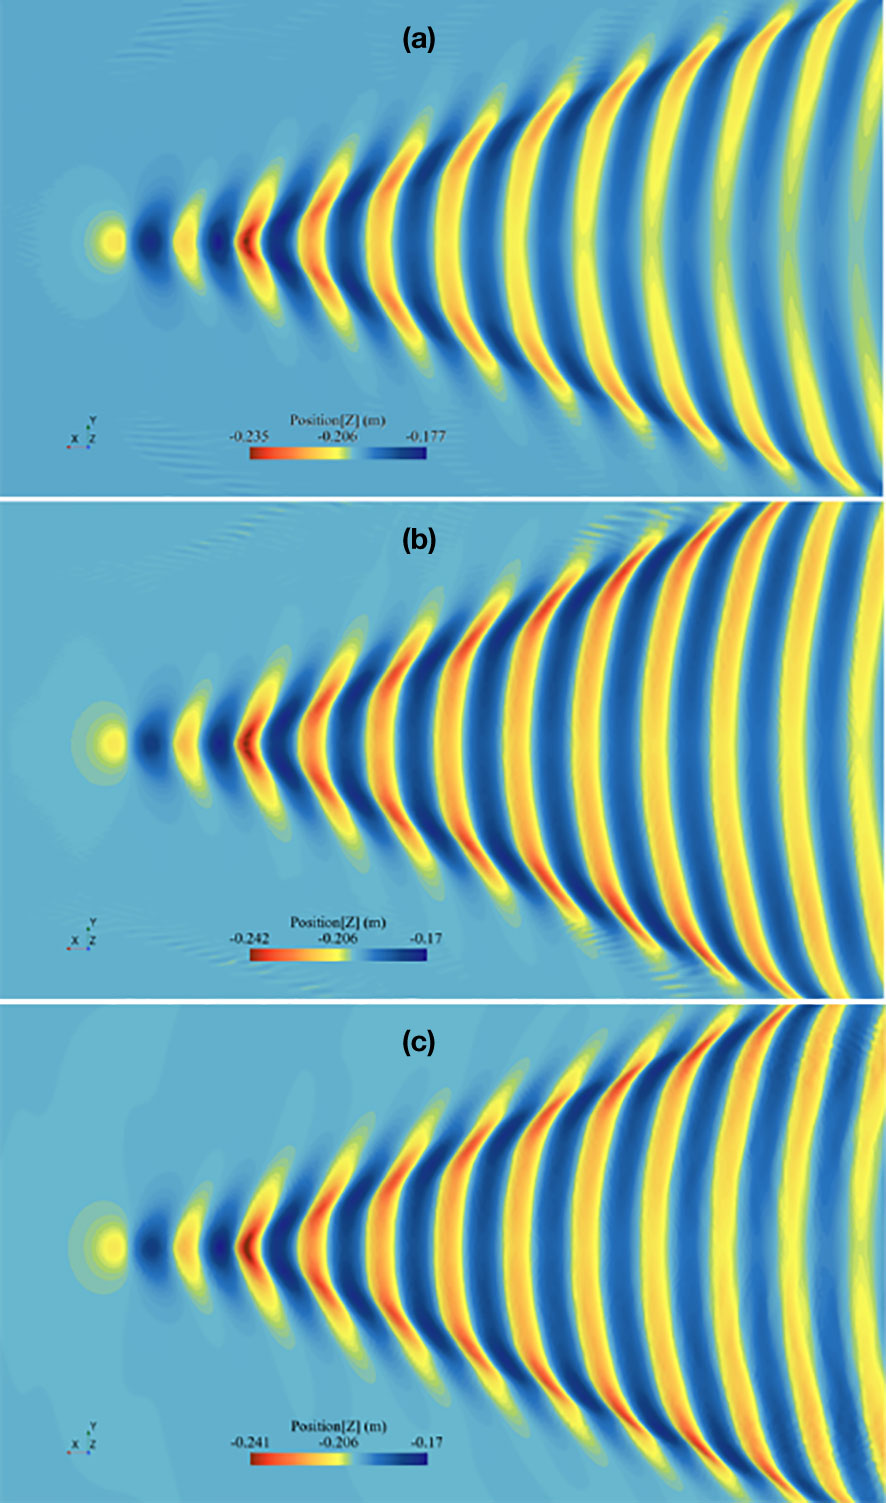
Figure 7 Y+ distribution over the surface of the body: (A)Grid 1; (B) Grid 2; (C) Grid 3.
In Table 3, CT represents the total resistance coefficient of the SUBOFF, CL represents the lift coefficient of the SUBOFF, and CM represents the pitch moment coefficient of the SUBOFF.
4.2 Validation
In the validation of the calculation model, the model was a 2.8:1 scale version of the un-appended DARPA SUBOFF geometry, with a diameter of 0.181m, length of 1.556m, and surface area of 0.382 m2 (Wilson-Haffenden, 2009). The model was attached to a Horizontal Planar Motion Mechanism (HPMM) located on the carriage via a sting mounting system. The depth was varied using an insertion piece between the sting and the carriage. A load cell, located at the forward end of the model, recorded the longitudinal force due to the model/fluid interaction. The velocity range is 0.215<Fr<0.512. The overall arrangement of the model test was depicted in Figure 8.
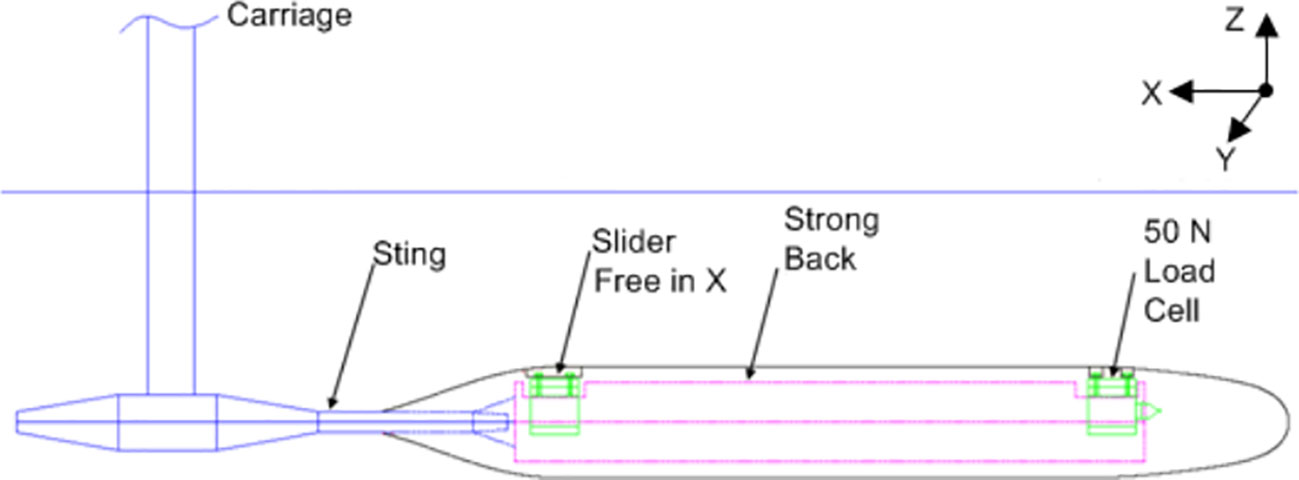
Figure 8 Balance and Sting Arrangement with Model Attached (Wilson-Haffenden, 2009).
The calculation results were compared with the investigational outcomes are given in Figure 9. It could be analyzed that the calculation findings were in appropriate agreement with the experimental outcomes (Wilson-Haffenden, 2009), with relative errors of less than 8%. The resistance of the hull showed a fluctuating trend, and the resistance coefficient first increased and then decreased with the increase of velocity. The reason was related to the interference between stern and the bow wave systems, which would be analyzed in the following section. In summary, this numerical model can meet the requirements for calculations of SUBOFF near the free surface.
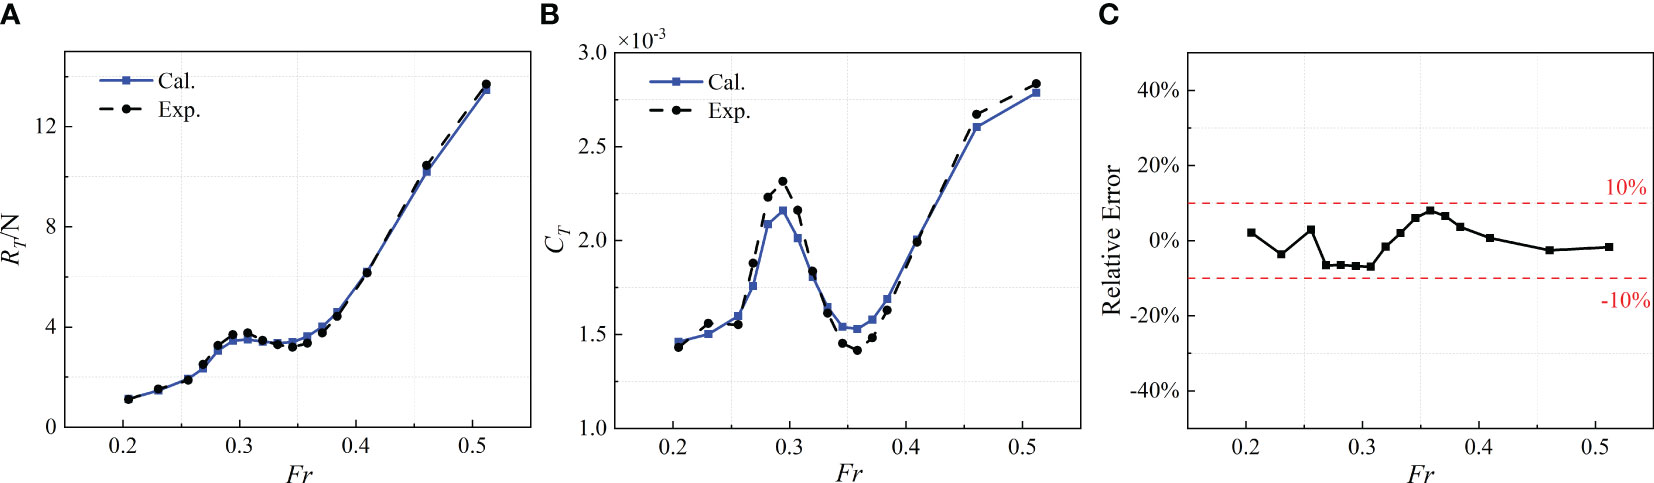
Figure 9 Comparison of SUBOFF bare hull near the free surface between calculation results and experimental results: (A) total resistance; (B) total resistance coefficient; (C) relative error.
5 Results and discussion
The present section elaborates the research outcomes of numerical simulation which are represented featuring hydrodynamic properties of SUBOFF sailing near the free surface, covering hull resistance, lift, pitch moment, dynamic pressure distribution and wakes in the free surface.
5.1 Hydrodynamic forces and moment
The pitch moment coefficient, lift coefficient and total resistance coefficient are calculated as shown in Equation 17.
The findings pertaining to the overall resistance coefficient for 1.556m long SUBOFF in the velocity range of 0.205<Fr<0.512 are depicted in the Figure 10A. Under the submergence depth of 1.1D, it is found that the total resistance of the SUBOFF hull (including the tail rudder) is slightly larger than that of the bare hull. The reason lies in the presence of the tail rudder. The water is obstructed when flowing through the tail, thereby increasing the total resistance. However, the overall trend of two total resistance coefficient curves remains consistent. When Fr<0.27 or Fr>0.375, the resistance of the bare hull increases with the increase of velocity, which is consistent with SUBOFF sailing in the deep water. When 0.270<Fr<0.375, the total resistance oscillates, increasing first and then decreasing. The reason for this phenomenon lies in the wave system generated by the hull at the free surface. Within this velocity range, stern and the bow wave systems interfere with each other, thereby affecting the hydrodynamic forces on the hull. Under the submergence depth of 2.1D, it can be seen that most of the total resistance coefficients are much smaller than that of 2.1D. This indicates that the submergence depth significantly affects the total resistance of SUBOFF navigation nearby the free surface.
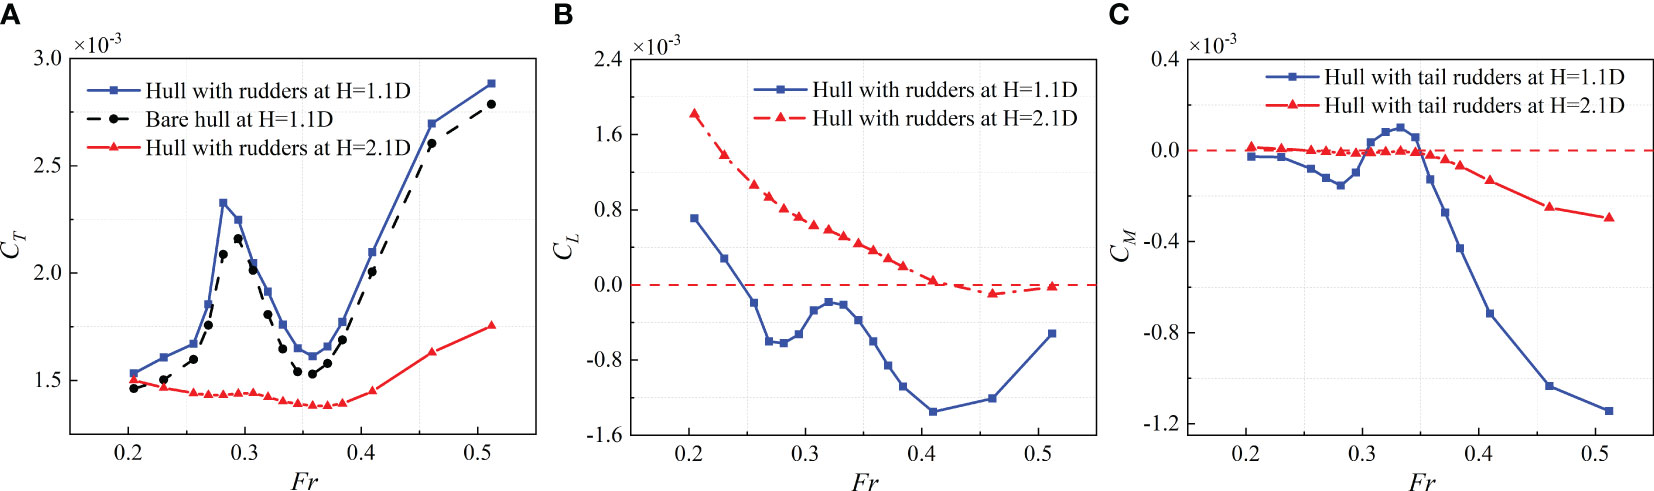
Figure 10 Hydrodynamic forces and moment: (A) total resistance coefficient; (B) lift coefficient; (C) pitch moment coefficient.
The results of the lift coefficient of the 1.556m long SUBOFF in the velocity range of 0.205<Fr<0.512 are depicted in the Figure 10B. Where, a negative value represents that the hull is subjected to lift near the free surface, while a positive value represents that the hull is subjected to lift away from the free surface. Under the submergence depth of 1.1D, when 0.270<Fr<0.375, the lift on the hull exhibits oscillation. However, the velocities corresponding to the local maximum and minimum values are different. When Fr>0.40, the absolute value of lift decreases with increasing velocity. This indicates that the hull is subjected to a decrease in lift near the free surface, but will still gradually approach the free surface. Under the submergence depth of 2.1D, the lift on the hull gradually decreases with the increase of Fr, which means that the hull is always subjected to lift away from the free surface.
The results of the pitch moment coefficient of the 1.556m long SUBOFF in the velocity range of 0.205<Fr<0.512 are depicted in the Figure 10C. According to the right-hand spiral rule, when viewed in the positive direction along the y-axis of the hull, a positive value represents that the hull is subjected to a clockwise moment, while a negative value represents that the hull is subjected to a counterclockwise moment. Under the submergence depth of 1.1D, when 0.26<Fr<0.36, the pitching moments are oscillating. When Fr>0.36, the pitching moment (absolute value) on the hull increases with increasing velocity, indicating that the bow of the hull gradually moves away from the free surface and the stern gradually approaches the free surface.
5.2 Dynamic pressure distribution of the hull
On the external side oriented towards the direction of motion, the velocity at the surface of SUBOFF is presently zero, resulting in the formation of a stagnation point. The conversion of kinetic energy into pressure energy results in a rise in pressure. The pressure is commonly referred to as the total pressure, denoted as P, and is defined as the disparity between the total pressure and the undisturbed pressure. (also known as static pressure Ps) is called the dynamic pressure Pm. The calculation equation for dynamic pressure is as shown in Equation 18.
The dynamic pressure coefficient is calculated as shown in Equation 19.
Figure 11 depicts the dynamic pressure coefficients of contour line alone the SUBOFF hull under the velocity of Fr=0.460 and submergence depth of 1.1D. The top pressure of the middle contour line of the hull is positive, while the bottom pressure is negative. The sum of the two vectors is a part of the lift of the SUBOFF hull. The average value of both is shown by the yellow line in Figure 12A. It is shown that pressure dispersal is almost consistent with the contour line along the horizontal plane of the hull. Therefore, the pressure dispersal at this location can be used to approximate the lift force on the hull.
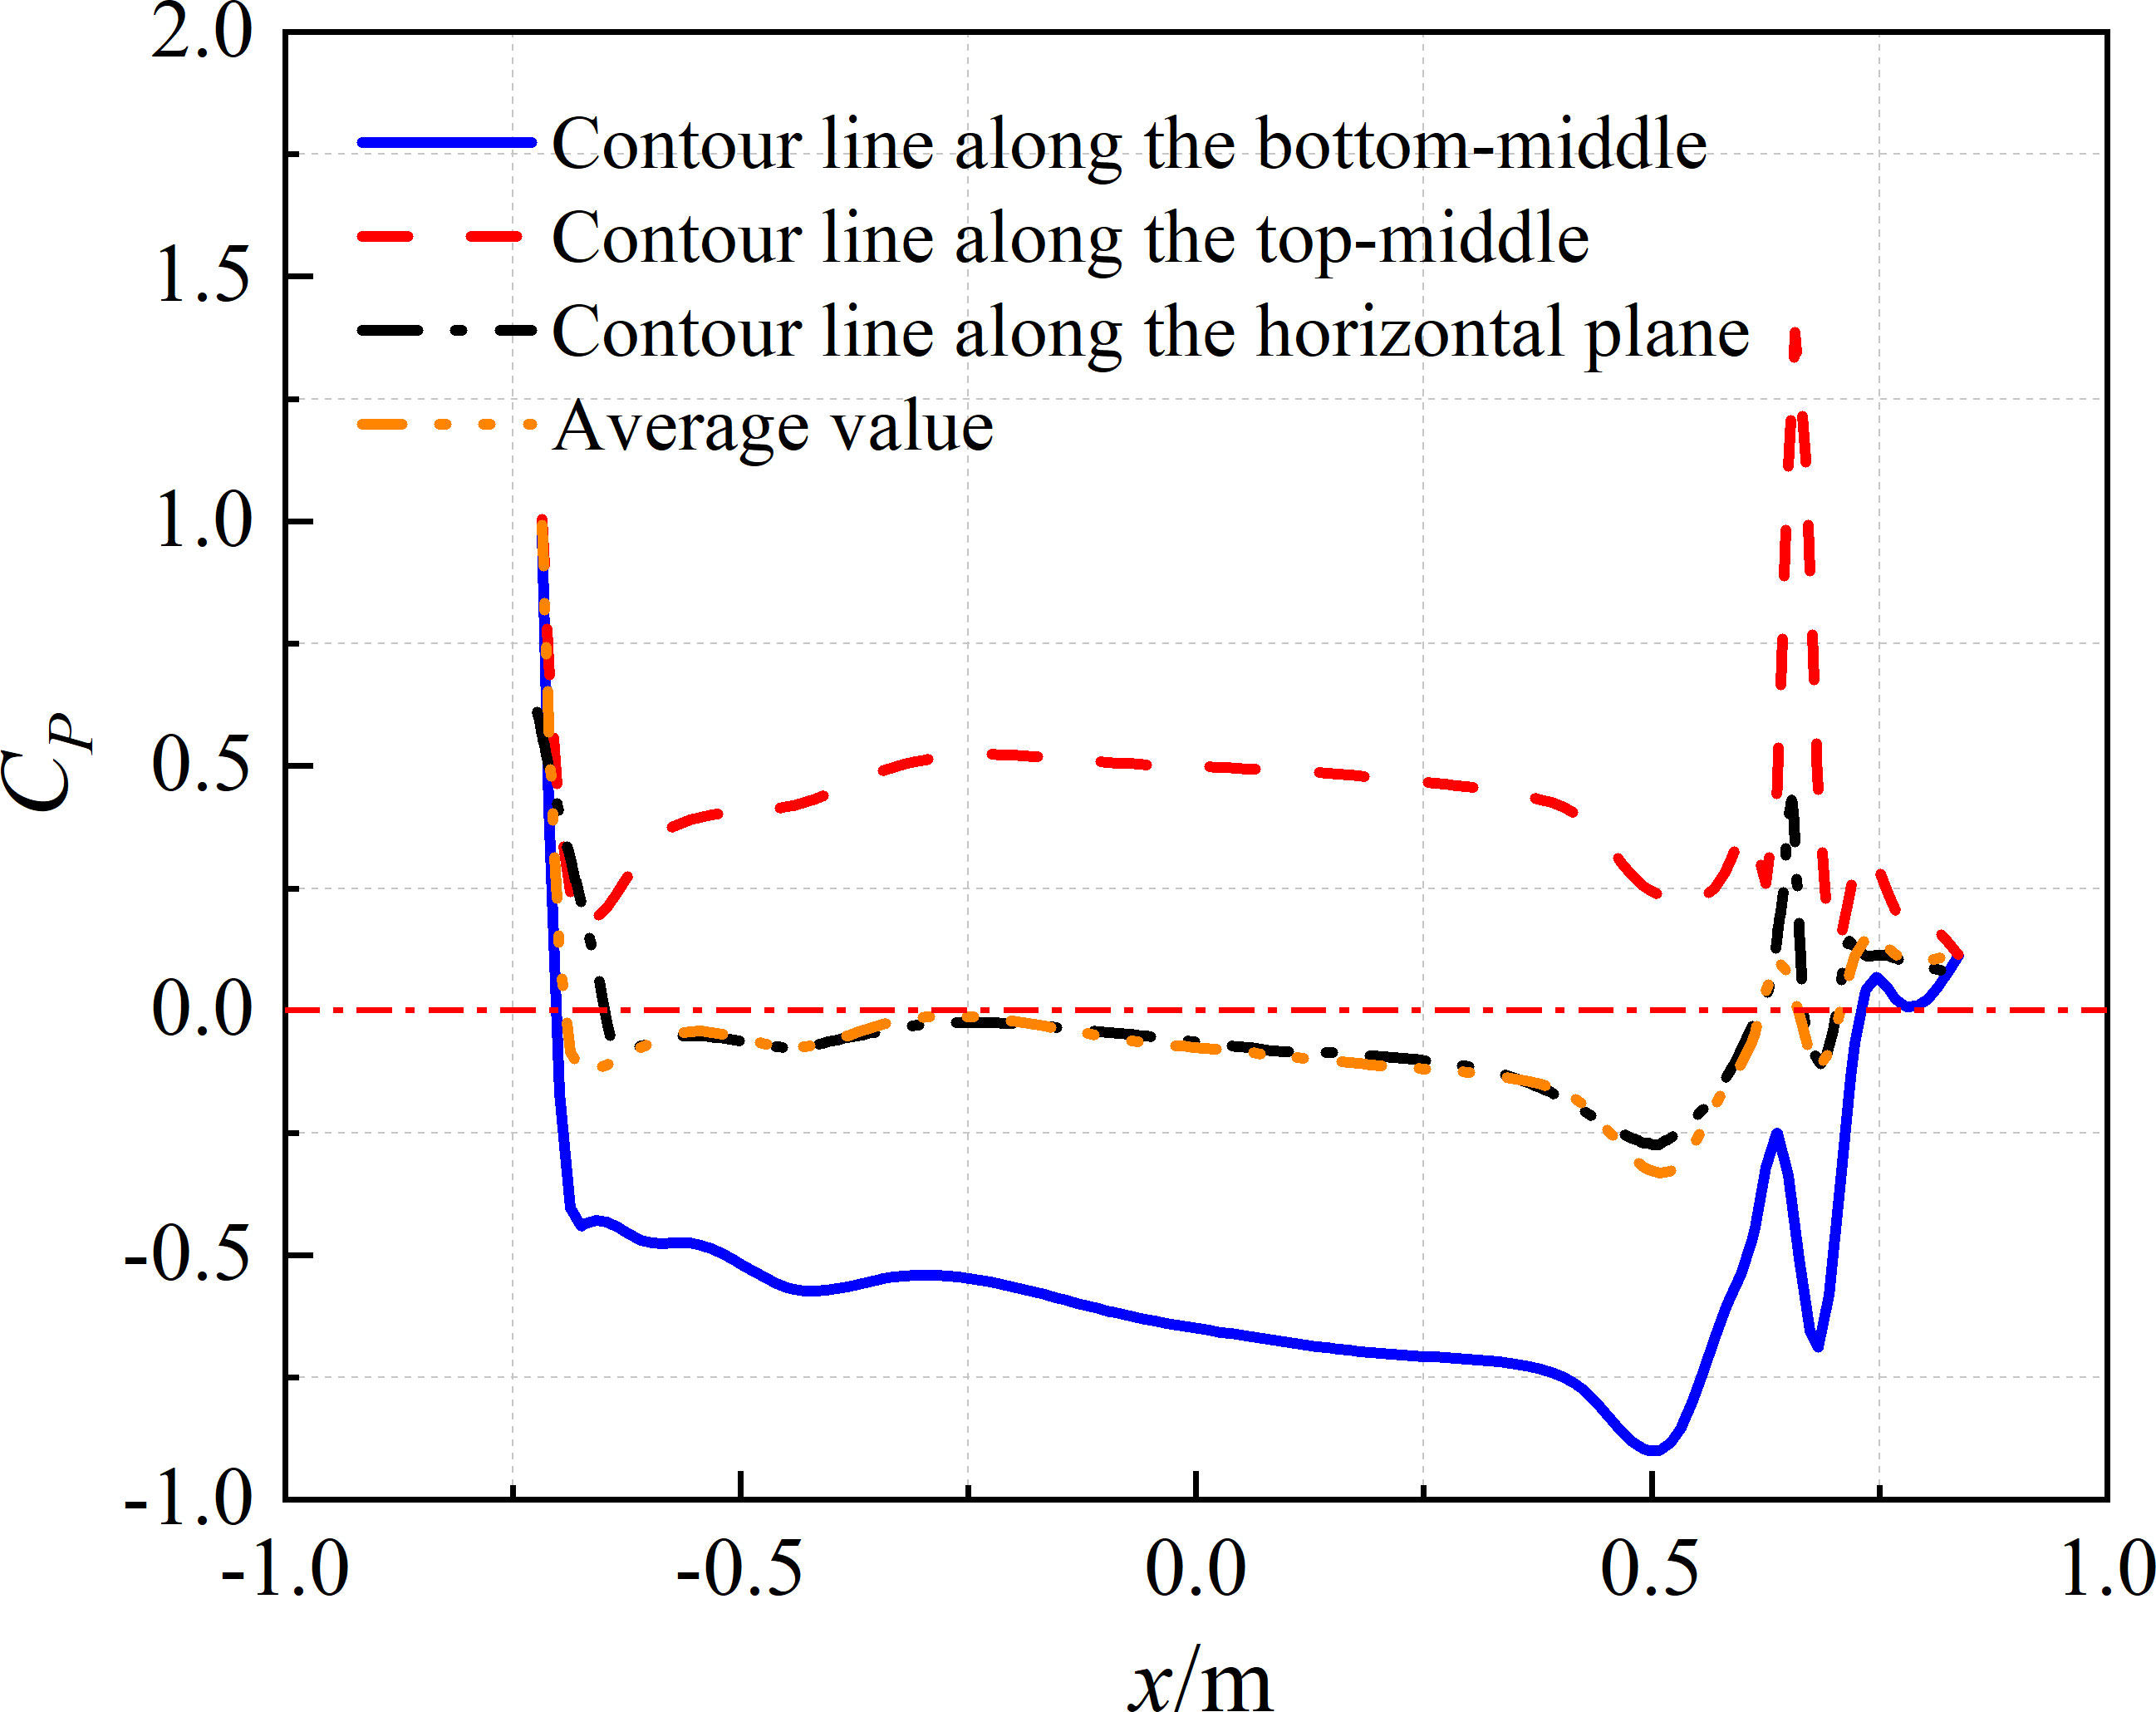
Figure 11 Dynamic pressure coefficients of contour line under the velocity of Fr=0.460 and submergence depth of 1.1D.
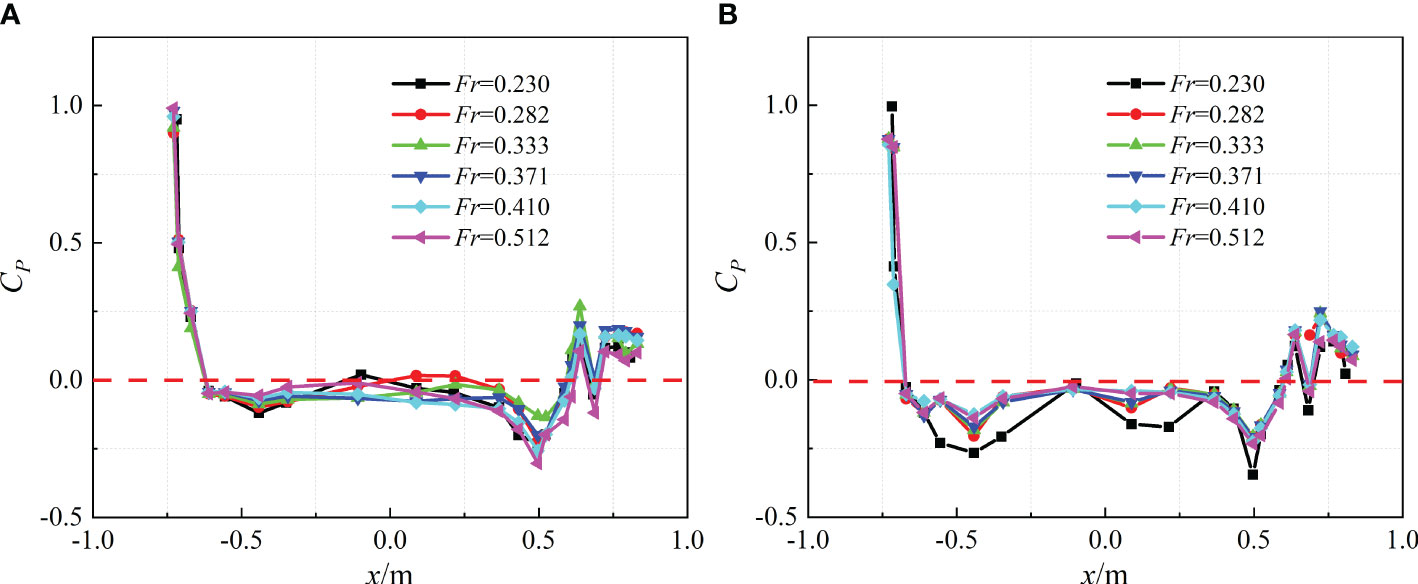
Figure 12 Dynamic pressure coefficients of contour line along the horizontal plane: (A) 1.1D submergence depth; (B) 2.1D submergence depth.
Figure 12 depicts the dynamic pressure coefficients of contour line along the horizontal plane of the SUBOFF hull under typical velocities and two submergence depths. It can be seen from Figure 12 that due to the formation of a stagnation point at the bow of the SUBOFF, it is subjected to the maximum pressure, so the dynamic pressure coefficient is close to 1. The dynamic pressure coefficient at the front shoulder, rear shoulder, and stern rudder of the hull shows a sudden increase and decrease. When Fr=0.282, the pressure coefficient in the first half of the hull increases significantly due to the influence of waves generated by SUBOFF. In addition, the dynamic pressure coefficient at the latter half reaches a positive value. The lift on the front half of the hull decreases. The second half is subjected to pressure opposite to the direction of lift, resulting in a negative pitch moment on the hull. In addition, due to the decrease in pressure coefficient at the rear shoulder of the hull, the lift at this point increases, and the overall lift reaches its maximum value, resulting in a local extreme value of lift around this velocity.
When Fr=0.333, the increase in wave length causes the local maximum value of the hull dynamic pressure coefficient to shift back. And due to the small amplitude of the wave at the rear shoulder, the lift at the rear shoulder is reduced, and the pitch moment of the hull is positive. When 0.333<Fr<0.410, the pressure coefficient in the middle of the hull is always negative, which means that it is subjected to lift. As Fr increases, the lift and pitch moment gradually increase. When Fr=0.512, due to the wavelength completely exceeding the length of a hull, the wave amplitude generated in the front and rear shoulders is larger, resulting in a decrease in lift. Dynamic pressure distributions on the port shown in Figures 13, 14 support the above conclusion that lift is caused by the pressure difference between the upper and lower surfaces.
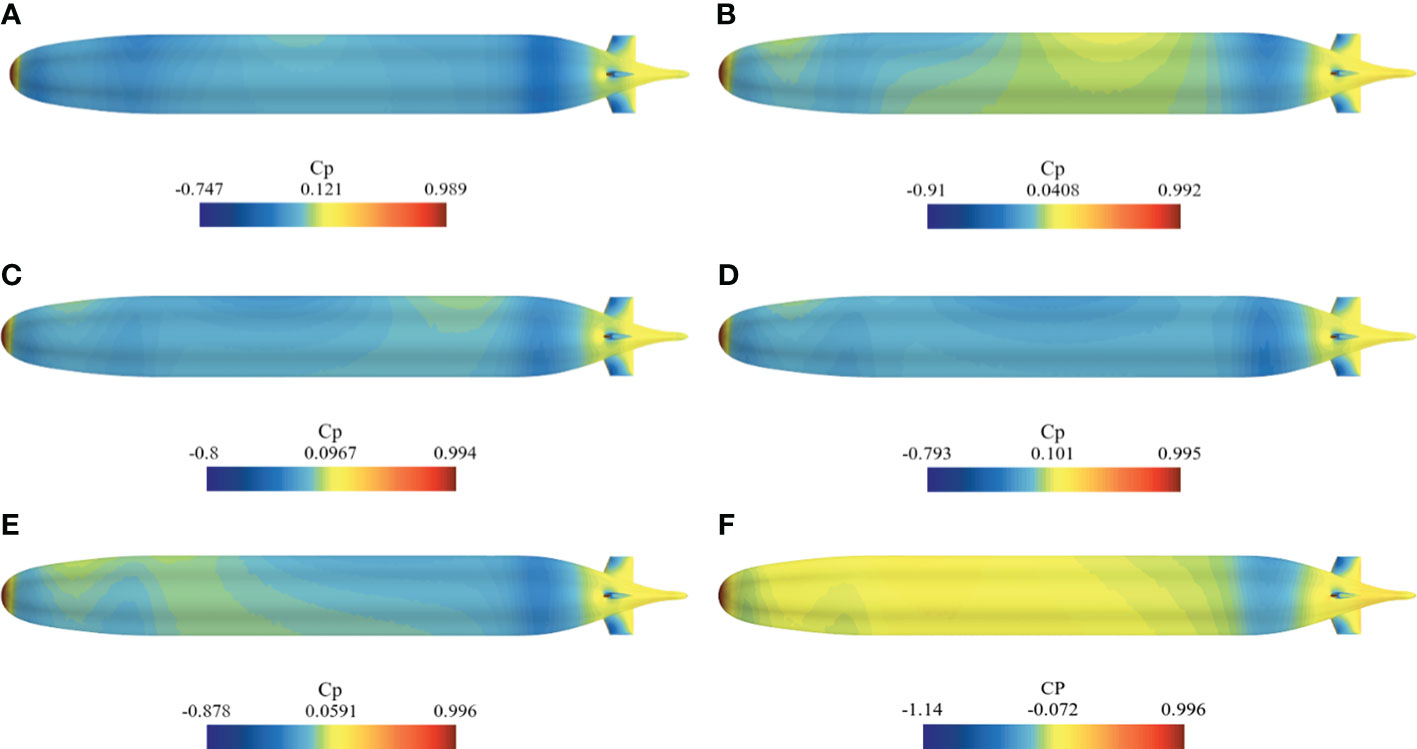
Figure 13 Dynamic pressure distribution on the port under submergence depth of 1.1D: (A) Fr=0.230; (B) Fr=0.282; (C) Fr=0.333; (D) Fr=0.371; (E) Fr=0.410; (F) Fr=0.512.
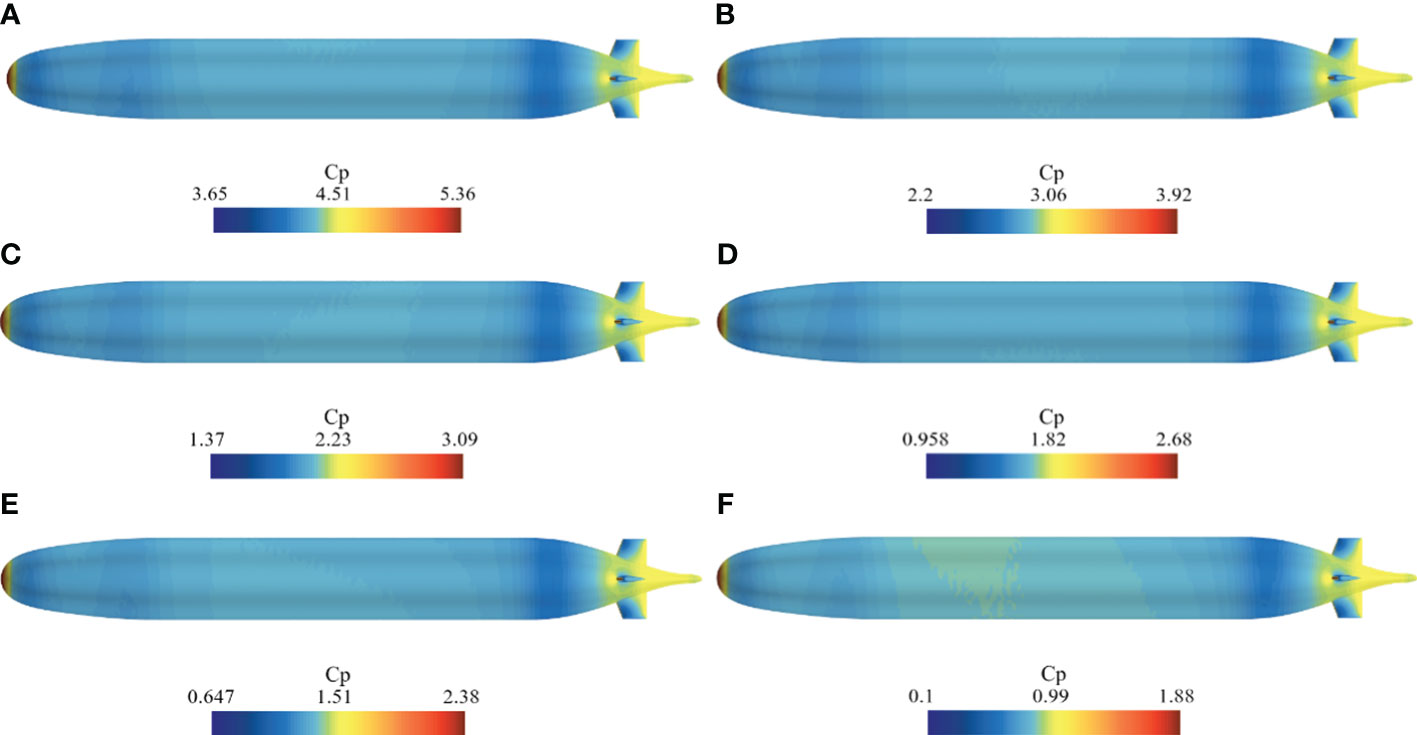
Figure 14 Dynamic pressure distribution on the port under submergence depth of 1.1D: (A) Fr=0.230; (B) Fr=0.282; (C) Fr=0.333; (D) Fr=0.371; (E) Fr=0.410; (F) Fr=0.512.
5.3 Free surface
The hull of the SUBOFF is experiencing shallow immersion conditions. In this study, the Volume of Fluid (VOF) method was employed to compute the two-phase flow, incorporating pertinent parameters for the free surface. To mitigate the presence of the vertical velocity component near the computational domain’s exit, a linear damping function was introduced as a source term in the equation governing the vertical velocity, resulting in a flattening of the wave height at said exit position. In order to investigate the impact of the damping function on the wave height of the free surface, specific calculation conditions were chosen, including a SUBOFF hull length of 4.356m, a velocity of Fr=0.462, and a submergence depth of 1.1D. The width of the damping region corresponds to the wavelength of a theoretical wave under these operating conditions. Figure 15 presents the longitudinal profile waveform of the free surface, clearly illustrating that the absence of wave damping at the computational domain boundary results in a persistent increase in wave height due to wave reflection. The inclusion of wave damping in the computation resulted in a notable reduction in wave height at the exit location, leading to a flattening of the wave profile. Furthermore, a comparison between the wave heights at various longitudinal positions of the free surface and the numerical findings of Amiri et al. (2018) revealed a satisfactory level of agreement. No significant discrepancies were observed in terms of wavelength and wave height, thus justifying the incorporation of wave damping at the designated boundary in this study.
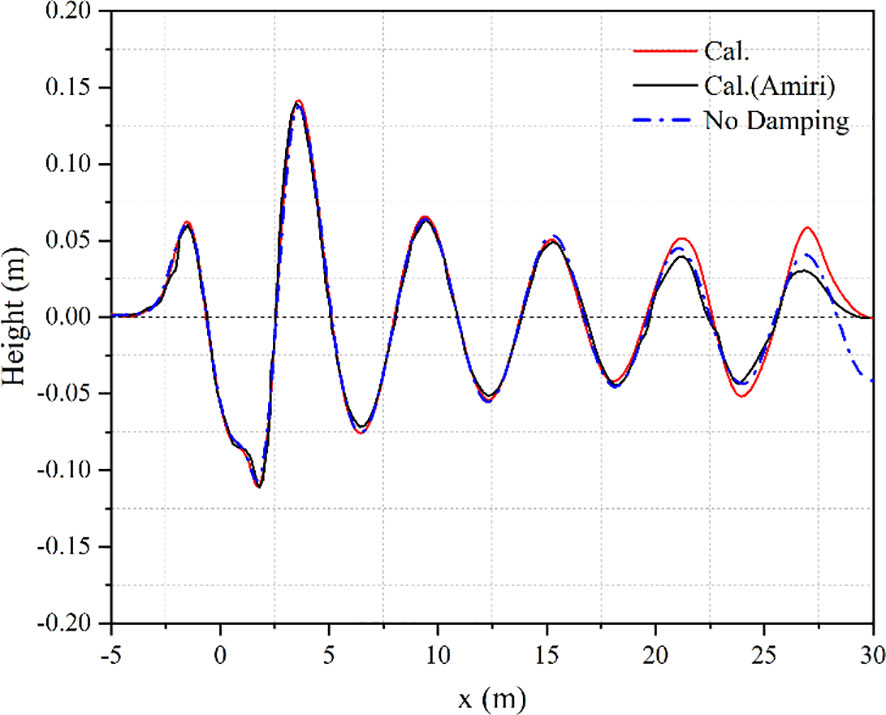
Figure 15 Comparison of waveform of the middle longitudinal section under the condition of SUBOFF L=4.356m, velocity Fr=0.462 and submergence depth=1.1D.
Figure 16 depicts the waveform of SUBOFF on the free surface under typical velocities and two submergence depths. The wave that rises at the forefront of the UUV is the peak, and at the stern of the UUV is the trough. When an UUV is sailing directly near the surface, a Kelvin wake forms on the free surface. The Kelvin wake consists of transverse waves and divergent waves, with transverse waves propagating backward and divergent waves propagating on both sides. The first and last stationary points each form a transverse wave system and a scattered wave system, which meet and overlap at the corresponding free surface behind the UUV. Unlike surface vessels, wave amplitude of the Kelvin wake formed by UUVs sailing directly near the surface is smaller, and the divergent wave system decays faster. Divergent waves can only be seen near the hull, while the transverse wave system propagates further, especially in low Fr conditions. In addition, the wave height and wavelength both increase with increasing speed.
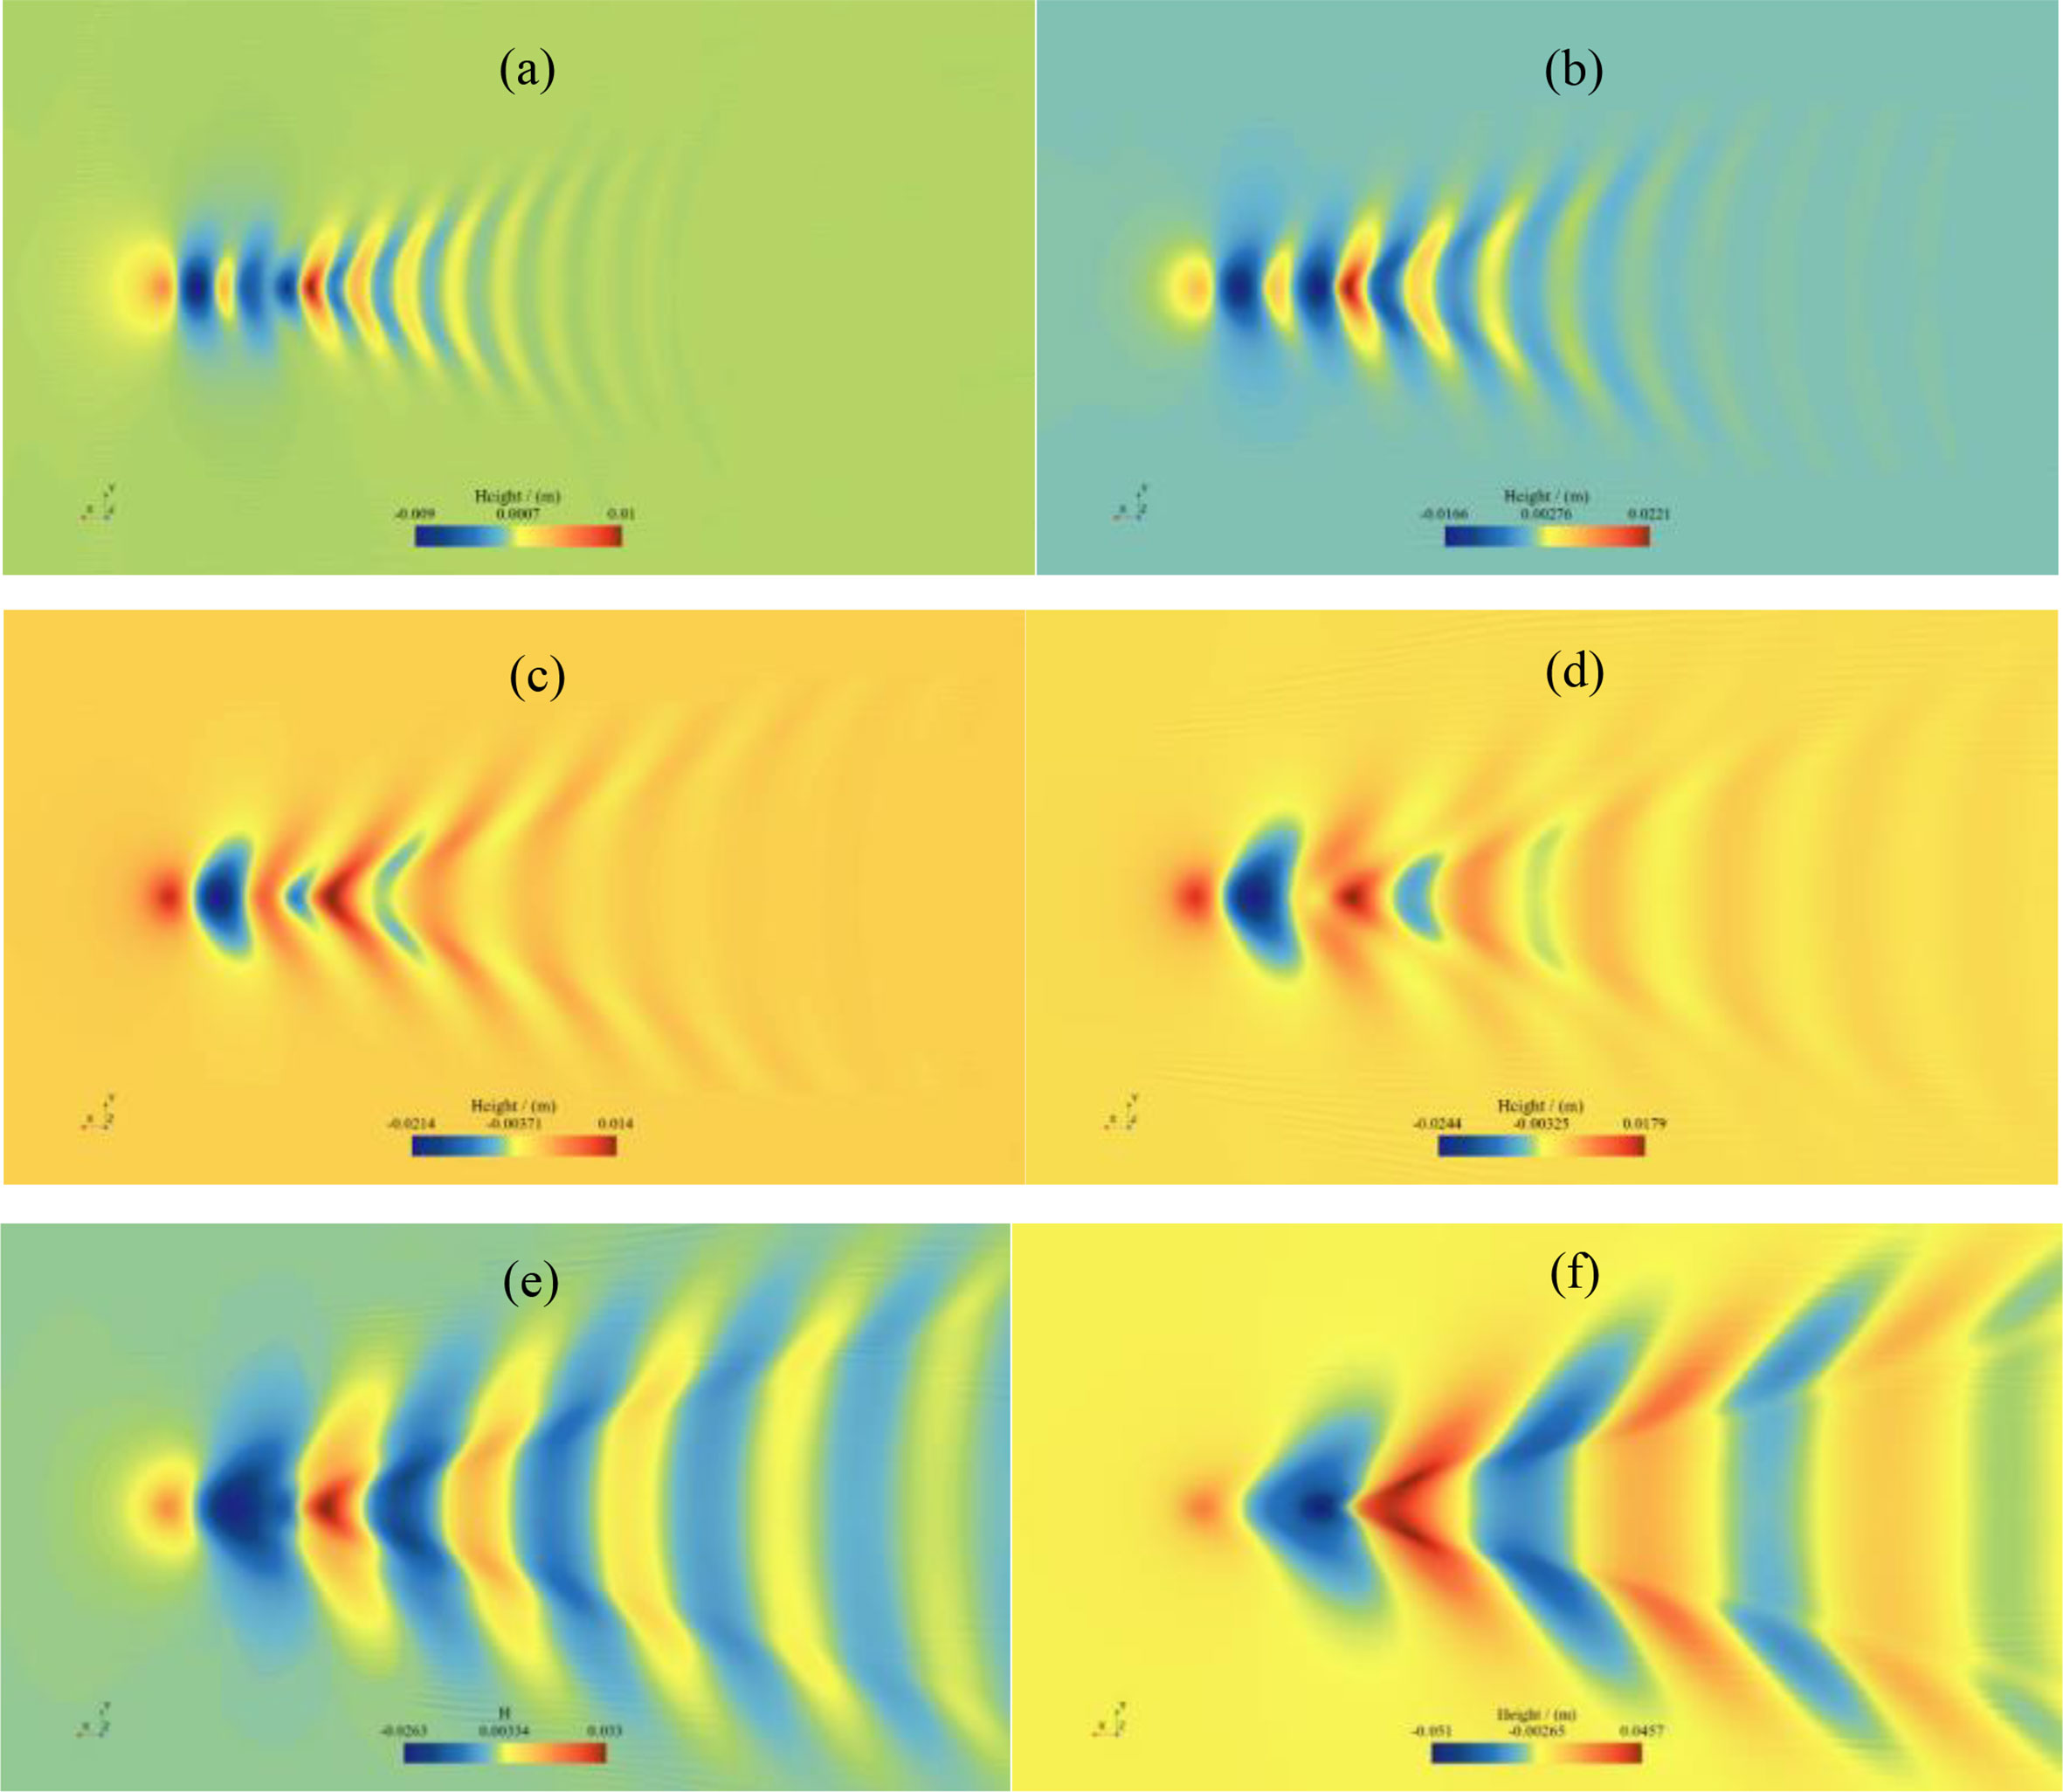
Figure 16 Waveform in the free surface under submergence depth of 1.1D: (A) Fr=0.230; (B) Fr=0.282; (C) Fr=0.333; (D) Fr=0.371; (E) Fr=0.410; (F) Fr=0.512.
Under the condition of submergence depth=1.1D, when Fr=0.512, the sharp waves in the UUV SUBOFF wave-making are most obvious, the transverse waves are approximately perpendicular to the direction of the hull navigation. The UUV generates lower waves on the surface as its depth declines, as seen in Figure 17. The intersection of transverse and scattered waves is more pronounced, but the waveform remains almost unchanged. When the UUV is sailing directly in deep submergence, as Fr increases, the proportion of pressure difference resistance (mainly viscous pressure resistance) gradually decreases. When sailing directly near the free surface, the presence of the Kelvin wake generates wave making resistance, which significantly increases the proportion of pressure difference resistance with the increase of Fr. As Fr increases, the divergent wave system gradually becomes apparent, and the peaks and valleys formed by the superposition of the divergent wave system and the transverse wave system are clearer. The wave making energy is greater, and the UUV needs more power to overcome the wave making resistance.
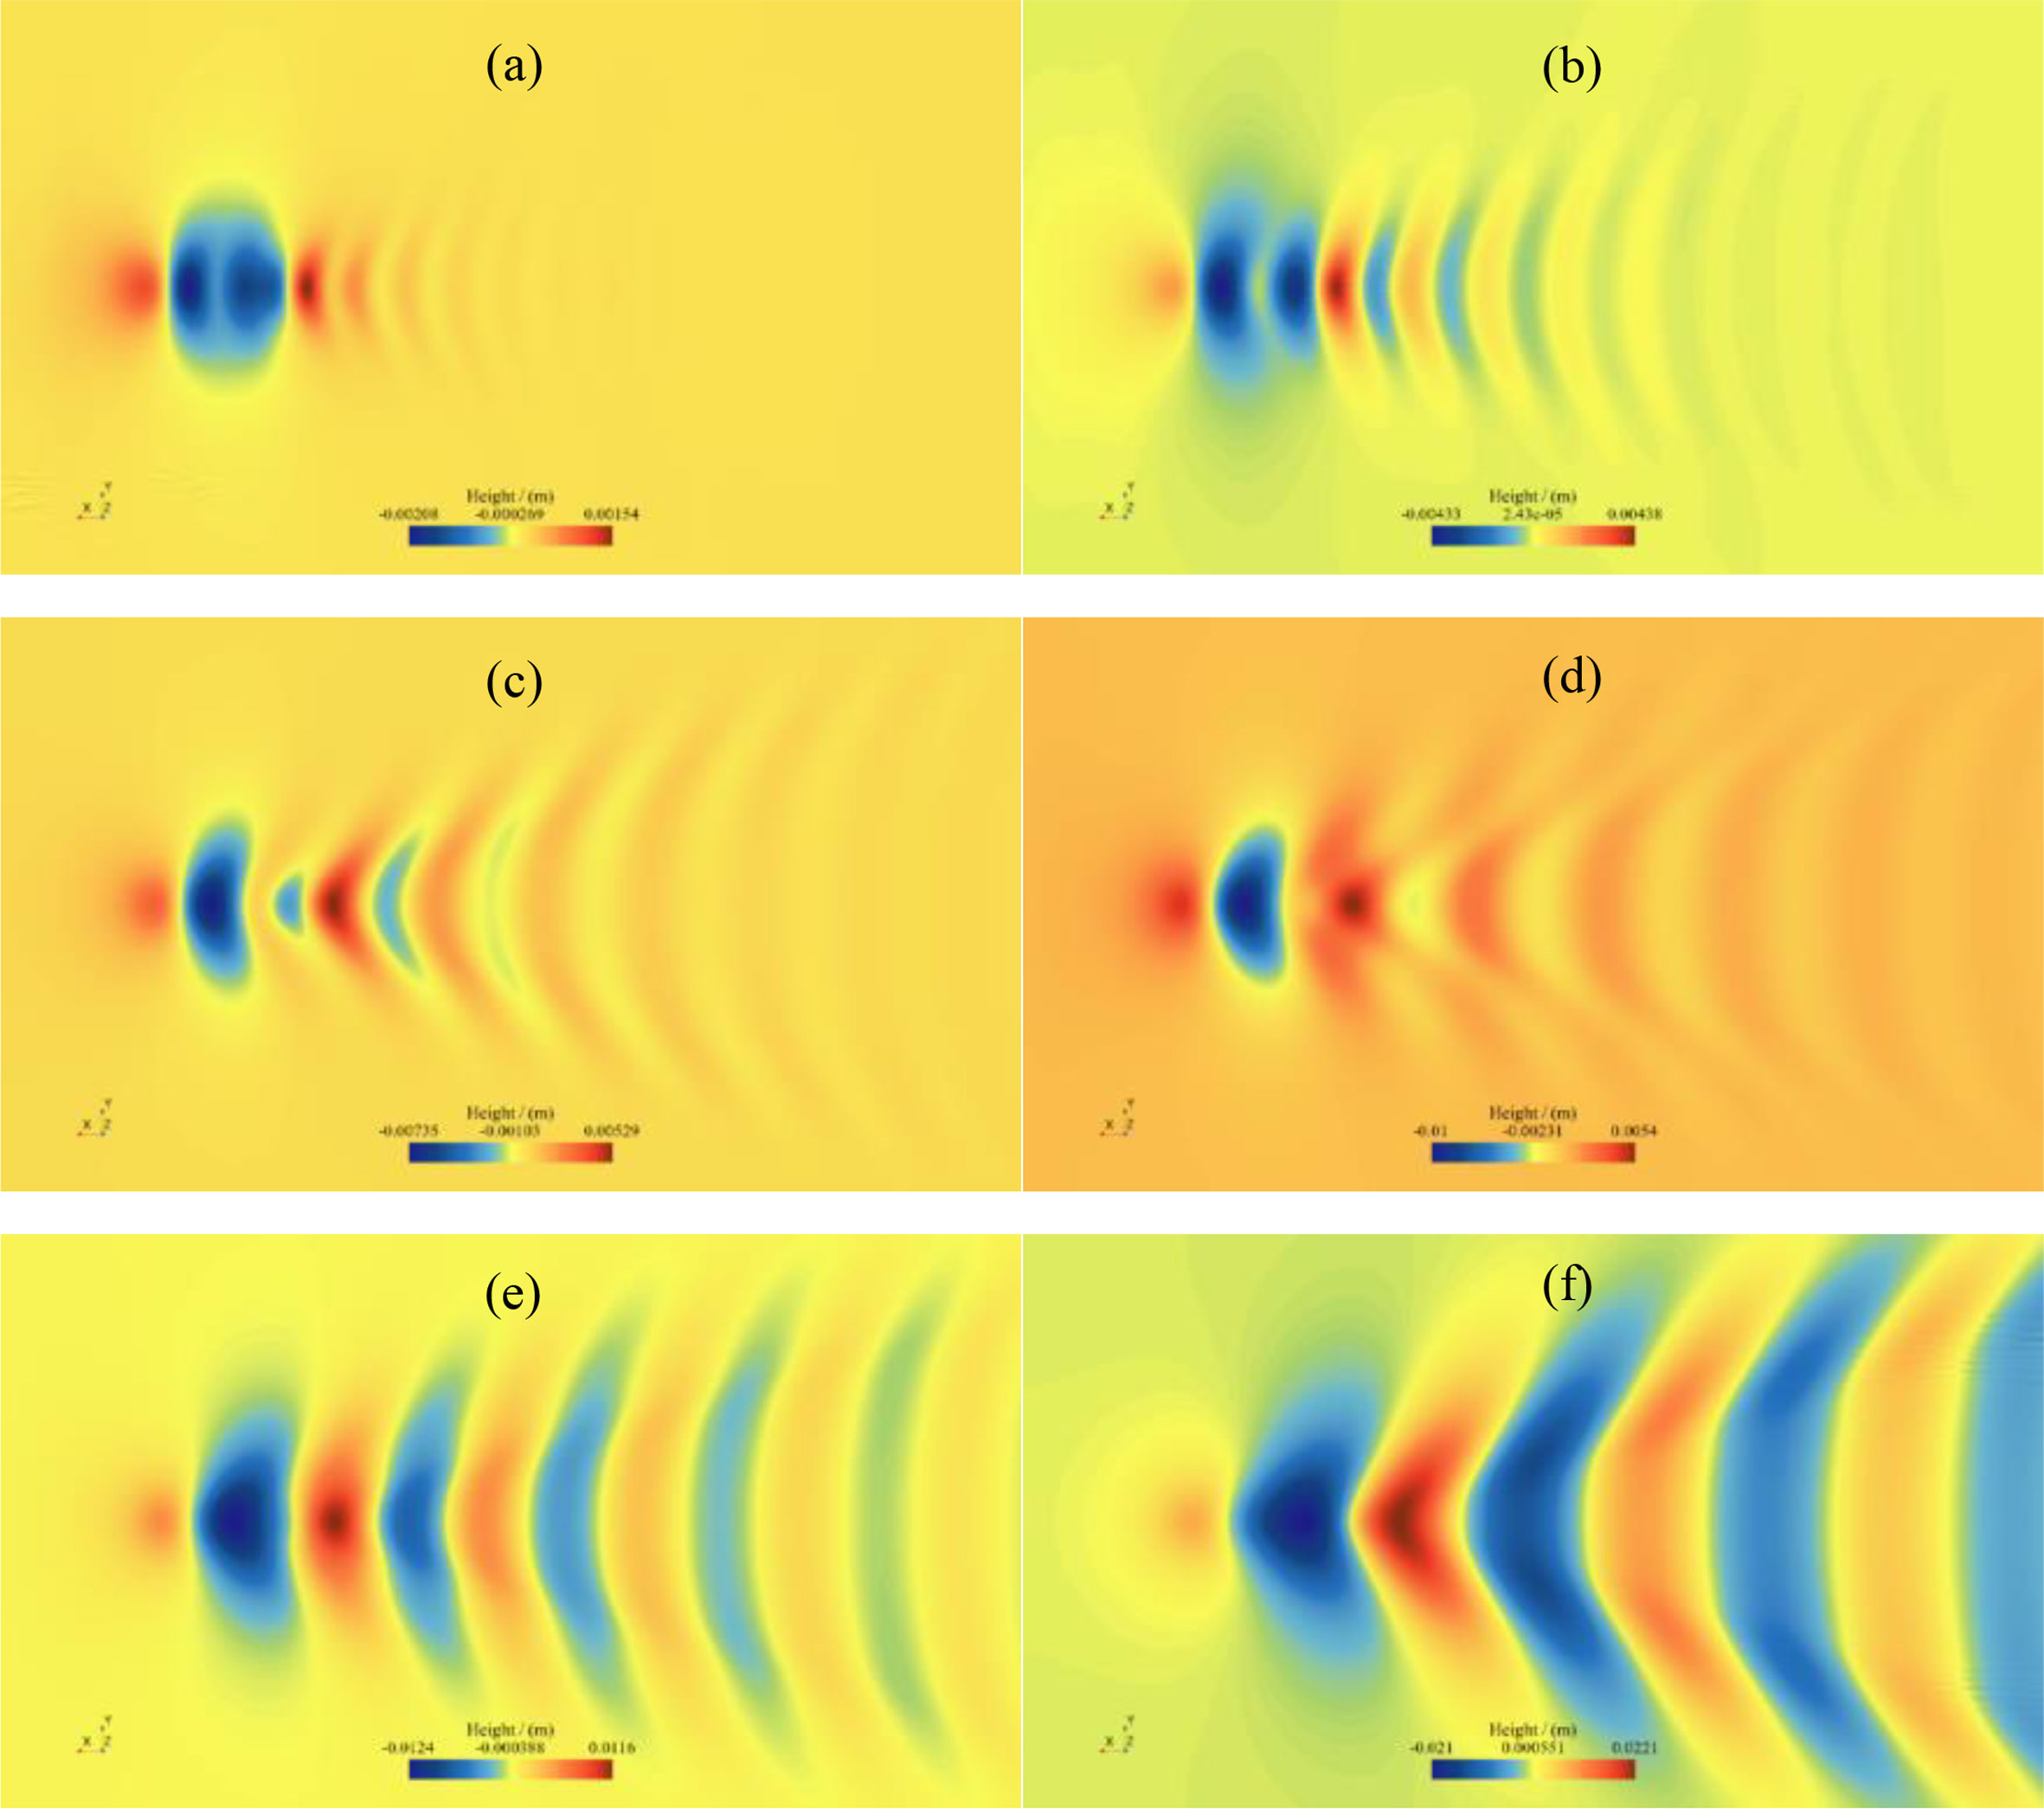
Figure 17 Waveform in the free surface under submergence depth of 2.1D: (A) Fr=0.230; (B) Fr=0.282; (C) Fr=0.333; (D) Fr=0.371; (E) Fr=0.410; (F) Fr=0.512.
Figures 18, 19 depicts the wave height of the free surface directly above the hull under submergence depth of 1.1D and 2.1D, respectively. The distance between the two red dotted lines in Figures 18, 19 represents the longitudinal length of the SUBOFF hull. The dotted line on the left side represents the bow of the hull. There is a wave peak at the bow of the hull, and then as the velocity increases, the wavelength generated by the hull gradually increases. The calculated wavelength is very close to the theoretical value. Within the range of 0.230<Fr<0.358, the second peak of the waveform at the free surface is roughly located in the rear section of the hull, forming a trough at the front end of the longitudinal position of the stern rudder. When Fr>0.358, the wavelength increases due to the increase in hull speed. However, due to the influence of the position of the rear shoulder of the hull and the tail rudder, the second peak and trough generated by the hull are not obvious. When 0.294<Fr<0.371, the wave heights at the second and third peak positions gradually decrease, indicating a gradual loss of wave energy, resulting in a downward trend in the hull resistance within this velocity range.
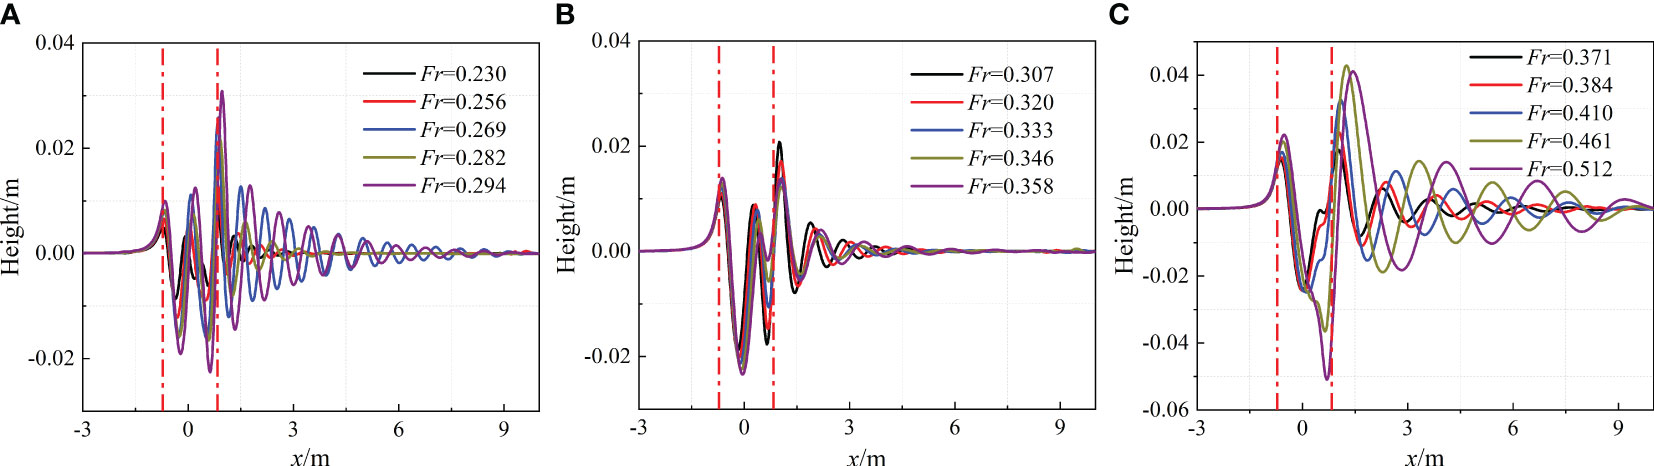
Figure 18 Waveform in the free surface under submergence depth of 1.1D: (A) 0.230≤Fr ≤ 0.294; (B) 0.307≤Fr ≤ 0.358; (C) 0.371≤Fr ≤ 0.512.
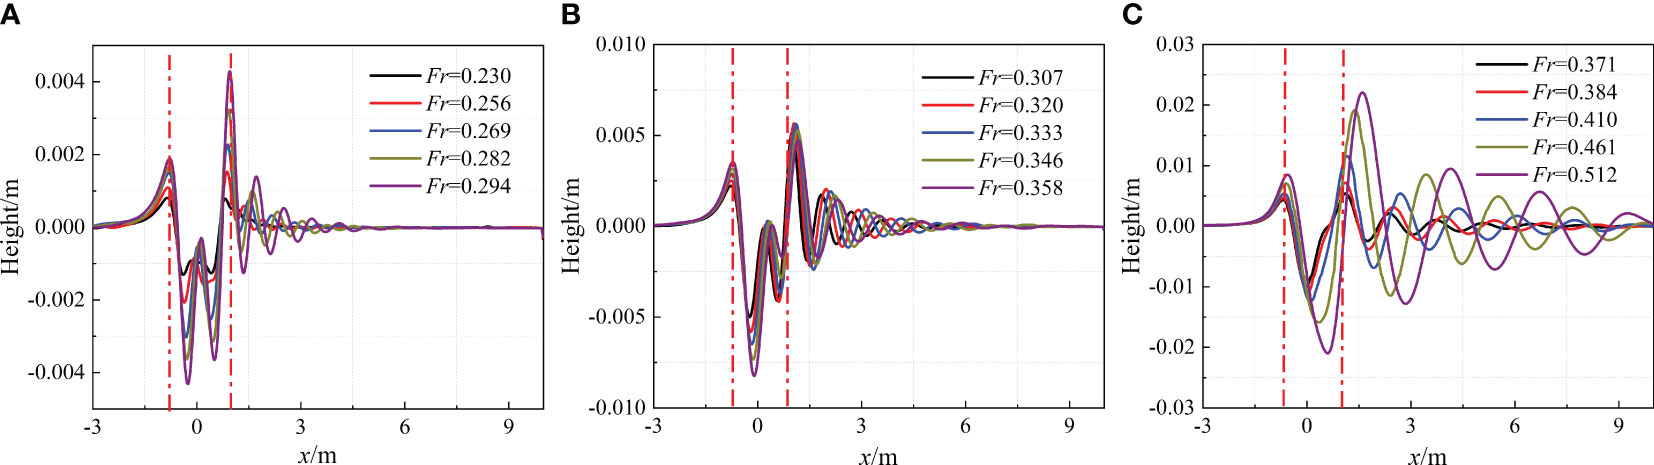
Figure 19 Waveform in the free surface under submergence depth of 2.1D: (A) 0.230≤Fr ≤ 0.294; (B) 0.307≤Fr ≤ 0.358; (C) 0.371≤Fr ≤ 0.512.
6 Conclusion
In this paper, the SUBOFF UUV sailing near the free surface is numerically simulated. Hydrodynamic performance as well as wake study under different sailing speeds and submerge depths are carried out. The verification and validation study depicts that the numerical model in this paper can meet the requirements for calculations of SUBOFF sailing near the free surface. The numerical findings reveal that the overall resistance of SUBOFF when sailing close to the open surface is considerably affected by the depth of submergence. An interesting discovery is that the total resistance coefficient curve exhibits a peak and a trough under the submergence depth of 1.1D, while disappears under the submergence depth of 2.1D. This means that when sailing near the free surface, the total resistance coefficient is extremely low within a certain speed range. At the same time, the impact of free surface on the hull is also extremely low. This discovery can be beneficial for the speed design of UUVs near the free surface.
The bow wave and stern wave systems interfere with each other, thereby affecting the hydrodynamic forces on the hull. The dynamic pressure coefficient at the front shoulder, rear shoulder, and stern rudder of the hull shows a sudden increase and decrease. As Fr increases, the lift and pitch moment gradually increase. When Fr=0.512, due to the wavelength completely exceeding the length of a hull, the wave amplitude generated in the front and rear shoulders is larger, resulting in a decrease in lift. When sailing near to the open surface, SUBOFF’s Kelvin wake causes wave-making resistance, which increases drastically with Fr. As Fr increases, the divergent wave system becomes more evident and the peaks and troughs created by its superposition with the transverse wave system become clearer. Because they need more energy to develop, UUVs need more power to overcome wave resistance.
Data availability statement
The raw data supporting the conclusions of this article will be made available by the authors, without undue reservation.
Author contributions
DZ: Writing – original draft. Writing – review & editing. BZ: Writing – original draft. Writing – review & editing. JS: Writing – original draft, Writing – review & editing.
Funding
The author(s) declare financial support was received for the research, authorship, and/or publication of this article. This study was financially supported by Program for Scientific Research Start-up Funds of Guangdong Ocean University (060302072101), Comparative Study and Optimization of Horizontal Lifting of Subsea Pipeline (2021E05011), the National Natural Science Foundation of China (62272109), China Scholarship Council (CSC202306320084).
Conflict of interest
The authors declare that the research was conducted in the absence of any commercial or financial relationships that could be construed as a potential conflict of interest.
Publisher’s note
All claims expressed in this article are solely those of the authors and do not necessarily represent those of their affiliated organizations, or those of the publisher, the editors and the reviewers. Any product that may be evaluated in this article, or claim that may be made by its manufacturer, is not guaranteed or endorsed by the publisher.
References
Amiri M. M., Esperança P. T., Vitola M. A., Sphaier S. H. (2018). How does the free surface affect the hydrodynamics of a shallowly submerged submarine? Appl. Ocean Res. 76, 34–50. doi: 10.1016/j.apor.2018.04.008
Amiri M. M., Esperança P. T., Vitola M. A., Sphaier S. H. (2020a). An initial evaluation of the free surface effect on the maneuverability of underwater vehicles. Ocean Eng. 196, 106851. doi: 10.1016/j.oceaneng.2019.106851
Amiri M. M., Sphaier S. H., Vitola M. A., Esperança P. T. (2019a). URANS investigation of the interaction between the free surface and a shallowly submerged underwater vehicle at steady drift. Appl. Ocean Res. 84, 192–205. doi: 10.1016/j.apor.2019.01.012
Amiri M. M., Sphaier S. H., Vitola M. A., Esperança P. T. (2019b). Investigation into the wave system of a generic submarine moving along a straight path beneath the free surface. Eur. J. Mech.-B/Fluids 76, 98–114. doi: 10.1016/j.euromechflu.2019.02.006
Amiri M. M., Sphaier S. H., Vitola M. A., Esperança P. T. (2020b). Viscosity effect on an underwater vehicle-free surface hydrodynamic interaction. Appl. Ocean Res. 104, 102365. doi: 10.1016/j.apor.2020.102365
Cao L., Gao G., Guo E., Wan D. (2023). Hydrodynamic performances and wakes induced by a generic submarine operating near the free surface in continuously stratified fluid. J. Hydrodyn., 1–11. doi: 10.1007/s42241-023-0037-8
Caplier C., Rousseaux G., Calluaud D., David L. (2016). Energy distribution in shallow water ship wakes from a spectral analysis of the wave field. Phys. Fluids 28, 107104. doi: 10.1063/1.4964923
Chang Y., Feng Z., Zhang J., Fang-Wen H., Ping L. I., Jun Y. (2006). Numerical simulation of internal waves excited by a submarine moving in the two-layer stratified fluid. J. Hydrodyn. Ser. B 18, 330–336. doi: 10.1016/S1001-6058(06)60074-7
Chase N. (2012). Simulations of the DARPA Suboff submarine including self-propulsion with the E 1619 propeller (Iowa City USA: University of Iowa).
Chase N., Carrica P. M. (2013). Submarine propeller computations and application to self-propulsion of DARPA Suboff. Ocean Eng. 60, 68–80. doi: 10.3233/ISP-130088
Chase N., Michael T., Carrica P. M. (2013). Overset simulation of a submarine and propeller in towed, self-propelled and maneuvering conditions. Int. Shipbuild. Prog. 60, 171–205.
Crook T. P. (1994). An initial assessment of free surface effects on submerged bodies: Monterey, California (Monterey, California, USA: Naval Postgraduate School).
Dai Y., Liu Z., Yu K., Zou H. (2007). A comment on the calculation methods of wave forces for a submarine under waves. Ship Sci. Techno. 29, 41–46.
Dawson E. (2014). An investigation into the effects of submergence depth, speed and hull length-to-diameter ratio on the near surface operation of conventional submarines (Hobart, Australia: University of Tasmania).
Dempwolff L., Windt C., Goseberg N., Martin T., Bihs H., Melling G. (2023). Verification of a free-surface pressure term extension to represent ships in a nonhydrostatic shallow-water-equations solver. J. Offshore Mech. Arctic Eng. 145, 21202. doi: 10.1115/1.4056121
Ding K., Yang J., Lin H., Wang Z., Wang D., Wang X., et al. (2023). Towards real-time detection of ships and wakes with lightweight deep learning model in Gaofen-3 SAR images. Remote Sens. Environ. 284, 113345. doi: 10.1016/j.rse.2022.113345
Dong K., Wang X., Zhang D., Liu L., Feng D. (2022). CFD research on the hydrodynamic performance of submarine sailing near the free surface with long-crested waves. J. Mar. Sci. Eng. 10, 90. doi: 10.3390/jmse10010090
Gourlay T., Dawson E. (2015). A havelock source panel method for near-surface submarines. J. Mar. Sci. Appl. 14, 215–224. doi: 10.1007/s11804-015-1319-5
Griffin M. J. (2002). Numerical prediction of the maneuvering characteristics of submarines operating near the free surface (Cambridge, Massachusetts, USA: Massachusetts Institute of Technology).
Herbert D., Astrom E., Bersoza A. C., Batzer A., McGovern P., Angelini C., et al. (2018). Mitigating erosional effects induced by boat wakes with living shorelines. Sustainability 10, 436. doi: 10.3390/su10020436
Huang F., Meng Q., Cao L., Wan D. (2022). Wakes and free surface signatures of a generic submarine in the homogeneous and linearly stratified fluid. Ocean Eng. 250, 111062. doi: 10.1016/j.oceaneng.2022.111062
Kelpšaite L., Parnell K. E., Soomere T. (2009). Energy pollution: the relative influence of wind-wave and vessel-wake energy in Tallinn Bay, the Baltic Sea. J. Coast. Res., 812–816.
Kim Y. (2021). Development and validation of hydrodynamic model for near free surface maneuvers of BB2 Joubert generic submarine (Iowa City USA: The University of Iowa).
Li D., Yang Q., Zhai L., Wang Z., He C. (2021). Numerical investigation on the wave interferences of submerged bodies operating near the free surface. Int. J. Nav. Archit. Ocean Eng. 13, 65–74. doi: 10.1016/j.ijnaoe.2021.01.002
Ling X., Leong Z. Q., Chin C. K., Woodward M. (2022a). Free surface effect on the hydrodynamics of an underwater vehicle hullform, The DARPA SUBOFF. Int. J. Marit. Eng. 164. doi: 10.5750/ijme.v164i1.732
Ling X., Leong Z. Q., Chin C., Woodward M., Duffy J. (2022b). Comparisons between seabed and free surface effects on underwater vehicle hydrodynamics. Int. J. Nav. Archit. Ocean Eng. 14, 100482. doi: 10.1016/j.ijnaoe.2022.100482
Ling X., Leong Z. Q., Duffy J. (2023). Effects of pitch angle on a near free surface underwater vehicle. Ocean Eng. 286, 115611. doi: 10.1016/j.oceaneng.2023.115611
Liu P., Jin Y. Q. (2017). Simulation of synthetic aperture radar imaging of dynamic wakes of submerged body. IET Radar Sonar Navigation 11, 481–489. doi: 10.1049/iet-rsn.2016.0297
Liu Y., Zhao J., Qin Y. (2021). A novel technique for ship wake detection from optical images. Remote Sens. Environ. 258, 112375. doi: 10.1016/j.rse.2021.112375
Lungu A. (2022). A DES-based study of the flow around the self-propelled DARPA Suboff working in deep immersion and beneath the free-surface. Ocean Eng. 244, 110358. doi: 10.1016/j.oceaneng.2021.110358
Luo Y., Zhang C., Liu J., Xing H., Zhou F., Wang D., et al. (2022). Identifying ship-wakes in a shallow estuary using machine learning. Ocean Eng. 246, 110456. doi: 10.1016/j.oceaneng.2021.110456
Ma W., Li Y., Ding Y., Duan F., Hu K. (2020). Numerical investigation of internal wave and free surface wave induced by the DARPA Suboff moving in a strongly stratified fluid. Ships Offshore Struct. 15, 587–604. doi: 10.1080/17445302.2019.1661633
Menter F. R. (1994). Two-equation eddy-viscosity turbulence models for engineering applications. AIAA J. 32, 1598–1605. doi: 10.2514/3.12149
Pethiyagoda R., McCue S. W., Moroney T. J. (2014). What is the apparent angle of a Kelvin ship wave pattern? J. Fluid Mech. 758, 468–485. doi: 10.1017/jfm.2014.530
Pethiyagoda R., McCue S. W., Moroney T. J. (2017). Spectrograms of ship wakes: identifying linear and nonlinear wave signals. J. Fluid Mech. 811, 189–209. doi: 10.1017/jfm.2016.753
Polis C. D., Ranmuthugala S., Duffy J., Renilson M. (2013). “Enabling the prediction of maneuvering characteristics of a submarine operating near the free surface,” in Proceedings of the Pacific 2013 International Maritime Conference. The Royal Institution of Naval Architects 1–11.
Sadat-Hosseini H., Wu P. C., Toda Y., Carrica P., Stern F. (2011). Urans studies of ship-ship interactions in shallow-water, in. Pettersen B., et al. (Ed). 2nd International Conference on Ship Manoeuvring in Shallow and Confined Water: Ship to Ship Interaction, May 18 - 20, 2011. (Trondheim, Norway: Norwegian Marine Technology Research Institute), pp. 299–308.
Scarpa G. M., Zaggia L., Manfè G., Lorenzetti G., Parnell K., Soomere T., et al. (2019). The effects of ship wakes in the Venice Lagoon and implications for the sustainability of shipping in coastal waters. Sci. Rep. 9, 19014. doi: 10.1038/s41598-019-55238-z
Shariati S. K., Mousavizadegan S. H. (2017). The effect of appendages on the hydrodynamic characteristics of an underwater vehicle near the free surface. Appl. Ocean Res. 67, 31–43. doi: 10.1016/j.apor.2017.07.001
Song S., Terziev M., Tezdogan T., Demirel Y. K., Muscat-Fenech C. D. M., Incecik A. (2023). Investigating roughness effects on ship resistance in shallow waters. Ocean Eng. 270, 113643. doi: 10.1016/j.oceaneng.2023.113643
Torunski B. (2018). Computational analysis of the free surface effects on a BB2 submarine undergoing horizontal maneuvers (New Brunswick, Canada: The University of New Brunswick).
Toxopeus S. (2008). Viscous-flow calculations for bare hull DARPA SUBOFF submarine at incidence. Int. Shipbuild. Prog. 55, 227–251. doi: 10.3233/ISP-2008-0048
Wang L., Martin J. E., Carrica P. M., Felli M., Falchi M. (2019). “Experiments and CFD for DARPA suboff appended with propeller E1658 operating near the surface,” in Proceedings of the 6th International Symposium on Marine Propulsors. National Research Council of Italy 1–9.
Wang L., Martin J. E., Felli M., Carrica P. M. (2020). Experiments and CFD for the propeller wake of a generic submarine operating near the surface. Ocean Eng. 206, 107304. doi: 10.1016/j.oceaneng.2020.107304
Wilcox D. C. (2008). Formulation of the kw turbulence model revisited. AIAA J. 46, 2823–2838. doi: 10.2514/1.36541
Wilson-Haffenden S. (2009). An investigation into the wave making resistance of a submarine travelling below the free surface (Launceston: Bachelor of Engineering. Australian Maritime College).
Xue F., Jin W., Qiu S., Yang J. (2021). Rethinking automatic ship wake detection: state-of-the-art CNN-based wake detection via optical images. IEEE Trans. Geosci. Remote Sens. 60, 1–22. doi: 10.1109/TGRS.2021.3128989
Yang Z., Chen K., Li Y., You Y. (2023). Modulation effects of submarine internal wake waves on free surface divergence field. Phys. Fluids 35, 062109. doi: 10.1063/5.0149186
Zhao B., Yun Y., Hu F., Sun J., Wu D., Huang B. (2022). Hydrodynamic coefficients of the DARPA SUBOFF AFF-8 in rotating arm maneuver: Part I: Test technology and validation. Ocean Eng. 266, 113148. doi: 10.1016/j.oceaneng.2022.113148
Zhao B., Yun Y., Hu F., Sun J., Wu D., Huang B. (2023). Hydrodynamic coefficients of the DARPA SUBOFF AFF-8 in rotating arm maneuver-Part II: Test results and discussion. Ocean Eng. 268, 113466. doi: 10.1016/j.oceaneng.2022.113466
Keywords: hydrodynamic performance, wake study, CFD simulation, dynamic coupling analysis, SUBOFF geometry
Citation: Zhang D, Zhao B and Sun J (2024) Hydrodynamic performance and wake study of an UUV sailing near the free surface. Front. Mar. Sci. 11:1292874. doi: 10.3389/fmars.2024.1292874
Received: 12 September 2023; Accepted: 18 January 2024;
Published: 06 February 2024.
Edited by:
Steven Meyers, University of South Florida, United StatesReviewed by:
Carlos Pérez-Collazo, University of Vigo, SpainMojtaba Maali Amiri, Federal University of Rio de Janeiro, Brazil
Copyright © 2024 Zhang, Zhao and Sun. This is an open-access article distributed under the terms of the Creative Commons Attribution License (CC BY). The use, distribution or reproduction in other forums is permitted, provided the original author(s) and the copyright owner(s) are credited and that the original publication in this journal is cited, in accordance with accepted academic practice. No use, distribution or reproduction is permitted which does not comply with these terms.
*Correspondence: Bowen Zhao, emhid21haWxAMTYzLmNvbQ==