 Ling Sun1,2
 Xinghe Wang
 Zijiang Hu
 Zhong Ning
- 1College of Transport & Communications, Shanghai Maritime University, Shanghai, China
- 2School of Management, Fudan University, Shanghai, China
- 3School of Economics, Jiangsu University of Technology, Changzhou, China
Excessive CO2 emissions and increased total costs of liner shipping are the two main problems affecting the environmental and economic benefits of liner companies under the European Union Emission Trading System (EU ETS). To address the upcoming EU ETS, we propose a carbon and cost accounting model for liner shipping that accurately calculates CO2 emissions and total cost of liner shipping. We conduct a case study that a containership operates on the liner route from the Far East to Northwest Europe. The results show that the sailing stage plays a pivotal role in CO2 emissions from liner shipping, accounting for 94.70% of CO2 emissions. Among four types of fuel, CO2 emissions from liner shipping using MGO is the largest, while CO2 emissions from liner shipping using methanol is the smallest. Methanol, as an alternative fuel, proves to be a better choice than LNG for CO2 control of liner shipping. The relationship between sailing speed and CO2 emissions follows a U-shaped curve for the selected containership. Notably, speed reduction is effective in carbon control of liner shipping only when the sailing speed exceeds 8.29 knots. Under the EU ETS, sailing speed is a key variable affecting the total cost of liner shipping. Speed reduction may not always be cost-effective. When keeping the total cost of liner shipping unchanged, sailing speed should be reduced as the EU allowance (EUA) price rises within a certain range. For the selected containership using MGO and HFO, the most economical sailing speed is 8.29 knots, corresponding to the increase in EUA price of 304.95% and 261.21%, respectively. If EUA price continues to rise, speed reduction will become ineffective in controlling the total cost of liner shipping. This model can enhance the environmental and economic benefits of liner companies, meet compliance requirements of the EU ETS, and provide a new perspective for carbon and cost control of liner shipping.
1 Introduction
To tackle global warming and achieve the 1.5°C goal of the Paris Agreement, there’s an increasing urgency to reduce greenhouse gas (GHG) emissions, especially carbon dioxide (CO2). Life cycle assessment (LCA) is a valuable method for calculating CO2 emissions, with a primary focus on the carbon footprint (CF) of products (Aseel et al., 2021; Fan et al., 2023). It is required to cover CO2 emissions from all stages in a product’ s lifecycle, such as production, transport, storage and use. Among them, transport is an important stage. Maritime transport, responsible for around 90% of global transport volume (Trivyza et al., 2019; Yu et al., 2021), is the most vital mode of transport in international trade and the most cost-effective way to transport large quantities of cargo over long distances (Du et al., 2019; Yan et al., 2020; Fan et al., 2022b). However, it generates approximately 3% of global GHG emissions (Wang et al., 2022; Mukherjee et al., 2023). Therefore, GHG emissions from maritime transport, particularly CO2 emissions, should be calculated accurately.
With the development of the economy and trade around the world, CO2 emissions from maritime activities continue to increase (Wada et al., 2021). From 2012 to 2018, GHG emissions from the maritime industry increased from 977 million tons to 1076 million tons (Li et al., 2022), with its share rising from 2.76% to 2.89% (Farkas et al., 2022). Notably, CO2 remains the predominant GHG accounting for over 98% (IMO, 2020; Dong et al., 2022; Perčić et al., 2022; Zhu et al., 2023). It is projected that by 2050, maritime emissions will increase by 90% to 130% compared to the emissions level of 2008 (Bassam et al., 2023). It is anticipated that by 2060, CO2 emissions from maritime transport will reach the level of road transport (Daniel et al., 2022). This trend is the exact opposite of the 1.5°C goal of the Paris Agreement (Li et al., 2022). As the regulatory agency of the maritime industry, the International Maritime Organization (IMO) strives to reduce GHG emissions from maritime transport at a global level (Inal et al., 2022). In 2023, the IMO proposed to reach net-zero GHG emissions from maritime transport close to 2050 (IMO, 2023). Therefore, effectively reducing CO2 emissions from maritime transport becomes increasingly imperative.
As the third largest emitter of GHG in the world (Dettner and Hilpert, 2023), the European Union (EU) committed to reducing net GHG emissions by at least 55% compared to 1990 by 2030 (Abreu et al., 2023), and enshrined in legislation of achieving economy-wide climate neutrality by 2050 at the latest and negative emissions thereafter (Watanabe et al., 2022; Yan et al., 2023). Maritime transport is a substantial CO2 emitter for the EU, accounting for around 3% to 4% of the EU’s total CO2 emissions and about 13% of the maritime industry’s GHG emissions (European Commission, 2023b). Due to the slow and insufficient progress made by the IMO previously, the EU has taken the lead in promoting CO2 control of the maritime industry at a regional level (Wang et al., 2021; Judith and Jason, 2022). In 2013, the EU took the first step in reducing GHG emissions from the maritime industry (European Commission, 2013). In 2015, the EU released the regulation on the monitoring, reporting and verification (MRV) of CO2 emissions from maritime transport based on the fuel consumption of ships (EUR-Lex, 2015; Adamowicz, 2022). In 2023, the regulation on the inclusion of the maritime industry in the European Union Emission Trading System (EU ETS) entered into force (EUR-Lex, 2023). Shipping companies are required to surrender allowances for EU-related emissions, undoubtedly resulting in increased total costs of maritime transport.
Under the EU ETS, the key to calculating the EU allowance (EUA) cost of maritime transport is to account for CO2 emissions from maritime transport, which is the total amount of CO2 emissions from the port of departure to the port of destination. Accurate carbon accounting for maritime transport is the prerequisite and foundation for the maritime industry to verify and implement the EU ETS and for shipping companies to cope with the EU ETS.
Liner shipping is a prominent source of CO2 emissions from maritime transport, with containerships being often the main type of ships providing these services. Compared to other ship types such as bulk carriers and oil tankers, containerships typically operate at higher speed (Svindland, 2018), leading to greater fuel consumption and CO2 emissions (Kokosalakis et al., 2021). Moreover, the sailing speed of a containership has a substantial impact on its total cost (Wang and Meng, 2012). The sailing speed affects fuel consumption, thus affecting fuel cost, which accounts for over 50% and sometimes even 75% of the total cost of a ship (Zheng et al., 2021). Under the EU ETS, the sailing speed of liner shipping will affect its EUA cost by affecting EU-related CO2 emissions.
This paper constructs a carbon and cost accounting model for liner shipping to quantify its environmental and economic impacts. Taking a containership serving the Far East to Northwest Europe route as a case study, this paper calculates CO2 emissions from each stage of liner shipping and each power equipment of the ship. The CO2 control potentials of alternative fuels are compared. The CO2 control effect of speed reduction is presented. Under the EU ETS, this paper calculates the total cost of liner shipping, and analyzes the impact of EUA price on the sailing speed. Based on the proposed carbon and cost accounting model of liner shipping, this paper aims to solve the following four questions: (1) What is the key stage and major contributor to CO2 emissions from liner shipping? (2) What are the CO2 control potentials of alternative fuels compared to fossil fuels? (3) What is the CO2 control effect of speed reduction? (4) Under the EU ETS, how can liner companies control the total cost of liner shipping?
This paper contributes to the effective control of CO2 emissions and total costs of liner shipping by proposing a carbon and cost accounting model for liner shipping, to overcome the problems of excessive CO2 emissions and increased total costs of liner shipping. Under the EU ETS, this model can help liner companies calculate and control CO2 emissions and total cost of liner shipping, meet compliance requirements of the EU ETS, and enhance sustainability and competitiveness.
The remainder of this paper is structured as follows. Section 2 reviews the relevant literature. Section 3 constructs a carbon and cost accounting model for liner shipping. Section 4 selects a containership operating on the liner route from the Far East to Northwest Europe to verify the model and provide the solution. The conclusion and limitations are summarized in Section 5.
2 Literature review
2.1 Life cycle assessment
Life cycle assessment (LCA), a systematic tool to assess the carbon footprint (CF) of a product throughout its lifecycle (Brynolf et al., 2014; Bilgili, 2021a), is used to avoid problem shifting (Finnveden et al., 2009; Xiao et al., 2023). In the maritime industry, several LCA studies have been conducted on the CF of ships and their fuels (Perčić et al., 2020; Perčić et al., 2021; Fan et al., 2023; Yan et al., 2023). Fan et al. (2023) used the LCA method to assess the CF of inland ships. It is also used to study marine fuels, with a primary focus on heavy fuel oil (HFO), marine gas oil (MGO), LNG and methanol (Ammar, 2019; Bilgili, 2021b). Chalaris et al. (2022) studied the life cycle of ammonia, encompassing the well-to-tank (WTT) and tank-to-wake (TTW) stages. LCA is widely considered to be a useful method for assessing the CF of products. Whether considering a ship or its fuel as a product, maritime transport is an important stage in its lifecycle and CO2 emissions from maritime transport are an important part of its life cycle assessment. Therefore, this paper chooses to investigate CO2 emissions from maritime transport, mainly liner shipping, by constructing a carbon accounting model for liner shipping.
2.2 CO2 control measures in the maritime industry
There are mainly three types of measures to control CO2 emissions from the maritime industry: technical measures, operational measures and market-based measures (MBMs) (Psaraftis and Kontovas, 2010; Ančić et al., 2020). Technical measures need to change the structure of the ships (Bouman et al., 2017), mostly including alternative fuels, energy saving devices, improving propulsion and power systems, shore power and carbon capture, utilization and storage (CCUS) technology (Zis et al., 2020), of which using alternative fuels is the most promising (Dettner and Hilpert, 2023), with the most significant environmental benefit (Ejder and Arslanoğlu, 2022). Shore power is one of the most prominent measures to reduce emissions in ports by eliminating emissions from auxiliary engines at berth (Bjerkan and Seter, 2021; Sun et al., 2022a). Zis (2019) pointed out that by the end of 2025, all EU ports must be equipped with shore power. Operational measures involve changing the operational strategy of the ships (Fan et al., 2022a), and mostly contain speed reduction, route planning, fleet deployment, and energy efficiency management (Farkas et al., 2021). The most significant and promising measure is speed reduction, also known as slow steaming (Wan et al., 2018; Wu et al., 2022a; Dettner and Hilpert, 2023). They do not require any modification of the ships (Ma et al., 2021), and can substantially reduce fuel consumption and CO2 emissions (Fan et al., 2022a). Gu et al. (2019) considered that fuel consumption and corresponding CO2 emissions depend not only on the sailing speed, but also on the sailing route. Hence, route planning is also an important measure to reduce emissions. MBMs are flexible and cost-effective that make use of the market and provide incentives for emission control (Wang et al., 2015; Wang et al., 2021), mainly including two types: emission trading system (ETS) and carbon taxation (Ling-Chin and Roskilly, 2016; Wu et al., 2022b). Zis et al. (2020) conducted a detailed analysis of relevant CO2 control measures in the maritime industry, and emphasized the importance of including MBMs to reach the IMO targets. However, they increase emission cost through economic means (Zou and Yang, 2023). Among the above measures, the ETS is perhaps one of the most cost-effective measures in the short term (Meng et al., 2023). The most effective one is the EU ETS (Zeng et al., 2021).
2.3 Including the maritime industry in the EU ETS
Set up in 2005, the EU ETS is a ‘cap and trade’ system designed to reduce GHG emissions at the regional level of the EU (Christodoulou et al., 2021). As the world’s first and largest international ETS (Hintermayer, 2020; Meng et al., 2023), the EU ETS is a cornerstone of the EU’s policy to tackle climate change and a key tool for cost-effectively reducing GHG emissions (European Commission, 2023a). From 2024, the EU ETS will be extended to cover CO2 emissions from the maritime industry (European Commission, 2023b). This will apply to ships of 5,000 gross tonnage and above that transport cargo or passengers for commercial purposes (Zhu et al., 2023). Specifically, 50% of emissions from ships sailing between a port of call under the jurisdiction of an EU Member State and a port of call outside the jurisdiction of an EU Member State, 100% of emissions from ships sailing between ports of call under the jurisdiction of an EU Member State and 100% of emissions from ships within a port of call under the jurisdiction of an EU Member State will be included in the EU ETS (EUR-Lex, 2023). To ensure a smooth transition, the EU ETS will be implemented in phases in the maritime industry (European Commission, 2023b). Shipping companies shall be liable to surrender EUA cost for a certain percentage of the emissions reported in the previous year (European Commission, 2023b). From 2025 to 2027, the prescribed proportions are 40%, 70%, and 100%, respectively (Dettner and Hilpert, 2023).
In the existing literature, scholars highlighted the impacts of including the maritime industry in the EU ETS (Sun et al., 2022b). As early as 2015, Hermeling et al. (2015) evaluated the economic and legal effects of the EU regional maritime ETS. In recent years, Zhu et al. (2018) studied the potential impact of an open maritime ETS on fleet deployment and CO2 emissions of individual containership operators. Gu et al. (2019) concluded that the impacts of maritime ETS on emission control can be divided into two parts, on one hand, it is a strong incentive for the maritime industry to invest in advanced emission control technologies to achieve long-term emission control; on the other hand, it can motivate the maritime industry to optimize ships operation, such as speed reduction, route adjustment, to achieve short-term emission control. In addition, it is suggested that in terms of emission control, a global scheme is better than a regional one. Wang et al. (2021) discussed the impacts of including the maritime industry in the EU ETS on shipping companies, mainly focusing on three areas of green technology investment, transportation mode shift, and fleet deployment in the shipping network. Christodoulou et al. (2021) aimed to assess the potential direct economic impacts on the maritime industry from its inclusion in the EU ETS. CO2 emissions within the European Economic Area (EEA) were estimated using MRV data. The scenario-based economic impact assessment model was constructed to analyze the economic impact of different price incentives, geographical coverage and emission allowances allocation methods. The results suggested that shipping companies would be directly affected economically as their operational costs increase by the additional cost of carbon allowance. Cariou et al. (2021) estimated the impacts of the EU ETS on seaborne oil trades and main market players and determined whether the EU ETS can provide incentives for abatement measures in the maritime industry. Results indicated that the EU ETS can provide sufficient incentives for specific abatement measures. Goicoechea and Abadie (2021) examined the impact of the EU ETS on the optimal slow steaming speed of containerships. Containerships were chosen as they account for the largest proportion of GHG emissions. Optimal slow steaming speed was chosen as the sailing speed of containerships is the highest of any category. A SWOT analysis was presented by Christodoulou and Cullinane (2023) to study the impacts and prospects of including the maritime industry in the EU ETS. According to the opportunities of ETS, shipping companies are required to surrender allowances to cover emissions, they would seek technical and operational practices to reduce their costs. It was concluded that alternative fuels can help reduce CO2 emissions from the maritime industry. Shih et al. (2023) investigated the impacts of the EU ETS on the optimal speed and fuel to minimize CO2 emissions and cost. Under the EU ETS, Wang et al. (2023) explored the optimal sailing speeds within the EU and non-EU areas and optimal number of ships to be equipped in the shipping route that minimizes the total cost of the shipping company.
The existing literature predominantly focuses on the impacts of including the maritime industry in the EU ETS, with a particular emphasis on its economic and environmental impacts. Additionally, the literature explores how different types of ships and maritime entities are affected by this inclusion. Overall, it is evident that the inclusion of the maritime industry in the EU ETS will have a considerable impact on the maritime industry and relevant entities. It is worth noting that although the EU ETS will involve EUA costs, it is still environmentally and cost-effective. The inclusion of the maritime industry in the EU ETS can provide stronger incentives for emission control and promote more capital flows for investment in energy-efficient technologies and deployment of alternative fuels.
3 Method
3.1 Problem description
In this paper, maritime transport is classified into two stages: the sailing stage and the in-port stage. CO2 emissions from these stages will be covered in the carbon accounting for liner shipping. The main engine and the auxiliary engine are the key power equipment of the maritime transport, which are responsible for CO2 emissions from the maritime industry. The key components that provide power will be included in the carbon accounting for liner shipping. When the regulation of including the maritime industry in the EU ETS comes into force, the EUA cost will be incurred in the maritime industry. Therefore, this paper focuses on the environmental and economic impacts of liner shipping under the EU ETS.
3.2 Basic assumptions
The model constructed in this paper is based on the following basic assumptions.
Assumption 1: As the relationship between fuel consumption and ship speed is exponential (Goicoechea and Abadie, 2021), it is assumed that fuel consumption of the main engine is proportional to the sailing speed to the power of α (Cariou and Cheaitou, 2012; Du et al., 2019), and is independent of the fuel type used by ships (Fan et al., 2020).
Assumption 2: The hull of each containership providing liner service is in good condition, and suitable for navigation.
Assumption 3: This model assumes that containerships are loaded with dry cargo containers, and reefer containers are not included in the calculation range (Doudnikoff and Lacoste, 2014). Although this assumption may be inconsistent with reality, the proportion of reefer containers transported in practice is indeed very low.
3.3 Parameter setting
The parameters are set in Table 1.
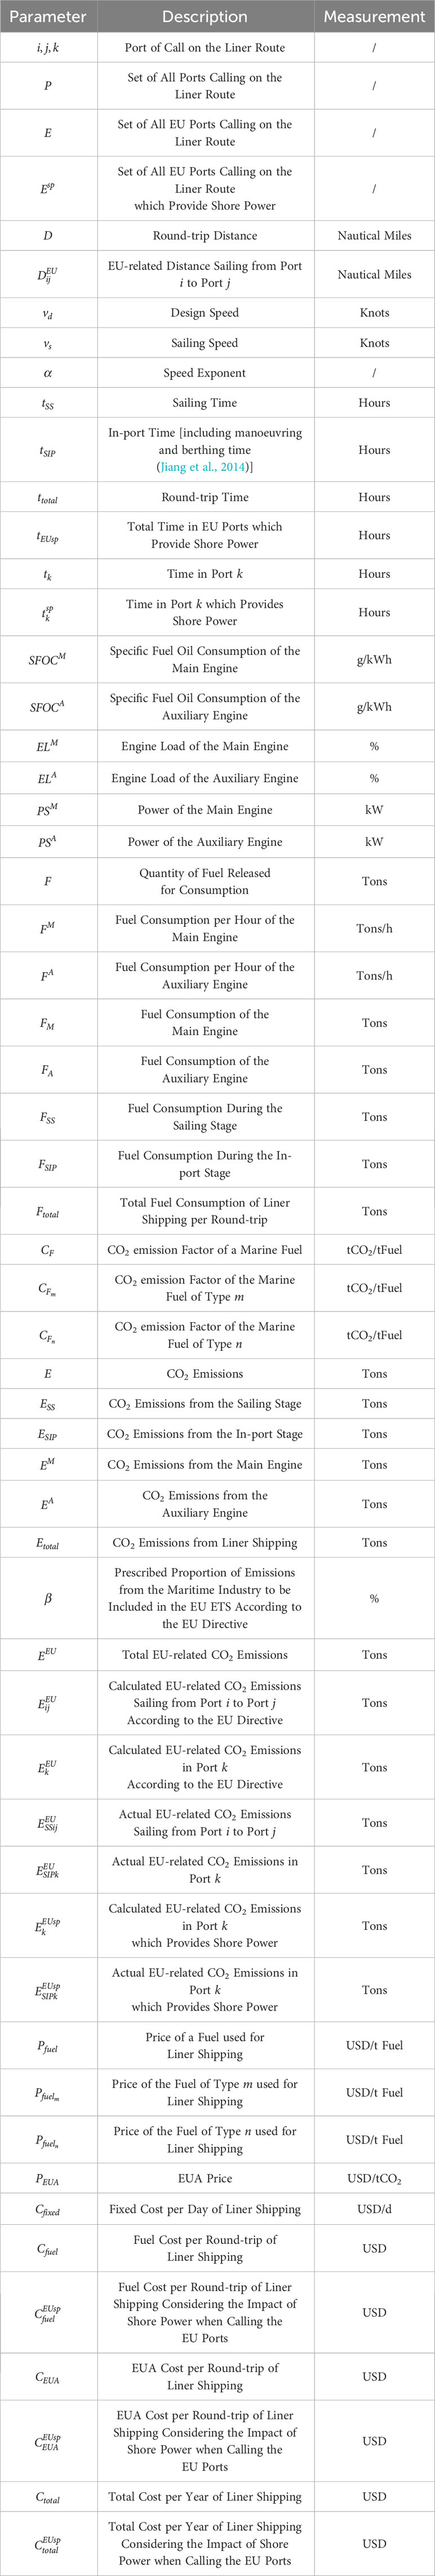
Table 1 Parameter setting.
3.4 Mathematical model
3.4.1 Carbon accounting
3.4.1.1 Fuel consumption
The main engine serves as the primary power equipment of ships, converting the chemical energy of marine fuels into the mechanical energy of ships to generate propulsive force and push ships forward. According to the formula provided by Cariou and Cheaitou (2012), the fuel consumption per hour of the main engine is defined as Equation 1.
where denotes the main engine, is the fuel consumption of the main engine (tons/h), is the specific fuel oil consumption of the main engine (g/kWh), is the engine load of the main engine (%), is the power of the main engine (), is the sailing speed of the ship (knots), is the design speed of the ship (knots), and is the speed exponent.
The fuel consumption of the main engine is derived as Equation 2.
where is the fuel consumption of the main engine (tons).
The auxiliary engine serves as the secondary power equipment of ships, supporting the operation of the main engine and providing additional functions. The fuel consumption of the auxiliary engine is independent of ship speed (Doudnikoff and Lacoste, 2014). According to the formula provided by Cariou and Cheaitou (2012) and Doudnikoff and Lacoste (2014), the fuel consumption per hour of the auxiliary engine is defined as Equation 3.
where denotes the auxiliary engine, is the fuel consumption of the auxiliary engine (tons/h), is the specific fuel oil consumption of the auxiliary engine (g/kWh), is the engine load of the auxiliary engine (%) and is the power of the auxiliary engine ().
The fuel consumption of the auxiliary engine is derived as Equation 4.
where is the fuel consumption of the auxiliary engine (tons).
During the sailing stage, the main engine and auxiliary engine work simultaneously. The main engine provides power for the ship’s propulsion, while the auxiliary engine is mainly used to generate electricity to ensure the proper functioning of the ship (Jeong et al., 2018). The fuel consumption during the sailing stage is calculated as Equation 5 (Corbett et al., 2009).
where is the fuel consumption during the sailing stage (tons), is the fuel consumption of the main engine (tons/h), is the fuel consumption of the auxiliary engine (tons/h) and is the sailing time (hours). It is derived as Equation 6.
where is the round-trip distance (nautical miles) and is the sailing speed of the ship (knots).
During the in-port stage, the main engine is typically stopped, while the auxiliary engine remains working to provide auxiliary power for onboard electricity generation (Doudnikoff and Lacoste, 2014). The fuel consumption during the in-port stage is proportional to the in-port time, which is derived as Equation 7 (Psaraftis and Kontovas, 2014).
where is the fuel consumption during the in-port stage (tons), is the fuel consumption per hour of the auxiliary engine (tons/h), is the in-port time (hours) and is the round-trip time (hours). The round-trip time consists of sailing time and in-port time (Wang and Meng, 2012), which is calculated as Equation 8.
3.4.1.2 CO2 emissions
CO2 emissions are directly proportional to fuel consumption (Psaraftis and Kontovas, 2013), which are defined as Equation 9 (Bilgili, 2021b; Fan et al., 2023).
where is CO2 emissions (tons), is fuel consumption (tons) and is the carbon emission factor of a marine fuel (tCO2/tFuel).
(1) When the main engine and auxiliary engine use the same fuel type,
CO2 emissions from sailing stage are obtained as Equation 10 (Corbett et al., 2009).
CO2 emissions from the in-port stage are obtained as Equation 11.
CO2 emissions from the main engine are obtained as Equation 12 (Doudnikoff and Lacoste, 2014; Zou and Yang, 2023).
CO2 emissions from the auxiliary engine are obtained as Equation 13 (Doudnikoff and Lacoste, 2014; Zou and Yang, 2023).
CO2 emissions from liner shipping are obtained as Equation 14 (Cariou and Cheaitou, 2012; Doudnikoff and Lacoste, 2014).
(2) When the main engine and auxiliary engine use different fuel types, that is, the main engine uses a fuel of type m and the auxiliary engine uses a fuel of type n,
CO2 emissions from liner shipping are obtained as Equation 15 (Cariou and Cheaitou, 2012; Doudnikoff and Lacoste, 2014).
Among them, CO2 emissions from the sailing stage are obtained as Equation 16 (Corbett et al., 2009).
CO2 emissions from the in-port stage are obtained as Equation 17.
CO2 emissions from the main engine are obtained as Equation 18 (Doudnikoff and Lacoste, 2014; Zou and Yang, 2023).
CO2 emissions from the auxiliary engine are obtained as Equation 19 (Doudnikoff and Lacoste, 2014; Zou and Yang, 2023).
3.4.2 Cost accounting
The total cost of maritime transport can be divided into three parts: capital cost, operational cost and fuel cost (Cullinane and Khanna, 1999; Tran and Lam, 2022b). Capital cost is the most basic cost of a ship. Operational cost mainly includes crew wages, insurance premium, repair and maintenance cost, store and lube cost, administration cost (Fan et al., 2020). Fuel cost accounts for a large proportion of the total cost (Doudnikoff and Lacoste, 2014). Both capital cost and operational cost can be considered as fixed cost, as these costs are incurred on a daily basis once shipping service starts to be provided (Wu, 2020). When the regulation of including the maritime industry in the EU ETS comes into force, the EUA cost will be incurred in the maritime industry.
3.4.2.1 Fuel cost
Fuel cost derives from fuel consumption during the sailing stage and in-port stage (Wang et al., 2022). It can be calculated as Equations 20, 21.
(1) When the main engine and auxiliary engine use the same fuel type,
where is the fuel cost per round-trip (USD), is the total fuel consumption per round-trip (tons), and is the price of fuel used for liner shipping (USD/tFuel).
(2) When the main engine and auxiliary engine use different fuel types, that is, the main engine uses a fuel of type m and the auxiliary engine uses a fuel of type n,
Considering the impact of shore power when calling the EU ports, fuel cost can be expressed as Equations 22, 23.
where is the fuel cost per round-trip considering the impact of shore power when calling the EU ports (USD), and is the total time in EU ports which provide shore power (hours).
where is the price of the fuel of type m used for liner shipping (USD/tFuel), and is the price of the fuel of type n used for liner shipping (USD/tFuel).
3.4.2.2 EUA cost
Under the EU ETS, EUA cost can be defined as Equation 24.
where is the EUA cost per round-trip (USD), is the prescribed proportion of emissions from the maritime industry to be included in the EU ETS according to the EU directive (%), is the total EU-related CO2 emissions according to the EU directive (tons), is the EUA price (USD/tCO2), is the calculated CO2 emissions sailing from port i to port j according to the EU directive (tons), and is the calculated CO2 emissions in port k according to the EU directive (tons).
According to the EU directive (EUR-Lex, 2023), the calculated CO2 emissions sailing from port i to port j are derived as Equation 25.
where i, j represent the ports of call on the liner route, and port j is the next port of call after port i on the liner route, P represents the set of all ports calling on the liner route, E represents the set of all EU ports calling on the liner route, is the actual CO2 emissions sailing from port i to port j (tons), it can be obtained as Equations 26, 27.
(1) When the main engine and auxiliary engine use the same fuel type,
where is the EU-related distance sailing from port i to port j (nautical miles).
(2) When the main engine and auxiliary engine use different fuel types, that is, the main engine uses a fuel of type m and the auxiliary engine uses a fuel of type n,
According to the EU directive (EUR-Lex, 2023), the calculated CO2 emissions in port k are derived as Equation 28.
where k represents the port of call on the liner route, is the actual CO2 emissions in port k (tons), it can be obtained as Equations 29, 30.
(1) When the main engine and auxiliary engine use the same fuel type,
where is the time in port k (hours).
(2) When the main engine and auxiliary engine use different fuel types, that is, the main engine uses a fuel of type m and the auxiliary engine uses a fuel of type n,
Considering the impact of shore power when calling the EU ports, EUA cost can be expressed as Equation 31.
where is EUA cost per round-trip considering the impact of shore power when calling the EU ports (USD), and is the calculated CO2 emissions in port k which provides shore power (tons), it can be derived as Equation 32.
where represents the set of all EU ports which provide shore power, and is the actual CO2 emissions in port k which provides shore power (tons), it can be obtained as Equations 33 and 34.
(1) When the main engine and auxiliary engine use the same fuel type,
where is the time in port k which provides shore power (hours).
(2) When the main engine and auxiliary engine use different fuel types, that is, the main engine uses a fuel of type m and the auxiliary engine uses a fuel of type n,
3.4.2.3 Total cost
Under the EU ETS, the total cost per year of liner shipping can be defined as Equation 35.
where is the total cost per year of liner shipping (USD), is the number of days in a year that a ship is used to provide liner service (days), is the fixed cost per day of liner shipping (USD/d), which includes daily capital cost and daily operational cost and is the number of round-trips per year.
Considering the impact of shore power when calling the EU ports, the total cost per year of liner shipping can be expressed as Equation 36.
where is the total cost per year of liner shipping considering the impact of shore power when calling the EU ports (USD).
The total cost per year of liner shipping can be obtained by synthesizing the above equations.
4 Case study
A containership operating on the Far East-Northwest Europe route was selected as a case study. Table 2 summarizes the detailed information on the ship and route involved in this paper. The voyage information of the selected containership on the liner route is presented in Table 3.

Table 2 Ship and route information.
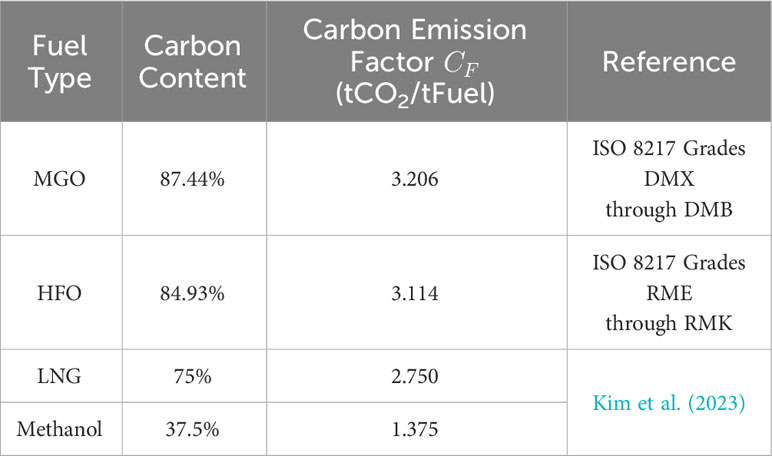
Table 3 Carbon emission factors of the four fuels used in this paper.
There are four marine fuel options available: two fossil fuels (MGO and HFO) and two alternative fuels (LNG and methanol). Table 4 provides the carbon content and carbon emission factors of these fuels.
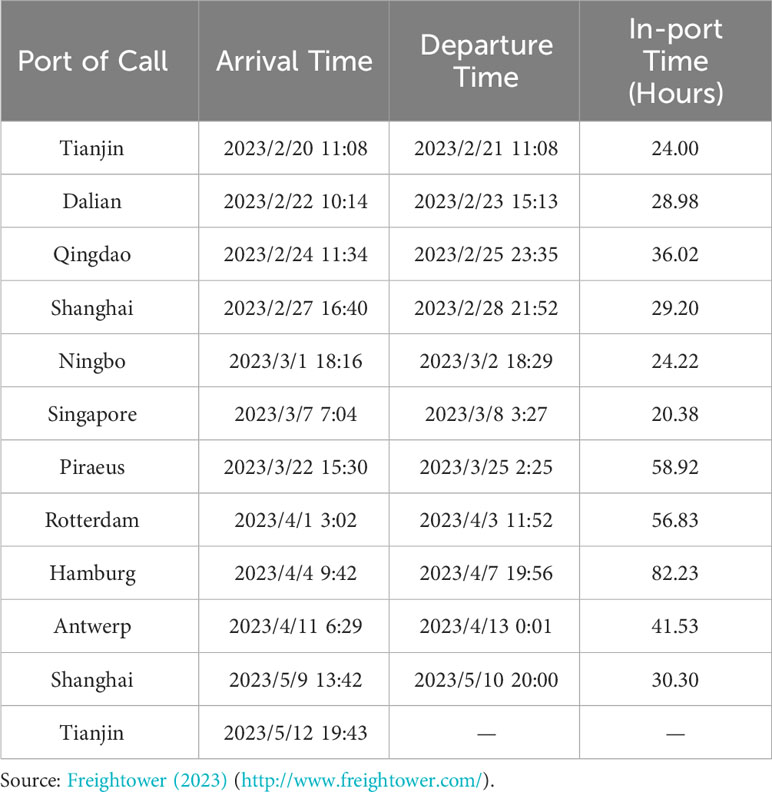
Table 4 Voyage information of the selected containership on the liner route.
4.1 Carbon accounting for liner shipping
For a detailed carbon contribution analysis of liner shipping, CO2 emissions from two stages of liner shipping (the sailing stage and in-port stage) and two power equipment of the selected containership (the main engine and auxiliary engine) were calculated.
Currently, HFO is the most commonly used marine fuel for the maritime industry (Ančić et al., 2020; Bilgili, 2021b; Müller-Casseres et al., 2021), accounting for nearly 80% of total fuel consumption in 2018 (IMO, 2020). When the selected containership uses HFO for liner service, CO2 emissions from liner shipping during the sailing and in-port stage are presented in Figure 1.
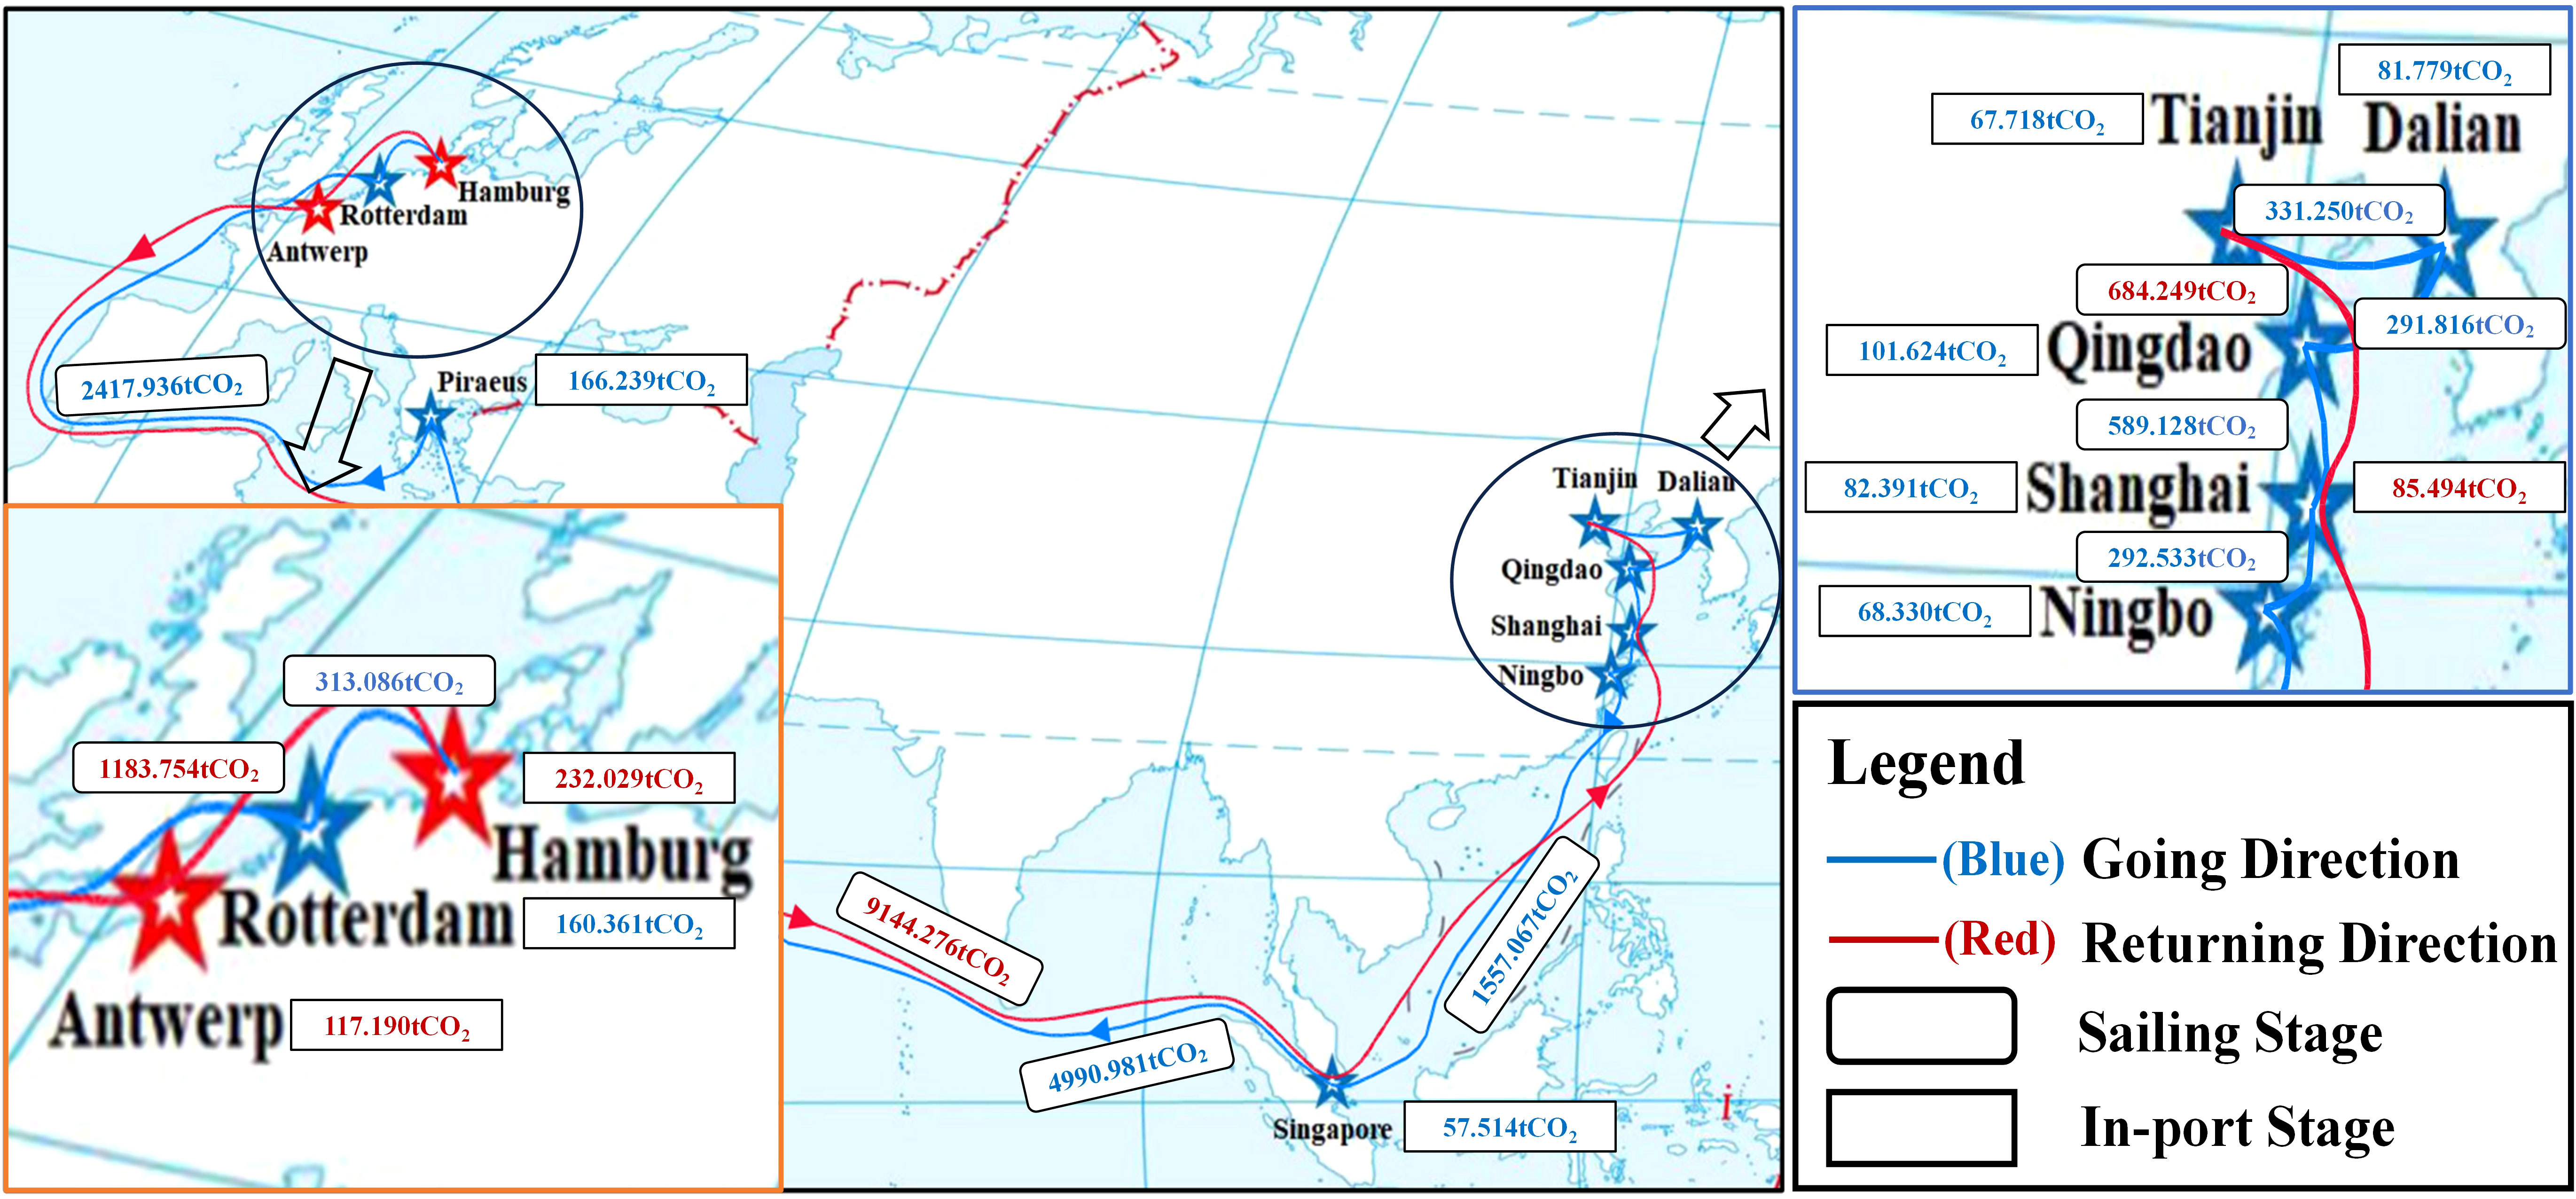
Figure 1 CO2 emissions from liner shipping during the sailing and in-port stage (tons). Source: COSCO Shipping Lines (https://lines.coscoshipping.com/).
When the selected containership uses two fossil fuels (MGO and HFO), Table 5 presents CO2 emissions from liner shipping. From the perspective of different stages of liner shipping, the sailing stage emits the most CO2 emissions, accounting for 94.40% of CO2 emissions. From the perspective of different power equipment of ships, the main engine is the main contributor, producing 74.36% of CO2 emissions.
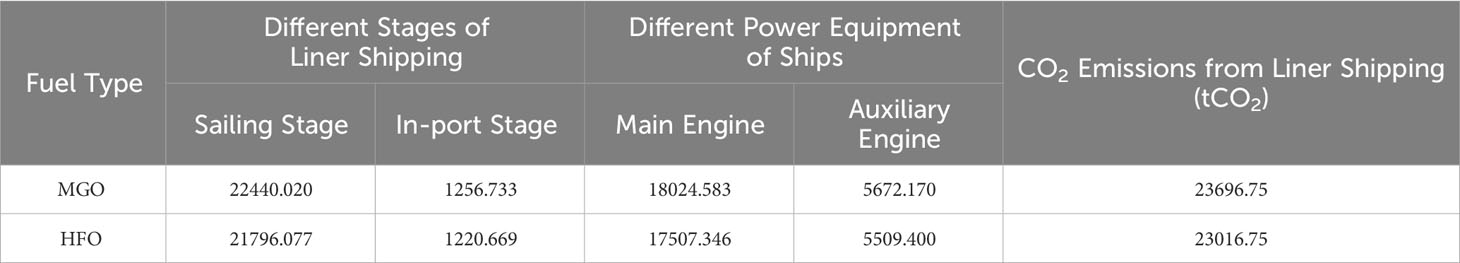
Table 5 CO2 emissions from liner shipping using two fossil fuels (MGO, HFO).
4.2 CO2 control in liner shipping
On the basis of carbon accounting, effective CO2 control is necessary.
4.2.1 CO2 control potentials of alternative fuels
As alternative fuels, low-carbon fuels such as LNG and methanol are currently favored by the maritime industry due to extensive research and relatively well-established applications. As concluded by Yan et al. (2023), LNG and methanol are currently suitable options.
Figure 2 illustrates CO2 emissions from liner shipping using four types of fuels. The results indicate that CO2 emissions from liner shipping using these marine fuels in the order of high to low is MGO, HFO, LNG and methanol, which is consistent with the order of carbon content of these fuels. CO2 emissions from liner shipping using MGO are the largest, reaching 23696.75 tCO2, while CO2 emissions from liner shipping using methanol are the smallest, being 10163.14 tCO2.
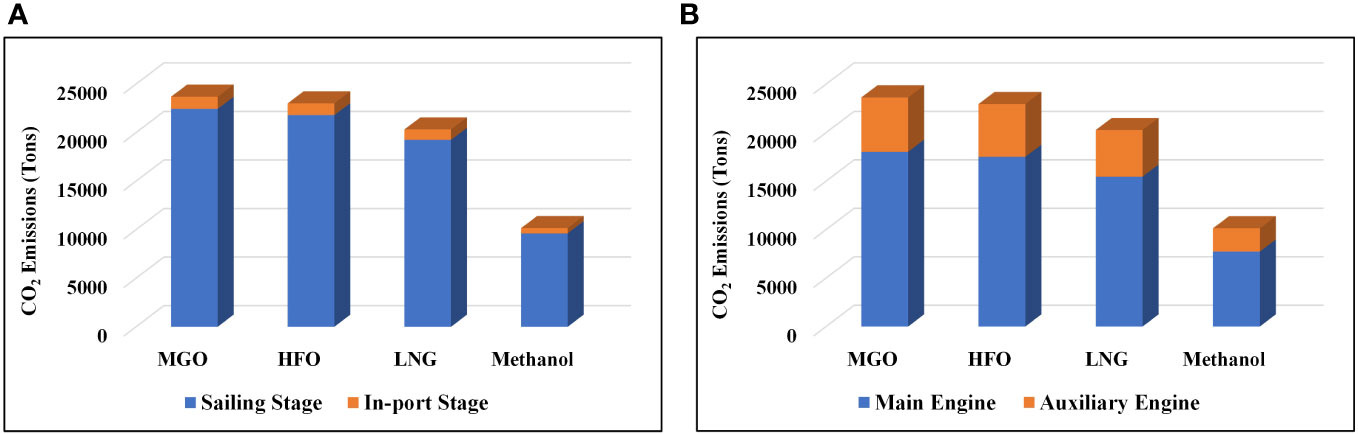
Figure 2 CO2 emissions from liner shipping using four types of fuels (tons). (A) CO2 emissions from the sailing stage and in-port stage using four types of fuels. (B) CO2 emissions from the main engine and auxiliary engine using four types of fuels.
It can be demonstrated that using alternative fuels can significantly reduce CO2 emissions from liner shipping compared to using fossil fuels. Compared with MGO, the fossil fuel with the highest carbon content, CO2 control potentials of LNG and methanol are 14.22% and 57.11%, respectively. Compared with the most commonly used fossil fuel, HFO, CO2 control potentials of LNG and methanol are 11.69% and 55.84%, respectively. In terms of alternative fuels, methanol has a greater potential for CO2 control in liner shipping than LNG.
4.2.2 CO2 control effect of speed reduction
Sailing speed is a crucial factor in the maritime industry (Psaraftis and Kontovas, 2013), and a decisive factor affecting CO2 emissions (Tran and Lam, 2022a). Due to higher sailing speed (Doudnikoff and Lacoste, 2014; Svindland, 2018), containerships consume more fuel and consequently generate more CO2 emissions (Kokosalakis et al., 2021).
Figure 3 shows the U-shaped relationship between sailing speed and CO2 emissions from liner shipping. This indicates that there exists a sailing speed that minimizes CO2 emissions from liner shipping. When the sailing speed of the selected containership is less than 8.29 knots, CO2 emissions from liner shipping decreases with the increase in sailing speed; when the sailing speed is 8.29 knots, CO2 emissions from liner shipping reaches its lowest point; when the sailing speed exceeds 8.29 knots, CO2 emissions from liner shipping increases with the increase of sailing speed. As the average speed of the selected containership has reached 16.69 knots, which is greater than 8.29 knots, speed reduction is an effective measure to reduce CO2 emissions from liner shipping.
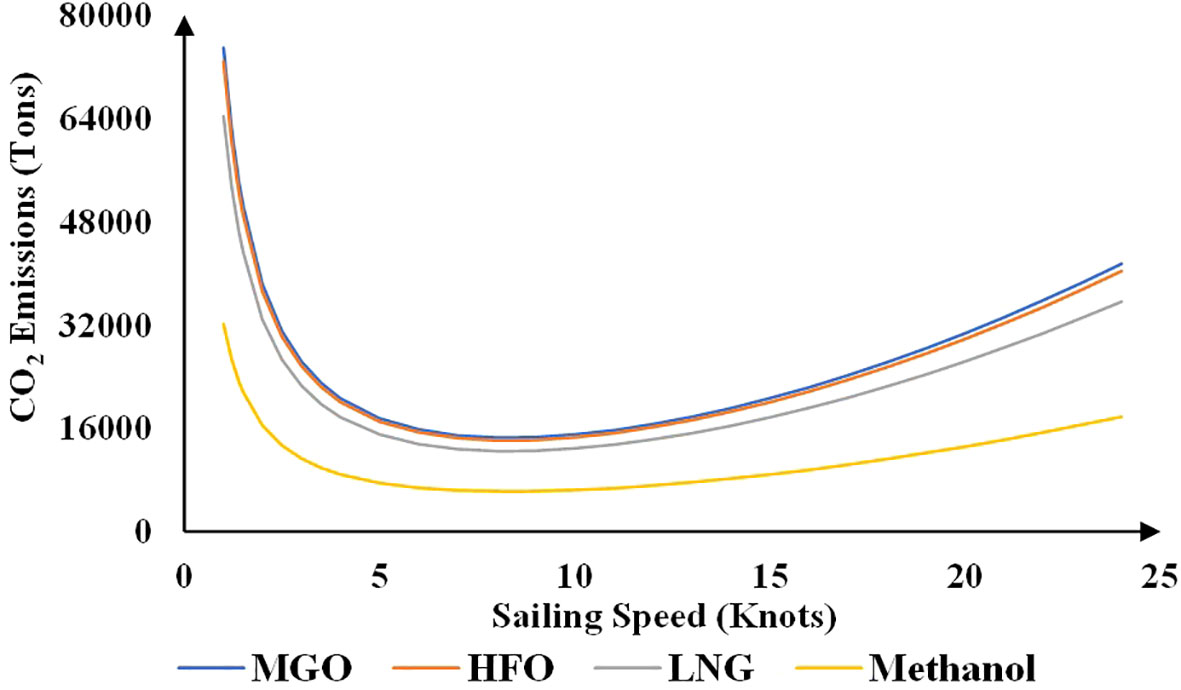
Figure 3 Relationship between sailing speed and CO2 emissions of liner shipping.
4.2.3 CO2 emissions from liner shipping to be included in the EU ETS
When the regulation of the inclusion of the maritime industry in the EU ETS comes into force, shipping companies are obligated to surrender allowances to cover their EU-related emissions. Taking a containership operating on a liner route from Far East to Northwest Europe as an example, ports of call under the jurisdiction of EU Member States include Piraeus, Rotterdam, Hamburg and Antwerp. According to the application scope of the regulation in the maritime industry (EUR-Lex, 2023), 50% of the emissions during the sailing stage from Singapore to Piraeus and Antwerp to Shanghai, 100% of the emissions during the sailing stage from Piraeus to Rotterdam, Rotterdam to Hamburg and Hamburg to Antwerp and 100% of the emissions in Piraeus, Rotterdam, Hamburg and Antwerp are included in the EU ETS.
Combining the above analysis with Figure 1, CO2 emissions from the sailing stage to be included in the EU ETS are 10982.404 tCO2, CO2 emissions from the in-port stage to be included in the EU ETS are 675.819 tCO2. According to the requirement of phase-in in the maritime industry (EUR-Lex, 2023), shipping companies shall be liable to surrender EUA costs for 40%, 70% and 100% of verified emissions reported in the previous year from 2025 to 2027. Therefore, from 2024 to 2026, CO2 emissions from the selected containership to be included in the EU ETS are 4663.289 tCO2, 8160.756 tCO2, 11658.224 tCO2, respectively, and its shipping company is required to surrender EUA cost for these CO2 emissions in the following year.
4.3 Cost accounting for liner shipping under the EU ETS
Under the EU ETS, the total cost of liner shipping mainly consists of fixed cost (including capital cost, crew wages, insurance premium, repair and maintenance cost, store and lube cost, administration cost, etc.), fuel cost (including fuel costs of main engine and auxiliary cost) and EUA cost. Using the cost accounting model proposed for liner shipping and the relevant data collated in Table 2, this section accounts for the total cost of liner shipping.
Referring to the past data, from January 2020 to January 2022, the price of emission allowances in the EU rose significantly from around 20€/ton to almost 100€/ton; from January 2022 to January 2023, it experienced sharp fluctuation; after that, it fluctuates up and down around 90€/ton (EMBER, 2023). It can be found that the EUA price varies considerably and generally follows an upward trend.
It is worth noting that the availability of shore power in EU ports has a significant impact on CO2 emissions to be included in the EU ETS and the corresponding EUA cost. Hence, this paper considers the availability of shore power in the ports of Piraeus, Rotterdam, Hamburg and Antwerp. According to a recent news released by the World Ports Organization (World Ports Organization, 2023), the port of Piraeus is building its first shore power connection slots for 2024. Judging from this, Piraeus does not currently provide shore power services. Referring to the official website of the port of Antwerp-Bruges, very few ports in Europe provide shore power installations for containerships at present (Port of Antwerp-Bruges, 2023). Together with the ports of Bremen, Hamburg, Haropa and Rotterdam, the port of Antwerp-Bruges is committed to providing shore power for containerships by 2028. It can be seen that the ports of Rotterdam, Hamburg and Antwerp are also currently not able to provide shore power to containerships.
Substituting the relevant data into the cost accounting model, in 2025, the fixed cost of the selected containership is 25983072 USD, the fuel cost of the selected containership is 3533077.897 USD, and the EUA cost of the selected containership is 462085.349 USD. Therefore, the total cost of the selected containership in 2025 is 29978235.25 USD.
4.4 Cost control in liner shipping under the EU ETS
Under the EU ETS, the EUA cost is incurred in the maritime industry, leading to an increase in the total cost of maritime transport. Faced with increased total costs, shipping companies will take action to control their cost.
This section explores the impact of the change in EUA price on the sailing speed of liner shipping using two fossil fuels, MGO and HFO. With the objective of controlling the total cost of liner shipping, when the EUA price changes by a certain percentage, the sailing speed can be adjusted according to Figure 4. The results suggest that within a certain range, reducing the sailing speed is favorable for liner companies to control the total cost. For the selected containership using MGO and HFO, the most economical sailing speed is 8.29 knots, corresponding to the increase in EUA price of 304.95% and 261.21%, respectively. However, when the EUA price rises beyond the above threshold, further reduction in sailing speed will not keep the total cost unchanged, and the total cost of liner shipping will continue to increase as the EUA price rises. Figure 4 presents that the reduction percent of sailing speed is much smaller than the increase percent of EUA price. This may be due to the fact that the EU ETS currently only covers EU-related emissions, and the fact that the selected containership calls at relatively few ports under the jurisdiction of EU member states. If more EU ports are chosen as ports of call for the liner routes and the EUA price rises to a high level, EU-related emissions will increase and corresponding EUA cost will increase. This will drive liner companies to proactively explore and implement effective measures to control CO2 emissions and total cost.

Figure 4 Impact of the change in EUA price on sailing speed of liner shipping using fossil fuels.
It needs to be emphasized that speed reduction may not always be cost-effective. It is suggested that shipping companies reduce speed within a certain range. Taking the selected containership as an example, speed reduction is cost-effective only when the sailing speed exceeds 8.29 knots. Once the sailing speed is reduced below this threshold, speed reduction will not only fail to control the total cost, but also increase it.
In addition to speed reduction, route planning is also an operational measure to control the total cost under the EU ETS. For the liner route used in this paper, the liner company could choose to call only at the port of Piraeus, instead of continuing the voyage to the ports of Rotterdam, Hamburg and Antwerp (ARA port-region). This strategy can help reduce fuel cost and EUA cost, hence control the total cost of liner shipping.
4.5 Sensitivity analysis
4.5.1 Impact of speed exponent on fuel consumption of the main engine
Determining the relationship between sailing speed and fuel consumption is very critical (Farkas et al., 2022). The so-called cubic law (Wang et al., 2015; Meng et al., 2016), that is, the fuel consumption of the main engine is a cubic function of sailing speed (Psaraftis and Kontovas, 2010; Fagerholt et al., 2015), is widely-believed and adopted in the maritime industry and maritime studies (Yan et al., 2020). Hower, Psaraftis and Kontovas (2013); Psaraftis and Kontovas (2014) pointed out the cubic law may not be reasonable for some ship types, large containerships being the most notably one. Based on the study of Wang and Meng (2012), speed exponent is selected as a variable to conduct a sensitivity analysis. Figure 5 shows the impact of speed exponent on fuel consumption of the main engine. It is obvious that when other variables are kept constant and sailing speed is less than design speed, the fuel consumption of the main engine of the selected containership decreases as the speed exponent increases.

Figure 5 Impact of speed exponent on fuel consumption of the main engine.
4.5.2 Impact of sailing speed on CO2 emissions from liner shipping
The impact of sailing speed on CO2 emissions and their proportions during the sailing and in-port stage is shown in Figures 6A, B. As the sailing speed decreases, CO2 emissions from the sailing stage decrease continuously, with a slight decrease in their proportion; while CO2 emissions from the in-port stage remain unchanged, with a slight increase in their proportion. Conversely, as the sailing speed increases, CO2 emissions from the sailing stage increase continuously, with a slight increase in their proportion; while CO2 emissions from the in-port stage remain unchanged, with a slight decrease in their proportion. It should be noted that as the fuel consumption of the auxiliary engine is not related to the sailing speed and only the auxiliary engine works during the in-port stage, CO2 emissions from the in-port stage are not related to the sailing speed.
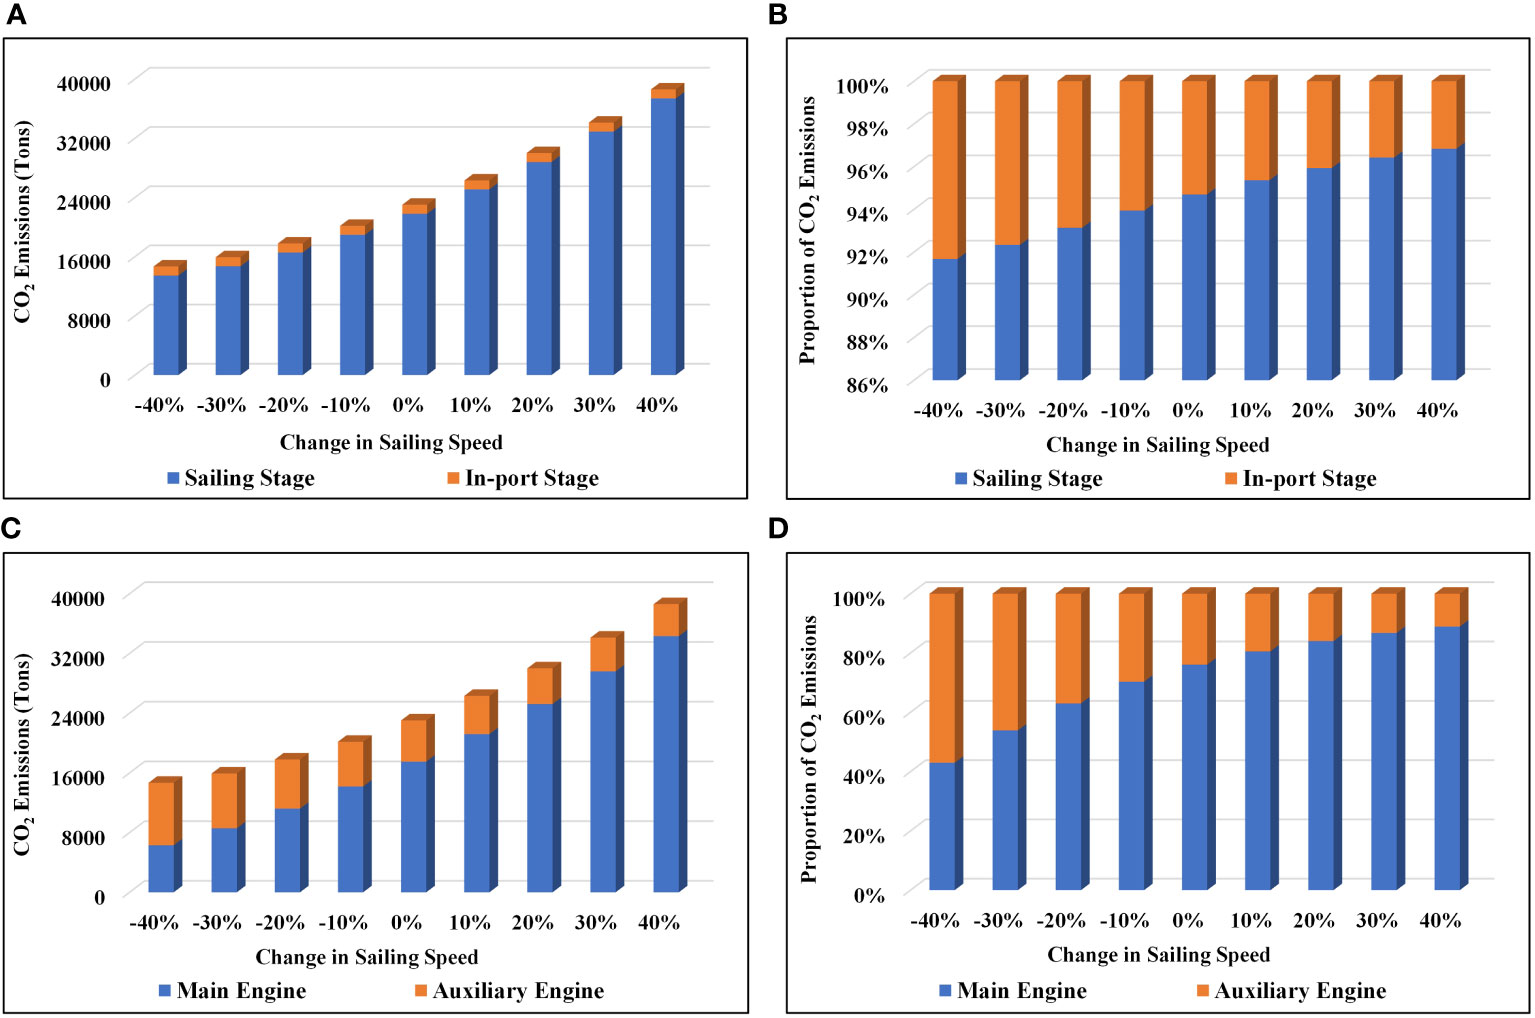
Figure 6 Impact of sailing speed on CO2 emissions from each stage of liner shipping and from each power equipment of ships. (A) Impact of sailing speed on CO2 emissions during the sailing and in-port stage. (B) Impact of sailing speed on the proportion of CO2 emissions during the sailing and in-port stage. (C) Impact of sailing speed on CO2 emissions from the main and auxiliary engine. (D) Impact of sailing speed on the proportion of CO2 emissions from the main and auxiliary engine.
Figures 6C, D presents the impact of sailing speed on CO2 emissions and their proportions from the main and auxiliary engine. As the sailing speed decreases, CO2 emissions from the main engine decrease, with a gradual decrease in their proportion; while CO2 emissions from the auxiliary engine increase, with a gradual increase in their proportion. Conversely, as the sailing speed increases, CO2 emissions from the main engine increase, with a gradual increase in their proportion; while CO2 emissions from the auxiliary engine decrease, with a gradual decrease in their proportion. Furthermore, when the sailing speed of the selected containership is less than 11.07 knots, CO2 emissions from the main engine are lower than those from the auxiliary engine; when the sailing speed is exactly 11.07 knots, CO2 emissions from both the main engine and the auxiliary engine are equal; when the sailing speed exceeds 11.07 knots, CO2 emissions from the main engine are higher than those from the auxiliary engine.
4.5.3 Impacts of sailing speed, fuel price and EUA price on the total cost of liner shipping
This section pays more attention to three major variables, namely sailing speed, fuel price and EUA price, to conduct a sensitivity analysis. It can be seen from Figure 7 that among these three factors, the total cost of the selected containership is more sensitive to the sailing speed, then the fuel price. The results indicate that within a certain range, speed reduction is the most cost-effective. It can significantly reduce the total cost of liner shipping. This is consistent with the conclusion proposed by Chang and Wang (2014).
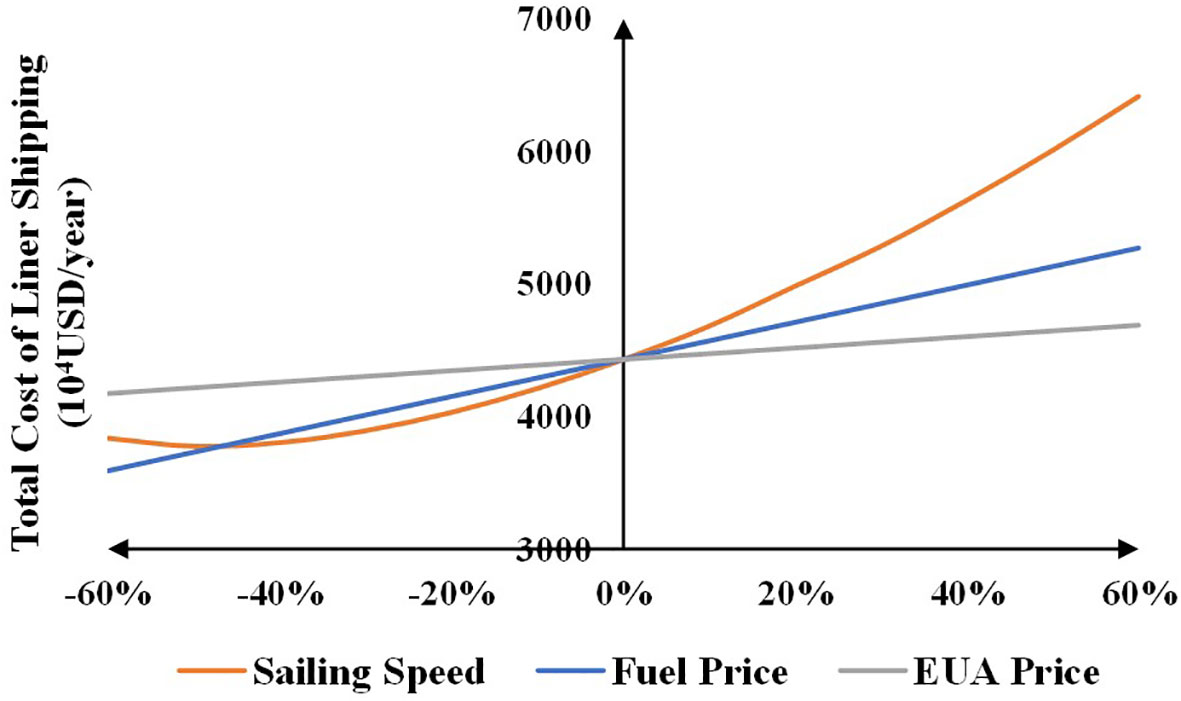
Figure 7 Impacts of sailing speed, fuel price and EUA price on the total cost of liner shipping.
Furthermore, there is an economic speed for minimizing the total cost of liner shipping. When only changing the sailing speed and reducing it to 8.29 knots, the total cost of the selected containership reaches its lowest point. However, further reduction in sailing speed beyond this point will result in an increase in the total cost instead of a decrease.
Under the EU ETS, carbon and cost accounting are essential for shipping companies to accurately calculate CO2 emissions and total costs of maritime transport, which are the basis and prerequisite for CO2 and cost control. They can help shipping companies to meet compliance requirements of the EU ETS, and achieve environmental and economic benefits.
5 Conclusion and limitations
As LCA emphasizes the importance of transport, this paper focuses on maritime transport, especially liner shipping. Faced with the inclusion of the maritime industry in the EU ETS, this paper conducts a carbon and cost accounting model for liner shipping. This model can help liner companies provide liner services to customers in an environmentally and cost-effective manner, as carbon and cost accounting is the basis for CO2 and cost control.
In order to illustrate the application of the model, a containership operating on the liner route from the Far East to Northwest Europe was used as the case study. The conclusions of this paper are as follows.
(1) The sailing stage is the key stage of CO2 emissions from liner shipping, accounting for 94.70% of CO2 emissions. The main engine is the main contributor to CO2 emissions from liner shipping, producing 76.06% of CO2 emissions.
(2) The order of CO2 emissions from liner shipping using four types of fuel is consistent with the order of carbon content of the fuel. CO2 emissions from liner shipping using MGO are the largest, while CO2 emissions from liner shipping using methanol are the smallest. Compared with MGO, the fossil fuel with the highest carbon content, CO2 control potentials of LNG and methanol are 14.22% and 57.11%. Compared with the most commonly used fossil fuel, HFO, CO2 control potentials of LNG and methanol are 11.69% and 55.84%. As an alternative fuel, methanol has better CO2 control potential for liner shipping than LNG.
(3) The relationship between sailing speed and CO2 emissions of liner shipping follows a U-shaped curve. Speed reduction may not always be environmentally-effective. There exists a sailing speed that minimizes CO2 emissions from liner shipping. When the sailing speed is reduced to 8.29 knots, CO2 emissions from liner shipping reach the minimum value. Speed reduction is an effective measure for CO2 control in liner shipping only when the sailing speed exceeds 8.29 knots. Once the sailing speed is reduced below this threshold, speed reduction is ineffective and CO2 emissions from liner shipping increase instead of decreasing.
(4) Speed reduction may not always be cost-effective. There exists an economic speed that minimizes the total cost of liner shipping. When only changing the sailing speed and reducing it to 8.29 knots, the total cost of liner shipping reaches its minimum value. Further reduction in sailing speed beyond this value will result in an increase in the total cost instead of a decrease. For the selected containership using MGO and HFO, the most economic speed is 8.29 knots, corresponding to the increase in EUA price of 304.95% and 261.21%, respectively. If the EUA price continues to rise, speed reduction becomes ineffective in controlling the total cost of liner shipping. Regarding the effective measures for liner companies under the EU ETS, the short-term option is speed reduction and the long-term option can be the use of alternative fuels.
This model can effectively solve the problems of excessive CO2 emissions and increased total cost of liner shipping and provide a reference for shipping companies under the EU ETS. It can also support the maritime industry in achieving the enhanced emission control ambition newly proposed by the IMO and help the EU to reach the climate objective as soon as possible.
There are some limitations in this paper. First, it may be somewhat simplified to divide maritime transport into two stages: the sailing stage and the in-port stage. Second, much of the data used in this paper comes from literature and websites, which might have lower quality than the official data from the IMO or the EU. Finally, for the sake of calculation, the sailing speed substituted into the carbon and cost accounting model is the average speed of the selected containership. Future studies can consider changing that.
Data availability statement
The original contributions presented in the study are included in the article/supplementary material. Further inquiries can be directed to the corresponding author.
Author contributions
LS: Conceptualization, Methodology, Writing – review & editing. XW: Investigation, Methodology, Writing – original draft. ZH: Formal analysis, Investigation, Writing – original draft. ZN: Resources, Supervision, Writing – review & editing.
Funding
The author(s) declare financial support was received for the research, authorship, and/or publication of this article. This research was funded by the National Key R&D Program of China, grant number 2022YFF0903403.
Conflict of interest
The authors declare that the research was conducted in the absence of any commercial or financial relationships that could be construed as a potential conflict of interest.
Publisher’s note
All claims expressed in this article are solely those of the authors and do not necessarily represent those of their affiliated organizations, or those of the publisher, the editors and the reviewers. Any product that may be evaluated in this article, or claim that may be made by its manufacturer, is not guaranteed or endorsed by the publisher.
References
Abreu H., Santos T. A., Cardoso V. (2023). Impact of external cost internalization on short sea shipping – The case of the Portugal-Northern Europe trade. Transport. Res. Part D: Transport Environ. 114, 103544. doi: 10.1016/j.trd.2022.103544
Adamowicz M. (2022). Decarbonisation of maritime transport – European Union measures as an inspiration for global solutions? Mar. Pol. 145, 105085. doi: 10.1016/j.marpol.2022.105085
Ammar N. R. (2019). An environmental and economic analysis of methanol fuel for a cellular container ship. Transport. Res. Part D: Transport Environ. 69, 66–76. doi: 10.1016/j.trd.2019.02.001
Ančić I., Perčić M., Vladimir N. (2020). Alternative power options to reduce carbon footprint of ro-ro passenger fleet: A case study of Croatia. J. Clean. Prod. 271, 122638. doi: 10.1016/j.jclepro.2020.122638
Aseel S., Al-Yafei H., Kucukvar M., Onat N. C., Turkay M., Kazancoglu Y., et al. (2021). A model for estimating the carbon footprint of maritime transportation of Liquefied Natural Gas under uncertainty. Sustain. Prod. Consum. 27, 1602–1613. doi: 10.1016/j.spc.2021.04.002
Bassam A. M., Phillips A. B., Turnock S. R., Wilson P. A. (2023). Artificial neural network based prediction of ship speed under operating conditions for operational optimization. Ocean Eng. 278, 114613. doi: 10.1016/j.oceaneng.2023.114613
Bilgili L. (2021a). Comparative assessment of alternative marine fuels in life cycle perspective. Renew. Sust. Energ. Rev. 144, 110985. doi: 10.1016/j.rser.2021.110985
Bilgili L. (2021b). Life cycle comparison of marine fuels for IMO 2020 Sulphur Cap. Sci. Total Environ. 774, 145719. doi: 10.1016/j.scitotenv.2021.145719
Bjerkan K. Y., Seter H. (2021). Policy and politics in energy transitions. A case study on shore power in Oslo. Energy Policy 153, 112259. doi: 10.1016/j.enpol.2021.112259
Bouman E. A., Lindstad E., Rialland A. I., Strømman A. H. (2017). State-of-the-art technologies, measures, and potential for reducing GHG emissions from shipping – A review. Transport. Res. Part D: Transport Environ. 52, 408–421. doi: 10.1016/j.trd.2017.03.022
Brynolf S., Magnusson M., Fridell E., Andersson K. (2014). Compliance possibilities for the future ECA regulations through the use of abatement technologies or change of fuels. Transport. Res. Part D: Transport Environ. 28, 6–18. doi: 10.1016/j.trd.2013.12.001
Cariou P., Cheaitou A. (2012). The effectiveness of a European speed limit versus an international bunker-levy to reduce CO2 emissions from container shipping. Transport. Res. Part D: Transport Environ. 17, 116–123. doi: 10.1016/j.trd.2011.10.003
Cariou P., Lindstad E., Jia H. (2021). The impact of an EU maritime emissions trading system on oil trades. Transport. Res. Part D: Transport Environ. 99, 102992. doi: 10.1016/j.trd.2021.102992
Chalaris I., Jeong B., Jang H. (2022). Application of parametric trend life cycle assessment for investigating the carbon footprint of ammonia as marine fuel. Int. J. Life Cycle Assess. 27, 1145–1163. doi: 10.1007/s11367-022-02091-4
Chang C.-C., Wang C.-M. (2014). Evaluating the effects of speed reduce for shipping costs and CO2 emission. Transport. Res. Part D: Transport Environ. 31, 110–115. doi: 10.1016/j.trd.2014.05.020
Christodoulou A., Cullinane K. (2023). The prospects for, and implications of, emissions trading in shipping. Marit. Econ. Logist. 25, 1–17. doi: 10.1057/s41278-023-00261-1
Christodoulou A., Dalaklis D., Olcer A., Masodzadeh P. G. (2021). Inclusion of shipping in the EU-ETS: assessing the direct costs for the maritime sector using the MRV data. Energies 14, 20. doi: 10.3390/en14133915
Clarksons (2023) Shipping Intelligence Network. Available at: https://www.clarksons.net/ (Accessed July 10, 2023).
Corbett J. J., Wang H., Winebrake J. J. (2009). The effectiveness and costs of speed reductions on emissions from international shipping. Transport. Res. Part D: Transport Environ. 14, 593–598. doi: 10.1016/j.trd.2009.08.005
Cullinane K., Khanna M. (1999). Economies of scale in large container ships. J. Transport Econ. Pol. 33, 185–207.
Daniel H., Trovão J. P. F., Williams D. (2022). Shore power as a first step toward shipping decarbonization and related policy impact on a dry bulk cargo carrier. eTransportation 11, 100150. doi: 10.1016/j.etran.2021.100150
Dettner F., Hilpert S. (2023). Modelling CO2 emissions and mitigation potential of Northern European shipping. Transport. Res. Part D: Transport Environ. 119, 103745. doi: 10.1016/j.trd.2023.103745
Dong J., Zeng J., Yang Y., Wang H. (2022). A review of law and policy on decarbonization of shipping. Front. Mar. Sci. 9. doi: 10.3389/fmars.2022.1076352
Doudnikoff M., Lacoste R. (2014). Effect of a speed reduction of containerships in response to higher energy costs in Sulphur Emission Control Areas. Transport. Res. Part D: Transport Environ. 28, 51–61. doi: 10.1016/j.trd.2014.03.002
Du Y. Q., Meng Q., Wang S. A., Kuang H. B. (2019). Two-phase optimal solutions for ship speed and trim optimization over a voyage using voyage report data. Transport. Res. Part B: Methodol. 122, 88–114. doi: 10.1016/j.trb.2019.02.004
Ejder E., Arslanoğlu Y. (2022). Evaluation of ammonia fueled engine for a bulk carrier in marine decarbonization pathways. J. Clean. Prod. 379, 134688. doi: 10.1016/j.jclepro.2022.134688
EMBER (2023) Carbon Price Tracker-The price of emissions allowances in the EU and UK. Available at: https://ember-climate.org/data/data-tools/carbon-price-viewer/ (Accessed July 29, 2023).
EUR-Lex (2015) Regulation (EU) 2015/757 of the European Parliament and of the Council of 29 April 2015 on the monitoring, reporting and verification of carbon dioxide emissions from maritime transport, and amending Directive 2009/16/EC (Text with EEA relevance). Available at: https://eur-lex.europa.eu/eli/reg/2015/757/oj (Accessed August 30, 2023).
EUR-Lex (2023) Directive (EU) 2023/959 of the European Parliament and of the Council of 10 May 2023 amending Directive 2003/87/EC establishing a system for greenhouse gas emission allowance trading within the Union and Decision (EU) 2015/1814 concerning the establishment and operation of a market stability reserve for the Union greenhouse gas emission trading system (Text with EEA relevance). Available at: https://eur-lex.europa.eu/eli/dir/2023/959 (Accessed August 30, 2023).
European Commission (2013) Maritime transport: first step to reduce emissions. Available at: https://ec.europa.eu/commission/presscorner/detail/en/IP_13_622 (Accessed June 21, 2023).
European Commission (2023a) EU Emissions Trading System (EU ETS). Available at: https://climate.ec.europa.eu/eu-action/eu-emissions-trading-system-eu-ets_en (Accessed June 6, 2023).
European Commission (2023b) Reducing emissions from the shipping sector. Available at: https://climate.ec.europa.eu/eu-action/transport-emissions/reducing-emissions-shipping-sector_en (Accessed September 9, 2023).
Fagerholt K., Gausel N. T., Rakke J. G., Psaraftis H. N. (2015). Maritime routing and speed optimization with emission control areas. Transport. Res. Part C: Emerg. Technol. 52, 57–73. doi: 10.1016/j.trc.2014.12.010
Fan L. X., Gu B. M., Luo M. F. (2020). A cost-benefit analysis of fuel-switching vs. hybrid scrubber installation: A container route through the Chinese SECA case. Transp. Policy. 99, 336–344. doi: 10.1016/j.tranpol.2020.09.008
Fan A. L., Xiong Y. Q., Yang L., Zhang H. Y., He Y. P. (2023). Carbon footprint model and low–carbon pathway of inland shipping based on micro–macro analysis. Energy 263, 126150. doi: 10.1016/j.energy.2022.126150
Fan A. L., Yang J., Yang L., Wu D., Vladimir N. (2022a). A review of ship fuel consumption models. Ocean Eng. 264, 112405. doi: 10.1016/j.oceaneng.2022.112405
Fan L. X., Zheng L., Luo M. F. (2022b). Effectiveness of port state control inspection using Bayesian network modelling. Marit. Policy Manage. 49, 261–278. doi: 10.1080/03088839.2020.1841913
Farkas A., Degiuli N., Martić I., Grlj C. G. (2022). Is slow steaming a viable option to meet the novel energy efficiency requirements for containerships? J. Clean. Prod. 374, 133915. doi: 10.1016/j.jclepro.2022.133915
Farkas A., Degiuli N., Martić I., Vujanović M. (2021). Greenhouse gas emissions reduction potential by using antifouling coatings in a maritime transport industry. J. Clean. Prod. 295, 126428. doi: 10.1016/j.jclepro.2021.126428
Finnveden G., Hauschild M. Z., Ekvall T., Guinée J., Heijungs R., Hellweg S., et al. (2009). Recent developments in life cycle assessment. J. Environ. Manage. 91, 1–21. doi: 10.1016/j.jenvman.2009.06.018
Freightower (2023) Ship positioning - ship dynamics, ship AIS, ship position. Available at: http://www.freightower.com/#/vessel?bd_vid=9187332254345295968 (Accessed July 10, 2023).
Goicoechea N., Abadie L. M. (2021). Optimal slow steaming speed for container ships under the EU emission trading system. Energies 14, 25. doi: 10.3390/en14227487
Gu Y. W., Wallace S. W., Wang X. (2019). Can an Emission Trading Scheme really reduce CO2 emissions in the short term? Evidence from a maritime fleet composition and deployment model. Transport. Res. Part D: Transport Environ. 74, 318–338. doi: 10.1016/j.trd.2019.08.009
Hermeling C., Klement J. H., Koesler S., Köhler J., Klement D. (2015). Sailing into a dilemma: An economic and legal analysis of an EU trading scheme for maritime emissions. Transport. Res. Part A: Policy Pract. 78, 34–53. doi: 10.1016/j.tra.2015.04.021
Hintermayer M. (2020). A carbon price floor in the reformed EU ETS: Design matters! Energy Policy 147, 111905. doi: 10.1016/j.enpol.2020.111905
IMO (2020) Fourth IMO Greenhouse Gas Study 2020. Available at: https://www.maritimeCyprus.com/wp-content/uploads/2021/03/4th-IMO-GHG-Study-2020.pdf (Accessed May 21, 2023).
IMO (2023) International Maritime Organization. Available at: https://www.imo.org/ (Accessed August 4, 2023).
Inal O. B., Zincir B., Deniz C. (2022). Investigation on the decarbonization of shipping: An approach to hydrogen and ammonia. Int. J. Hydrog. Energy. 47, 19888–19900. doi: 10.1016/j.ijhydene.2022.01.189
Jeong B., Wang H., Oguz E., Zhou P. (2018). An effective framework for life cycle and cost assessment for marine vessels aiming to select optimal propulsion systems. J. Clean. Prod. 187, 111–130. doi: 10.1016/j.jclepro.2018.03.184
Jiang L. P., Kronbak J., Christensen L. P. (2014). The costs and benefits of sulphur reduction measures: Sulphur scrubbers versus marine gas oil. Transport. Res. Part D: Transport Environ. 28, 19–27. doi: 10.1016/j.trd.2013.12.005
Judith V. L., Jason M. (2022). Decarbonisation of the shipping sector – Time to ban fossil fuels? Mar. Pol. 146, 105310. doi: 10.1016/j.marpol.2022.105310
Kim H., Yeo S., Lee J., Lee W.-J. (2023). Proposal and analysis for effective implementation of new measures to reduce the operational carbon intensity of ships. Ocean Eng. 280, 114827. doi: 10.1016/j.oceaneng.2023.114827
Kokosalakis G., Merika A., Merika X.-A. (2021). Environmental regulation on the energy-intensive container ship sector: A restraint or opportunity? Mar. Pol. 125, 104278. doi: 10.1016/j.marpol.2020.104278
Li R., Liu Y., Wang Q. (2022). Emissions in maritime transport: A decomposition analysis from the perspective of production-based and consumption-based emissions. Mar. Pol. 143, 105125. doi: 10.1016/j.marpol.2022.105125
Ling-Chin J., Roskilly A. P. (2016). Investigating a conventional and retrofit power plant on-board a Roll-on/Roll-off cargo ship from a sustainability perspective – A life cycle assessment case study. Energy Convers. Manage. 117, 305–318. doi: 10.1016/j.enconman.2016.03.032
Ma W. H., Ma D. F., Ma Y. J., Zhang J. F., Wang D. H. (2021). Green maritime: a routing and speed multi-objective optimization strategy. J. Clean. Prod. 305, 127179. doi: 10.1016/j.jclepro.2021.127179
Meng B., Chen S. Y., Haralambides H., Kuang H. B., Fan L. D. (2023). Information spillovers between CO2 emissions trading prices and shipping markets: A time-frequency analysis. Energy Econ. 120, 106604. doi: 10.1016/j.eneco.2023.106604
Meng Q., Du Y. Q., Wang Y. D. (2016). Shipping log data based container ship fuel efficiency modeling. Transport. Res. Part B: Methodol. 83, 207–229. doi: 10.1016/j.trb.2015.11.007
Mukherjee A., Bruijnincx P., Junginger M. (2023). Techno-economic competitiveness of renewable fuel alternatives in the marine sector. Renew. Sust. Energ. Rev. 174, 113127. doi: 10.1016/j.rser.2022.113127
Müller-Casseres E., Carvalho F., Nogueira T., Fonte C., Império M., Poggio M., et al. (2021). Production of alternative marine fuels in Brazil: An integrated assessment perspective. Energy 219, 119444. doi: 10.1016/j.energy.2020.119444
Perčić M., Vladimir N., Fan A. L. (2020). Life-cycle cost assessment of alternative marine fuels to reduce the carbon footprint in short-sea shipping: A case study of Croatia. Appl. Energy. 279, 115848. doi: 10.1016/j.apenergy.2020.115848
Perčić M., Vladimir N., Fan A. L. (2021). Techno-economic assessment of alternative marine fuels for inland shipping in Croatia. Renew. Sust. Energ. Rev. 148, 111363. doi: 10.1016/j.rser.2021.111363
Perčić M., Vladimir N., Jovanović I., Koričan M. (2022). Application of fuel cells with zero-carbon fuels in short-sea shipping. Appl. Energy 309, 118463. doi: 10.1016/j.apenergy.2021.118463
Port of Antwerp-Bruges (2023) Shore power, environmentally-friendly supply of electricity. Available at: https://www.portofantwerpbruges.com/en/our-port/climate-and-energy-transition/shore-power#Containerschepen (Accessed December 26, 2023).
Ports.com (2023) Sea route & distance - ports.com. Available at: http://ports.com/sea-route/ (Accessed July 10, 2023).
Psaraftis H. N., Kontovas C. A. (2010). Balancing the economic and environmental performance of maritime transportation. Transport. Res. Part D: Transport Environ. 15, 458–462. doi: 10.1016/j.trd.2010.05.001
Psaraftis H. N., Kontovas C. A. (2013). Speed models for energy-efficient maritime transportation: A taxonomy and survey. Transport. Res. Part C: Emerg. Technol. 26, 331–351. doi: 10.1016/j.trc.2012.09.012
Psaraftis H. N., Kontovas C. A. (2014). Ship speed optimization: Concepts, models and combined speed-routing scenarios. Transport. Res. Part C: Emerg. Technol. 44, 52–69. doi: 10.1016/j.trc.2014.03.001
Sea-Distances (2023) SEA-DISTANCES.ORG - Distances. Available at: https://sea-distances.org/ (Accessed July 10, 2023).
Shih Y.-C., Tzeng Y.-A., Cheng C.-W., Huang C.-H. (2023). Speed and fuel ratio optimization for a dual-fuel ship to minimize its CO2 emissions and cost. J. Mar. Sci. Eng. 11, 19. doi: 10.3390/jmse11040758
Sun L., Ding P. T., Xiong Y. X., Liu W., Hu Z. J. (2022a). CO2 emission reduction of shore power from power energy structure in China. Front. Mar. Sci. 9. doi: 10.3389/fmars.2022.1077289
Sun Y. L., Zheng J. F., Han J. X., Liu H. B., Zhao Z. H. (2022b). Allocation and reallocation of ship emission permits for liner shipping. Ocean Eng. 266, 112976. doi: 10.1016/j.oceaneng.2022.112976
Svindland M. (2018). The environmental effects of emission control area regulations on short sea shipping in Northern Europe: The case of container feeder vessels. Transport. Res. Part D: Transport Environ. 61, 423–430. doi: 10.1016/j.trd.2016.11.008
Tran N. K., Lam J. S. L. (2022a). CO2 emissions in a global container shipping network and policy implications. Marit. Econ. Logist. 24, 1–17. doi: 10.1057/s41278-022-00242-w
Tran N. K., Lam J. S. L. (2022b). Effects of container ship speed on CO2 emission, cargo lead time and supply chain costs. Res. Transp. Bus. Manage. 43, 100723. doi: 10.1016/j.rtbm.2021.100723
Trivyza N. L., Rentizelas A., Theotokatos G. (2019). Impact of carbon pricing on the cruise ship energy systems optimal configuration. Energy 175, 952–966. doi: 10.1016/j.energy.2019.03.139
Wada Y., Yamamura T., Hamada K., Wanaka S. (2021). Evaluation of GHG emission measures based on shipping and shipbuilding market forecasting. Sustainability 13, 22. doi: 10.3390/su13052760
Wan Z., El Makhloufi A., Chen Y., Tang J. Y. (2018). Decarbonizing the international shipping industry: Solutions and policy recommendations. Mar. pollut. Bull. 126, 428–435. doi: 10.1016/j.marpolbul.2017.11.064
Wang K., Fu X. W., Luo M. F. (2015). Modeling the impacts of alternative emission trading schemes on international shipping. Transport. Res. Part A: Policy Pract. 77, 35–49. doi: 10.1016/j.tra.2015.04.006
Wang H. Q., Liu Y., Li F., Wang S. A. (2023). Sustainable maritime transportation operations with emission trading. J. Mar. Sci. Eng. 11, 18. doi: 10.3390/jmse11091647
Wang S. A., Meng Q. (2012). Sailing speed optimization for container ships in a liner shipping network. Transport. Res. Part. E: Logist. Transp. Rev. 48, 701–714. doi: 10.1016/j.tre.2011.12.003
Wang C. X., Yu S. S., Xu L. (2022). Decisions on sailing frequency and ship type in liner shipping with the consideration of carbon dioxide emissions. Reg. Stud. Mar. Sci. 52, 102371. doi: 10.1016/j.rsma.2022.102371
Wang S. A., Zhen L., Psaraftis H. N., Yan R. (2021). Implications of the EU’s inclusion of maritime transport in the emissions trading system for shipping companies. Engineering 7, 554–557. doi: 10.1016/j.eng.2021.01.007
Watanabe M. D. B., Cherubini F., Tisserant A., Cavalett O. (2022). Drop-in and hydrogen-based biofuels for maritime transport: Country-based assessment of climate change impacts in Europe up to 2050. Energy Convers. Manage. 273, 116403. doi: 10.1016/j.enconman.2022.116403
World Ports Organization (2023) Port of Piraeus working on first shore power connection slots for 2024. Available at: https://www.worldports.org/port-of-piraeus-working-on-first-shore-power-connection-slots-for-2024/ (Accessed November 21, 2023).
Wu W.-M. (2020). The optimal speed in container shipping: Theory and empirical evidence. Transport. Res. Part. E: Logist. Transp. Rev. 136, 101903. doi: 10.1016/j.tre.2020.101903
Wu M., Li K. X., Xiao Y., Yuen K. F. (2022a). CO2 emission Trading Scheme in the shipping sector: Drivers, challenges, and impacts. Mar. Pol. 138, 104989. doi: 10.1016/j.marpol.2022.104989
Wu Y. Z., Wen K., Zou X. L. (2022b). Impacts of shipping carbon tax on dry bulk shipping costs and maritime trades-the case of China. J. Mar. Sci. Eng. 10, 16. doi: 10.3390/jmse10081105
Xiao G. N., Lu Q. W., Ni A. N., Zhang C. Y. (2023). Research on CO2 emissions of public bikes based on the life cycle theory. Transp. Lett. 15, 278–295. doi: 10.1080/19427867.2022.2123142
Yan X. P., He Y. P., Fan A. L. (2023). Carbon footprint prediction considering the evolution of alternative fuels and cargo: A case study of Yangtze river ships. Renew. Sust. Energ. Rev. 173, 113068. doi: 10.1016/j.rser.2022.113068
Yan R., Wang S. A., Du Y. Q. (2020). Development of a two-stage ship fuel consumption prediction and reduction model for a dry bulk ship. Transport. Res. Part. E: Logist. Transp. Rev. 138, 101930. doi: 10.1016/j.tre.2020.101930
Yu H. C., Fang Z. X., Fu X. J., Liu J. X., Chen J. H. (2021). Literature review on emission control-based ship voyage optimization. Transport. Res. Part D: Transport Environ. 93, 102768. doi: 10.1016/j.trd.2021.102768
Zeng S. H., Jia J. M., Su B., Jiang C. X., Zeng G. W. (2021). The volatility spillover effect of the European Union (EU) carbon financial market. J. Clean. Prod. 282, 124394. doi: 10.1016/j.jclepro.2020.124394
Zheng J. F., Ma Y. Q., Ji X., Chen J. H. (2021). Is the weekly service frequency constraint tight when optimizing ship speeds and fleet size for a liner shipping service? Ocean Coast. Manage. 212, 105815. doi: 10.1016/j.ocecoaman.2021.105815
Zhu M., Shen S. W., Shi W. M. (2023). CO2 emission allowance allocation based on a bi-level multi-objective model in maritime shipping. Ocean Coast. Manage. 241, 106665. doi: 10.1016/j.ocecoaman.2023.106665
Zhu M., Yuen K. F., Ge J. W., Li K. X. (2018). Impact of maritime emissions trading system on fleet deployment and mitigation of CO2 emission. Transport. Res. Part D: Transport Environ. 62, 474–488. doi: 10.1016/j.trd.2018.03.016
Zis T. P. V. (2019). Prospects of cold ironing as an emissions reduction option. Transport. Res. Part A: Policy Pract. 119, 82–95. doi: 10.1016/j.tra.2018.11.003
Zis T. P. V., Psaraftis H. N., Tillig F., Ringsberg J. W. (2020). Decarbonizing maritime transport: A Ro-Pax case study. Res. Transp. Bus. Manage. 37, 100565. doi: 10.1016/j.rtbm.2020.100565
Keywords: CO2 emissions, European Union Emission Trading System (EU ETS), liner shipping, sailing speed, fuel
Citation: Sun L, Wang X, Hu Z and Ning Z (2024) Carbon and cost accounting for liner shipping under the European Union Emission Trading System. Front. Mar. Sci. 11:1291968. doi: 10.3389/fmars.2024.1291968
Received: 10 September 2023; Accepted: 10 January 2024;
Published: 08 February 2024.
Edited by:
Wei-Bo Chen, National Science and Technology Center for Disaster Reduction(NCDR), TaiwanReviewed by:
Nikola Vladimir, University of Zegreb, CroatiaOrestis Schinas, University of the Aegean, Greece
Copyright © 2024 Sun, Wang, Hu and Ning. This is an open-access article distributed under the terms of the Creative Commons Attribution License (CC BY). The use, distribution or reproduction in other forums is permitted, provided the original author(s) and the copyright owner(s) are credited and that the original publication in this journal is cited, in accordance with accepted academic practice. No use, distribution or reproduction is permitted which does not comply with these terms.
*Correspondence: Zijiang Hu, emlqaWFuZ19odUBmdWRhbi5lZHUuY24=