 Theethach Phiranram
 Piyaphong Chenrai
 Akkaneewut Jirapinyakul
 Narongsak Rachukarn1
- 1M.Sc. Program in Energy Geoscience, Faculty of Science, Chulalongkorn University, Bangkok, Thailand
- 2Applied Mineral and Petrology Research Unit (AMP RU), Department of Geology, Faculty of Science, Chulalongkorn University, Bangkok, Thailand
Peatlands, as an important carbon sink, store a large amount of atmospheric carbon that is vulnerable to becoming a carbon emission source due to the disturbance of the peat layer by natural and anthropogenic processes. The Kuan Kreng peat swamp forest is the second largest peatland in Thailand and is in coastal wetland serving for carbon stock in the subsurface. To assess carbon stock in peatland, the thickness and distribution of the peat layer are necessary. This study determines physical and chemical characteristics of the peatlands in the coastal wetland, southern Thailand by conventional core study and geophysical surveys, including ground penetrating radar (GPR) and electrical resistivity imaging (ERI). There is a significant relationship between chemical and physical properties from the peat layer, which is useful to approximately predict the physical properties and peat layers in the geophysical profiles. The resistivity profiles exhibit high resistivity response, peat between 21.9 and 145.0 ohm-m, interpreted as the peat layers in the shallow subsurface. The high resolution GPR profiles provide an average GPR velocity in peat of 0.040 m/ns and a relative dielectric constant of 54.9 for the peat layers. The peat layer is characterized by a high amplitude of reflection in the GPR profiles. The thickness of the peat layers was estimated from the geophysical surveys and the drilling cores having an average thickness of 18 cm. Average values of bulk density (0.19 g/cm3) and TOC (31.18 wt. %) from the drilling core samples are used to calculate the carbon density in the peat layers giving a result of 59.24 Kg C/m3. Hence, the carbon stock at the Kuan Kreng peat swamp forest is estimated at least 7.53 megaton carbon, which is much higher than aboveground biomass carbon in this area. The innumerably high amount of carbon stock could raise awareness of peatland disturbances.
1 Introduction
Peatlands, also known as bogs, fens, and mires, especially peat swamp forests in tropical regions, are wetland ecosystems where peat layers are present due to the anoxic condition (Glaser, 1987; Yu, 2012; Rich, 2015; Ribeiro et al., 2021). Globally, peatlands cover approximately 3% of the land surface and are found in a variety of climates and regions around the world (Harenda et al., 2018; Hapsari et al., 2022; Omar et al., 2022). Although peatlands cover relatively small area of the land surface, they are considered as the largest terrestrial organic carbon sinks (Uda et al., 2020). Peatlands can store a large amount of carbon in the soil, making it an important sink for atmospheric carbon dioxide and playing a major role in the global carbon cycle (Whittle and Gallego-Sala, 2016; Beaulne et al., 2021). The stored carbon in peat layers can be released into atmosphere acting as a major source of greenhouse gas emissions due to both natural and anthropogenic processes such as peat moisture decrease, soil erosion, wildfire, lowering of the water table, agriculture and human settlement (e.g., Whittle and Gallego-Sala, 2016; Harenda et al., 2018; Miller et al., 2022). Since the global carbon storage in peatlands is very high, the greenhouse gas emission issues of peatlands are crucial. Moreover, the carbon accumulation rate per unit area is believed to be 30–50 times greater in coastal wetlands than in forest ecosystems, underscoring their significance in the context of the global carbon cycle and storage (Ouyang and Lee, 2013; Byun et al., 2019). Hence, the estimation of stored carbon in peatlands and coastal wetlands is necessary to emphasize and raise the awareness of massive greenhouse gas emission.
Around 10% of the world’s total peatlands are estimated to be in Southeast Asia, including Indonesia, Malaysia, the Philippines, and Thailand (Page and Rieley, 1998; Omar et al., 2022; Terzano et al., 2022). These peatlands are often referred to as a tropical peatland and are ecologically significant due to their biodiversity and carbon storage potential (Iiyama and Osawa, 2010; Yu et al., 2010; Filqisthi and Kaswanto, 2017; Cobb et al., 2020). The Southeast Asian peatlands were mostly ombrogenous and occurred primarily at the coastal lowlands since the last glacial period (Omar et al., 2022; Page et al., 2006). The Kuan Kreng peat swamp forest covers an area of 706.15 km2 m in Southern Thailand and is the Thailand’s second-largest peatland, with peat up to a depth of about 1.3 m and down to 2.1–3.2 (Chabangborn et al., 2020; Nuthammachot and Stratoulias, 2021; Omar et al., 2022). This area has encountered agricultural degradation, such as palm plantations, and particularly repeated forest fires and is dominated by sand, silt and clay, containing pyrite, evaporites and organic mud (Iiyama and Osawa, 2010; Khampeera et al., 2021; Omar et al., 2022). Despite being the second largest, Kuan Kreng peat swamp forest is more susceptible to carbon loss due to frequent forest fires. The selected study sites are part of the Kuan Kreng peat swamp forest in lowland coastal wetlands and have been influenced with a variety of environments (coastal, deltaic, and tidal) along the coastlines. These coastal wetlands have been experienced with various geological conditions and processes, thus geological, physical, and chemical properties are different from place to place (e.g., Rotherham, 2020). Due to the severity of the degradation of the Kuan Kreng swamp forest, the estimation of the stored carbon is necessary to emphasize the impact on greenhouse gas emissions. However, stored carbon estimation in peatlands is tentative due to their large-scale geometric uncertainties, especially without complete coring and logging data (Harenda et al., 2018). Moreover, peatland information such as peat-forming plants, age of peat, peat thickness, physical and chemical properties in Thailand have not been systematically reported.
Geophysical survey, especially ground penetrating radar (GPR), has been used to study the peat layer’s configurations, such as thickness, distribution and depth, for engineering manipulation and estimation of impact on total carbon emission (e.g., Jol and Smith, 1995; Comas et al., 2015; Comas et al., 2017; Pezdir et al., 2021). Electrical resistivity imaging (ERI) as a tool for investigating peat layers also provides valuable information about subsurface morphology and sediment layers overlain by peat layers (e.g., Comas et al., 2017; Trappe and Kneisel, 2019; Pezdir et al., 2021).
In this study, a combination of ERI and GPR surveys was proposed to obtain subsurface images and geophysical properties of the peat layers in the Kuan Kreng peat swamp forest. Several studies show the beneficial uses of integrating GPR and ERI to investigate peatlands (e.g., Slater and Reeve, 2002; Trappe and Kneisel, 2019). Drilling core samples were used to analyze the geological, chemical and physical characteristics of the peat layers including lithology, major element composition from X-ray fluorescence (XRF), bulk density and total organic carbon (TOC). Despite visual classification from the core samples, chemical and physical properties, which have been addressed in this study, are used to classify the peat layer and other layers. Moreover, the TOC content of peat contributes to carbon stock estimation. Thus, the objective of this study is to characterize geological, geophysical, chemical and physical characteristics properties of the peatland in coastal wetland and to estimate carbon stock in the peat layers. The geochemical and geophysical properties of the peat layers in this study can be useful for detection and estimation of carbon storage in other subsurface peatlands.
2 Geological background
The study sites are located in the Kuan Kreng peat swamp forest area north of the Thale Noi Lake in Phatthalung Province, Southern Thailand which is bounded to the east by the Gulf of Thailand (Figure 1A). These study sites are mainly lowland alluvial plain and coastal wetland, with an altitude of 0 - 2 m above mean sea level. There are several limestone and clastic sedimentary rock hills bounding the peat swamp forest and in the middle of the peat swamp forest (Figure 1B; Dheeradilok, 1986; Komolkongyo, 2018). Several dendritic drainage rivers transect the sites in east-west direction, which can be clearly observed from satellite images. The area of 320 square kilometers in the peat swamp forest was in a wildlife sanctuary and national forest reserve, while the excluded area has been used for agricultural purposes (Komolkongyo, 2018). The peat layer was drained during the drought season due to evaporation, high water demand from agricultural purposes, and annual forest fires (Meunpong et al., 2020).
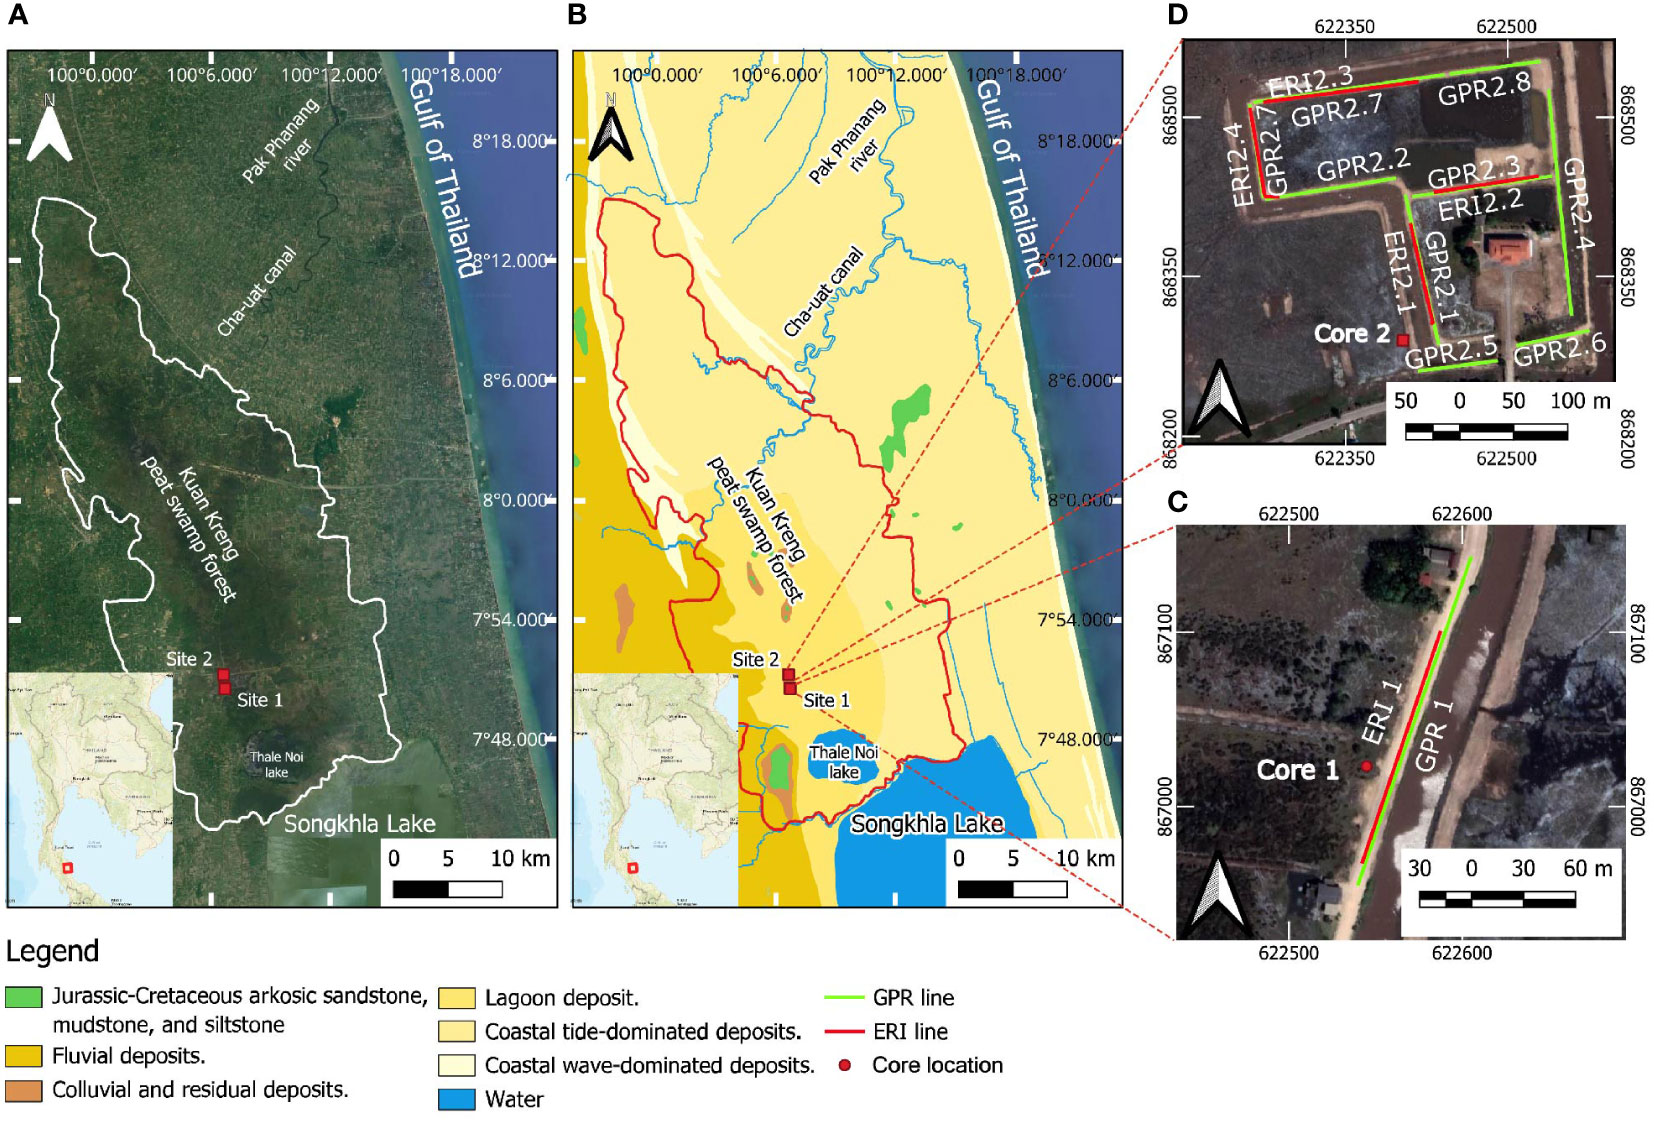
Figure 1 (A) Satellite image of the Kuan Kreng peat swamp forest in Nakhon Si Thammarat Province, Southern Thailand. (B) Geological map of the Kuan Kreng peat swamp forest. (C) study site 1 and (D) study site 2 with geophysical survey lines located in a lagoon deposit.
The sediment profile in the study sites is based on the sedimentary cores obtained from the Thale Noi. The lowermost layer was a stiff, light gray clay, correlated to a tidal flat environment, deposited by a sea-level rise before c. 8300 cal a BP (Wangritthikraikul et al., 2020; Sainakum et al., 2021). The stiff clay was overlaid by dark grey clay, which back mangrove pollen taxa generally found in this layer suggested a landward environmental shift owing to sea level fall at 8300-8100 cal a BP (Chabangborn et al., 2020). The sediments gradually transferred to peat layer, which was abundant in the mangrove pollen taxa, indicating the mangrove swamp forest at the Thale Noi at 8100-7950 cal a BP (Chabangborn et al., 2020). A geological hiatus presented at the top of the peat layer before a replacement of dark grey clay with detrital organic matter accompanied by abundant mangrove pollen taxa. These all together pointed to the reoccurring of mangrove swamp forests at 7600-7100 cal a BP (Chabangborn et al., 2020). The sea level was likely stable during this interval and started to fluctuate after 7100 cal a BP, especially a sea-level highstand during the mid-Holocene. The uppermost layer was gyttja, which was prevailing non-mangrove pollen taxa, suggesting an eventually occupation of the freshwater swamp during the modern period (Chabangborn et al., 2020).
3 Materials and methods
3.1 Chemical and physical properties
Sediment cores were collected at each site presented in Figures 1C, D from the Kuan Kreng peat swamp forest using a Russian corer (7.5 cm diameter, 1 m length). Two study sites were chosen to represent the regional orientation of peat layer and to compare geochemical and physical properties of peat layer between different sample sites. The collected core samples were immediately wrapped in plastic to prevent the loss of humidity. The core samples were examined from a subsample at every 1-cm interval for lithological and chemical analyses including XRF, TOC and bulk density. These analyses were carried out throughout the core samples in order to compare peat properties that could be related to geophysical responses. The core samples were analyzed for major elements using a handheld Olympus Vanta XRF analyzer, which is a rapid and non-destructive tool.
In order to estimate the carbon stock in the peat layer, TOC and bulk density data of the peat layer are needed for this study. The subsamples in every 5 cm were oven dried at 80°C for 12 hours until constant weights were achieved, then pulverized. The dried weight of the subsamples was measured to calculate the bulk density. The total organic carbon content was conducted using a SHIMADZU TOC analyzer at Chulalongkorn university, Thailand. The TOC content was reported in weight percent of organic carbon (wt. %). Based on Comas et al. (2015) and Warren et al. (2017), the carbon storage (Kg C) can be estimated from bulk density and TOC data by using an equation below;
Where Cpeat is carbon storage (Kg C), V is peat volume, and Cd is peat carbon density (Kg C/m3) acquired by multiplying the peat bulk density (Kg/m3) and carbon content (% C).
3.2 Electrical resistivity
Electrical resistivity surveys are widely used in various fields such as engineering, hydrology, archeology and mineral exploration (Loke et al., 2013). Electrical resistivity responses within the subsurface can be influenced by water content, chemical composition of the pore water, soil surface area and grain particle size distribution (Binley and Slater, 2020). Peat layer was reported to be relatively higher electrical resistivity compared to surrounding layers due to high organic content and low cation exchange capacity (Basri et al., 2019). The resistivity was measured by providing controlled electrical current into the ground and measuring the voltage differences between probes, resulting in a resistivity profile of the subsurface (Loke et al., 2020). The apparent resistivity is derived from the conversion of electrical current and measured voltage differences, which is not simply related to the true resistivity of the subsurface due to the complexity of lithology and structure (Lowrie, 2007).
Various probe configurations affect the resolution, the depth of measurement, and the calculation of apparent resistivity (Reynolds, 2011). Commonly, there are three configurations that have been widely used in electrical resistivity survey, including the Wenner, Schlumberger, and double-dipole arrangements (Lowrie, 2007). The double-dipole array is very sensitive to lateral variation and has relatively high resolution in shallow sections (Okpoli, 2013).
A Geomative GD-10 with 48 electrodes was used in this study. In this study, the double-dipole array configuration with 2-meters of electrode spacing was used to achieve the desired investigation depth. The data was collected using the roll-along technique to extend the survey length. The survey lines were conducted along the GPR survey at both core sites. The collected data were exterminated bad data point prior to the image processing, which carried out by RES2DINV software (Loke, 2010). Resistivity profiles were generated using smoothness-constrained Gauss-Newton least square method with a 0.5 vertical to horizontal flatness ratio that emphasizes the horizontal features of the subsurface layer. Inversion and geological models were constrained by the layer boundaries in the core data.
3.3 Ground penetrating radar
Ground penetrating radar survey is a rapid and reliable method for non-destructive mapping of the subsurface at shallow level and has been used in various fields due to the potentially extremely high resolution up to centimeter scale (Robinson et al., 2013). This survey emits short pulses of high frequency electromagnetic energy from the transmitter antenna into the ground and detects the reflected wave from the geological layers or focused utilities structures by the receiver antenna in the time domain. The differences in the dielectric properties of materials caused the reflection of electromagnetic wave (Lowrie, 2007). GPR survey were used in several studies to clearly delineate peat layers in order to plan oil pipeline construction (Jol and Smith, 1995), comprehend water pathway (Trappe and Kneisel, 2019) and estimate carbon stock (Comas et al., 2015; Comas et al., 2017).
Although GPR is not the ideal tool for peat swamp forests due to a waterlogged condition that causes difficulty in accessibility and attenuates electromagnetic waves rapidly, changes in water content, bulk density, and other properties between the peat and adjacent layers can provide strong reflections (e.g., Lowry et al., 2009; Sass et al., 2010; Pezdir et al., 2021). In this study, a multi-channel GPR system, GSSI SIR-20, was used for GPR profiling with 400 MHz antennas with an expected vertical resolution and investigation depth of 18 cm and 2.5 m, respectively, by using velocity at 0.3 m/ns. DC shift removal and dewow were automatically applied to the data by the GSSI RADAN software. The following processes were applied to each profile, respectively: time zero correction, stacking (5 scans or 1 meter), background removal (250 scans or 5 meters), and FIR bandpass filtering (low pass 600 MHz, high pass 200 MHz), in order to enhance the signal-to-noise ratio and emphasize the peat layer. Finally, the data were migrated with average velocity and corrected gain. Time-depth conversion was applied to the data using the actual depth of layer boundaries from the core data. Since the peat layer was distinguished by the slow and high amplitude of reflection, the instantaneous magnitude of the GPR profile was advocating the interpretation by conducting Hilbert transformation on the data.
4 Results
4.1 Litholostratigraphy
A lithological study was observed from the drilling cores to identify peat layers that composed mainly detrital organic matter. The drilling core 1 at site 1 has a total core depth of 168 cm collected along roadside with a water level of 30 cm (Figure 1). The road was filled with dry sands having a thickness of 140 cm. The top layer from the core 1 was classified as unit A comprising of a yellowish to olive brown clay with a thickness of 10 cm (Figure 2A). This unit was significantly bioturbated by plant roots and contained plant fragments. Unit B characterized by moderately firm and plastic dark gray clay with low detrital organic materials (Figure 2A). Between the depths of 56 and 61 cm beneath the water’s surface, unit C was identified as a layer of very dark gray clay (Figure 2A). In addition, this clay unit contained a moderate amount of detrital organic matter and becomes looser with greater depth, displaying reduced plasticity (Figure 2A). The unit C was gradually changed into unit D, which was characterized by black, friable and low plasticity layer with high detrital organic matter. The unit D was classified as peat layer having a thickness of 13 cm (Figure 2A). Then, the units C and B were appeared again at the depth below the unit D (Figure 2A). The unit D, peat layer, was observed again at the depth of 100 cm. Unit E was characterized by light gray clay with high plasticity and was a very stiff and firm layer (Figure 2A). This unit started at 124 cm below the water’s surface. The high stiffness of this layer is preventing the core penetration, so the core 1 terminates at 1.38 m below the water surface. Due to the high stiffness of this layer, core penetration is impeded, leading to a total depth of 138 cm beneath the water surface for coring at site 1 (Figures 1 and 2A).
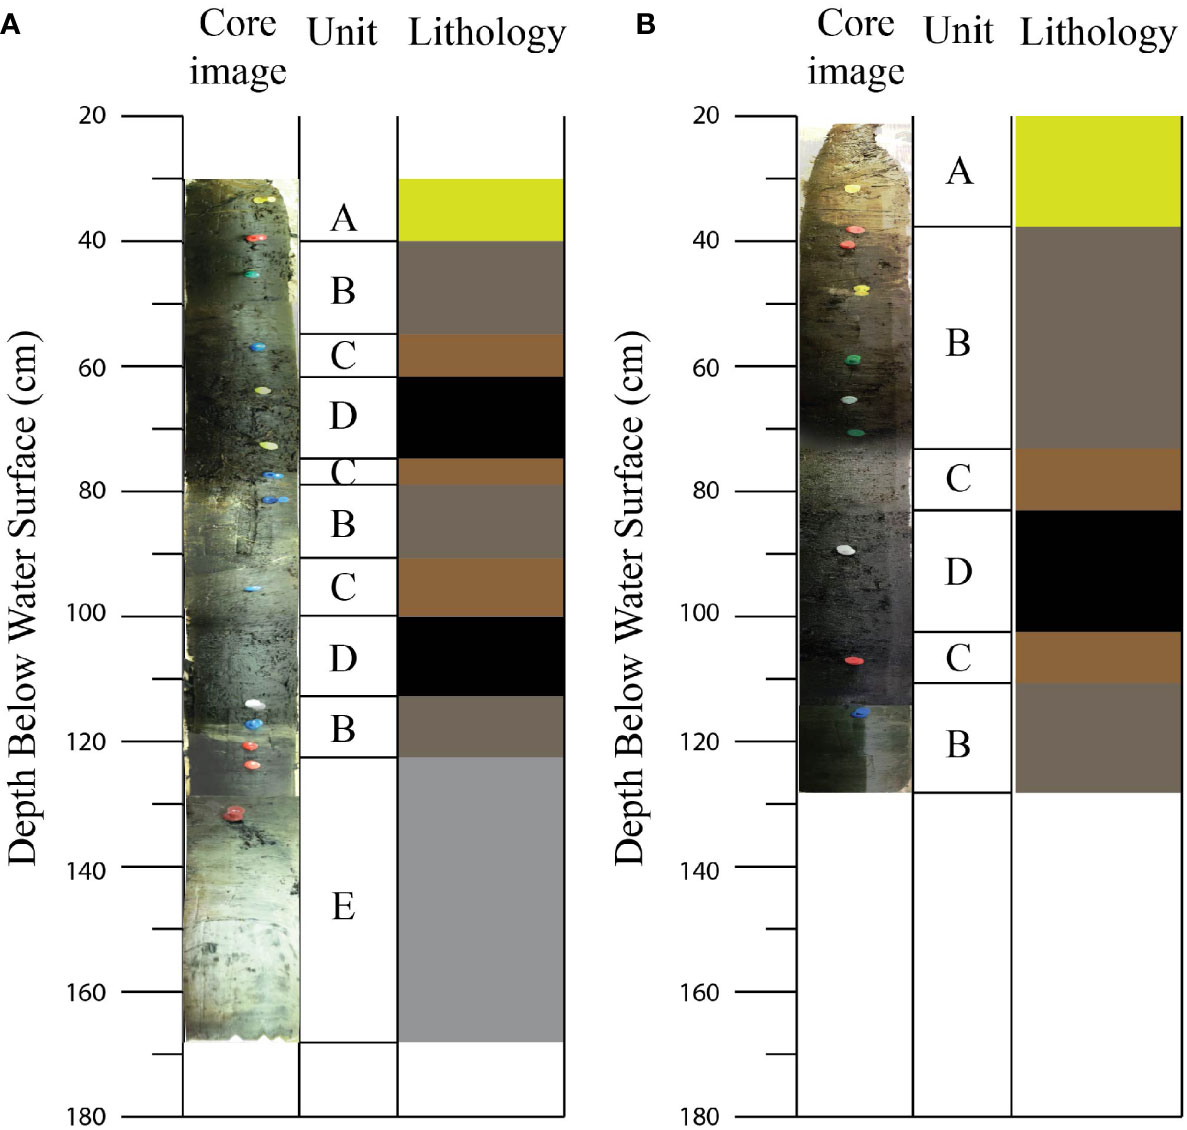
Figure 2 Lithostratigraphy from drilling core 1 (A) and core 2 (B) at study sites with lithological units. Lithological unit descriptions are summarized in Table 1.
Site 2 is located within an open-wide area, approximately 1.3 km north of site 1 (Figure 1). The drilling core 2 was collected at a water level of 20 cm and has a total core depth of 124 cm (Figure 2B). The core comprised six layers with four lithological units from top to bottom of the core as follows: units A, B, C, D, C and B, respectively (Figure 2B). The lithological units used in this core were based on the lithological descriptions at site 1 (Table 1). The peat thickness at this location was 21 cm (Figure 2B).
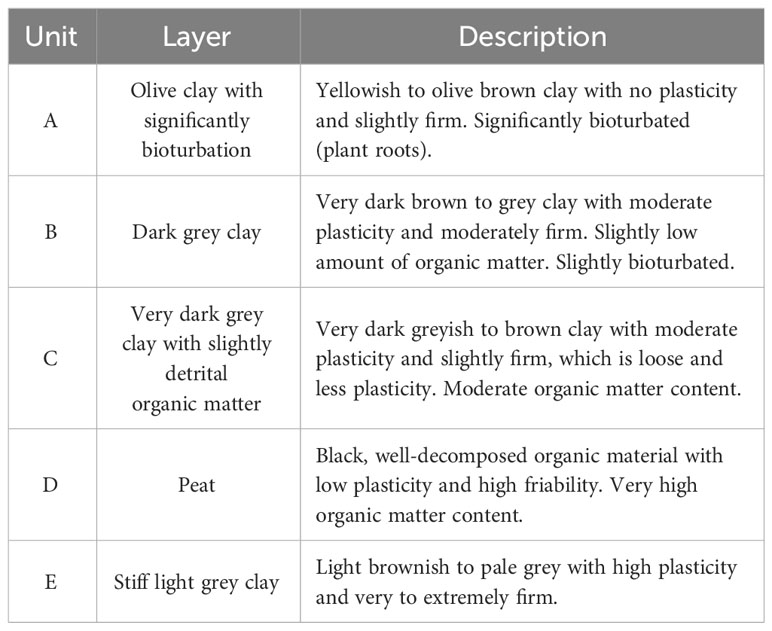
Table 1 Summary of lithological units from drilling cores with descriptions for each unit.
4.2 Major element geochemistry
The XRF scanning data were presented as percentage per unit area for Al, Si, and Fe contents. These three major elements were considered to represent the presence of clay mineral, clastic sediment, and pyrite, which are abundance in coastal wetland environment. Significant variations can be observed in the selected major element contents in both core samples (Figure 3). These selected elements were consistent with the lithology boundaries from the cores (Figure 3). Based on both core samples, the peat layers, unit D, had the relative lowest Si content ranging from 0.50 to 5.58% with an average of 1.48%. The Al and Fe contents of the peat layers also showed the relative lowest values with average values of 0.49% and 0.29%, respectively. The units B and C were characterized by relative moderate contents of Al, Si, and Fe. While, the unit E is characterized by the relatively highest contents of Al, Si, and Fe.
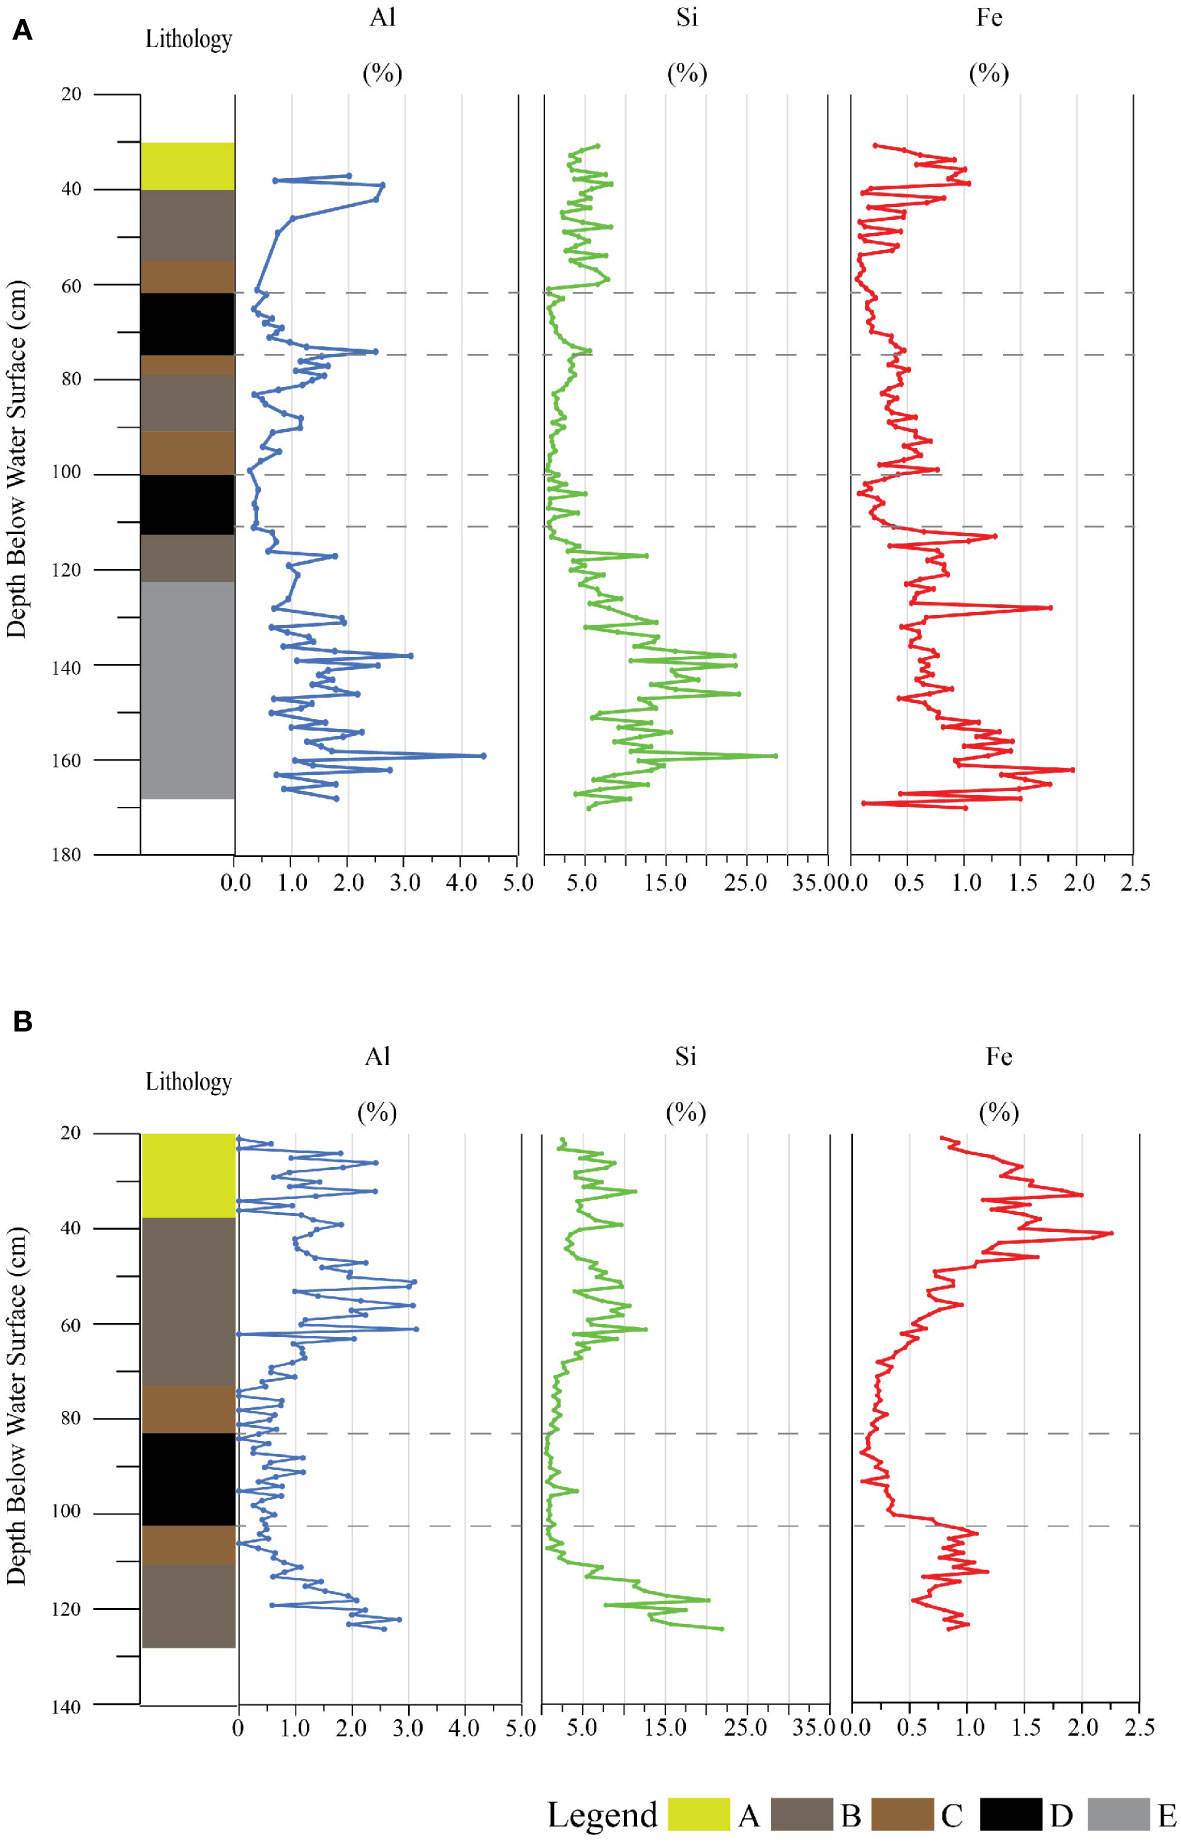
Figure 3 Major element (Al, Si, and Fe) profiles along drilling core 1 (A) and core 2 (B). The dashed lines represent peat layers. Lithological unit descriptions are summarized in Table 1.
4.3 Organic carbon richness
TOC analysis was carried out to achieve the information on the quantity of organic carbon richness from the core samples for further use in carbon stock estimation. The high values of the TOC contents were observed from the peat layers from both core sites ranging from 23.03 wt. % to 40.99 wt. % with an average of 31.17 wt. %. Similar to XRF scanning and lithological data, the adjacent units B and C exhibited moderate average TOC contents of 11.23 wt. % and 22.94 wt. %, respectively. These two units showed an increase TOC content toward the peat layers, and thus they were a transition zone for the peat layers. Whilst, the units A and E showed low average TOC contents of 6.14 wt. % and 0.63 wt. %, respectively.
4.5 Geophysical characteristics
4.5.1 Bulk density
The bulk density from the core samples ranged from 0.13 to 1.88 g/cm3, with an average of 0.63 g/cm3. The peat layer, unit D, had the lowest bulk density of 0.19 g/cm3 average, while the unit E had the highest average bulk density of 1.54 g/cm3 (Table 2). The units A, B, and C exhibited average bulk densities of 0.49, 0.46, and 0.44 g/cm3, respectively. The bulk density of the peat layers showed a good relationship with the TOC contents that the peat layer in this area corresponded to low bulk density and high TOC sediments (Figure 4). The contrast in bulk density and TOC allowed us to identify the peat layer in the subsurface by using geophysical surveys.
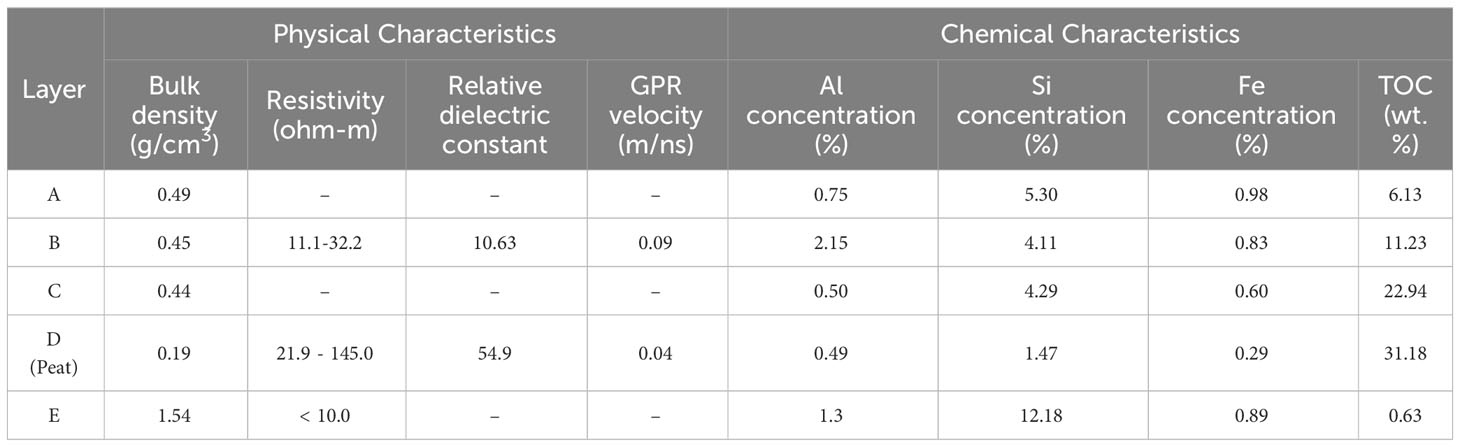
Table 2 Summary of geophysical and chemical characteristics of the Kuan Kreng Peat swamp forest.
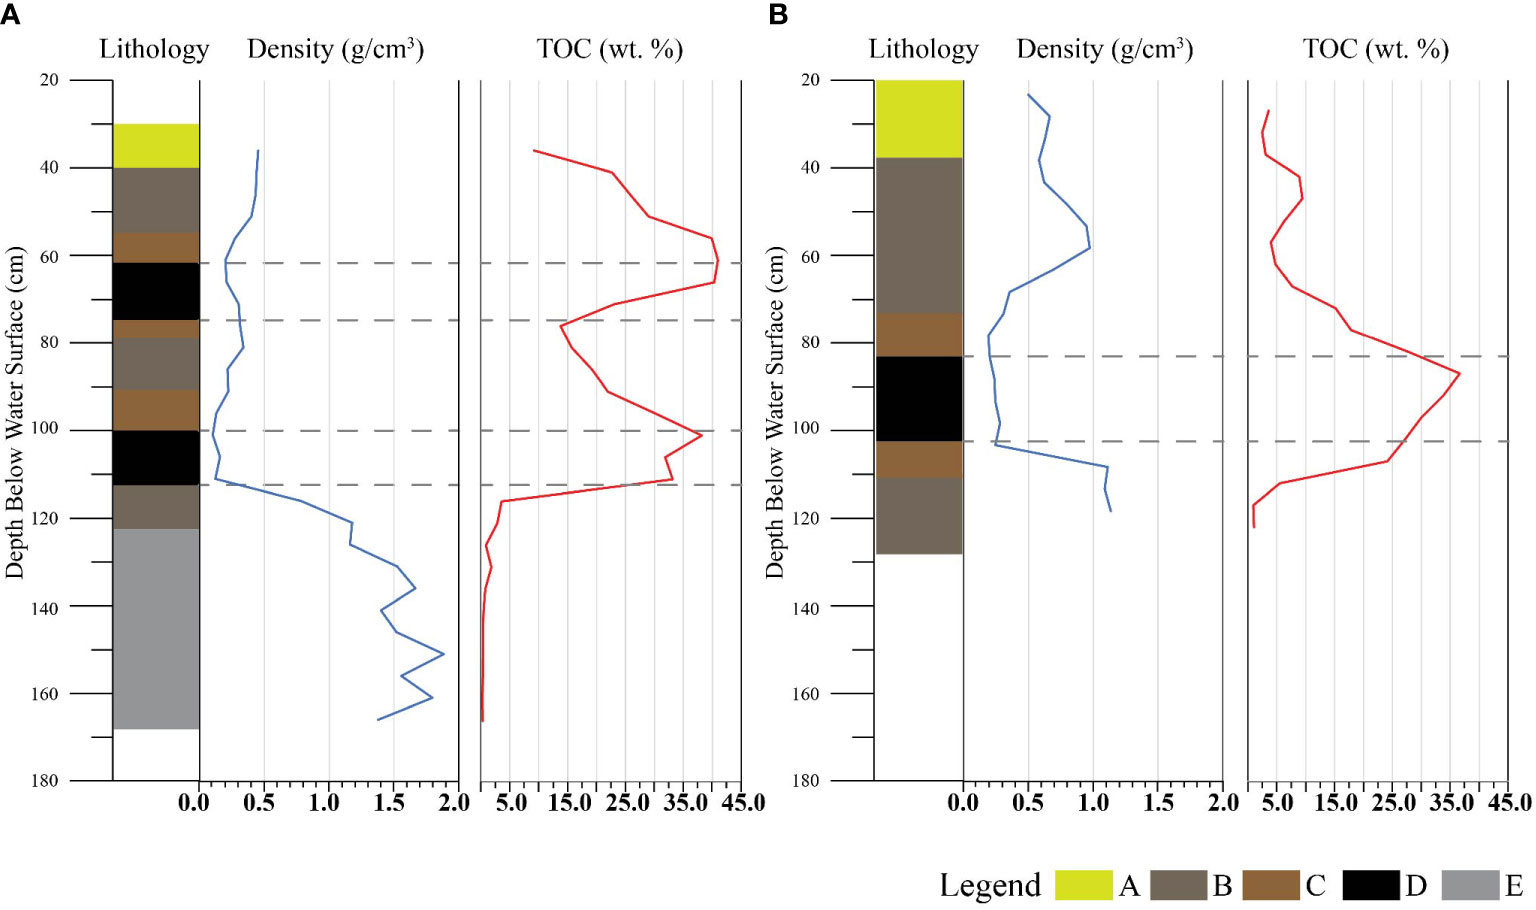
Figure 4 Bulk density and total organic carbon content (TOC) profiles along drilling core 1 (A) and core 2 (B). The dashed lines represent the peat layers. Lithological unit descriptions are summarized in Table 1.
4.5.2 Electrical resistivity
The resistivity profiles from sites 1 and 2 had similar trends from high resistivity (warm color) in shallow section to low resistivity (cool color) in deeper section (Figures 5, 6). Due to the vertical resolution of the survey, the very thin unit C was absent from the resistivity profiles (Figures 2, 5, 6).
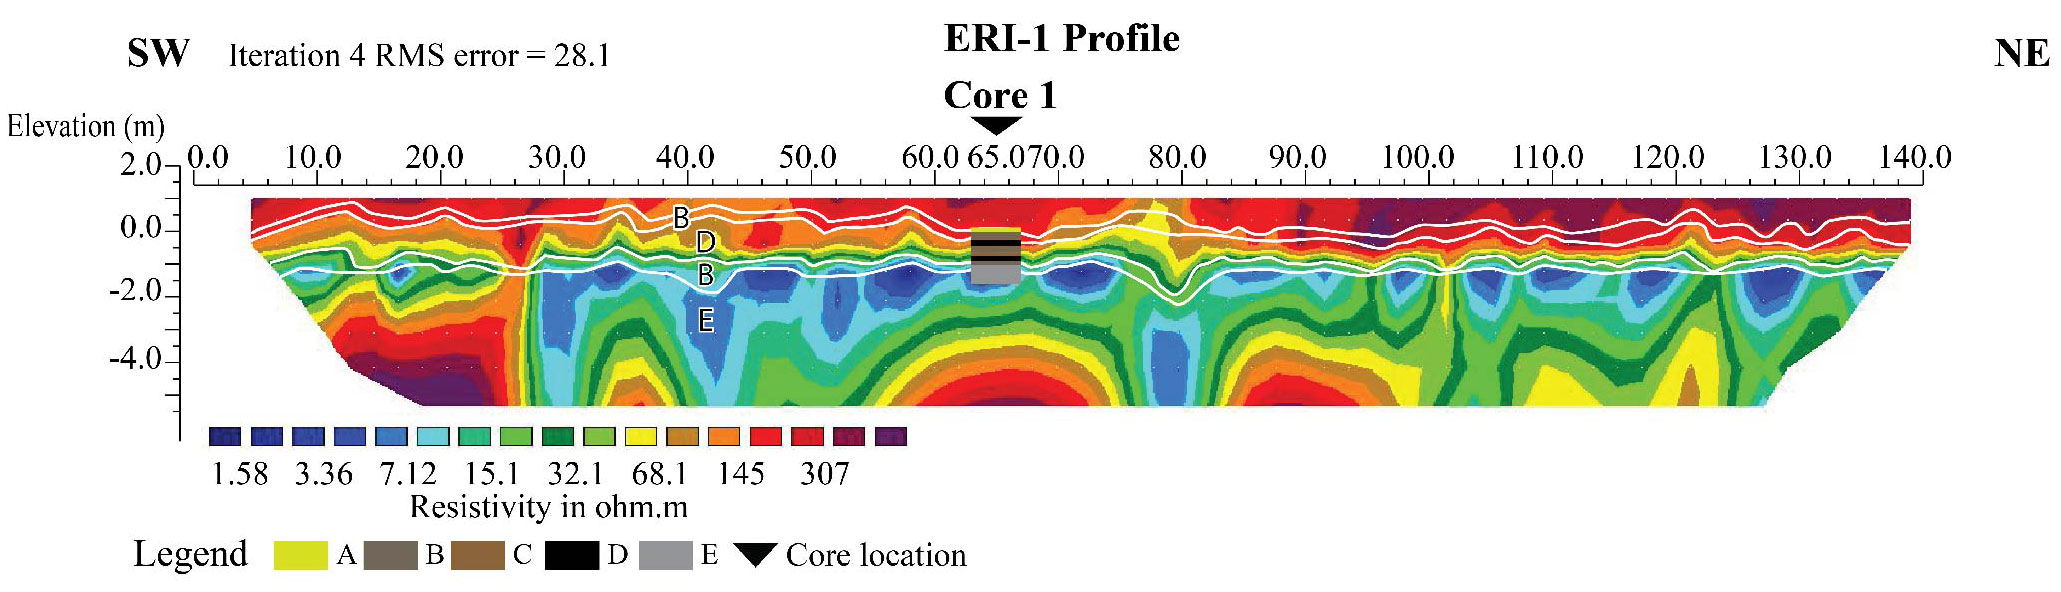
Figure 5 Resistivity profile at site 1, ERI-1, shows an extremely high resistivity layer above the core sample, interpreted as road filled sediments. The underlying high resistivity layer suggesting the peat layer in the study site, unit D. The lithological units from the drilling core 1 were used to constrain the interpreted lithological units in the resistivity profile.
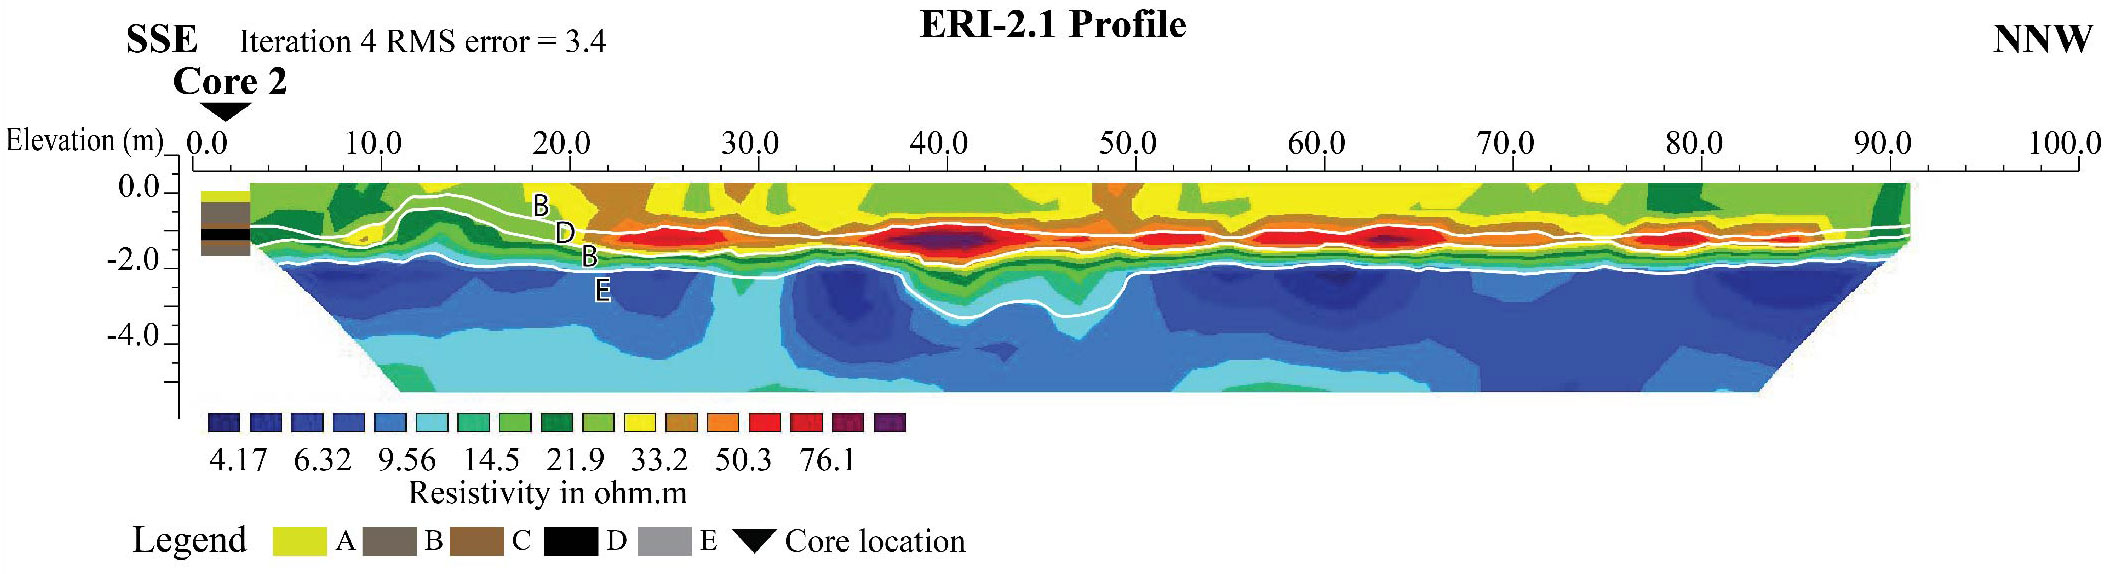
Figure 6 Resistivity profile at site 2, ERI-2.1, shows a high resistivity layer suggesting the peat layer in the study site, unit D. The lithological units from the drilling core 2 were used to constrain the interpreted lithological units in the resistivity profile.
The resistivity profiles from sites 1, ERI-1 profile, carried out the survey on the road at 140 cm above water level, consequently the upper section before reaching the core samples was interpreted to be road filled sediments (Figure 5). The road filled sediments are dry medium sands showing high resistivity due to low value in water content. In addition, the core 1 was taken at 65 m along the resistivity profile and was used to constrain the resistivity inversion model (Figure 5). Sediment layers below the road filled sediments were characterized by moderate to high resistivity of the units B and D (Figure 5). These two units, B and D, had resistivity values ranging from 11.1 to 32.1 ohm-m and from 32.1 to 145.0 ohm-m, respectively. The low resistivity values in the deeper section coincided with the unit E, having resistivity values less than 10 ohm-m (Figure 5).
Due to the waterlogged condition, four resistivity survey lines at site 2 were conducted along embankments at 20 - 60 cm above water level (Figure 1). The representative profile, ERI 2.1, was carried out near the core 2 location that used to constrain the unit boundaries in the resistivity profile (Figure 6). The peat layer, unit D, characterized by the highest resistivity values with a range of 21.9 to 76.1 ohm-m in the ERI 2.1 profile (Figure 6). The unit B was detected in this resistivity profile and exhibited moderate resistivity values ranging from 14.5 to 33.2 ohm-m (Figure 6). Similar to site 1, the unit E has resistivity values less than 10 ohm-m (Figure 6).
4.5.3 Ground penetrating radar
The GPR survey were measured at the same elevations to the electrical resistivity surveys for both study sites. The pre-processed GPR data were usually covered with noise, particularly ringing noise, which can be observed as high-amplitude horizontal reflection (Figure 7A). Thus, stacking, filter, and background removal were applied to the pre-process GPR data, then then GPR profile used to identify peat layer was constructed (Figure 7B).
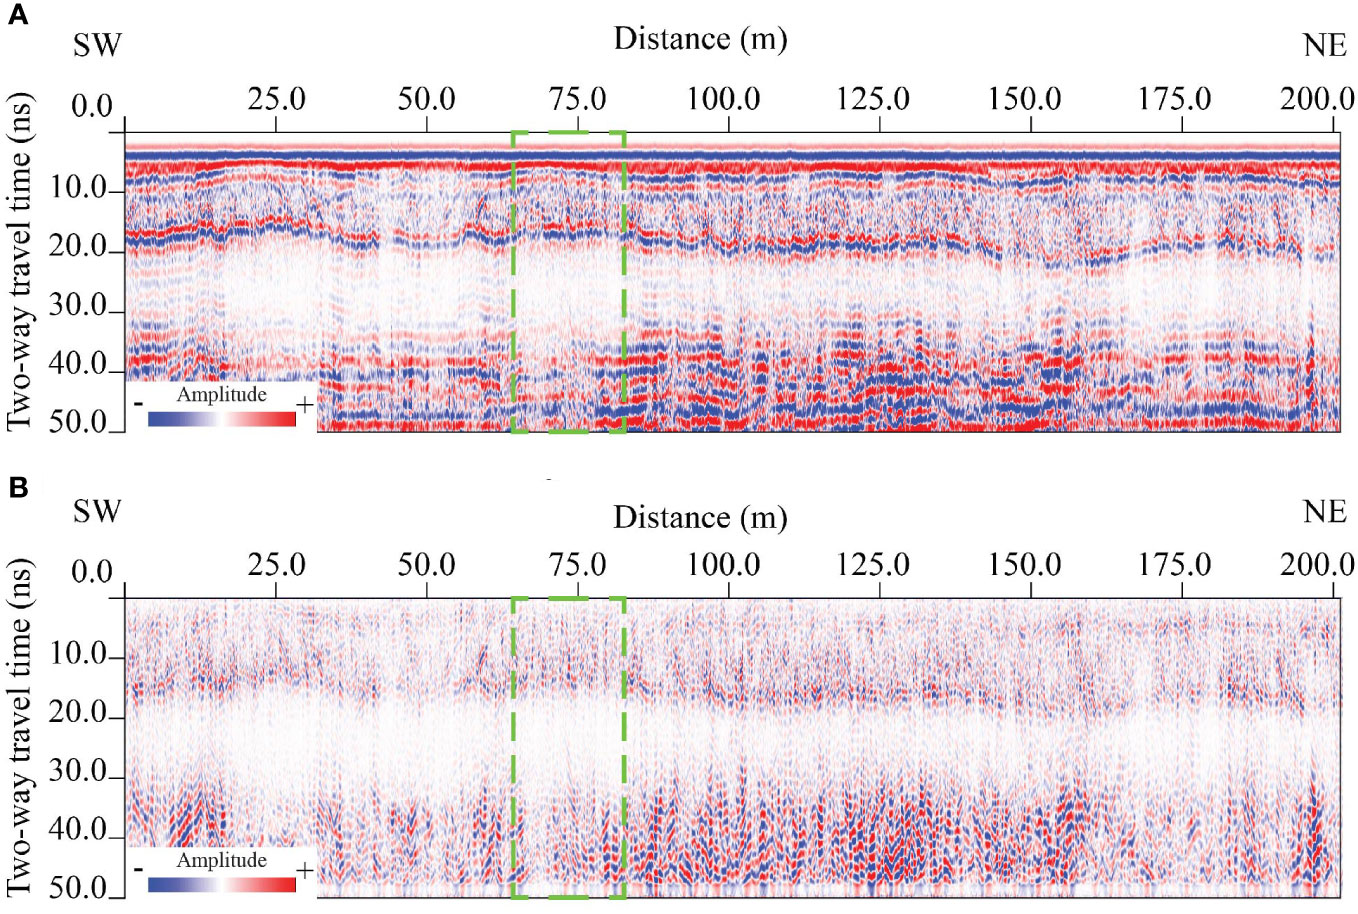
Figure 7 (A) An example of pre-processed GPR profile from site 1 and (B) GPR profile after applied filters and corrections.
At site 1, the high amplitude reflections in the upper section were interpreted as the road filled sediments (Figures 8A, B). The peat layer was characterized by high amplitude reflections in the lower section of the GPR profile 1 (Figures 8A, B). The peat layer at this site had the lowest GPR velocity of 0.040 m/ns and a dielectric constant of 56.25. The Hilbert transform was carried out to emphasize the lithological units in the instantaneous magnitude profile (Figure 8C). The geological model was created after converting the two-way travel time (ns) to depth (m), given the average peat thickness of 14 cm (Figure 8D).
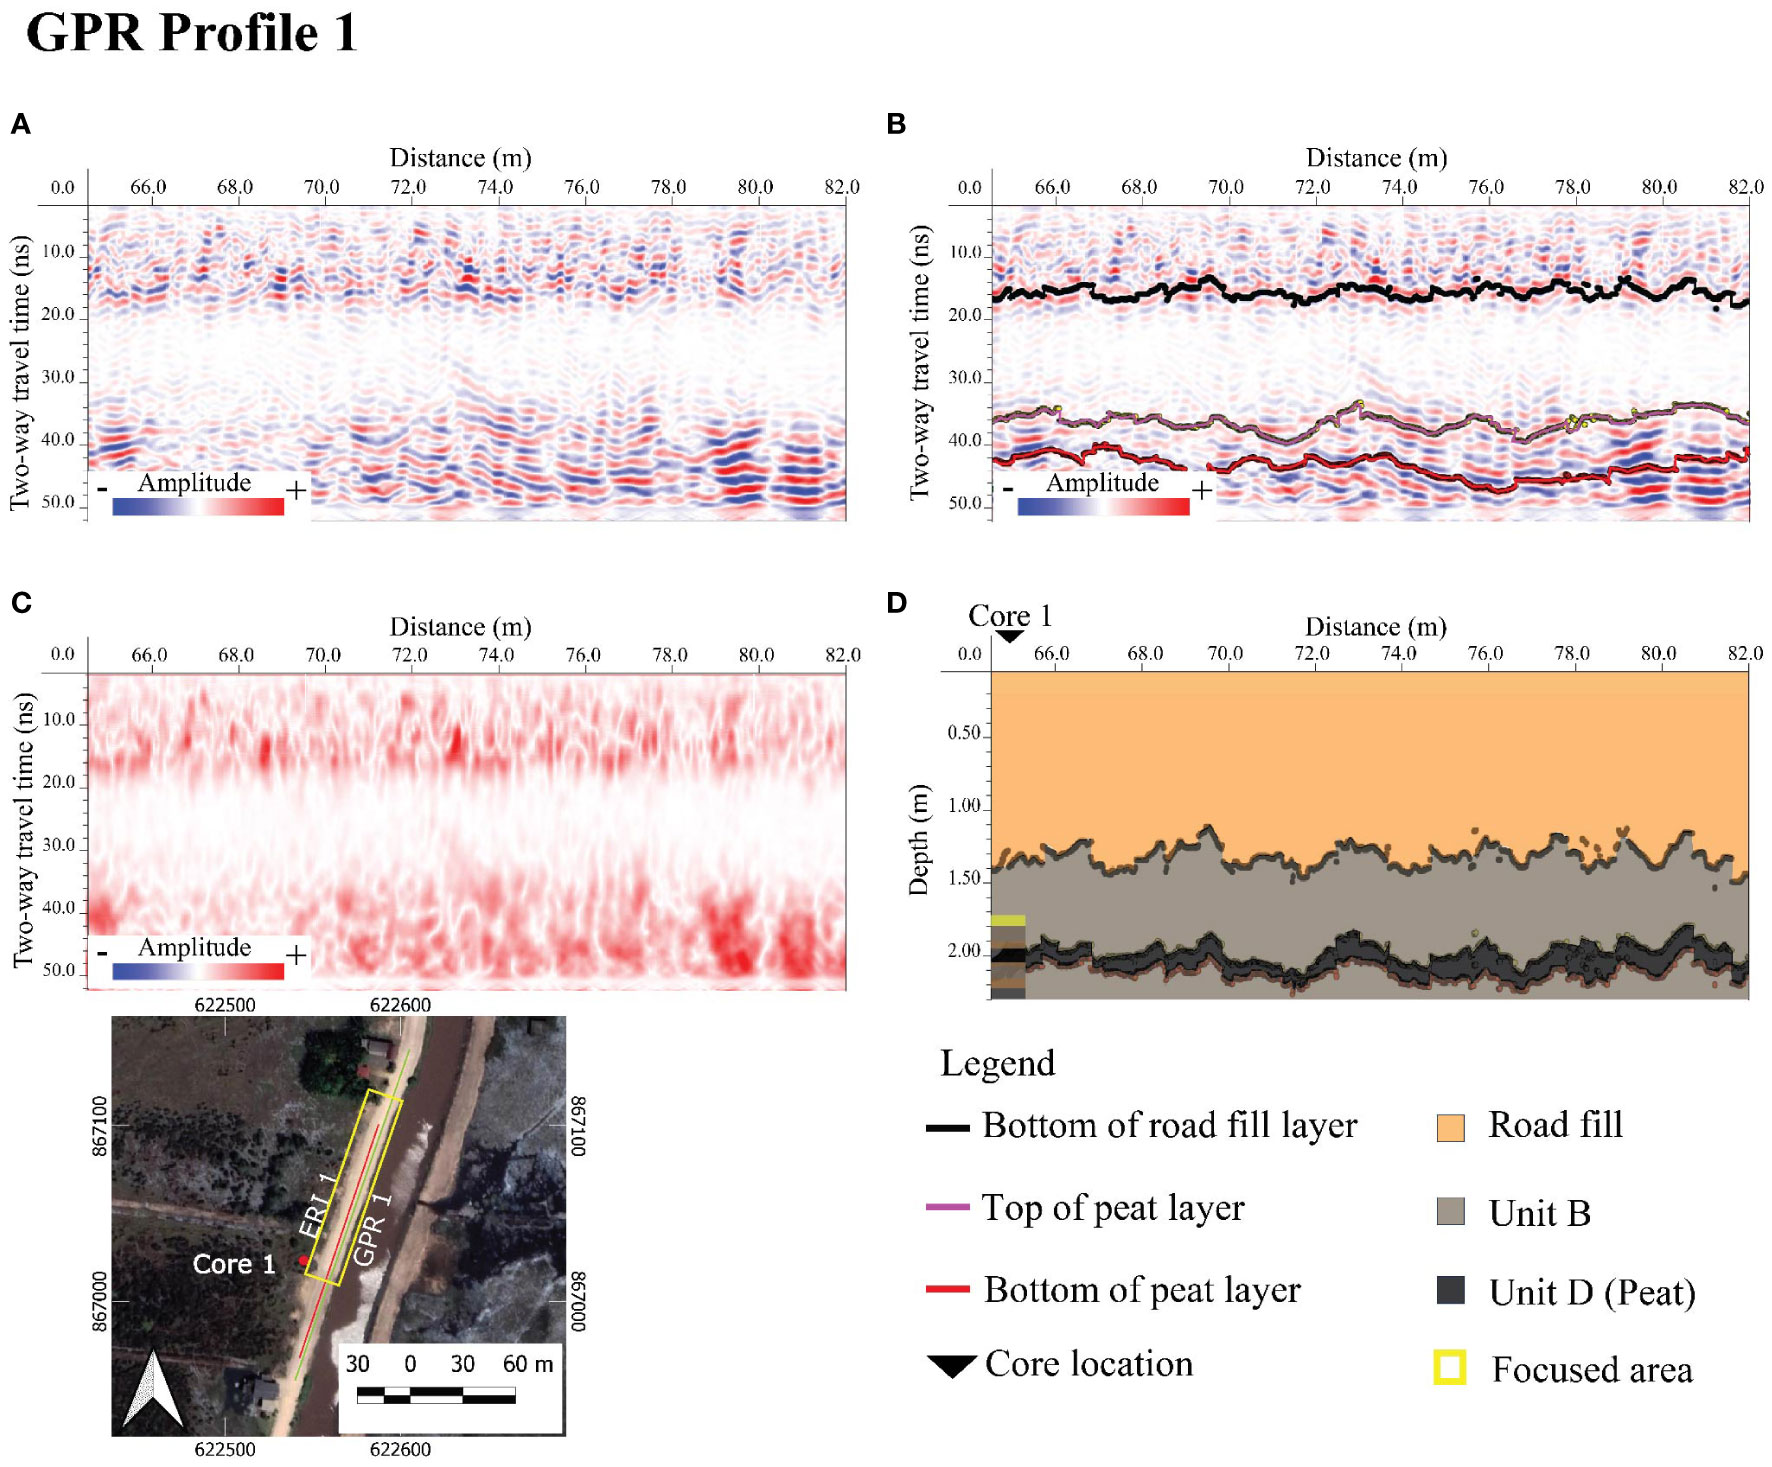
Figure 8 (A) Uninterpreted GPR profile from study site 1. (B) Interpreted GPR profile with picked lithological units including road filled sediments, unit B, and peat layer. (C) Instantaneous magnitude of GPR profile emphasizes peat layer by high amplitude reflections. (D) Geological model constructed from GPR line 1.
The peat layer can be also detected from the GPR profile 2.1 at site 2 and characterized by high amplitude reflections (Figures 9A, B). The peat layer at this site had a velocity of 0.041 m/ns and a relative dielectric constant of 53.54, coinciding to site 1. The GPR profile 2.1 was applied by the Hilbert transform in the instantaneous magnitude profile (Figure 9C). The peat thickness of 22 cm was obtained from the geological model at this site (Figure 9D).
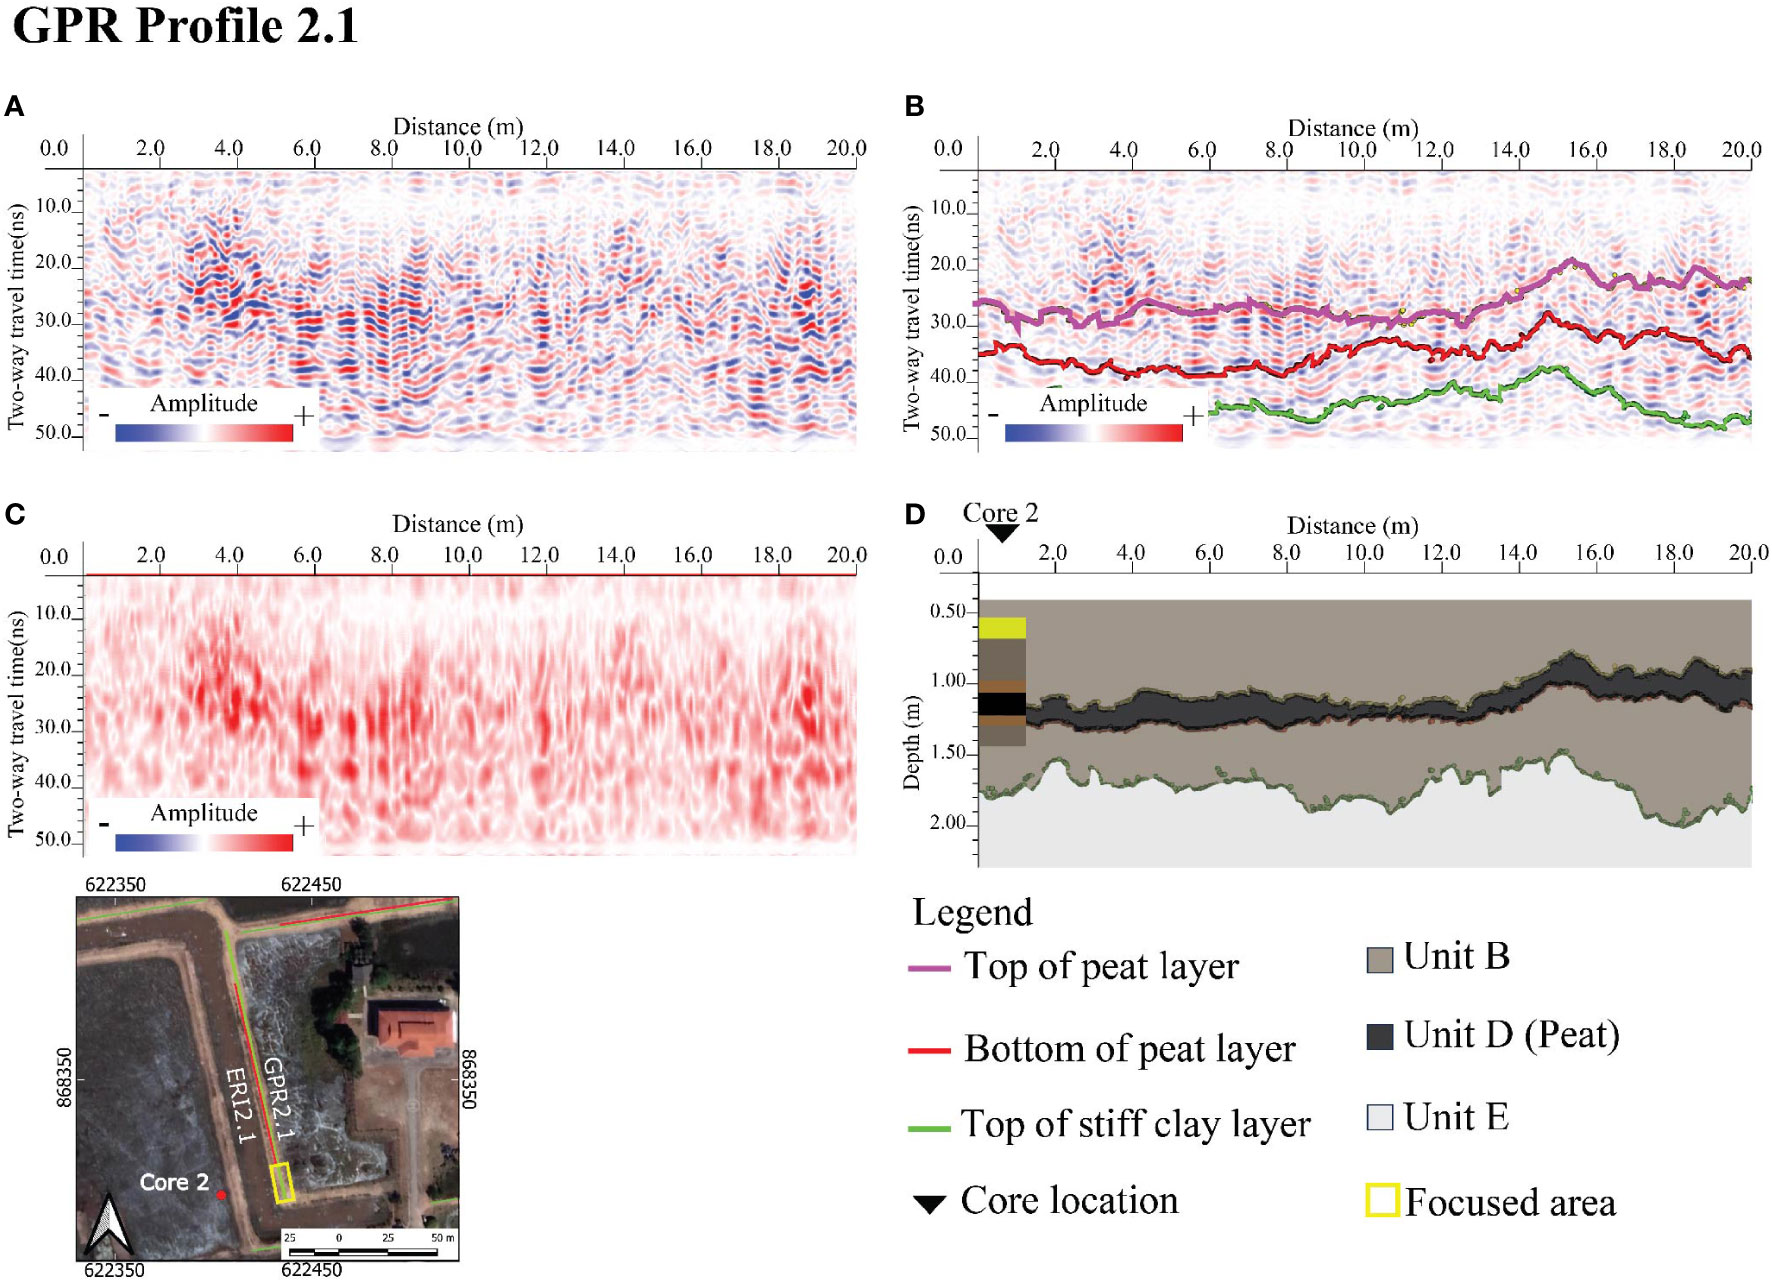
Figure 9 An example of GPR profile from study site 2. (A) Uninterpreted GPR profile 2.1 from study site 2. (B) Interpreted GPR profile 2.1 with picked lithological units including road filled sediments, unit B, peat layer, and top of unit E. (C) Instantaneous magnitude of GPR profile 2.1 emphasizes peat layer by high amplitude reflections. (D) Geological model constructed from GPR line 2.1.
The adjacent unit B from both sites is represented by low amplitude and high velocity reflections with an average velocity of 0.092 m/ns.
5 Discussions
5.1 Physical and chemical characteristics
From the drilling cores at the study sites, peat identification can be performed by visual analysis and brief physical properties (color, texture, consistence, and detrital organic matter). The peat layer in this study area is characterized by black, friable, low plasticity materials with high detrital organic matter and low clastic sediments. High sediment compaction and/or high sediment influx conditions, especially in costal wetland that can be influenced from marine intrusions, can be a problem for peat identification from naked eyes. The uses of geochemical analysis, especially non-destructive technique, can help peat identification from drilling cores by integration with lithological data. The major elements from XRF scanning data, including Al, Si, and Fe, have a significant relationship with the geophysical properties of each unit. The peat layer exhibits relative low contents of Al, Si, and Fe. TOC analysis is also able to distinguish peat layer from surrounding layers. Thus, geochemical analysis can be used and combined with geophysical data to identify the peat layer in this study area and other tropical peatlands.
The presence of Al and Si possibly indicates clay minerals in a sediment layer that can cause an increasing in cation exchange capacity, resulting in a low resistivity response in a sediment layer (Basri et al., 2019; Kumari and Mohan, 2021). In addition, Fe content in a sedimentary layer is usually related to pyrite, which is a semiconductor mineral and reduces resistivity values in a sedimentary layer (Clennell et al., 2010; Komolkongyo, 2018). Thus, the peat layer in this study area having significant low Al, Si and Fe exhibit high resistivity responses compared to surrounding clay layers.
In order to construct a geological model from GPR survey, dielectric constants and GPR velocities of sediment layers are needed. GPR velocity is strongly influenced by bulk density and water content (e.g., Ping et al., 2016). High bulk density of a sediment layer can increase GPR velocity, while high water content can reduce GPR velocity (Ping et al., 2016). The peat layer in the Kuan Kreng Peat swamp forest is characterized by high electrical resistivity ranging from 21.9 to 145.0 ohm-m and low GPR velocity with an average of 0.04 m/ns. Peat’s electrical resistivity in this study is relatively low compared to previous study from tropical peatland (e.g., 100-370 ohm-m; Comas et al., 2015). This low resistivity response might cause by the waterlogged condition in the coastal wetland of the Kuan Kreng Peat swamp forest. The GPR velocity from this study is consistent with previous studies ranging between 0.033 and 0.050 m/ns, particularly in tropical peatland ranging from 0.036 to 0.040 m/ns (e.g., Comas et al., 2015; Comas et al., 2017; Marpaung et al., 2020; Pezdir et al., 2021).
Consequently, geophysical and chemical characteristics of peat layer are useful for predicting thickness and distribution of peat layer in the subsurface. The summary of geophysical and chemical characteristics of the Kuan Kreng Peat swamp forest is shown in Table 2.
5.2 Long-term carbon stock
In this study, a combination of GPR, ERI, and sediment cores is successfully used to map out thickness and distribution of peat layer in the subsurface. In order to estimate carbon stock in the study area, more geophysical lines should be performed to construct the geometry of the peat layer. However, geophysical surveys may be difficult due to the waterlogged in the coastal wetland area. Thus, more cores from further and previous studies are useful to constrain the geological model for accurate geometry of peat and other layers. The result of GPR data yields a peat thickness ranging from 0.15 to 0.43 m with an average of 0.18 m, which resembles to the drilling cores having thicknesses of 0.13 and 0.19 m from sites 1 and 2, respectively.
Average values of bulk density and TOC from the core samples, 0.19 g/cm3 and 31.18 wt. %, respectively, are used to calculate the carbon density in the peat layer that results in 59.24 Kg C/m3. In order to calculate the carbon stock in the Kuan Kreng peat swamp forest, the peat layer was assumed to be consistent in thickness throughout the area. The average thickness of the peat layer from the drilling cores and GPR profiles is 18 cm and is applied to calculate the carbon stock per square meter. Thus, a result of 10.66 Kg C/m2 of carbon stock is achieved, which is then multiplied by the area of the Kuan Kreng peat swamp forest of 706.15 square kilometers (Nuthammachot and Stratoulias, 2021). Hence, the carbon stock of at least 7.53 megaton carbon (10.66 Kg C/m2 × 706.15 Km2) is estimated, which is approximately three time higher than aboveground biomass carbon in the Kuan Kreng peat swamp forest (ONEP, 2015). This study reveals lower carbon stocks compared to other tropical peatlands, as the peat thickness in the study area (0.18 m) is smaller than that in other tropical peatlands (4–9 m) (e.g., Comas et al., 2015; Yusa et al., 2019). Meunpong et al. (2020) reported that the peat thickness in the Kuan Kreng peat swamp forest in the Nakhon Si Thammarat Provinces can be reached up to three meters in some areas. Thus, this area can provide greater carbon stock in the peat layers.
6 Conclusions
This study proposes a rapid, non-invasive, and reliable method to map out thickness and distribution of peat layer in the subsurface at the Kuan Kreng peat swamp forest area. The geophysical profiles from GPR and ERI surveys can detect the peat layer in the study area. The peat layer in the Kuan Kreng Peat swamp forest is characterized by high electrical resistivity ranging from 21.9 to 145.0 ohm-m and low GPR velocity with an average of 0.04 m/ns. These physical properties can be applied for further peatland studies. The drilling cores can provide lithological and geochemical data and can be used to constrain the reliable geological model from geophysical profiles. The waterlogged condition in the coastal wetland of the study area strongly affects the GPR and ERI surveys since water strongly attenuates electromagnetic wave and affects resistivity response. Implication to carbon stock estimation, the average thickness of the peat layer, 18 cm, is applied to calculate the carbon stock in this study area. Thus, the carbon stock of at least 7.53 megaton is estimated for the Kuan Kreng peat swamp forest area.
Data availability statement
The raw data supporting the conclusions of this article will be made available by the authors, without undue reservation.
Author contributions
TP: Conceptualization, Investigation, Methodology, Writing – original draft, Writing – review & editing, Data curation, Formal analysis, Visualization. PC: Conceptualization, Data curation, Funding acquisition, Investigation, Methodology, Supervision, Validation, Writing – original draft, Writing – review & editing. AJ: Data curation, Investigation, Writing – original draft, Writing – review & editing. NR: Investigation, Methodology, Software, Writing – review & editing.
Funding
The author(s) declare financial support was received for the research, authorship, and/or publication of this article. This research is funded by Thailand Science research and Innovation Fund Chulalongkorn University (DIS66230012).
Acknowledgments
The authors are grateful to the Department of Geology, Faculty of Science, and Center of Excellence on Hazardous Substance Management, Chulalongkorn University for providing geochemical laboratory and geophysical survey equipment. Reviewers are thanked for their useful and constructive comments.
Conflict of interest
The authors declare that the research was conducted in the absence of any commercial or financial relationships that could be construed as a potential conflict of interest.
Publisher’s note
All claims expressed in this article are solely those of the authors and do not necessarily represent those of their affiliated organizations, or those of the publisher, the editors and the reviewers. Any product that may be evaluated in this article, or claim that may be made by its manufacturer, is not guaranteed or endorsed by the publisher.
References
Basri K., Wahab N., Abu T., Mohd K., Zainorabidin A. (2019). Sub-surface profiling using electrical resistivity tomography (ERT) with complement from peat sampler. Civ. Eng. Archit 7, 7–18. doi: 10.13189/cea.2019.071402
Beaulne J., Garneau M., Magnan G. (2021). Peat deposits store more carbon than trees in forested peatlands of the boreal biome. Sci. Rep. 11, 2657. doi: 10.1038/s41598-021-82004-x
Binley A., Slater L. (2020). Resistivity and Induced Polarization: Theory and Applications to the Near-Surface Earth (Cambridge: Cambridge University Press). doi: 10.1017/9781108685955
Byun C., Lee S. H., Kang H. (2019). Estimation of carbon storage in coastal wetlands and comparison of different management schemes in South Korea. J. Ecol. Environ. 43 (1), 1–12. doi: 10.1186/s41610-019-0106-7
Chabangborn A., Punwong P., Phountong K., Nudnara W., Yoojam N., Sainakum A., et al. (2020). Environmental changes on the west coast of the Gulf of Thailand during the 8.2 ka event. Quat. Int. 536, 103–113. doi: 10.1016/j.quaint.2019.12.020
Clennell M., Josh M. B., Esteban L., Piane C. D., Schmid S., Verrall M., et al. (2010). The Influence Of Pyrite On Rock Electrical Properties: A Case Study From Nw Australian Gas Reservoirs [Paper Presentation]. SPWLA 51th Annual Logging Symposium, Perth, Australia. https://onepetro.org/SPWLAALS/proceedings-abstract/SPWLA10/All-SPWLA10/SPWLA-2010-97081/28131
Cobb A. R., Dommain R., Tan F., Heng. N. H. H., Harvey C. F. (2020). Carbon storage capacity of tropical peatlands in natural and artificial drainage networks. Environ. Res. Lett. 15 (11). doi: 10.1088/1748-9326/aba867
Comas X., Terry N., Hribljan J. A., Lilleskov E. A., Suarez E., Chimner R. A., et al. (2017). Estimating belowground carbon stocks in peatlands of the Ecuadorian páramo using ground-penetrating radar (GPR). J. Geophys. Res. Biogeosci. 122, 370–386. doi: 10.1002/2016JG003550
Comas X., Terry N., Slater L., Warren M., Kolka R., Kristiyono A., et al. (2015). Imaging tropical peatlands in Indonesia using ground-penetrating radar (GPR) and electrical resistivity imaging (ERI): implications for carbon stock estimates and peat soil characterization. BG. 12, 2995–3007. doi: 10.5194/bg-12-2995-2015
Filqisthi T. A., Kaswanto R. L. (2017). Carbon stock and plants biodiversity of Pekarangan in Cisadane watershed West Java. IOP Conf. Ser. Earth Environ. Sci. 54, 012024. doi: 10.1088/1755-1315/54/1/012024
Glaser P. H. (1987). The ecology of patterned boreal peatlands of northern minnesota: A community profile. U.S. Fish Wildl. Serv. Rep. 85 (7.14).
Hapsari K. A., Jennerjahn T., Nugroho S. H., Yulianto E., Behling H. (2022). Sea level rise and climate change acting as interactive stressors on development and dynamics of tropical peatlands in coastal Sumatra and South Borneo since the Last Glacial Maximum. Glob. Change Biol. 28 (10), 3459–3479. doi: 10.1111/gcb.16131
Harenda K. M., Lamentowicz M., Samson M., Chojnicki B. H. (2018). “The Role of Peatlands and Their Carbon Storage Function in the Context of Climate Change,” in Interdisciplinary Approaches for Sustainable Development Goals. Eds. Zielinski T., Sagan I., Surosz W. (Springer), 169–187. doi: 10.1007/978-3-319-71788-3_12
Iiyama I., Osawa K. (2010). Surface O2 influx related to soil O2 profiles in a drained tropical peatland. J. Soil Sci. Plant Nutr. 56 (4), 517–520. doi: 10.1111/j.1747-0765.2010.00488.x
Jol H. M., Smith D. G. (1995). Ground penetrating radar surveys of peatlands for oilfield pipelines in Canada. J. Appl. Geophys. 34 (2), 109–123. doi: 10.1016/0926-9851(95)00018-6
Khampeera A., Yongsatisak T., Yongchalermchai P. P. (2021). Analysis of fire risk areas during drought in kuan kreng peat swamp, nakhon si thammarat province using a GIS-AHP method. TJST 10 (2), 234–250. doi: 10.14456/tjst.2021.19
Komolkongyo S. (2018). Characteristics of fuel in Kuan Kreng peat swamp forest, Ban Kuan Rab, Kreng Sub-district, Chauat district, Nakhon Si Thammarat (in Thai) (Thailand: DNP).
Kumari N., Mohan C. (2021). Basics of clay minerals and their characteristic properties. IntechOpen., 1–29. doi: 10.5772/intechopen.97672
Loke M. H. (2010). “Res2Dinv ver. 3.59 for windows XP/vista/7, 2010,” in Rapid 2-D resistivity & IP inversion using the least-squares method (Malaysia: Geoelectrical Imaging 2D & 3D Geotomo Software 2010).
Loke M. H., Chambers J. E., Rucker D. F., Kuras O., Wilkinson P. B. (2013). Recent developments in the direct-current geoelectrical imaging method. J. Appl. Geophy. 95, 135–156. doi: 10.1016/j.jappgeo.2013.02.017
Loke M. H., Rucker D. F., Chambers J. E., Wilkinson P. B., Kuras O. (2020). “Electrical resistivity surveys and data interpretation,” in Encyclopedia of solid earth geophysics. Ed. Gupta H. (Springer). doi: 10.1007/978-3-030-10475-7_46-1
Lowrie W. (2007). Fundamentals of geophysics (Cambridge: Cambridge University Press). doi: 10.1017/CBO9780511807107
Lowry C., Fratta D., Anderson M. (2009). Ground penetrating radar and spring formation in a groundwater dominated peat wetland. J. Hydrol. 373 (1-2), 68–79. doi: 10.1016/j.jhydrol.2009.04.023
Marpaung F., Sumirah L., Sumargana L., Nugroho D. (2020). Profile of dielec constant of peat in Ogan Komering Ilir Regency, Indonesia, using SAR Sentinel-1 and ground penetrating radar. IOP Conf. Ser. Earth Environ. Sci. 500. doi: 10.1088/1755-1315/500/1/012041
Meunpong P., Wachrinrat C., Wanthongchai K. (2020). Factors determining peat thickness in secondary forest of Kuan Kreng Peat Forest, southern Thailand. Agr. Nat. Resour. 54 (3), 333–338.
Miller M. A., Tonoto P., Taylor D. (2022). Sustainable development of carbon sinks? Lessons from three types of peatland partnerships in Indonesia. Sustain. Dev. 30 (1), 241–255. doi: 10.1002/sd.2241
Nuthammachot N., Stratoulias D. (2021). A GIS-and AHP-based approach to map fire risk: a case study of Kuan Kreng peat swamp forest, Thailand. Geocarto. Int. 36 (2), 212–225. doi: 10.1080/10106049.2019.1611946
Okpoli C. C. (2013). Sensitivity and resolution capacity of electrode configurations. Int. J. @ Geophy. 12. doi: 10.1155/2013/608037
Omar M. S., Ifandi E., Sukri R. S., Kalaitzidis S., Christanis K., Lai D. T. C., et al. (2022). Peatlands in Southeast Asia: A comprehensive geological review. Earth Sci. Rev. 232. doi: 10.1016/j.earscirev.2022.104149
ONEP (2015). Conservation, restoration, and adaptation plan to accommodate climate change. In the wetland area, the Thale Noi wildlife non-hunting area and the Kuan Kreng swamp forest (in Thai) (Thailand: ONEP). Available at: http://kb.psu.ac.th/psukb/handle/2016/16910.
Ouyang X., Lee S. Y. (2013). Carbon accumulation rates in salt marsh sediments suggest high carbon storage capacity. Biogeosci. Discuss. 10 (12), 19–155. doi: 10.5194/bgd-10-19155-2013
Page S., Rieley J. (1998). Tropical peatlands: A review of their natural resource functions with particular reference to Southeast Asia. Int. Peat. J. 8, 95–106.
Page S. E., Rieley J. O., Wüst R. (2006). Chapter 7 Lowland tropical peatlands of southeast Asia. Dev. Earth Surf. Process. 9, 145–172. doi: 10.1016/S0928-2025(06)09007-9
Pezdir V., Čeru T., Horn B., Gosar M. (2021). Investigating peatland stratigraphy and development of the Šijec bog (Slovenia) using near-surface geophysical methods. CATENA 206, 105484. doi: 10.1016/j.catena.2021.105484
Ping W., Zhenqi H., Yanling Z., Xinju L. (2016). Experimental study of soil compaction effects on GPR signals. J. App. Geophys. 126, 128–137. doi: 10.1016/j.jappgeo.2016.01.019
Reynolds J. M. (2011). Introduction to applied and environmental geophysics. 2nd edition (Chichester: John Wiley & Sons).
Ribeiro K., Pacheco F. S., Ferreira J. W. (2021). Tropical peatlands and their contribution to the global carbon cycle and climate change. Glob. Change Biol. 27, 489–505. doi: 10.1111/gcb.15408
Rich F. J. (2015). “Peat, its origins, characteristics, and geological transformations,” in Coal and peat fires: a global perspective. Eds. Stracher G. B., Prakash A., Rein G. (London: Elsevier), 13–38. doi: 10.1016/B978-0-444-59510-2.00002-1
Robinson M., Bristow C., Mckinley J., Ruffell A. (2013). Ground penetrating radar. Geomorphological Techniques 1 (5.5), 1–26.
Sainakum A., Jittangprasert P., Sompongchaiyakul P., Jirapinyakul A. (2021). Using n-alkanes as a proxy to reconstruct sea-level changes in Thale Noi, the west coast of the Gulf of Thailand. J. Asian Earth Sci. 213. doi: 10.1016/j.jseaes.2021.104740
Sass O., Friedmann A., Haselwanter G., Wetzel K. F. (2010). Investigating thickness and internal structure of alpine mires using conventional and geophysical techniques. CATENA 80 (3), 195–203. doi: 10.1016/j.catena.2009.11.006
Slater L. D., Reeve A. (2002). Investigating peatland stratigraphy and hydrogeology using integrated electrical geophysics. Geophysics 67 (2), 365–378. doi: 10.1190/1.1468597
Terzano D., Attorre F., Parish F., Moss P., Bresciani F., Cooke R., et al. (2022). Community-led peatland restoration in Southeast Asia: 5Rs approach. Restor. Ecol. 30 (8), 13642. doi: 10.1111/rec.13642
Trappe J., Kneisel C. (2019). Geophysical and sedimentological investigations of peatlands for the assessment of lithology and subsurface water pathways. Geosciences 9 (3), 118. doi: 10.3390/geosciences9030118
Uda S. K., Schouten G., Hein L. (2020). The institutional fit of peatland governance in Indonesia. Land. Use Policy. 99, 103300. doi: 10.1016/j.landusepol.2018.03.031
Wangritthikraikul K., Leknettip S., Chawchai S. (2020). Paleoenvironment of Kuan Kreng peat swamp, Southern Thailand. EGU General Assembly 2020, Vienna, Austria. doi: 10.5194/egusphere-egu2020-2619
Warren M., Hergoualc’h K., Kauffman J. B. (2017). An appraisal of Indonesia’s immense peat carbon stock using national peatland maps: uncertainties and potential losses from conversion. Carbon. Balance. Manag. 12 (12). doi: 10.1186/s13021-017-0080-2
Whittle A., Gallego-Sala A. V. (2016). Vulnerability of the peatland carbon sink to sea level rise. Sci. Rep. 6, 28758. doi: 10.1038/srep28758
Yu Z. C. (2012). Northern peatland carbon stocks and dynamics: a review. BG 9 (10), .4071–.4085. doi: 10.5194/bg-9-4071-2012
Yu Z., Loisel J., Brosseau D. P., Beilman D. W., Hunt S. J. (2010). Global peatland dynamics since the Last Glacial Maximum. Geophys. Res. Lett. 37 (13). doi: 10.1029/2010GL043584
Keywords: Kuan Kreng peat swamp forest, ground penetration radar, electrical resistivity imaging, carbon stock, geochemical analysis
Citation: Phiranram T, Chenrai P, Jirapinyakul A and Rachukarn N (2024) Geophysical and chemical characteristics of peatland in coastal wetland, southern Thailand. Front. Mar. Sci. 11:1287362. doi: 10.3389/fmars.2024.1287362
Received: 01 September 2023; Accepted: 02 January 2024;
Published: 18 January 2024.
Edited by:
Jian Li, Jiangsu University, ChinaReviewed by:
Regan Leonardus Kaswanto, Bogor Agricultural University, IndonesiaKasbi Basri, Universiti Tun Hussein Onn Malaysia, Malaysia
Copyright © 2024 Phiranram, Chenrai, Jirapinyakul and Rachukarn. This is an open-access article distributed under the terms of the Creative Commons Attribution License (CC BY). The use, distribution or reproduction in other forums is permitted, provided the original author(s) and the copyright owner(s) are credited and that the original publication in this journal is cited, in accordance with accepted academic practice. No use, distribution or reproduction is permitted which does not comply with these terms.
*Correspondence: Piyaphong Chenrai, UGl5YXBob25nLkNAY2h1bGEuYWMudGg=