 Shingo Watari
 Shion Takemura
 Hitomi Oyaizu
94% of researchers rate our articles as excellent or good
Learn more about the work of our research integrity team to safeguard the quality of each article we publish.
Find out more
ORIGINAL RESEARCH article
Front. Mar. Sci., 26 March 2024
Sec. Marine Fisheries, Aquaculture and Living Resources
Volume 11 - 2024 | https://doi.org/10.3389/fmars.2024.1265907
Spatiotemporal changes in catches and transition of fishing grounds have been observed in various coastal fishery resources in Japanese waters in recent years. Are these changes part of cyclical fluctuations on a centennial timescale? Are these changes situations that have never been observed prior to this? Are common factors included in the long-term fluctuations among coastal fisheries resources? A total of 12 important Japanese coastal fisheries resources including fishes, shells, invertebrates, and algae were analyzed using fisheries statistics on the geographical center of catch compiled since 1894. The time series of the geographical center of catch showed a cyclical fluctuation trend over time rather than changing monotonically. The geographic center of catch in recent years (2019–2021) was located at the northeastern margin of the distribution, compared to its location since the end of the 19th century for many fishery resources. For coastal fishery resources, the situation in terms of fluctuations in the geographical center of catch is more extreme than in the past 100 years. The results of the dynamic factor analysis suggested that the state of these resources may be affected by the global ocean environment and other factors including human activities. Examining how fisheries have responded to past cyclical fluctuations may provide insight into adapting to the current rapid changes caused by climate change.
Global climate change has had various impacts on Japanese fishery resources. With regard to coastal areas since the 2010s, spatiotemporal changes in catches and transition of fishing grounds have been observed in various coastal fishery resources in Japanese waters. Synchronized fluctuations have been reported in Osaka Bay, Ise Bay, Mikawa Bay, and Tokyo Bay in Japan, in which a decrease in the landings of mantis shrimp (Oratosquilla oratoria) and flatfish species (such as Pseudopleuronectes yokohamae, Pleuronichthys lighti, and Platichthys bicoloratus), and an increase in the landings of daggertooth pike conger (Muraenesox cinereus) and Japanese Spanish mackerel (Scomberomorus niphonius) (Sone et al., 2023) have been observed (Figure 1). There have been reports of a decrease in landings of species such as the Japanese blue crab (Portunus trituberculatus) and largehead hairtail (Trichiurus japonicus), which in the past were mainly exploited in the western areas of Japan, such as the Seto Inland Sea, whereas landings of these species have increased in the northern regions of Japan, such as Sendai Bay, in recent years (Yagura, 2021; Masuda and Katayama, 2022; Sakaji, 2023). The phenomenon of northward shifts in fish species and fishing grounds has been observed throughout Japan and is often invoked by the phrase “the sea has changed.”
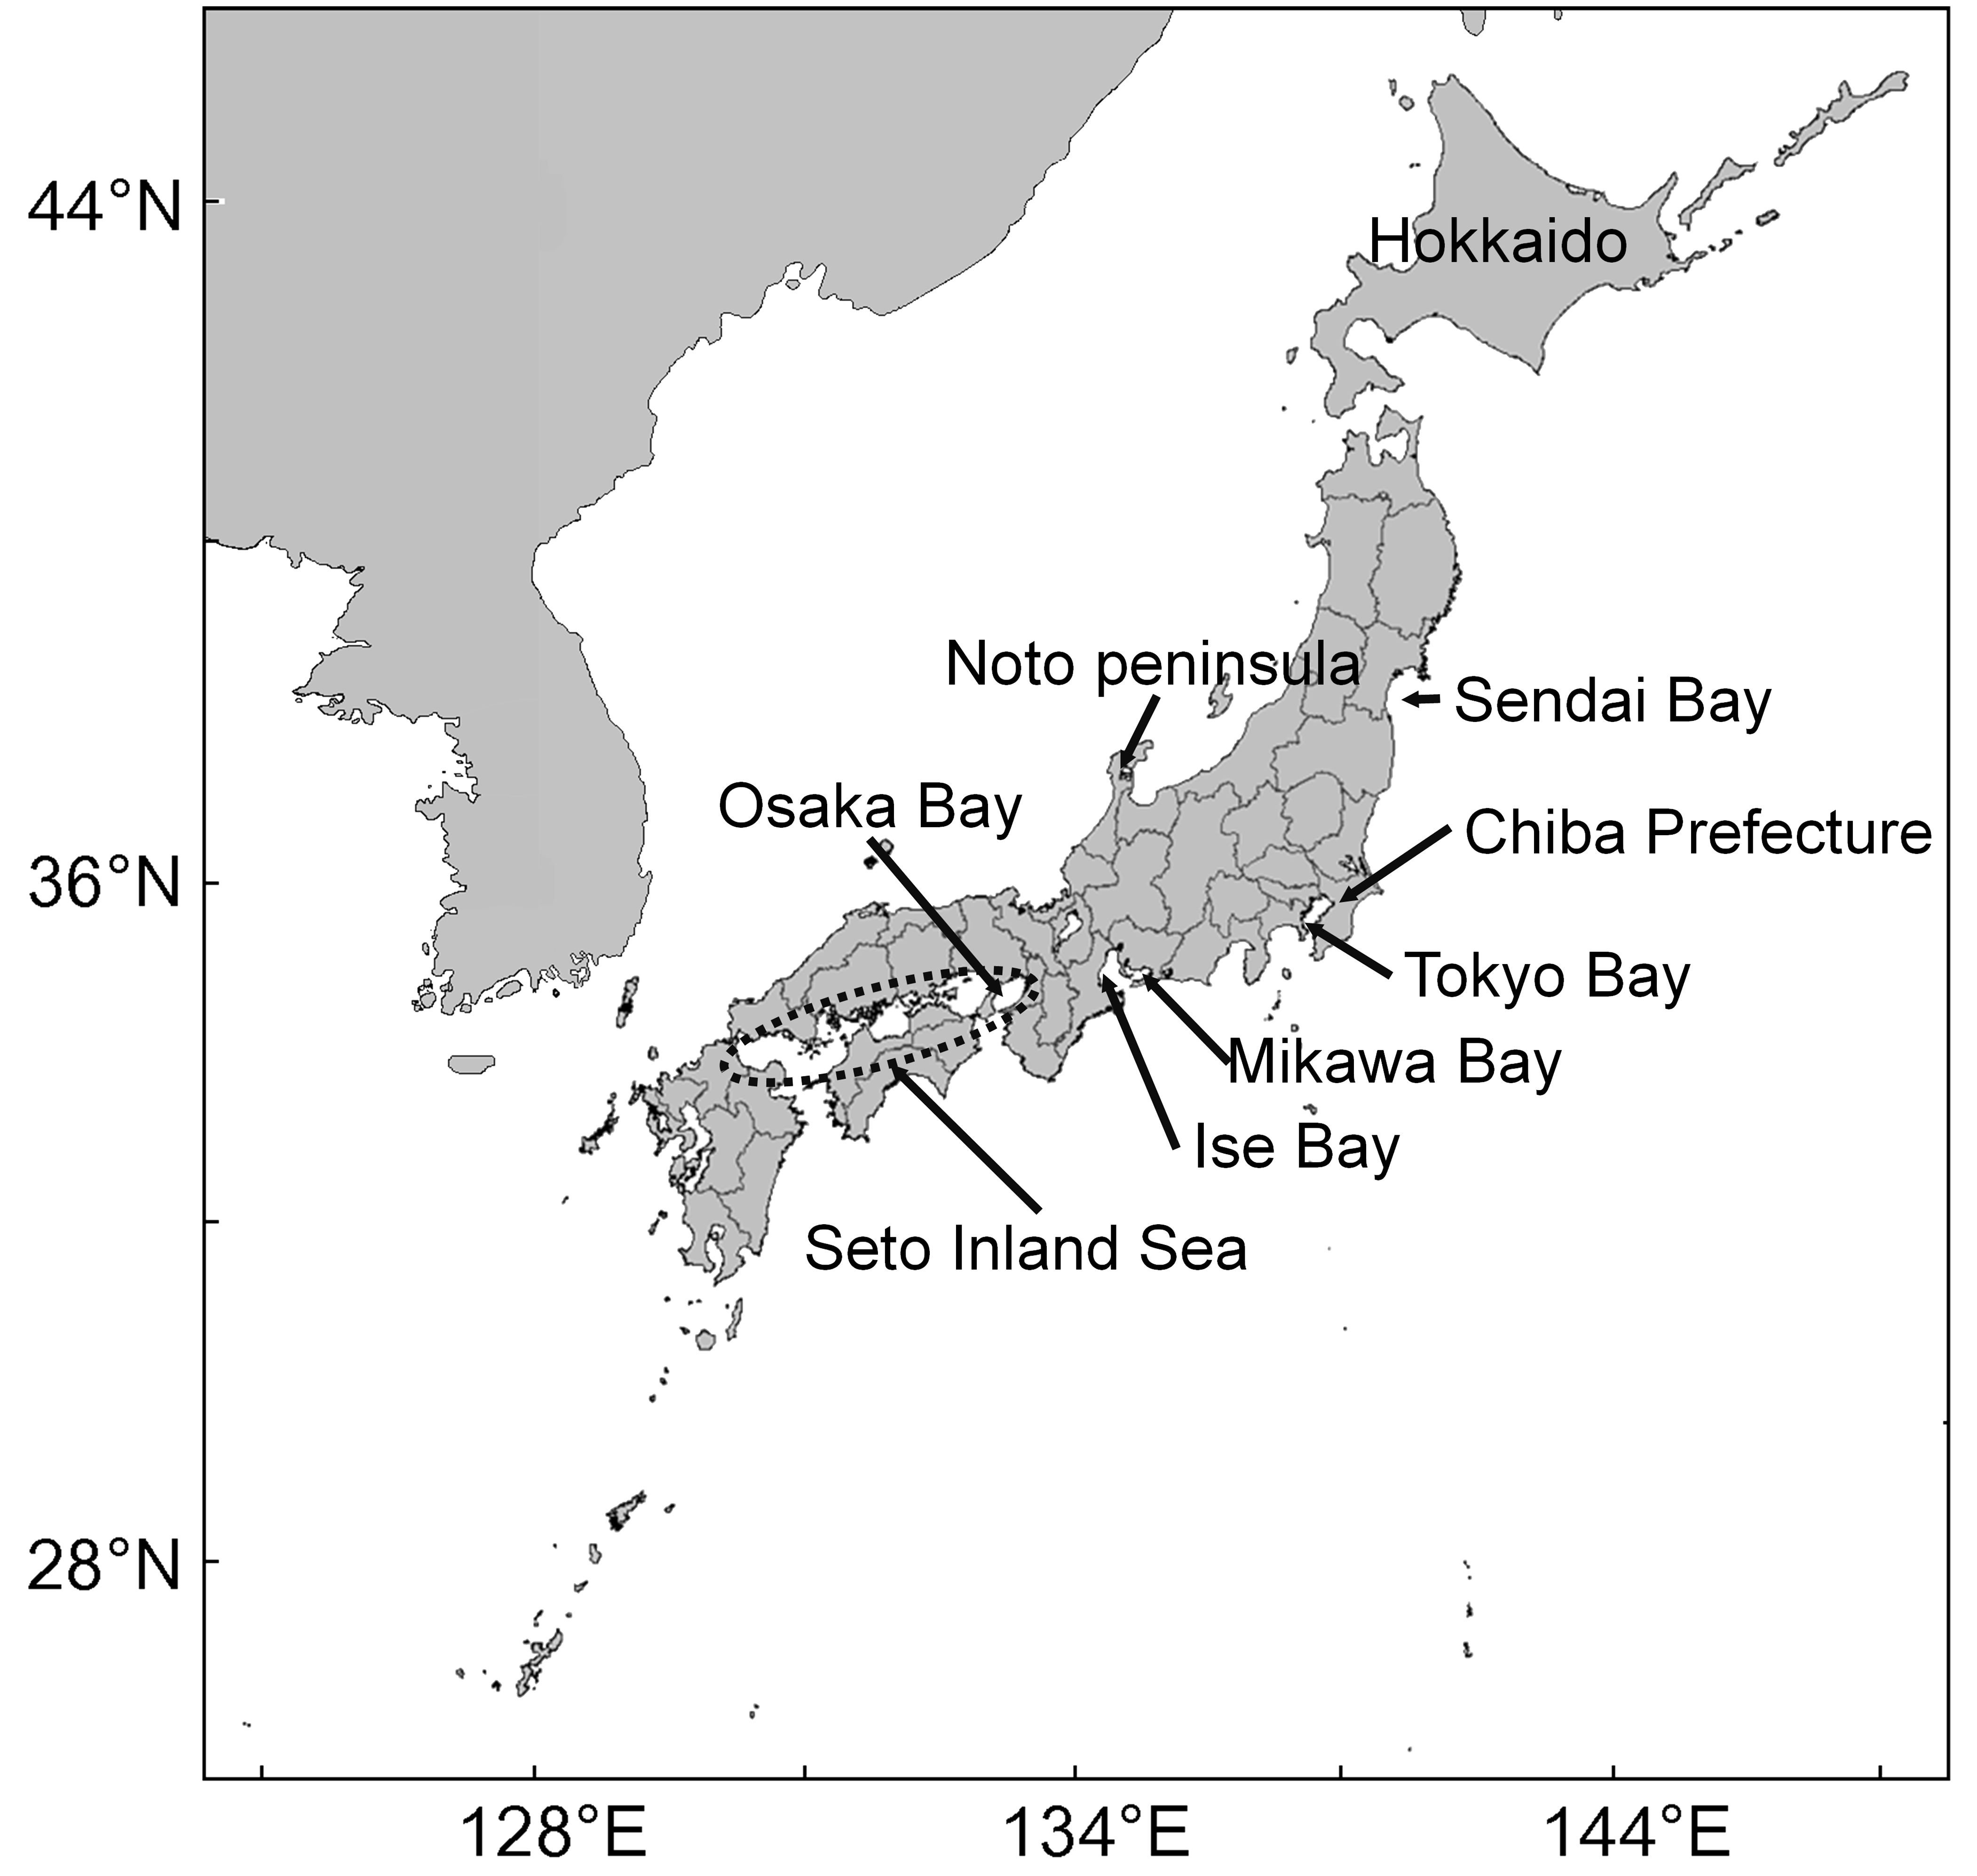
Figure 1 Location and details of the study area. Lines within Japanese islands indicate prefectural borders.
The relationship between the ocean environment and offshore fishery resources in the waters around Japan has undergone cyclical changes over the past several decades. The distribution of various fishery resources and the amount of fish catch have fluctuated greatly. The regime shift, that is, a significant and systematic transition from one quasi-stationary climatic state to another in the sea surface temperature (SST) field in the Northern Hemisphere, has been widely known since the early 20th century (Minobe, 2002; Yasunaka and Hanawa, 2002). For example, the abundance of small pelagic fishes exhibits cyclic population dynamics with climate fluctuations and oceanic regime shifts (Kawasaki, 1983; Takasuka et al., 2008). Many other fish species, including walleye pollock (Gadus chalcogrammus), Japanese flying squid (Todarodes pacificus), and chum salmon (Oncorhynchus keta) as well as small pelagic fishes, are also known to be affected by climate change (Sakurai, 2007; Kidokoro et al., 2010; Yatsu et al., 2013). Such fluctuations in the abundance and catch of fishery resources are not characteristic phenomena that have occurred only in recent years. However, it has been suggested that these marine resources have responded differently to the unconventional regimes around the water in Japan since the 2000s (Kuroda et al., 2020a).
In Japanese coastal fisheries resources, several studies have used long-term statistics to investigate their relation to the global environment. Shishidou et al. (2016) analyzed yellowtail (Seriola quinqueradiata) catches throughout Japan using information from 1894 to 2012 by classifying regime shifts into warming and cooling periods. The geographical center of catch was located in the northeast during the warming regime (1915–1925, 1946–1970, after 1989) and in the southwest during the cooling regime (before 1914, 1926–1945, 1971–1988), suggesting a relationship between the distribution of yellowtail catches and climate fluctuations. Hayakawa et al. (2007) analyzed long-term patterns of change and their factors using data on abalone and turban shells (Turbo (Batillus) cornutus) from 1904 to 2000. This centennial-scale data provides a different perspective and clearer insights than short-term information.
Focusing on the coastal areas in Japan over the past 100 years, in addition to the oceanic environment, the factors surrounding the fishery resources have also changed significantly, including developments in fishery technology, the effects of stock enhancement, and improvements in processing and distribution systems (Hamasaki and Kitada, 2008; Japan Fisheries Agency, 2018). Originally, natural beaches, such as sandy beaches and cliffs, were the predominant coastal features in Japan; however, since the mid-1950s, the distribution of coastal topography has been artificially changed on a large scale (Hirano and Mimura, 2003). For example, the catch of short-necked clam (Ruditapes philippinarum) has fluctuated greatly since the 1960s due to coastal development and transition in fishing methods throughout Japan (Toba, 2017). Such changes in human factors should also be considered when taking a long-term perspective.
To understand the long-term fluctuation of fisheries resources, stock biomass is important and powerful information that can be used for the spatiotemporal analysis of a species’ distribution. In Japan, stock assessments have been conducted for many important fishery resources, starting with 43 species in 1995 and increasing to 192 species by 2022 (Japan Fisheries Agency, 2023). For instance, in the context of climate change, a stock assessment has been conducted for the Pacific stock of Japanese sardine (Sardinops melanostictus) since 1975, considering the effect of regime shifts on reproductive relationships (Furuichi et al., 2023). In terms of timescale, the Tsushima Warm Current stock of Japanese sardines has a long stock assessment period, exceeding 70 years, since 1960 (Muko et al., 2023). However, assessments of many fishery stocks have been conducted only since the 1980s or 1990s, and the available timescales are limited to information on the scale of a few decades.
Fisheries statistics have been compiled by the national government since 1872 and have a history of over 150 years in Japan. Regarding the collection of information on fisheries statistics, the history of detailed information on Japanese fisheries statistics up to the first half of the 20th century is described in several previous works (Yamamoto, 1960; Norin Toukei Kyokai, 1978). These indicate that the statistics of fishery products themselves have been compiled since 1872, but they initially included weights of dried and salted products and wet weights after 1894. Until 1951, the survey design was planned to include agriculture, forestry, and the cattle industry, in addition to fishery products. Information was also collected in a uniform but hierarchical framework by national, prefectural, and municipal governments. Since 1952, a uniform data collection scheme has been implemented throughout Japan by specialized staff within the Ministry of Agriculture and Forestry. Thus, although the specific collection methodology has changed several times, information on wet weight has been compiled nationwide at the prefectural level using a uniform method since 1894. This framework for collecting information has continued uninterruptedly to the present day. It has been compiled in detail for more than 100 years across climate zones including both temperate and subarctic regions in the North West Pacific. The availability of such spatially and temporally unified long-term information is valuable on a global scale.
Since the 2010s, various changes, such as northward shifting of fishing grounds, have been observed in the coastal fishery resources of Japan. Are these changes part of cyclical fluctuations on a centennial timescale? Are these changes situations that we have never experienced? Are common factors included in the long-term variability among coastal fisheries resources? Analyzing past patterns of resource and environmental change from a long-term perspective using centennial-scale fishery statistics is an important step in adapting to future changes by understanding the relationship surrounding fishery resources. Information on coastal resources that are important to Japan provides valuable insights into the sustainability of coastal fisheries. Previous studies have analyzed patterns of change in catches over a centennial scale for single species or groups of fish (Hayakawa et al., 2007; Lassen et al., 2012; Shishidou et al., 2016). However, few studies have grouped the patterns of change over a centennial scale for multiple fish species/groups. The objective of this study was to understand the evolution of the long-term spatial distribution of catches of coastal fisheries resources in Japan using species- and prefecture-wise fisheries statistics, which are available on a centennial timescale in Japan. Then, we extracted and explored common trends involved in these fluctuations by fish species/groups using dynamic factor analysis, and examined the long-term trends and factors involved. We also discussed the possibility of using long-term statistical information for analysis.
Fishery statistics were obtained from data compiled by prefecture based on wet weight since 1894. Statistics from the Ministry of Agriculture and Commerce (–1925), the Ministry of Agriculture and Forestry (1926–1978), and the Ministry of Agriculture, Forestry and Fisheries (1979–) were used. These data were archived in electronic media at the National Diet Library Digital Collection (https://dl.ndl.go.jp/), the Ministry of Agriculture, Forestry, and Fisheries (https://www.library-archive.maff.go.jp/), and a portal site for Japanese Government Statistics (https://www.e-stat.go.jp/). Data were compiled for 38 of Japan’s 47 prefectures, excluding landlocked prefectures and Okinawa Prefecture. In some cases, the catch amount from the 1960s to the 1980s in some prefectures’ statistics includes catches from distant-water fisheries in addition to catches in the waters around coastal Japanese waters. Distant-water catches were excluded for fisheries statistics compiled by the Prefecture Agricultural Administration Office and Regional Agricultural Administration Bureau, which provide more detailed information at the national level of statistics by the Ministry of Agriculture, Forestry, and Fisheries. A unified data set exists for each year in each prefecture, even if the fish are caught in several types of fishing gear. In addition, catch per unit effort cannot be calculated from effort data because the information is not sorted by fishing gear used for each species.
There are three main relationships among the fishing vessel’s port of registry, the fishing ground, and the port of landing. (I) In the first case, the fishing ground and the landing port are in the same waters as the port of registry. This is the case for set-net fisheries, small boat fisheries, as well as shellfish and algae fisheries, as an example. (II) The second case is where fish whose distribution changes according to ocean conditions are scouted and caught, and then landed at a fishing port close to the fishing grounds. This is the case with large-scale purse seine fisheries, as an example. (III) The third case is where fish whose distribution changes according to ocean conditions are scouted and caught, and then landed at the port of registry as a base. This includes fishing vessels equipped with refrigeration equipment and target skipjack tuna, tuna, and Japanese common squid, as an example. Only in the first case (I), where the port of registry, fishing ground, and landing port are in the same waters, does the information in the prefectural level of fisheries statistics include the geographic distribution information of the fish species. Since various species of fish are caught using a range of fishing methods in Japan, only case (I) needs to be selected.
Japanese fishery statistics are compiled at the single-species level or in groups of several species. It is basically compiled based on the port of registry. However, from 1952 to 1963, the statistics were compiled based not on the port of registry, but on the port of landing. The following three criteria were used to select fish species/groups from long-term statistical data for analysis. (1) To use spatiotemporal information from the prefectural level of catch statistics, fish species/groups whose fishing grounds changed owing to migratory movements, such as small pelagic fish and highly migratory fish, were excluded. (2) Fish species/groups were selected taking into account operations where the port of registry and the port of landing are the same. This criterion selected cases corresponding to (I) mentioned above. (3) For the centennial analysis, fish species/groups that could be traced back to 100 years, prior to 1922, were selected.
The change in distribution of each fish species/groups for the whole scale of the Japanese archipelago was captured through the fluctuation of the geographical center of catch. For example, if the distribution of a fish species/groups shifts northward due to environmental factors, the amount of catch will decrease in western Japan and increase in northern Japan. The latitude and longitude of the geographical center of catch for each fish species per group and year were calculated. This approach incorporates the effects of environmental and stock fluctuations in terms of regional variations in the geographical center of catch. The geographical center of catch refers to the position of a point that horizontally supports the plane (region), considering the weight of the catch landed in a certain region as a geometric plane. This was obtained by measuring the latitude and longitude of the landing port and taking the weighted arithmetic mean of latitude and longitude. The geographical center of catch was calculated using the method described by Shishidou et al. (2016), and is expressed by the following Equations 1 and 2:
where Ci is the catch in weight in each prefecture, φi, λi are the latitude and longitude of each prefectural capital, , are the latitude and longitude of the geographical center of catch, and i indicates each prefecture. Since fisheries statistics were not compiled by each fishing port throughout the study period, the position of prefectural capitals was used instead as a proxy of the position of each fishing port. The latitude and longitude of the 38 prefectural capitals were collected from the Geospatial Information Authority of Japan (https://www.gsi.go.jp/common/000230936.pdf).
For the purpose of detailing recent years, the position of the geographical center of catch for 2019–2021 was compared with the mapped distribution of the position of the geographical center of catch for the entire period. The output of the geographic center of catch for each species/group is shown as a plot on a map.
To identify common factors or their temporal patterns, including potential, unobservable processes in a set of time series (‘common trends’), dynamic factor analysis (DFA) was applied for time series of the geographical center of catch among fish species/groups. DFA is a multivariate state-space model with reduced dimensionality (Zuur et al., 2003a, 2003b). It allows the detection of the fewest possible number of common trends from multiple time series with missing or non-stationary values, similar to a principal component analysis for time series data only. All data used in this study are shown in Appendix Table S1. All code is available from the Comprehensive R Archive Network and the Github, including the “bayesdfa” (https://cran.r-project.org/web/packages/bayesdfa/index.html) and “rstan” (https://github.com/stan-dev/rstan/wiki/RStan-Getting-Started) packages in R that were used for model estimation (Zuur et al., 2003a; 2003b; Ward et al., 2019; Litzow et al., 2020).
DFA allows the estimation of the common trend as an independent random walk, and to examine how multiple time series of catch gravities co-vary over time; parameter estimation for DFA was performed by Bayesian estimation (MCMC sampling). The common trends are defined by the following Equation 3
where xt,i indicates the value of the common trend i at time t and ωt,i indicates process error deviations. In this paper, we use a Bayesian version of DFA, which is more flexible than conventional DFA, especially in modeling extreme events. In the Bayesian version of DFA, process error deviations are assumed to have a multivariate distribution with identity covariance matrix, and can be modeled with a Student’s t-distribution or Gaussian distribution (Ward et al., 2019). In a DFA model, the estimated common trends represent a linear relationship with each observed time series data via factor loading, as following Equation 4;
where yt, Z, and et indicate all observed time series data at time t, factor loadings matrix, and residual errors at time t, respectively. If the factor loading of time series data against the i-th common trend is positive, then the pattern of observed variability is similar to that of the common trend (positive correlation); if it is negative, then the pattern of observed variability is reversed (negative correlation). By comparing factor loadings, one can identify which common trends are important for a time series or which time series data are related to a common trend. For more information regarding DFA, see Zuur et al. (2003b) and Ward et al. (2019).
The data period selected was 1894–2021, for 128 samples in the observed data of a species/group. In this study, the thinning rate was set to two to mitigate the effects of autocorrelation in the generated time series. That is, one out of every two random numbers generated in each Markov chain was thinned out and the simulation was run with the remaining samples. The number of trends to be generated during simulation was set to 1–3, and the number of parallel chains to two. The iterations for each chain were set at 5,000, and that estimation was conducted with 2,500 samples for the warm-up period, followed by 2,500 iterations for the sampling period. The observation error deviations were assumed to have equal variance, and the process error deviations were set to Gaussian or Student’s t-distribution. We modeled six cases in total: three cases based on the number of trends to be detected, coupled with two cases based on the assumed distribution of the process error.
Of these six models, we selected the best available model that encompassed common trends that could explain the time series pattern of variation in the geographical center of catch. We used a two-step approach to model selection. First, we assessed model convergence using the criteria (Gelman et al., 2014; Ward et al., 2019), inspected chain trace plots and monitored the minimum effective sample size for the estimated parameters. The non-convergent models were removed from the candidates for model selection. Next, we conducted model selection using leave-one-out cross-validation information criterion (LOOIC; Vehtari et al., 2017) on the converged models. The model with the lowest LOOIC value in the converged model (“best model”) was considered to have the best predictive capacity.
The relationship between common trends extracted by DFA from the geographical center of catch variation and ocean environmental information was evaluated. In the waters around Japan, the relationship between long-term stock fluctuations and the ocean environment has been analyzed through climate-related indicators for small pelagic fishes and squids (Sakurai, 2007; Takasuka et al., 2008). The relationship with the ocean environment was also examined in coastal resources. Among the climate-related indicators for the ocean environment, we included the Pacific Decadal Oscillation (PDO) index, the SST, and regime shift, which are considered to affect environmental factors on a wide scale around Japanese waters and for which data are available on a centennial time series. Data for the PDO and the SST were obtained from the Japan Meteorological Agency (https://www.data.jma.go.jp/kaiyou/shindan/index.html). The periods of regime shift, the significant and systematic transition from one quasi-stationary climatic state to another in the SST field in the Northern Hemisphere, were classified according to Minobe (2002); Yasunaka and Hanawa (2002); Jo et al. (2013), and Shishidou et al. (2016) as follows, 1914/15, 1925/26,1945/46, 1957/58, 1970/71, 1976/77, 1988/89, 1998/99. The relationship between each trend and the marine environmental factor of the continuous variables, i.e., the PDO and the SST, were evaluated.
Sequential t-test analysis of regime shift (STARS) was applied to detect the timing of step changes in the time series trends extracted by DFA (Rodionov, 2004). In STARS, the shift to be detected is controlled primarily by the cut-off length and probability level. The probability level was set to 0.05. The number of cut-off lengths was chosen so that there were gaps of 8 or more, consistent with the number of regime shifts described above from each trend. The detected step changes in time series trends and the years of regime shifts were compared. The “rshift” package in R was used for STARS analysis (https://github.com/alexhroom/rshift). We also assessed whether the time series gaps coincided with periods of regime shifts. Since the year in which a regime shift occurs may differ by one or two years depending on the indicator used, we examined whether a gap would appear over a period of one year before and after the year in which it occurred (Minobe, 2003).
For the 128-year period covered in this study, a total of 124 species/groups were compiled in the fisheries statistics. Some of these were compiled for only a part of the 128-year period, whereas others were compiled for the entire period. Of these, 12 of the fish species or groups were selected to obtain spatiotemporal information from landings, by prefecture. These included three fish, four shellfish, two algae, and three aquatic invertebrate species/groups. Among them, the Japanese spiny lobster (Panulirus japonicus), turban shell, and mullet (Mugil cephalus cephalus) were the only species for which statistics were available on a single species basis, whereas the other nine consisted of multi-species groups. In 2007, there was a revision in the statistical coverage of the survey; data on eight species/groups have continued to be compiled, although only four species/groups were compiled through 2006. The details of the 12 species/groups and the duration for which this data was available are shown in Table 1. The geographical center of catch for each species/group by year is shown in Appendix Table S1.
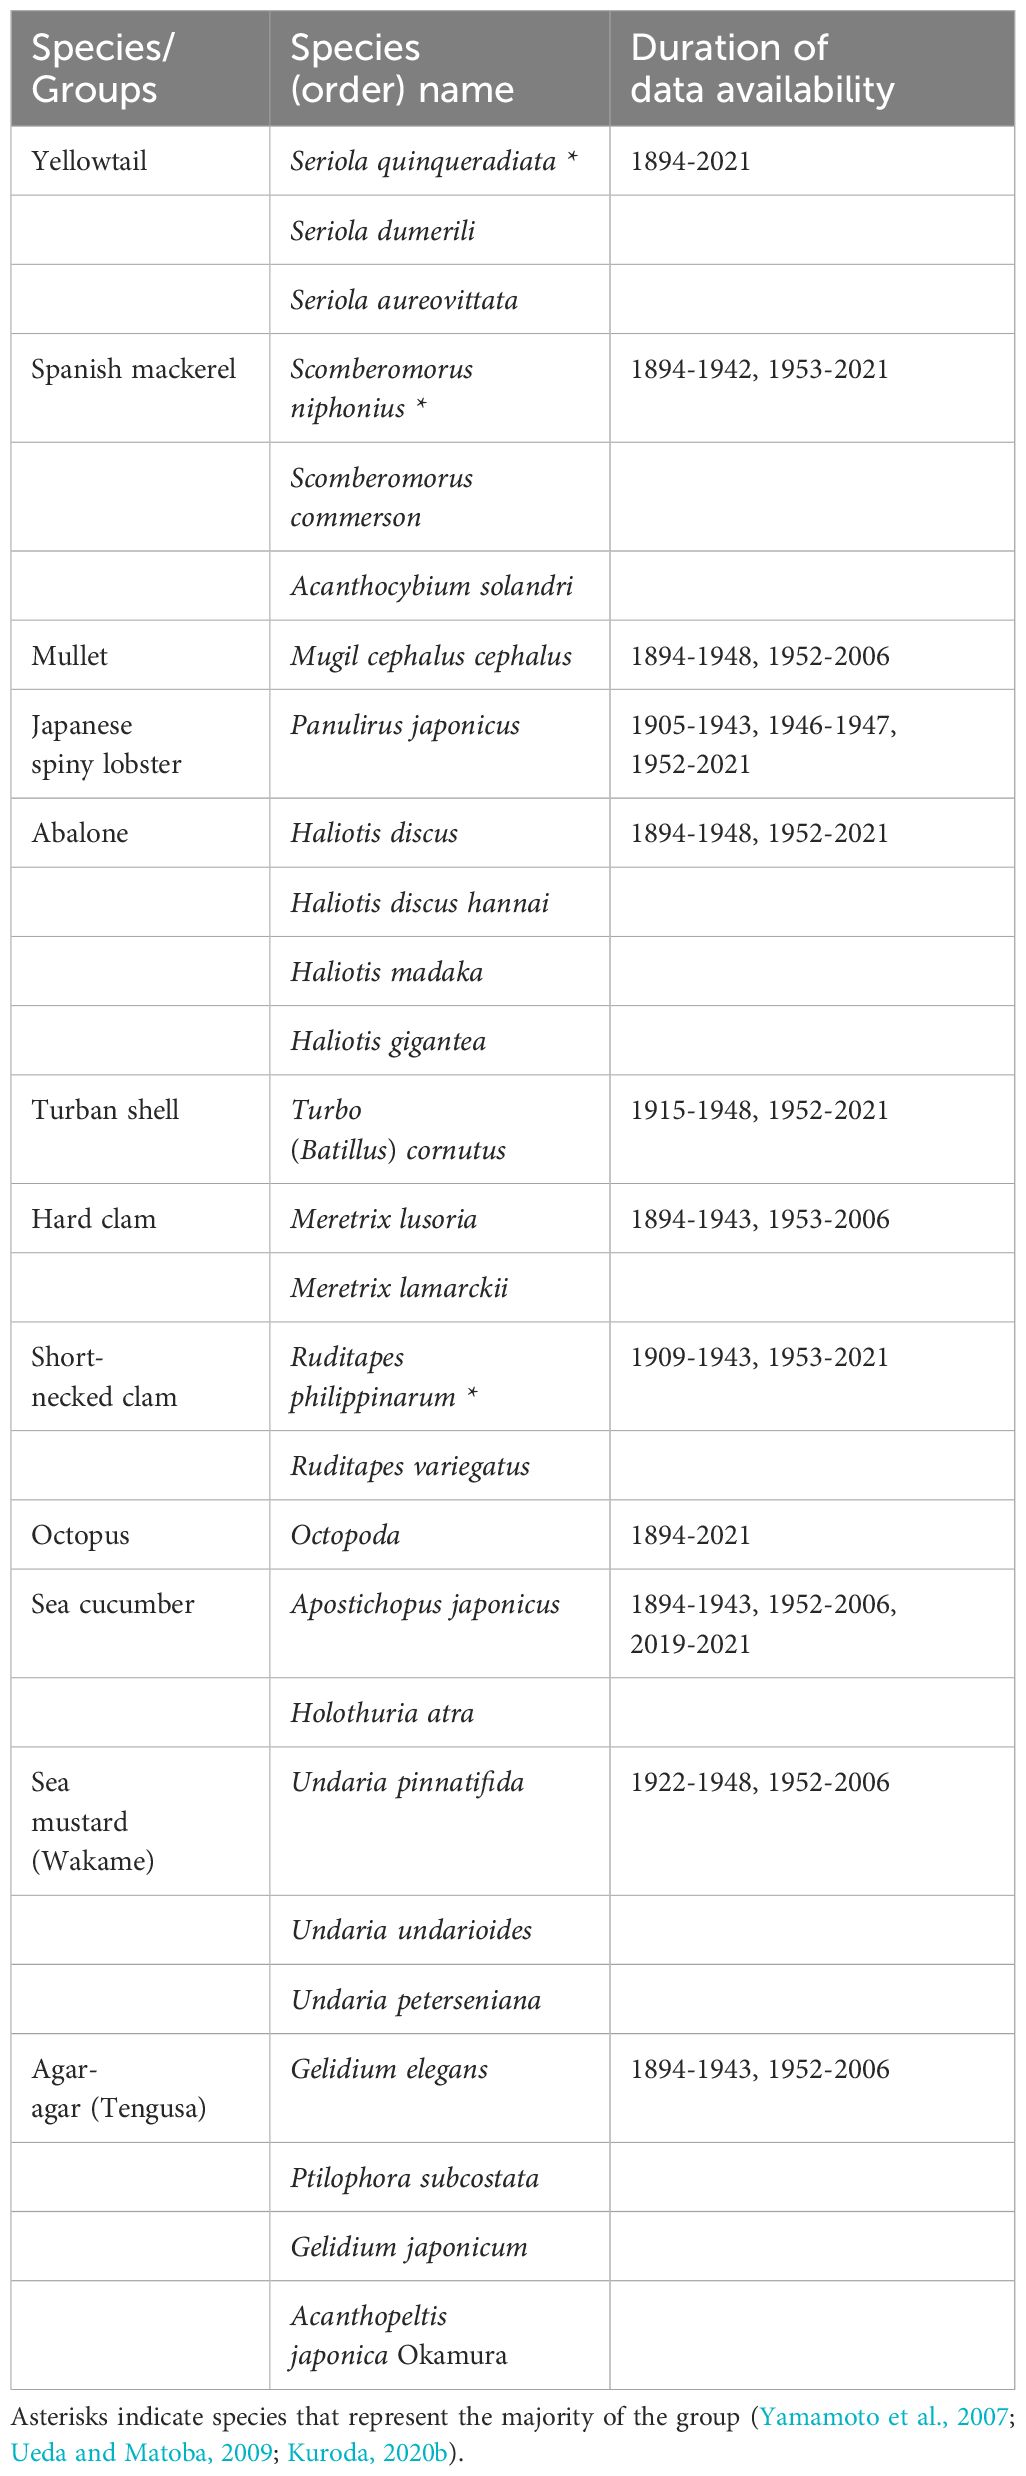
Table 1 Species included in each of the 12 statistical species/groups and the time period for which statistical data are available.
The time series of latitudinal and longitudinal variations in the geographical center of catch are shown by red dots in the plots in Figure 2. Some species, such as yellowtail and turban shells, show cyclic fluctuations, whereas others, such as octopus, show a consistent northward and eastward trend. The annual variation in the time series also included clear visual drops and gaps in latitudinal and longitudinal variations in some species. Plotting the geographical center of catch on the map, some of the species were located over the Seto Inland Sea, some were located over the Ise Bay and Mikawa Bay, and others were located over the Noto Peninsula (Figure 3). In the figures, the geographical centers of catches were color-coded by years. Histograms by latitudinal and longitudinal range are included to illustrate interannual variation in more detail. Information on 8 of the 12 species/groups was available in the most recent years, specifically, 2019–2021. Of these, invertebrates and fish other than shellfish were positioned on the most northeastern margin of the geographical center of catch distribution in the past 100 years as indicated by red crosses in Figure 3.
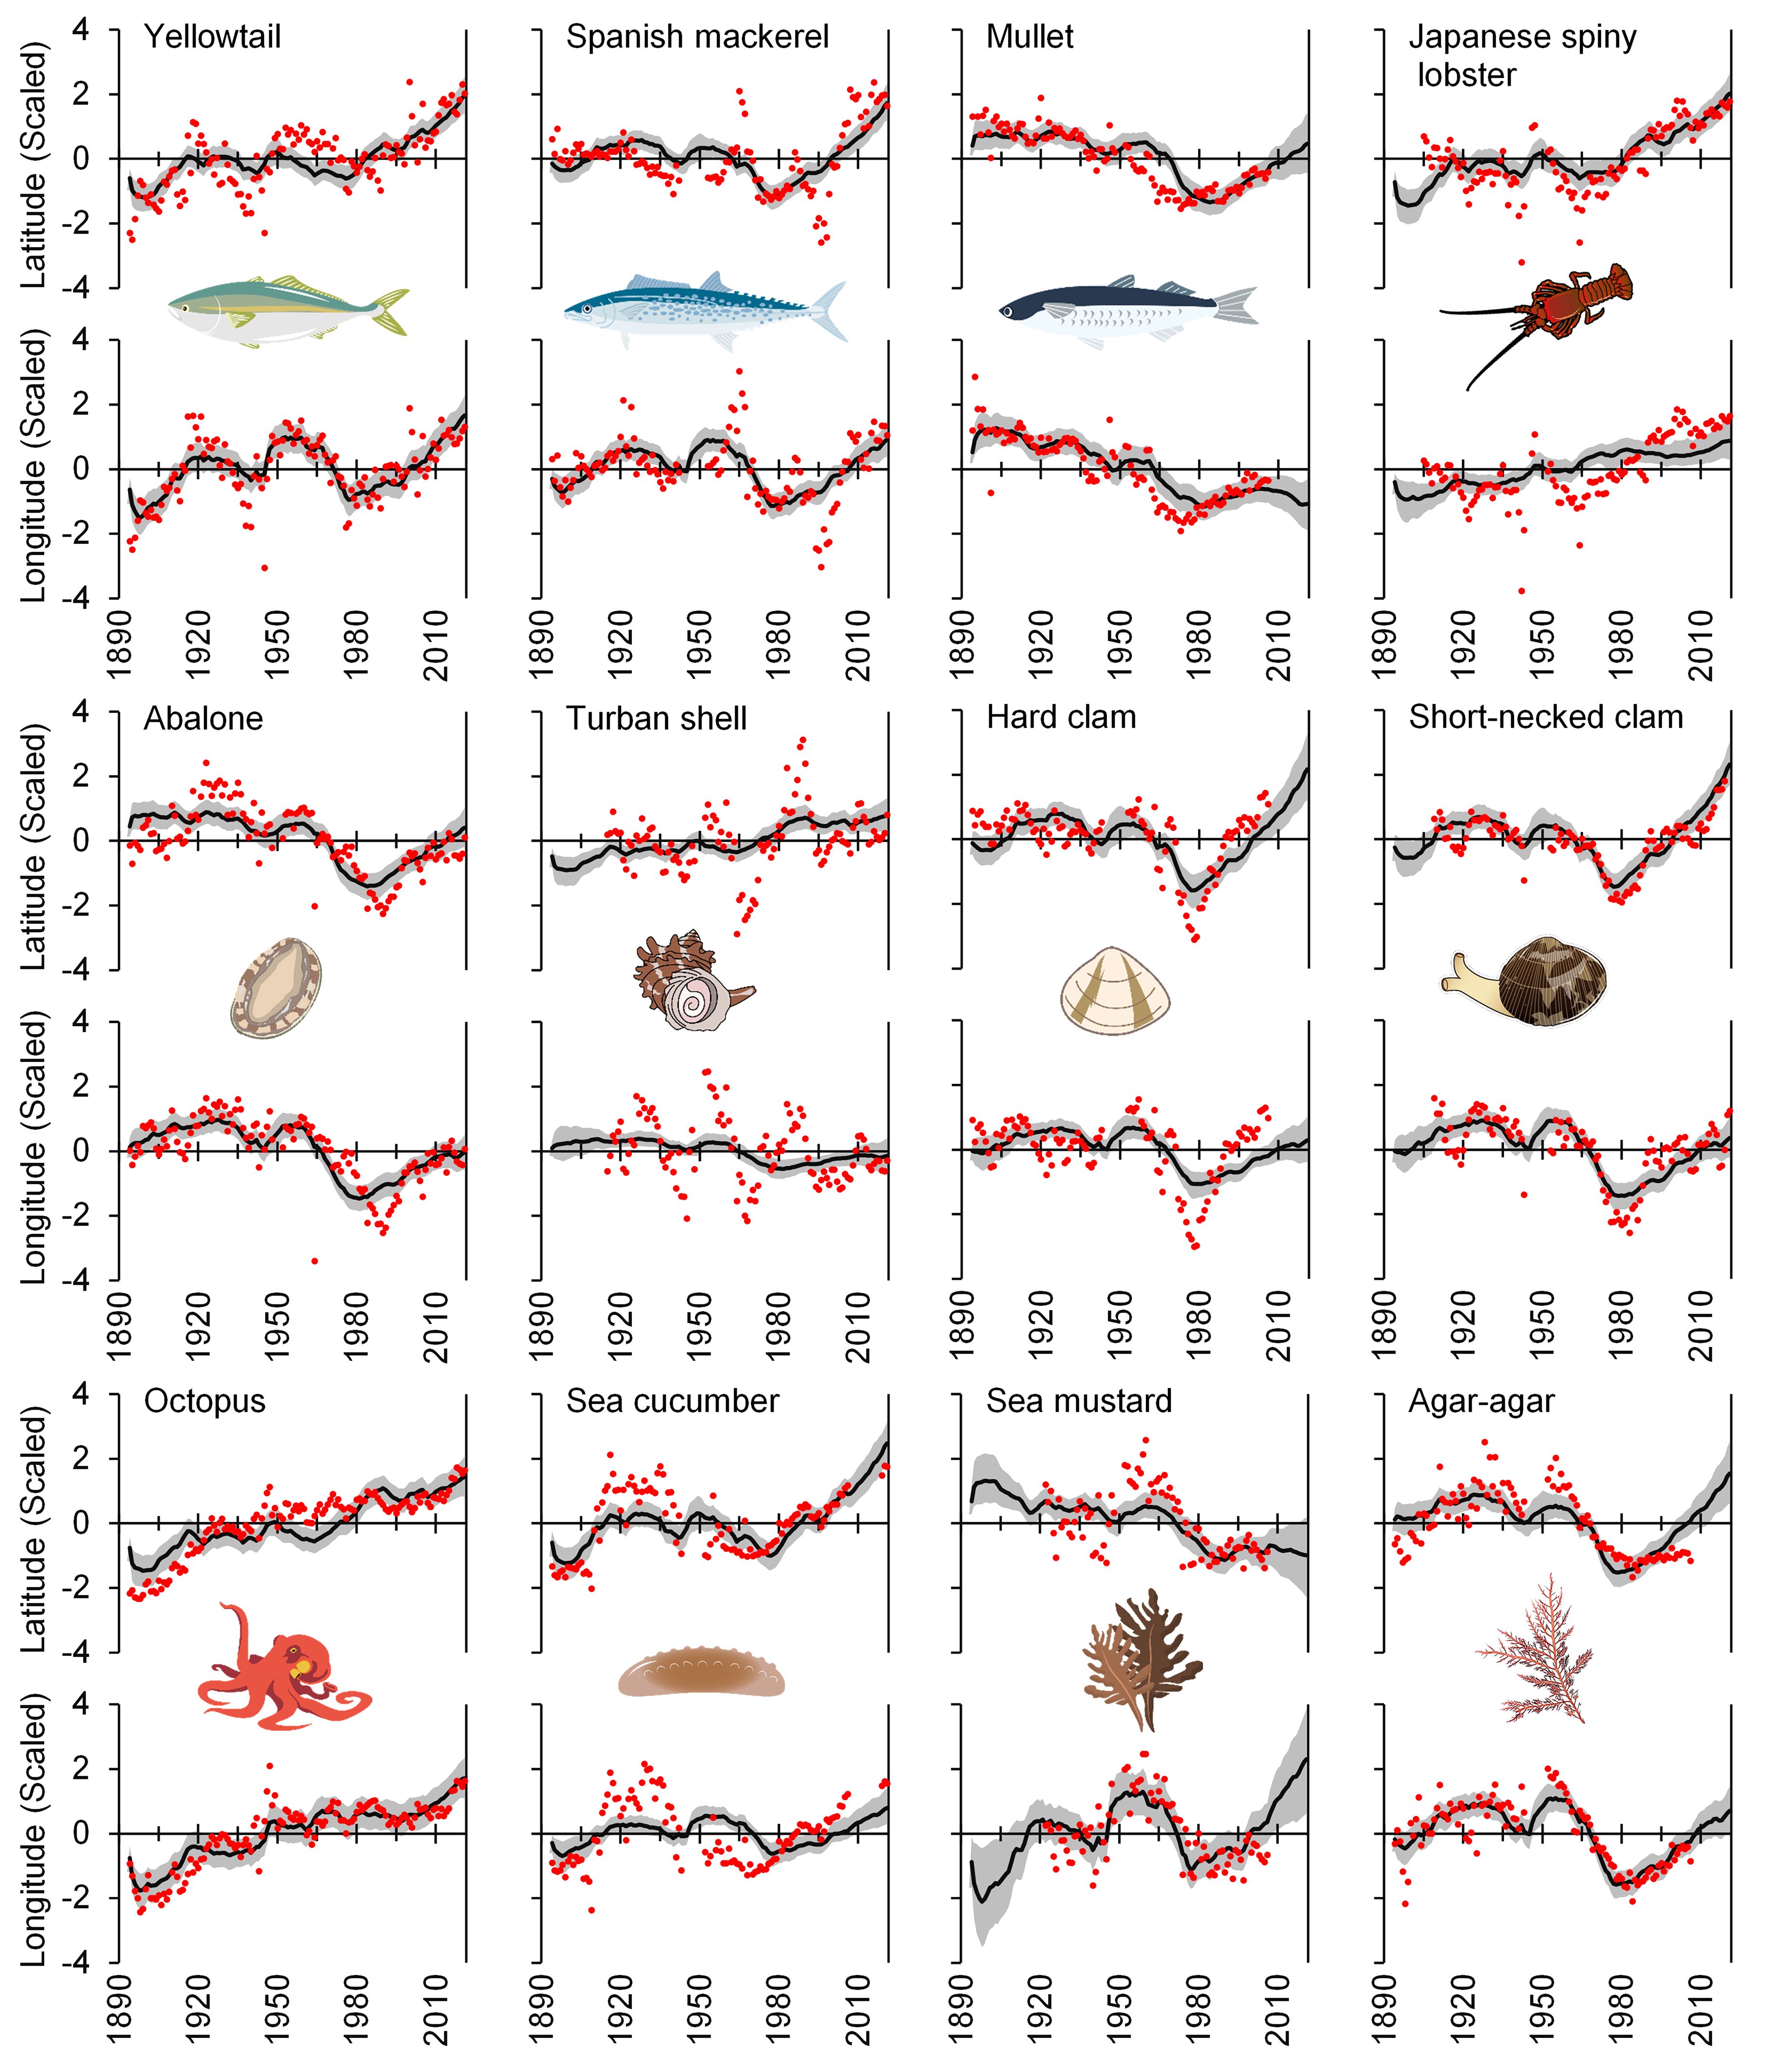
Figure 2 Fitted values obtained by the DFA model (model lat-5, lon-5) containing two common trends of the 12 statistical groups. The black lines and gray bands represent the mean values and 95% confidence intervals of fitted values, respectively; red dots represent the observed values.
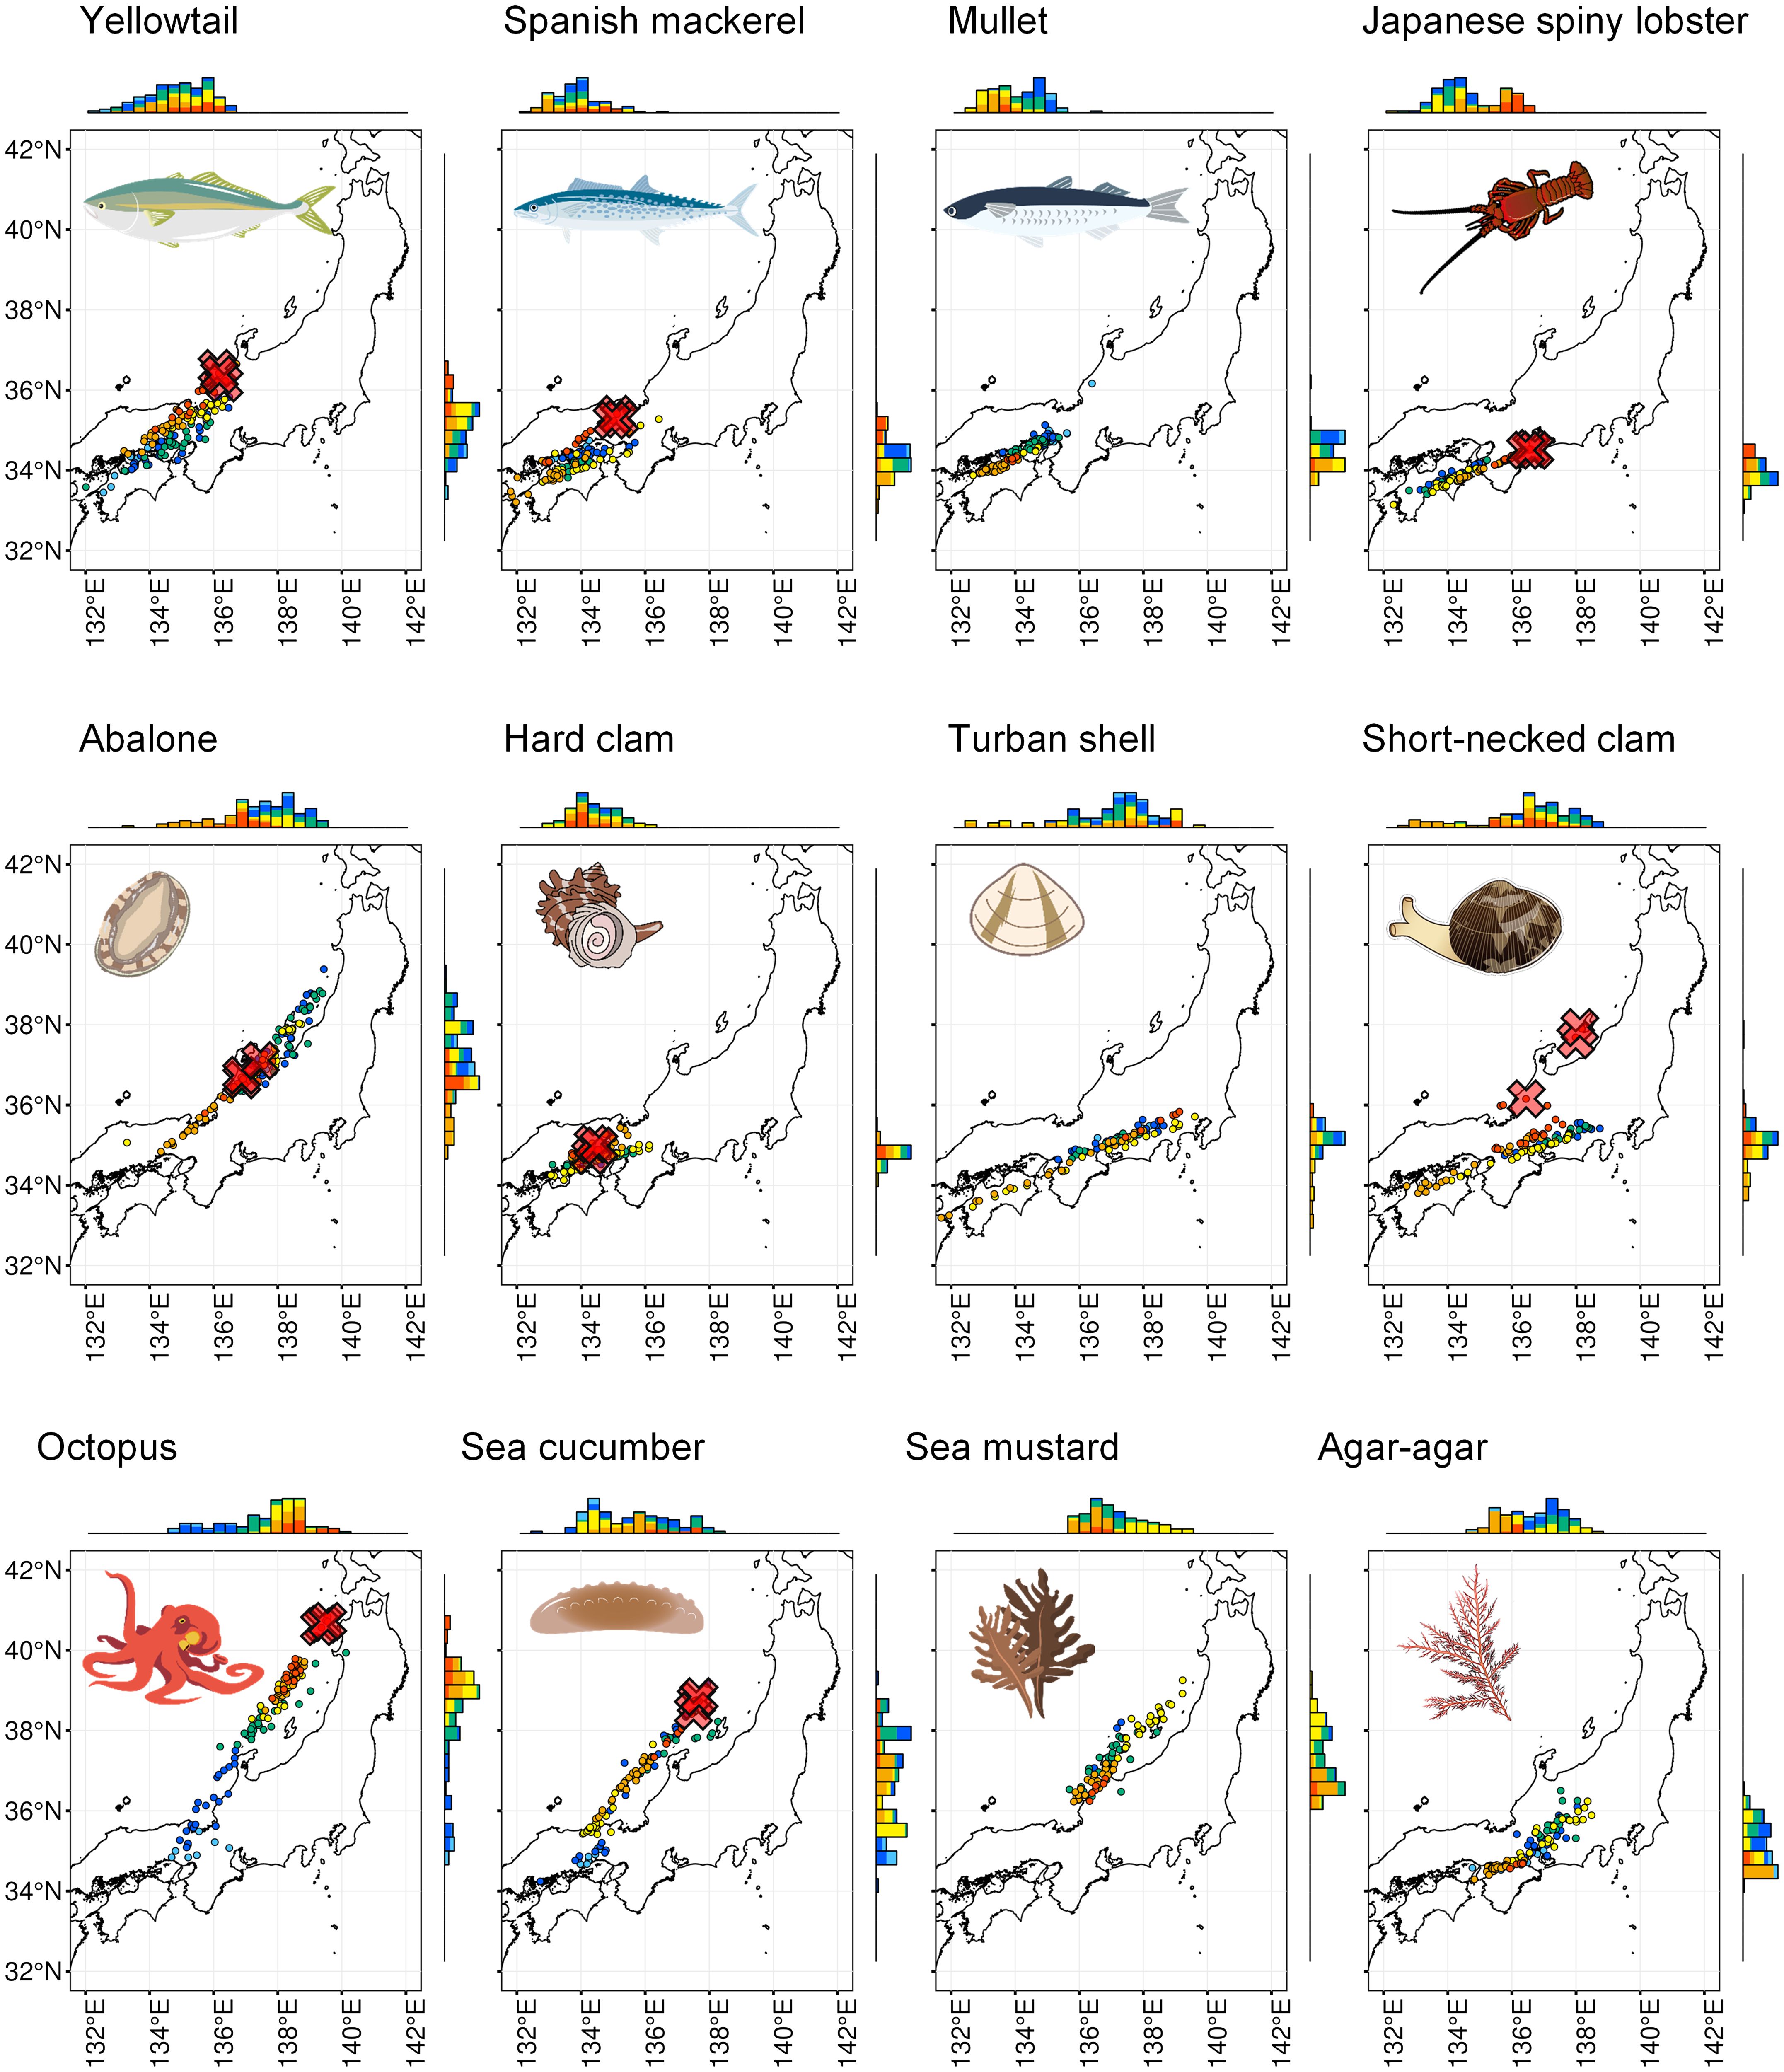
Figure 3 Latitude and longitude of the geographical center of catch of the 12 statistical species/groups on the map. Circles indicate the position of the geographical center of catch, and different colors indicate different years (light blue: 1894–1900, blue: 1901–1925, green: 1926–1950, yellow: 1951–1975, orange: 1976–2000, red: 2001–2021). Red crosses indicate the geographical center of catch for 2019–2021. Histograms show the number of plots of geographical center of catch by years included in the latitudinal or longitudinal range.
The best DFA model for both latitude and longitude included two common trends, with the observation error assumed to be a normal error distribution (Table 2; Model lat-5, lon-5). Models with the number of extracted trends of 3 (model lat-3, lon-3 and model lat-6, lon-6) did not converge (Table 2). We removed these models from candidate for the best model. Both the lat-5 and lon-5 models have two common trends. We refer to these as Trends 1N and 2N for model lat-5, and Trends 1E and 2E for model lon-5 (Figure 4; Appendix Table S2). At standardized latitudes, a change in the negative direction indicates a southward shift and a change in the positive direction indicates a northward shift. The first common trend in the latitude direction, Trend 1N, shows a southward trend throughout the period, with cyclic fluctuations. The second common trend in the latitude direction, Trend 2N, remained flat with multiple amplitudes until the 1960s, showed a northward trend from the 1960s to the 1980s, and a southward trend after the 1980s. At standardized longitude, a change in the negative direction indicates a westward shift and a change in the positive direction indicates an eastward shift. As discussed in detail below, more than half of the factor loadings are negative values in the latitudinal direction (Table 3). To interpret this result, the north-south relationship must be inverted. In Figure 4, the vertical axis has been inverted to illustrate the same north-south trend of variation as the observation plots in Figure 2 for a better visual interpretation. The upward trend in Trends 1N and 2N indicate northward variation in Figure 4. The first common trend in the longitudinal direction, Trend 1E, remained flat with multiple peaks and troughs until the 1960s, showed westward between the 1960s and 1980s, and moved eastward again after the 1980s. The second common trend in the longitude direction, Trend 2E, remained flat with multiple peaks and troughs until 1960, moved rapidly westward from 1960 to 1980, and maintained a westerly position after the 1980s.
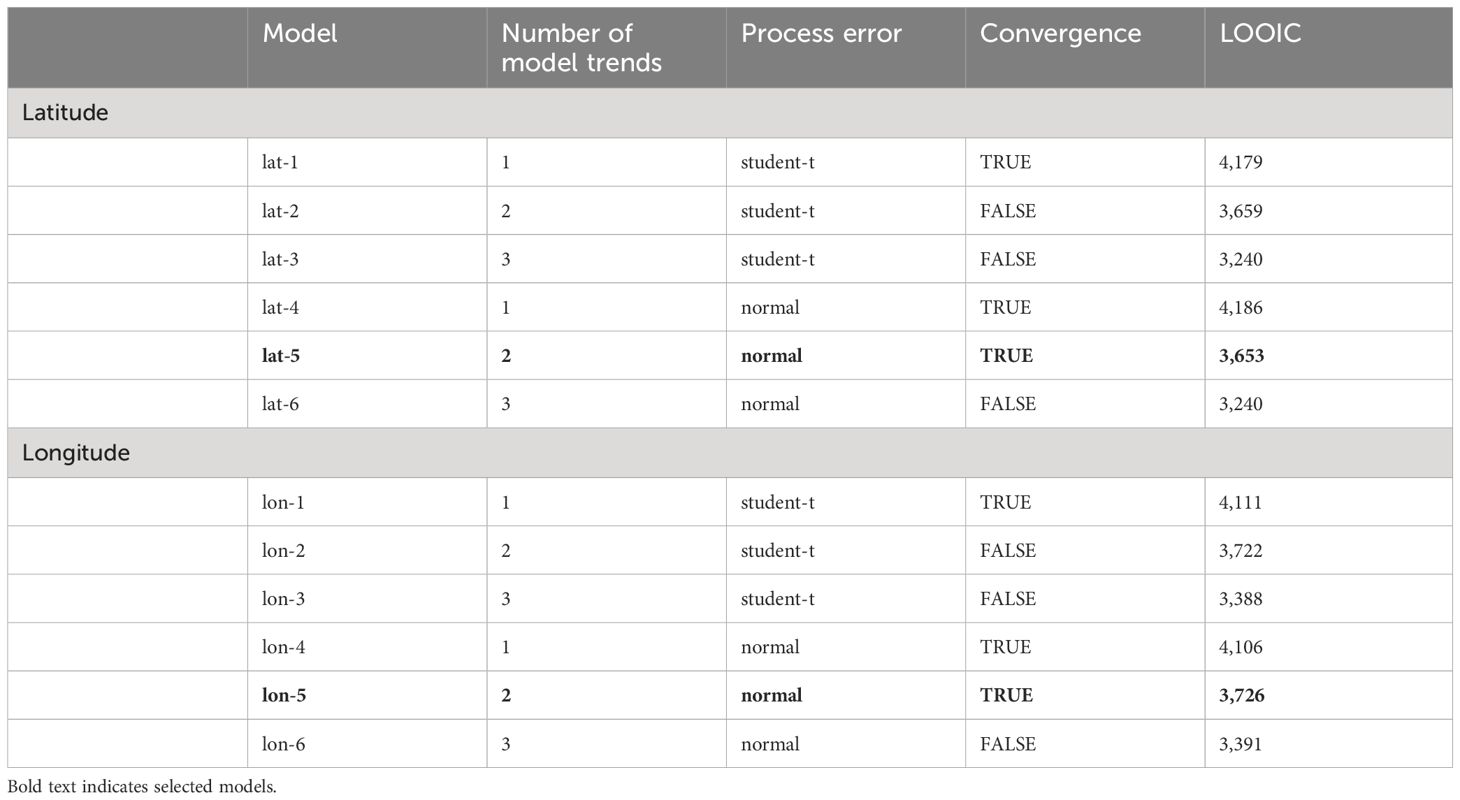
Table 2 Summary information for Dynamic Factor Analysis (DFA) models, including whether process error was normal or student-t, the number of model trends, whether convergence was true or false, and lowest leave-one-out cross-validation information criterion (LOOIC) value.
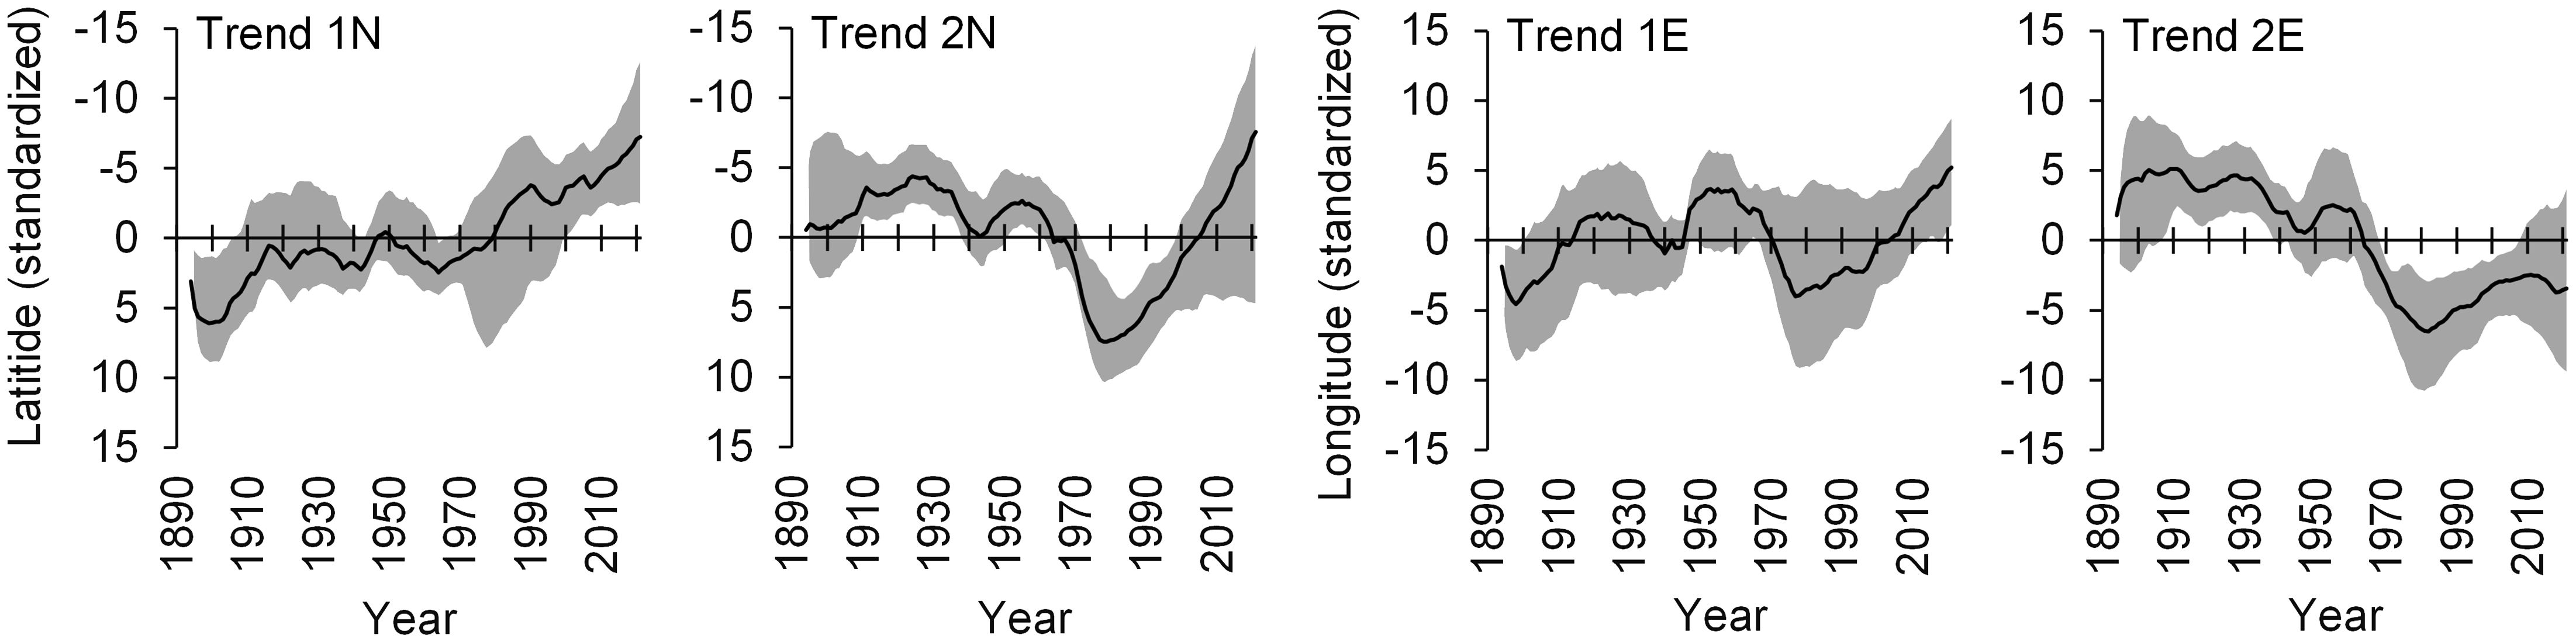
Figure 4 Common trends obtained for geographical center of catch. The gray bands indicate 95% confidence intervals. Trends 1N and 2N, and 1E and 2E, indicate the first and second common trends in the latitudinal and longitudinal directions, respectively. For Trends 1N and 2N, the positive and negative values of the vertical axis were inverted for ease of interpretation, since many species have negative factor loadings.
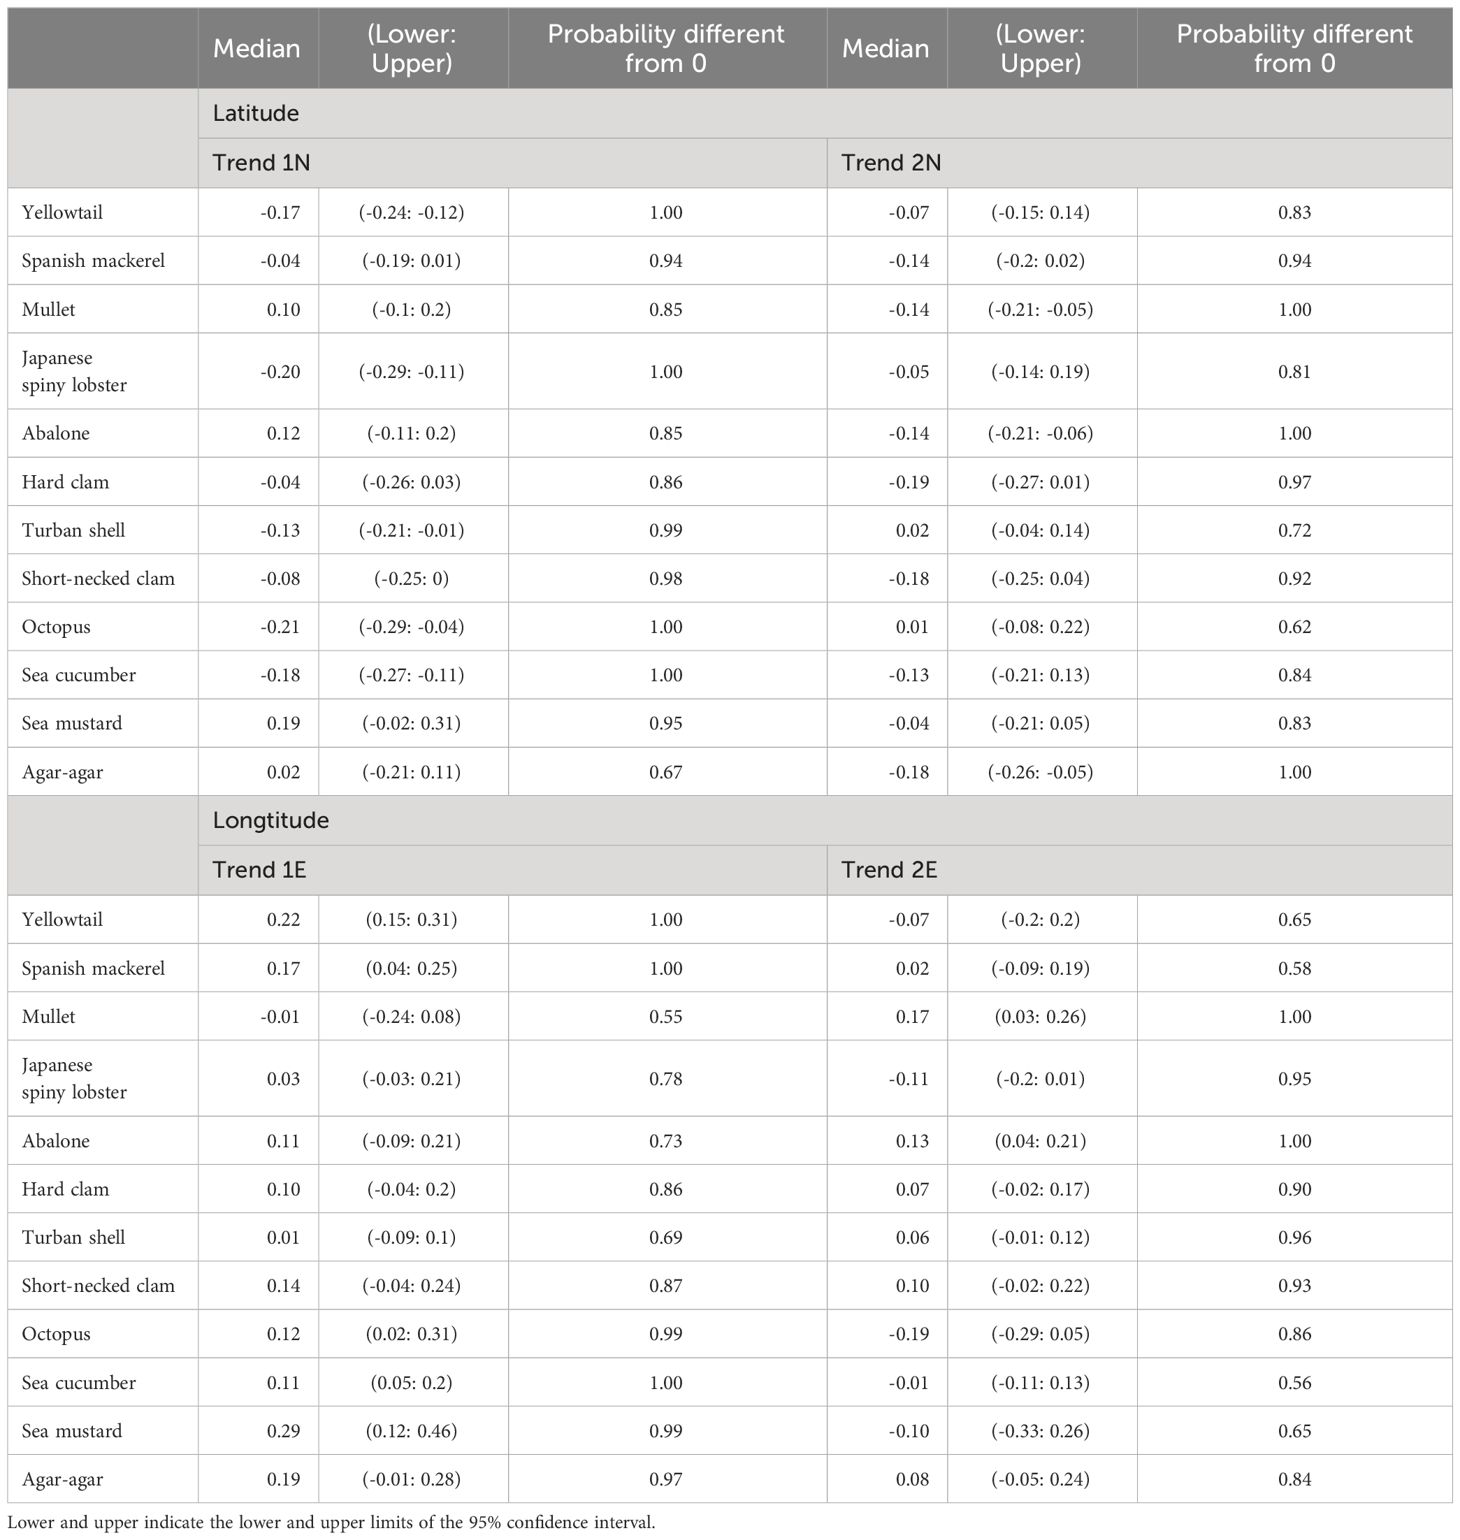
Table 3 Median, lower, and upper values of factor loadings, and probabilities different from zero for the 12 statistical species/groups.
After model selection, the fitted value of the time series change in the geographical center of the catch of each fish species/group (see Figure 2) was calculated from the first and second common trends and the factor loadings from the best model. The mean values and 95% confidence intervals for fitted values of the time series were calculated based on estimates from simulations that were run for each of the two chains, with 2500 iterations (sampling period) in the best model. Comparing the calculated mean and 95% confidence intervals (0.025–0.975 percentile range) of the fitted values of the time series change for each fish species/group in the best model with the observed values, the time series patterns in the 12 fish species/groups from the best model appeared to roughly represent that of the observations. The combination for two common trends and the factor loadings defines the direction of time series variation of the geographical center of catch. The factor loadings for each trend for each species/group were generally negative values, with a median value of 4 positives and 8 negatives for Trend 1N and 2 positives and 10 negatives for Trend 2N. The median values for Trend 1E were 11 positives and 1 negative, and for Trend 2E were 7 positives and 5 negatives, indicating generally positive values (Table 3). Since the 1980s, the latitudinal direction has shifted northward and the longitudinal direction eastward. The relationship of each trend to PDO and SST was fitted linearly. PDO was only significant at longitude Trend 1E (r = 0.31, p< 0.001), whereas SST was significant at latitude Trend 1N (r = 0.73, p< 0.001) and longitude Trends 1E (r = 0.19, p< 0.05) and 2E (r = 0.57, p< 0.001) (Figure 5). In Figure 5, the vertical axis of Trends 1N and 2N are also inverted for easier interpretation, as in Figure 4. The upward trend in Trends 1N and 2N indicate northward variation in Figure 5.
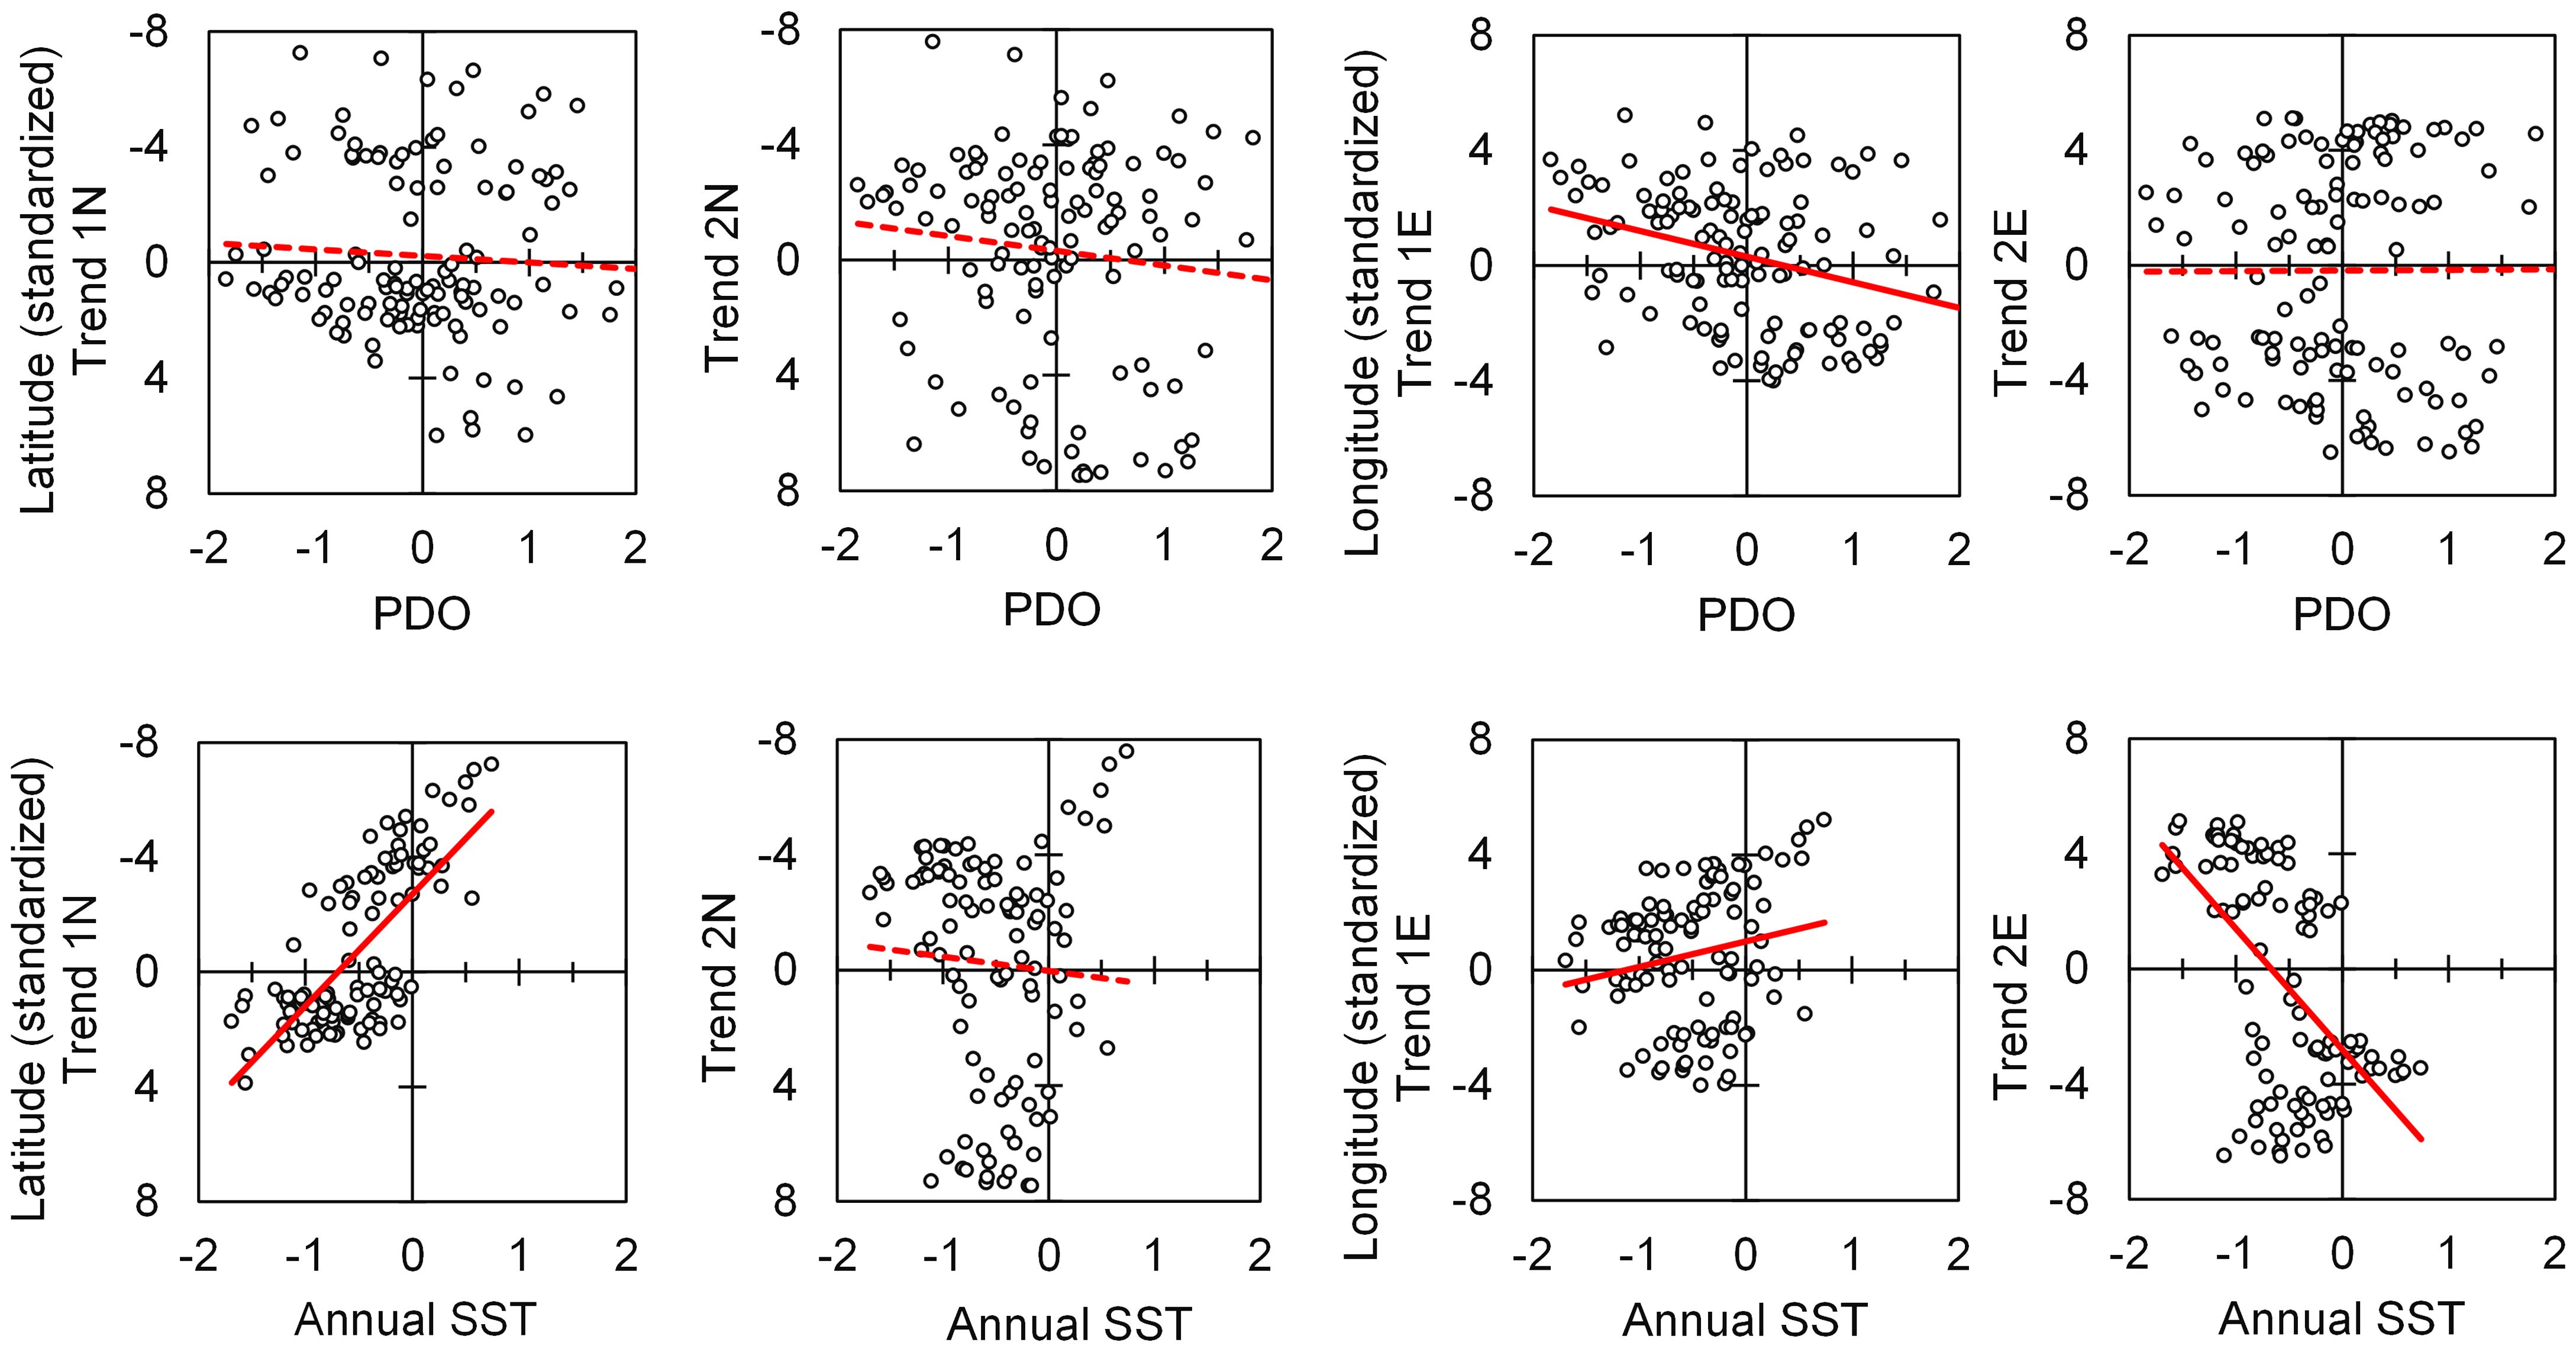
Figure 5 Relationship between trends extracted by DFA and sea surface temperature (SST), the Pacific Decadal Oscillation index (PDO). The red line indicates the regression line, the solid line indicates a significant slope, and the dotted line indicates no significant difference. For trends 1N and 2N, the positive and negative values of the vertical axis were inverted for ease of interpretation, since many species have negative factor loadings.
In STARS, 13 cut-offs resulted in more shifts than the eight regime shifts observed during the entire period. Within the range of observed regime years plus or minus one year, shifts were observed in seven periods except 1925/26 in the latitudinal direction and in six periods except 1925/26 and 1957/58 in the longitudinal direction (Figure 6). Trends 1E and 1N coincided with 6, Trend 2E with 5, and Trend 2N with 4 periods of regime shift. In periods other than the common regime shift observation years, shifts were observed in 1936/37 and 1962/63 in both the latitudinal and longitudinal directions.
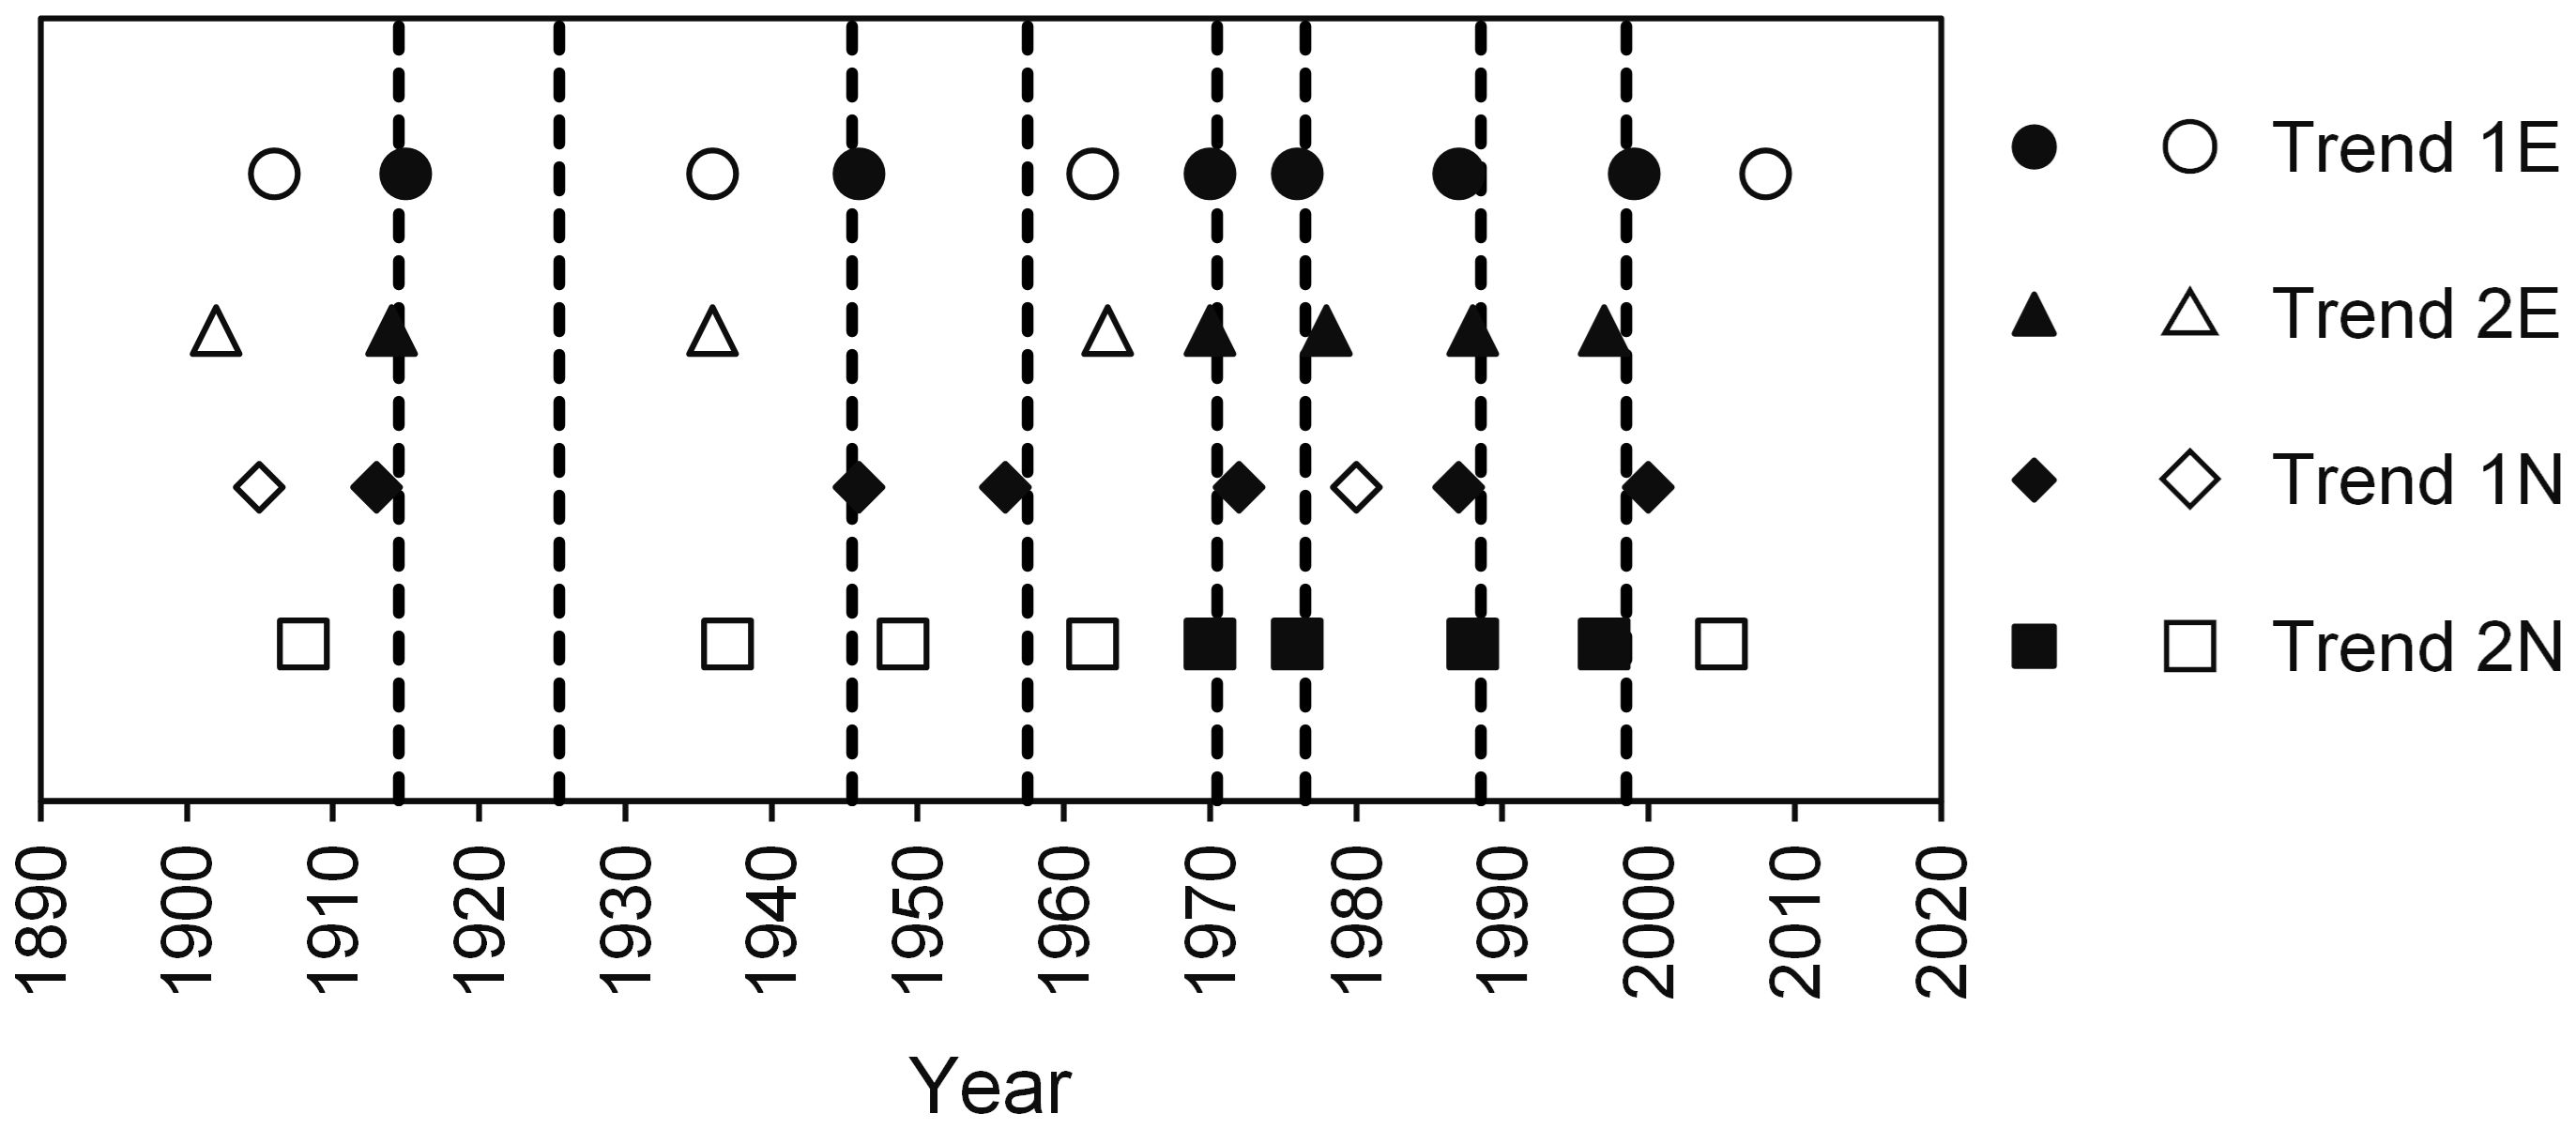
Figure 6 Regime shifts detected by sequential t-test analysis of regime shift (STARS) are shown as Trends 1E (circles), 2E (triangles), 1N (diamonds), and 2N (squares). Vertical dotted lines indicate the timing of regime shifts period. Matching cases with observed regime shifts are shown in black, and non-matching cases are shown in white. The periods of regime shift were classified according to Minobe (2002); Yasunaka and Hanawa (2002); Jo et al. (2013), and Shishidou et al. (2016).
Itoh (1961) analyzed paleo-documents and found that landing of small pelagic fishes, such as the Japanese sardine and herring (Clupea pallasii), which are thought to correspond to the abundance of these species, has fluctuated cyclically since the 16th century on a scale of several hundred years. This approach has many implications for the global oceanic environment and fishery resource variability. For example, in some areas of Chiba Prefecture, the records of trades of Japanese sardine by processors have been available for hundreds of years (Yamaguchi, 1957; Itoh, 1961). Other approaches to assess long-term stock fluctuations include one that revealed millennial-scale fluctuations in Japanese sardines and anchovies based on the number of scales contained in the sediment core (Kuwae et al., 2017). Another approach is to evaluate the ecological variability in the Western North Pacific based on an analysis of the biomass of the stomach contents of top predators (Yonezaki et al., 2015). Although detailed information is available for these specific areas, long-term information is not available on a spatial scale for Japan as a whole. On the other hand, stock assessment or fisheries biological information are overwhelmingly available from the latter half of the 20th century, even for countries other than Japan. This timescale is too short to understand the long-term relationship of these species with the ocean environment (Christensen et al., 2003). This study was positioned as an analysis of centennial scales between the decadal period and several hundred years. In Japan, this is the longest timescale that can be spatially covered around the country, to which a large number of fish species can be compared.
A total of 12 species/groups were selected based on the criteria of continuity and availability of statistical information (Table 1). These are fisheries statistics at the national level, and minor species that are caught only in certain areas are not included. All of the species/groups selected for analysis in this study have been used as fishery targets in Japan since ancient times (Yamaguchi, 1957). Although the species/groups covered by the statistical data have changed over time, they have been included in the statistics for more than 100 years, indicating that these species/groups continue to be important fishery resources in Japan.
The yellowtail, Spanish mackerel, and short-necked clam groups contain multiple species in the statistical classification. That said, the majority of these groups consist of one species, namely, Seriola quinqueradiata for yellowtail (Yamamoto et al., 2007), Scomberomorus niphonius for Spanish mackerel (Ueda and Matoba, 2009), and Ruditapes philippinarum for clams (Kuroda, 2020b). Therefore, the variation in these groups is considered equivalent to that of a single species. However, in the case of abalone, the statistics are a mixture of the northern species Ezo abalone (Haliotis discus hannai) and southern species disk abalone (Haliotis discus) and mega abalone (Haliotis madaka) (Taki et al., 1999). The hard clams group is a mixture of inner Japanese hard clams (Meretrix lusoria) and other open-sea hard clams (such as Meretrix lamarckii) (Taki et al., 1999). In case the fluctuation in the geographical center of catch is different for each species, then the transition in the geographical center is observed as a mixture variation. This is an inherent limitation of the use of this statistical information. Nevertheless, the general public can view abalones or hard clams as an aggregate of multiple species. This approach may be considered a trend of marine products such as seafood with which the general population is familiar rather than a biological species-level analysis.
The geographical center of catch is distributed in a southwest to northeast direction, owing to the shape of the Japanese archipelago. The entire plots of the geographical center of catch are generally linear, with differing slopes among fish species/groups (Figure 3). The slopes of the plots are steep when landings are high in northern Japan, because changes in landings between regions mainly relate to changes in the geographical center of catch in the latitudinal (north-south) direction (e.g. octopus and sea cucumber in Figure 3). In contrast, the slope of the plots is moderate for species that are mainly distributed in the temperate zone, because changes in landings between regions mainly relate to changes in the geographical center of catch in the longitudinal (east-west) direction (e.g. mullet and turban shell in Figure 3). The position of the geographical center of catch has not remained at the same position for the past 100 years, indicating that the regional catch in Japan as a whole has continuously fluctuated over time. In addition, many fish species for which statistics were available from 2019 to 2021 have been located on the northeastern margin of the geographical center of catch range since the end of the 19th century (e.g. yellowtail, octopus, and sea cucumber in Figure 3). The situation for coastal fisheries resources was also considered to be even more extreme than in the past 100 years in terms of geographical center of catch.
The result of DFA shows variation in the time series of the geographical center of catch for each species/groups was decomposed into two trends, both in the latitudinal and longitudinal directions. Trend 1N and Trend 1E were correlated with SST, and Trend 1E was correlated with PDO. The periodic changes included in Trend 1N and Trend 1E were consistent with seven of the eight oceanic regime shifts that appeared during the period, with the exception of 1924/25. This relationship to changes in environmental factors is likely because the first common trend consists of factors related to the global ocean environment. This suggests that the global environment is influencing changes in regional catches extracted by the geographical center of catches. The annual average SST around Japan has risen by +1.24°C over the past century, exceeding the corresponding figure for the global ocean (+0.60°C) (Japan Meteorological Agency, 2024). Long-term increasing SST have been indicated to affect the habitat and distribution of marine creatures around Japan (Yamamoto, 2003a; Takao et al., 2015). SST plays an important role in determining the availability of coastal fisheries resources in Japan. Moreover, an analysis of the geographical center of catch identified factors that are related to the first common trend both in the latitudinal and longitudinal directions. In the latitudinal direction, SST and Trend 1N were significantly correlated, with a combination of common Trend 1N and negative values of factor loadings showing a shift from south to north in accordance with SST increase (Figure 5). The shift in demersal species distribution with increasing sea water temperatures involves a vertical shift to deeper cooler water and a horizontal shift northward (Deutsch et al., 2015; Kakehi et al., 2021). Many of the fish species selected in this study are inhabited and exploited in coastal waters (Nose et al., 1989). As SST increased, the distribution areas of fish species/groups shifted horizontally and the location of fishing grounds moved northward, which is thought to have led to a northward shift in the geographic center of catches based on prefectural level of catch. This can be interpreted as a trend of continuous change in the geographical center of catch from western to northern Japan over the past 100 years. Hu et al. (2022) conducted a study on the sea area around East Asia and analyzed fishing ground location information, which showed a northward shift in the distribution of fish species. Dimarchopoulou et al. (2022) used the mean temperature of the catch (MTC) index to analyze changes in the distribution of fish species. MTC index involves the determination of the average temperature preference of fished species weighted by their contribution to annual catches. Although these approaches differ from geographical center of catch, they capture a common phenomenon in that they represent a northward shift in the distribution of marine creatures. The extraction of such components is also consistent with the description of poleward shifts of marine creatures due to global warming along the coasts of the world (Melbourne-Thomas et al., 2022; Wernberg et al., 2024). In contrast, Trend 1E showed a response to environmental changes, including both PDO at the northwest Pacific level and SST at the local Japan level. Tokeshi et al. (2021) suggested that the catches of coastal fish, invertebrates, and algae in western Japan may fluctuate over the long term, due to the influence of long-term oceanographic changes on the North Pacific scale. Additionally, oceanic-scale climatic changes have been observed to affect abalone and turban shell stocks (Hayakawa et al., 2007). Because coastal resources are found in shallow waters, they are likely to be directly affected by Pacific-scale climate changes through the sea surface, suggesting that these resources may be synchronized over a wide area. This finding is consistent with the findings of past studies which indicated that the ocean environment influences long-term changes in coastal resources (Hayakawa et al., 2007; Tokeshi et al., 2021). Therefore, the first common trend suggests that, although both the latitudinal and longitudinal directions are elements of the ocean environment, the elements contributing to fluctuations differ. There are methods in DFA to incorporate environmental covariates such as SST and PDO into the observed model (Zuur et al., 2003b). In this study, we did not consider environmental covariates, but attempted to extract common trends in a simple DFA model to identify common trends. One of the future issues that should be addressed is to incorporate environmental covariates into the DFA model in detail.
A significant positive relationship was observed between SST and Trend 2E. However, this is not a linear decreasing trend as in Trend 1N shown in Figure 4, but rather, a step-like variation. Therefore, this may be explained by factors other than SST. If the first common trend is a factor related to the marine environment, the second common trend may reflect environmental processes not included in our analysis and/or other factors, not including the marine environment. Trend 2N illustrates an inverted vertical axis, while Trend 2E shows a similar pattern. Both trends were constant prior to the 1960s, followed by an increasing trend peaking in the 1980s until the 2000s (Figure 4). On the other hand, Trend 2N and Trend 2E have different trends, either flattening or monotonically fluctuating since the 2000s. The 19-year period from 1955 to 1973 was a period of rapid economic growth in Japan. This was a period of coastal development centered on Tokyo Bay, Ise Bay, Mikawa Bay, and the Seto Inland Sea. For example, although land reclamation has been taking place for several hundred years, the speed of reclamation has accelerated since the late 1950s (Yasui and Yabunaka, 2002). From the perspective of water quality and ecosystems, coastal areas were originally supported by good water quality and ecosystems, but both ecosystems and water quality have deteriorated due to rapid coastal development since the 1960s, in the Seto Inland Sea, which is the largest enclosed water area in Japan. Along with the development and industrialization of coastal areas, water pollution and destruction of nature also increased, and various regulations were introduced. In the Seto Inland Sea, legal restrictions were introduced in the 1970s to improve water quality. Along with these regulations, the discharge of organic substances in terms of chemical oxygen demand (COD) was restricted from the effluent, and a directive regarding phosphorus reduction was officially put in place. Regulations instituted to reduce phosphorus load have been successful (Yamamoto, 2003b). Since the 1980s, only the water quality had gradually improved (Matsuda, 2011), and these regulations appear to have reduced primary production in waters as a whole and have resulted in changes to phytoplankton species composition. It has also been suggested that these factors may have caused a decline in fishery production (Yamamoto, 2003b). Therefore, human factors such as these may also explain why the geographic center of catch moved westward and then returned eastward in the 1980s. Although these events in the Seto Inland Sea are regional in nature, the species treated in this study inhabit a wide range of highly productive inland waters in western Japan, so such fluctuations are also expected to have a significant impact on the geographical center of catch of Japan as a whole.
The analysis in this study alone does not reveal which of these elements (climate change at the Northwest Pacific level or regional SST) has a greater effect on the time series change in the geographical center of catch. However, the importance of the first and second common trend, environmental factors, and other factors possibly related to coastal development and human factors were compared by examining the probability that the factor loadings of each trend differ from zero. There are seven species/groups (mullet, Japanese spiny lobster, abalone, hard clam, turban shell, short-necked clam, and ager-ager) for which the probability of factor loadings differing from zero for the second common trend exceeds that of the first common trend at least one in the latitudinal or longitudinal direction. These species commonly inhabit intertidal or near-shore zones partially or throughout their life history stages, close to the range of human activities (Nose et al., 1989). For example, the first and second trends can be interpreted from the ecological characteristics of yellowtail, Spanish mackerel, and mullet, three fish species/groups selected in this study. The probability of factor loadings different from zero was higher for the second common trend than for the first common trend for mullet (Table 3). In the early stages of their life history, mullet is partially distributed in coastal, estuarine, and brackish waters of inland bays, i.e., in waters directly affected by human activities (Ochiai and Tanaka, 1985). This is related to the human activity component assumed in the second common trend. In contrast, the probability of factor loadings differing from zero in the first common trend exceeded the second common trend for yellowtail and Spanish mackerel. Yellowtail and Spanish mackerel spawn in the Yellow Sea and East China Sea and then disperse offshore, so coastal areas such as estuaries and brackish waters of inner bays are not traversed throughout their life histories. For these fish, previous studies have also suggested a relationship with the marine environment in which catch and distribution areas change in response to oceanic regime shifts (Tameishi et al., 2005). For hard clams, the probability of factor loadings differing from zero had a high contribution of more than 0.86 for both common trends in the latitudinal and longitudinal directions. These results indicate that changes in catches of several shellfish species in Chiba Prefecture cannot be explained solely by long-term fluctuations in SST (Nakagawa, 2018). These highlight the need to examine the relationship with the marine environment in view of habitat area, life history stages and the relationship with human factors.
Trend 2N shows monotonic variation from 2000 to 2020. The confidence interval for this range is wider than the other ranges (Figure 4). This is due to the presence of species with no data since the late 2000s in the time series of observed values (Table 1). However, focusing on the mean, there is a change after 2000 that is outside the range of the past 100 years. This may be related to the unconventional sea surface temperature regime in the ocean environment suggested by Kuroda et al., 2020a. The phenomenon of the colloquial aphorism that “the sea has changed” reported for coastal species throughout Japan may also be related to environmental changes that differ from the past and converge with this fluctuation. Since the 1980s, a monotonically fluctuating trend has been observed for each common trend. The analysis on a multi-decade scale shows the possibility that a monotonically increasing trend can be explained by only one factor, such as SST. Although there are monotonous fluctuations that are synchronized in each element in some periods, the 100-year period is composed of a combination of different fluctuation trends. The study suggested that long-term variation in a wide range of fisheries resources, such as fish, invertebrates, and algae, includes the effects of global environmental change and other factors that are also related to human influence, such as coastal development. This finding implies that, in addition to SST, multifaceted factors need to be considered when examining coastal resource variability. This is particularly relevant considering the previous findings which indicate that marine creatures have already been severely impacted by global environmental change which can be attributed to the interactive effects with other human factors, such as overfishing and coastal development (Wernberg et al., 2024). Since we did not quantitatively analyze human factors in depth in this study, future investigations should collect and analyze long-term data on them.
The distribution shift of fish species in response to oceanic warming is not merely a matter of biological distribution; however, it also has implications for fisheries and their associated communities and poses challenges for future fisheries management (Cheung et al., 2013; Hollowed et al., 2013; Gamito et al., 2015). As the species composition and distribution of catch shifts with changes in climate, fishery sites must now adapt to these changes (Brander, 2010). The occurrence of cyclical fluctuations in the past extracted by the DFA indicates that the Japanese fishery industry has experienced rapid distribution shifts in the ocean environment. Because of changes in processing, distribution, and consumption, it is not possible to simply use past methods, but it is helpful from an economic standpoint to see how different species were used when there was a sudden increase or decrease in catch in a particular area. This experience of how the market responded may be useful in planning adaptation measures for the current climate change scenario. Finding the years of drastic shifts common among fish species and exploring the economic record of how fisheries have adapted to these changes may give us some insight into potential adaptation measures for such scenarios.
Publicly available datasets were analyzed in this study. This data can be found here: https://dl.ndl.go.jp/; https://www.library-archive.maff.go.jp/; https://www.e-stat.go.jp/.
SW: Conceptualization, Data curation, Methodology, Visualization, Writing – original draft, Writing – review & editing. ST: Conceptualization, Methodology, Visualization, Writing – review & editing. HO: Writing – review & editing.
The author(s) declare financial support was received for the research, authorship, and/or publication of this article. This study was funded by the Japan Fisheries Research and Education Agency.
We thank Dr. Shiroh Yonezaki, Dr. Yohei Kawauchi and Dr. Aigo Takeshige of the Japan Fisheries Research and Education Agency for providing valuable suggestions for this manuscript. We also thank the staff of the Public Relations Division, Headquarters of the Japan Fisheries Research and Education Agency, and Dr. Toshihiro Onitsuka of the Japan Fisheries Research and Education Agency for their cooperation in creating the illustrations in the figures. We also extend a special thanks to the editor and two reviewers for their many constructive comments.
The authors declare that the research was conducted in the absence of any commercial or financial relationships that could be construed as a potential conflict of interest.
All claims expressed in this article are solely those of the authors and do not necessarily represent those of their affiliated organizations, or those of the publisher, the editors and the reviewers. Any product that may be evaluated in this article, or claim that may be made by its manufacturer, is not guaranteed or endorsed by the publisher.
The Supplementary Material for this article can be found online at: https://www.frontiersin.org/articles/10.3389/fmars.2024.1265907/full#supplementary-material
Electronic Appendix Table S1 | Geographical center of catch by year for the 12 statistical species/groups of latitude and longitude.
Electronic Appendix Table S2 | Common trend values extracted by the Dynamic Factor Analysis. Estimates, lower, and upper indicate the mean values, lower, and upper limits of the 95% confidence interval, respectively.
Brander K. (2010). Impacts of climate change on fisheries. J. Mar. Sys. 79, 389–402. doi: 10.1016/j.jmarsys.2008.12.015
Cheung W., Watson R., Pauly D. (2013). Signature of ocean warming in global fisheries catch. Nature 497, 365–368. doi: 10.1038/nature12156
Christensen V., Guenette S., Heymans J. J., Walters C. J., Watson R., Zeller D., et al. (2003). Hundred-year decline of North Atlantic predatory fishes. Fish. Fish 4, 1–24. doi: 10.1046/j.1467-2979.2003.00103.x
Deutsch C., Ferrel A., Seibel B., PÖrtner H., Hue R. B. (2015). Climate change tightens a metabolic constraint on marine habitats. Science 348, 1132–1135. doi: 10.1126/science.aaa1605
Dimarchopoulou D., Makino M., Prayoga M. R., Zeller D., Vianna G. M. S., Humphries A. T. (2022). Responses in fisheries catch data to a warming ocean along a latitudinal gradient in the western Pacific Ocean. Environ. Biol. Fish. 105, 1347–1362. doi: 10.1007/s10641-021-01162-z
Furuichi S., Yukami R., Kamimura Y., Nishijima S., Watanabe R. (2023)Stock assessment and evaluation for Pacific stock of Japanese sardine (fiscal year 2022). In: Marine fisheries stock assessment and evaluation for Japanese waters (Tokyo: Japan Fisheries Agency and Japan Fisheries Research and Education Agency). Available online at: https://abchan.fra.go.jp/digests2022/index.html (Accessed May 11, 2023). 58 pp.
Gamito R., Costa M. J., Cabral H. N. (2015). Fisheries in a warming ocean: trends in fish catches in the large marine ecosystems of the world. Reg. Environ. Change. 15, 57–65. doi: 10.1007/s10113-014-0615-y
Gelman A., Carlin B., Stern H. S., Dunson D. B., Vehtari A., Rubin D. B. (2014). Bayesian Data Analysis third edition (Boca Raton: Chapman & Hall).
Hamasaki K., Kitada S. (2008). The enhancement of abalone stocks: lessons from Japanese case studies. Fish. Fish. 9, 243–260. doi: 10.1111/j.1467-2979.2008.00280.x
Hayakawa J., Yamakawa T., Aoki I. (2007). Long-term fluctuation in the abundance of abalone and top shell in Japan and factors affecting those fluctuations. Bull. Jpn. Soc Fish. Oceanogr. 71, 96–105.
Hirano S., Mimura N. (2003). Distribution and transition of coastal topographic features at three different periods from Meiji era. J. Jpn. Assoc. Coast. Zone Stud. 15, 47–56. doi: 10.57296/jaczsgakkai.15.1_47
Hollowed A. B., Barange M., Beamish R., Brander K., Cochrane K., Drinkwater K., et al. (2013). Projected impacts of climate change on marine fish and fisheries. ICES J. Mar. Sci. 70, 1023–1037. doi: 10.1093/icesjms/fst081
Hu W., Du J., Su S., Tan H., Yang W., Ding L., et al. (2022). Effects of climate change in the seas of China: Predicted changes in the distribution of fish species and diversity. Ecol. Indic. 134, 1–13. doi: 10.1016/j.ecolind.2021.108489
Itoh H. (1961). Fisheries biology of Japanese sardine around the Japanese water. Bull. Jpn. Sea Region. Fis. Res. Lab. 9, 1–227.
Japan Fisheries Agency (2018) White paper on Fisheries: Summary, FY2017 Trends in Fisheries, FY2018 Fisheries Policy. Available online at: https://www.maff.go.jp/e/data/publish/attach/pdf/index-94.pdf (Accessed November 24, 2023).
Japan Fisheries Agency (2023) White paper on Fisheries: Summary, FY2022 Trends in Fisheries, FY2023 Fisheries Policy. Available online at: https://www.maff.go.jp/e/data/publish/attach/pdf/index-220.pdf (Accessed November 24, 2023).
Japan Meteorological Agency (2024) Sea surface temperature (around Japan). Available online at: https://www.data.jma.go.jp/gmd/kaiyou/english/long_term_sst_Japan/sea_surface_temperature_around_Japan.html (Accessed February 13, 2024).
Jo H. S., Yeh S. W., Kim C. H. (2013). A possible mechanism for the North Pacific regime shift in winter of 1998/1999. Geophys. Res. Lett. 40, 4380–4385. doi: 10.1002/grl.50798
Kakehi S., Narimatsu Y., Okamura Y., Yagura A., Ito S. (2021). Bottom temperature warming and its impact on demersal fish off the Pacific coast of northeastern Japan. Mar. Eco. Prog. Ser. 677, 177–196. doi: 10.3354/meps13852
Kawasaki T. (1983). Why do some pelagic fishes have wide fluctuations in their numbers? FAO Fish. Rep. 291, 1065–1080.
Kidokoro H., Goto T., Nagasawa T., Nishida H., Akamine T., Sakurai Y. (2010). Impact of a climate regime shift on the migration of Japanese flying squid (Todarodes pacificus) in the Sea of Japan. ICES J. Mar. Sci. 6, 1314–1322. doi: 10.1093/icesjms/fsq043
Kuroda H., Saito T., Kaga T., Takasuka A., Kamimura Y., Furuichi S., et al. (2020a). Unconventional sea surface temperature regime around Japan in the 2000s–2010s: potential influences on major fisheries resources. Front. Mar. Sci. 7. doi: 10.3389/fmars.2020.574904
Kuroda N. (2020b). Long term changes in prices of marine products at local markets in Aichi prefecture. Bull. Aichi Pref. Fish. Exp. Sta. 25, 9–18.
Kuwae M., Yamamoto M., Sagawa T. (2017). Multidecadal, centennial, and millennial variability in sardine and anchovy abundances in the western North Pacific and climate–fish linkages during the late Holocene. Prog. Oceanogr. 159, 86–98. doi: 10.1016/j.pocean.2017.09.011
Lassen H., Cross D., Christiansen E. (2012) One hundred years of catch statistics for the Northeast Atlantic (ICES Cooperative Research Reports (CRR). Available online at: https://ices-library.figshare.com/articles/report/One_hundred_years_of_catch_statistics_for_the_Northeast_Atlantic/18624128 (Accessed May 11, 2023).
Litzow M., Hunsicker M., Ward E., Anderson S., Gao J., Zador S., et al. (2020). Evaluating ecosystem change as Gulf of Alaska temperature exceeds the limits of preindustrial variability. Prog. Ocean. 186, 102393. doi: 10.1016/j.pocean.2020.102393
Masuda Y., Katayama S. (2022). Fisheries trends and biological characteristics of the hairtail Trichiurus Japonicus in Sendai Bay. Fish. Biol. Oceanogr. Kuroshio. 23, 49–55.
Matsuda O. (2011). Recent activities on“ Creation of Satoumi “ and integrated coastal management. Bull. Soc. Sea Water Sci. Jpn. 65, 199–209. doi: 10.11457/swsj.65.199
Melbourne-Thomas J., Audzijonyte A., Brasier M. J., Cresswell K. A., Fogarty H. E., Haward M., et al. (2022). Poleward bound: adapting to climate-driven species redistribution. Rev. Fish Biol. Fisheries 32, 231–251. doi: 10.1007/s11160-021-09641-3
Minobe S. (2002). Interannual to interdecadal changes in the Bering Sea and concurrent 1998/99 changes over the North Pacific. Prog. Oceanogr. 55, 45–64. doi: 10.1016/S0079-6611(02)00069-1
Muko S., Takahashi M., Kurota H., Yoda M., Hino H. (2023)Stock assessment and evaluation for Tsushima Warm Current stock of Japanese sardine (Fiscal Year 2022). In: Marine fisheries stock assessment and evaluation for Japanese waters (Tokyo: Japan Fisheries Agency and Japan Fisheries Research and Education Agency). Available online at: https://abchan.fra.go.jp/digests2022/index.html (Accessed May 11, 2023).
Nakagawa Y. (2018). Long-term fluctuations in sandy beach shellfish catch from Kujukuri coast, Japan. Bull. Chiba Pref. Fish. Res. Ctr. 12, 9–15.
Norin Toukei Kyokai (Association of Agriculture and Forestry Statistics) (1978). Annual Statistics of the Fisheries Industry Volume 3 Statistics by Prefecture, Norin Toukei Kyokai (Tokyo: Association of Agriculture and Forestry Statistics), 619.
Rodionov S. (2004). A sequential algorithm for testing climate regime shifts, Geophys. Res. Lett. 31, L09204. doi: 10.1029/2004GL019448
Sakaji H. (2023). Catch trends of hairtail Trichiurus Japonicus in Japanese waters. Fish Biol. Oceanogr. Kuroshio 24, 121–128.
Sakurai Y. (2007). An overview of the Oyashio ecosystem. Deep Sea Res. II 54, 2526–2542. doi: 10.1016/j.dsr2.2007.02.007
Shishidou H., Sakaji H., Tian Y. (2016). Catch fluctuation of yellowtail species in relation to fluctuations in the geographical catch center. Bull. Jpn. Soc Fish. Oceanogr. 80, 27–34. doi: 10.34423/jsfo.80.1_27
Sone R., Okabe K., Kimura Y., Hibino M. (2023). Fluctuations in fishery resources in the inner bays in Japan. Bull. Jpn. Soc Fish. Oceanogr. 87, 200–201.
Takao S., Kumagai N. H., Yamano H., Fujii M., Yamanaka Y. (2015). Projecting the impacts of rising seawater temperatures on the distribution of seaweeds around Japan under multiple climate change scenarios. Ecol. Evol. 5, 213–223. doi: 10.1002/ece3.1358
Takasuka A., Oozeki Y., Kubota H. (2008). Multi-species regime shifts reflected in spawning temperature optima of small pelagic fish in the western North Pacific. Mar. Ecol. Prog. Ser. 360, 211–217. doi: 10.3354/meps07407
Tameishi H., Fujii. A., Maebayashi A. (2005). Relationship between regime-shifts of SST and fisheries condition (Spanish mackerel and yellowtail) in Japan Sea. Bull. Coast. Oceanogr. 42, 125–131.
Toba M. (2017). Revisiting recent decades of conflicting discussions on the decrease of Asari clam Ruditapes philippinarum in Japan. Nippon Suisan Gakkaishi 83, 914–941. doi: 10.2331/suisan.17-00007
Tokeshi T., Nakanishi K., Katayama S. (2021). Long-term spatiotemporal variation in Miyazaki Prefecture coastal fishery catch in relationship to oceanographic conditions. Bull. Jpn. Soc. Fish. Oceanogr. 85, 45–53. doi: 10.34423/jsfo.85.2_45
Ueda T., Matoba T. (2009). Relationship between Spanish mackerel catch and water temperature. Bull. Fukuoka Fisheries Mar. Technol. Res. Cent. 19, 69–74.
Vehtari A., Gelman A., Gabry J. (2017). Practical Bayesian model evaluation using leave-one-out cross-validation and WAIC. Stat. Comput. 27, 1413–1432. doi: 10.1007/s11222-016-9696-4
Ward E., Anderson S., Damiano L., Hunsicker M., Litzow M. (2019). Modeling regimes with extremes: the bayesdfa package for identifying and forecasting common trends and anomalies in multivariate time series data. R J. 11, 46–55. doi: 10.32614/RJ-2019-007
Wernberg T., Thomsen M. S., Baum J. K., Bishop M. J., Bruno J. F., Coleman M. A., et al. (2024). Impacts of climate change on marine foundation species. Annu. Rev. Mar. Sci. 16, 247–282. doi: 10.1146/annurev-marine-042023-093037
Yagura A. (2021). Catches and ecology of gazami crab (Portunus trituberculatus) in Sendai Bay. Miyagi Pref. Rep. Fish. Sci. 21, 9–14.
Yamamoto T. (1960). Transition and utilization of fisheries and aquaculture production statistics. Nippon Suisan Gakkaishi 26, 1050–1058. doi: 10.2331/suisan.26.1050
Yamamoto T. (2003b). The Seto Inland Sea - eutrophic or oligotrophic? Mar. Poll. Bull. 47, 37–42. doi: 10.1016/S0025-326X(02)00416-2
Yamamoto M. (2003a). The long-term variation in water temperature and salinity in Bisan-Seto, the central Seto Inland Sea. Bull. Jap. Soc Fish. Oceanogr. 67, 163–167.
Yamamoto T., Ino S., Kuno M., Sakaji H., Hiyama Y., Kishida T., et al. (2007). On the spawning and migration of yellowtail Seriola quinqueradiata and research required to allow catch forecasting. Bull. Fish. Res. Agen. 21, 1–29.
Yasui M., Yabunaka K. (2002). A transition of land reclamation policy in Japan. Proc. Civil Eng. Ocean. 18, 119–124. doi: 10.2208/prooe.18.119
Yasunaka S., Hanawa K. (2002). Regime shifts found in the northern hemisphere SST field. J. Meteor. Soc Japan. 80, 119–135. doi: 10.2151/jmsj.80.119
Yatsu A., Chiba S., Yamanaka Y., Ito S., Shimizu Y., Kaeriyama M., et al. (2013). Climate forcing and the Kuroshio/Oyashio ecosystem. ICES J. Mar. Sci. 70, 922–933. doi: 10.1093/icesjms/fst084
Yonezaki S., Kiyota M., Okamura H. (2015). Long-term ecosystem change in the western North Pacific inferred from commercial fisheries and top predator diet. Deep Sea Res. Part II 113, 91–101. doi: 10.1016/j.dsr2.2014.10.027
Zuur A. F., Fryer R. J., Jolliffe I. T., Dekker R., Beukema J. J. (2003a). Estimating common trends in multivariate time series using dynamic factor analysis. Environmetrics 14, 665–685. doi: 10.1002/env.611
Keywords: centennial trend, dynamic factor analysis, coastal fisheries resources, fisheries statistics, geographical center of catch
Citation: Watari S, Takemura S and Oyaizu H (2024) Charting and analyzing the catch distribution of Japan’s coastal fisheries resources based on centennial statistics. Front. Mar. Sci. 11:1265907. doi: 10.3389/fmars.2024.1265907
Received: 24 July 2023; Accepted: 08 March 2024;
Published: 26 March 2024.
Edited by:
Stephen J. Newman, Western Australian Fisheries and Marine Research Laboratories, AustraliaReviewed by:
Christian Salvadeo, Universidad Autónoma de Baja California Sur, MexicoCopyright © 2024 Watari, Takemura and Oyaizu. This is an open-access article distributed under the terms of the Creative Commons Attribution License (CC BY). The use, distribution or reproduction in other forums is permitted, provided the original author(s) and the copyright owner(s) are credited and that the original publication in this journal is cited, in accordance with accepted academic practice. No use, distribution or reproduction is permitted which does not comply with these terms.
*Correspondence: Shingo Watari, d2F0YXJpX3NoaW5nbzI2QGZyYS5nby5qcA==
Disclaimer: All claims expressed in this article are solely those of the authors and do not necessarily represent those of their affiliated organizations, or those of the publisher, the editors and the reviewers. Any product that may be evaluated in this article or claim that may be made by its manufacturer is not guaranteed or endorsed by the publisher.
Research integrity at Frontiers
Learn more about the work of our research integrity team to safeguard the quality of each article we publish.