 Magnus Aune1†‡
 Virginie Ramasco1‡
 Nadine Wells2‡
 Margaret Warren2*
 Frédéric Cyr2
 Eric J. Pedersen3,4
 Mariano Koen-Alonso2,4
 Elena Eriksen5
 Raul Primicerio6
 Ulf Lindstrøm6,7
 Paul E. Renaud1
- 1Environmental Department, Akvaplan-niva, Tromsø, Norway
- 2Northwest Atlantic Fisheries Centre, Fisheries and Oceans Canada, St. John’s, NL, Canada
- 3Department of Biology, Concordia University, Montreal, QC, Canada
- 4Department of Biology, Memorial University, St. John’s, NL, Canada
- 5Ecosystem Processes Research Group, Institute of Marine Research, Bergen, Norway
- 6Department of Arctic and Marine Biology, The Arctic University of Norway, Tromsø, Norway
- 7Marine Mammal Research Group, Institute of Marine Research, Tromsø, Norway
Monitoring programs that integrate both structural and functional ecosystem components play integral roles in ecosystem management and conservation planning. In the early 1990’s, the marine ecosystem of the waters surrounding Newfoundland and Labrador (NL) underwent a regime shift. Several demersal and pelagic fish stocks collapsed simultaneously, and this had significant ecological and socioeconomic consequences. As this regime shift impacted numerous commercial and non-commercial species, assessments based on individual species would be insufficient. We explored a variety of metrics that capture different facets of diversity across multiple species to provide a more robust ecosystem assessment. These were species richness, evenness, community-weighted means of maximum body length and trophic level (i.e., the mean maximum body size or trophic level of the species present in a community), and functional dispersion (FDis). The objectives of this study were 1) to assess trends in community structure of the NL demersal community during the post-collapse period (1995-2018), 2) explore how the various community-level metrics differ or are redundant, and 3) investigate how these metrics are associated with important covariates. Several metrics were redundant and displayed strongly positive, temporal trends being consistent with expectations for a recovery encompassing the entire demersal community. In particular, unweighted community-weighted means of body length and trophic level displayed nearly equal temporal patterns, showing increasing trends throughout the study period which were most prominent in the northern study area and within a limited depth range at the upper shelf break. Corresponding biomass-weighted metrics were also correlated with each other but only showed similar increasing tendencies after the first decade. In contrast, species richness did not show any temporal increase. Evenness and biomass-weighted FDis showed similar temporal patterns, decreasing during the first decade followed by strong increases during subsequent years, patterns that were directly linked to variation in Northern shrimp and Atlantic cod biomass. This study demonstrates how a variety of community metrics can provide insight into different aspects of the post-collapse recovery of the demersal community and help us better understand the complexity of the changes the ecosystem is undergoing.
1 Introduction
The combined impact of natural environmental variability and anthropogenic disturbance can cause marine ecosystems to undergo regime shifts (Möllmann and Diekmann, 2012; Levin and Möllmann, 2015), with major changes in diversity and community structure as common consequences (Beverton, 1990; Rocha et al., 2015). A regime shift is a large-scale change that may be an abrupt, high-amplitude, or low-frequency event which affects multiple bio-physical attributes across a range of trophic levels (Levin and Möllmann, 2015). Regime shifts also tend to have major socioeconomic implications (e.g., Steele et al., 1992). Initially, regime shifts are not always detectable as changes in the abundance of dominant species. On the contrary, they can often be detected first in rare species, in specific locales in a broader area, or through aggregate community metrics (e.g., Pedersen et al., 2017, 2020; Koen-Alonso and Cuff, 2018). Monitoring and assessment of biodiversity and community structure may therefore facilitate detection and comprehension of ecosystem changes associated with natural and anthropogenic disturbances (e.g., Mouillot et al., 2013a). Indeed, given the trade-off between a precautious ecosystem management and the associated consequences for economical and societal systems, comprehension of how ecosystems respond to, and recover from, disturbance is essential in order to manage ecosystems efficiently (Kelly and Harwell, 1990).
Several numerical tools are available to assess structural and functional properties of multispecies communities. The simplest form of a community diversity metric is species richness (i.e., the number of species present in a community), a simple measure to compute but one that does not account for functional variation among species (Magurran and McGill, 2011). To account for the fact that species play different functional roles in the ecosystem, communities can also be assessed with various trait-based metrics. The simplest form of trait-based metrics is the average value of a particular trait value across the species in a community (i.e., community-weighted means; CWM). In terms of assessments of ecosystems directly affected by harvesting, several life-history traits are particularly relevant to consider. For instance, empirical studies have shown that intense, directed harvesting largely has a negative impact on species with large maximum body length (ML) and high trophic level (TL), since such species are often targeted (e.g., Pauly et al., 1998; Le Quesne and Jennings, 2012). As such, the mean ML and TL values of a community can be expected to decrease as a result of intense harvesting. Moreover, more complex metrics of functional diversity typically combine data on species composition, relative abundances, and functional characteristics (e.g., Tilman et al., 1997; Petchey and Gaston, 2002; Villéger et al., 2008; Laliberté and Legendre, 2010; Magurran and McGill, 2011). Recently, functional diversity metrics have been applied in studies of fish community structure in northern ecosystems (e.g., Frainer et al., 2017; Pedersen et al., 2017; Aune et al., 2018). Largely in contrast to conventional numerical methodology, assessments based on trait-based methods are able to unravel ecosystem effects of major disturbance events (Mouillot et al., 2013a). Most metrics can be applied on either presence-absence data, or be weighted by the individual species´ relative abundance or biomass. For instance, metrics such as evenness and Shannon diversity integrate information on species richness and the species’ relative abundances, in order to estimate how the total community biomass is distributed among the member species (Heip et al., 1998; Magurran and McGill, 2011). Likewise, unweighted trait-based metrics provide a way of tracking changes in the underlying functional potential of the community, whereas weighted metrics reflect, by capturing the influence of dominant species, the effective or realized functionality at a given point in time.
Monitoring of the changes undergone by the Newfoundland and Labrador (NL) marine ecosystem during recent decades provides a unique opportunity to investigate how ecosystems may respond to major perturbations. In the early 1990s, the ecosystem underwent a regime shift (Buren et al., 2014a; Pedersen et al., 2017, 2020) that had significant ecological and socioeconomic consequences, including the loss of ~39,000 jobs related to the fishing industry (Steele et al., 1992; Hamilton and Haedrich, 1999; Hamilton et al., 2004; Buren et al., 2014b). Several commercial demersal (Myers et al., 1996, 1997) and pelagic (Buren et al., 2019) fish stocks collapsed simultaneously, along with populations of non-commercial species (e.g., Gomes et al., 1995; Koen-Alonso et al., 2010; NAFO, 2010; Koen-Alonso and Cuff, 2018). As such, the timing of this rapid ecosystem event is known, which facilitates a precise definition of the post-collapse period. Atlantic cod (Gadus morhua) was the single most important commercial species in the decades prior to the collapse, and therefore this species received the most scientific attention in the years following the collapse. The spawning biomass of northern cod (Atlantic cod stock from NAFO Div. 2J3KL), the most important cod stock in NL waters, dropped to about 1% of an estimated pre-collapse spawning biomass of ~1.6 million in the 1960s by the time the moratorium was imposed in 1992 (Myers et al., 1997). Other NL cod stocks on the southern Grand Banks and south of Newfoundland also exhibited a >90% decline in spawning biomass between 1967 and 1993 (Myers et al., 1997). While fishing was thought to play a direct role in the collapse (Myers et al., 1996, 1997), changes in relative abundances of different trophic levels in the food web and colder than average environmental conditions during the 1980s and early 1990s have also been suggested as important drivers of both the collapse and the failure of stocks to rapidly recover following reductions in fishing pressure (Parsons and Lear, 2001; Rothschild, 2007; Halliday and Pinhorn, 2009; Lilly et al., 2013; Buren et al., 2014a; Buren et al., 2014b; Buren et al., 2019; Mullowney et al., 2019). A combination of these two drivers (fishing and environmental changes) has been proposed as a key explanation for the extensive and widespread changes that occurred (e.g., Rose, 2004; Koen-Alonso et al., 2010; Dempsey et al., 2018).
In the decades following the regime shift, improved monitoring efforts have made broader ecosystem data more available. Although the collapse affected all geographical areas and many species, the structural changes were larger in the north (Labrador Shelf, northern Newfoundland shelf) than in the south (Grand Banks and southern Newfoundland shelf; Figure 1). Cod biomass declined precipitously in the north, and the biomass of Northern shrimp (Pandalus borealis) increased rapidly following the collapse of groundfish stocks (e.g., Koen-Alonso and Cuff, 2018; Pedersen et al., 2022). In the post-collapse period, partial recovery in terms of groundfish biomass, as well as taxonomic and functional metrics have been observed (Nogueira et al., 2016; Dempsey et al., 2017; Pedersen et al., 2017), and Northern shrimp biomasses have declined in both regions (Pedersen et al., 2022). However, the groundfish biomass rebuilding trend stalled in the early 2010s, and overall declines in biomass of the fish community have been observed since 2013-14 (Pedersen et al., 2017, 2020; Koen-Alonso and Cuff, 2018). Recent modelling studies suggest the importance of trophic interactions in driving community dynamics in this system. Pedersen et al. (2022) indicated that changes in Northern shrimp biomass were closely associated with the decline, then increase, in cod abundances, and results in Koen-Alonso et al. (2021) suggested that the failed rebuilding of capelin (Mallotus villosus, a key forage species) played a key role in the stalled recovery of Atlantic cod (Koen-Alonso et al., 2021).
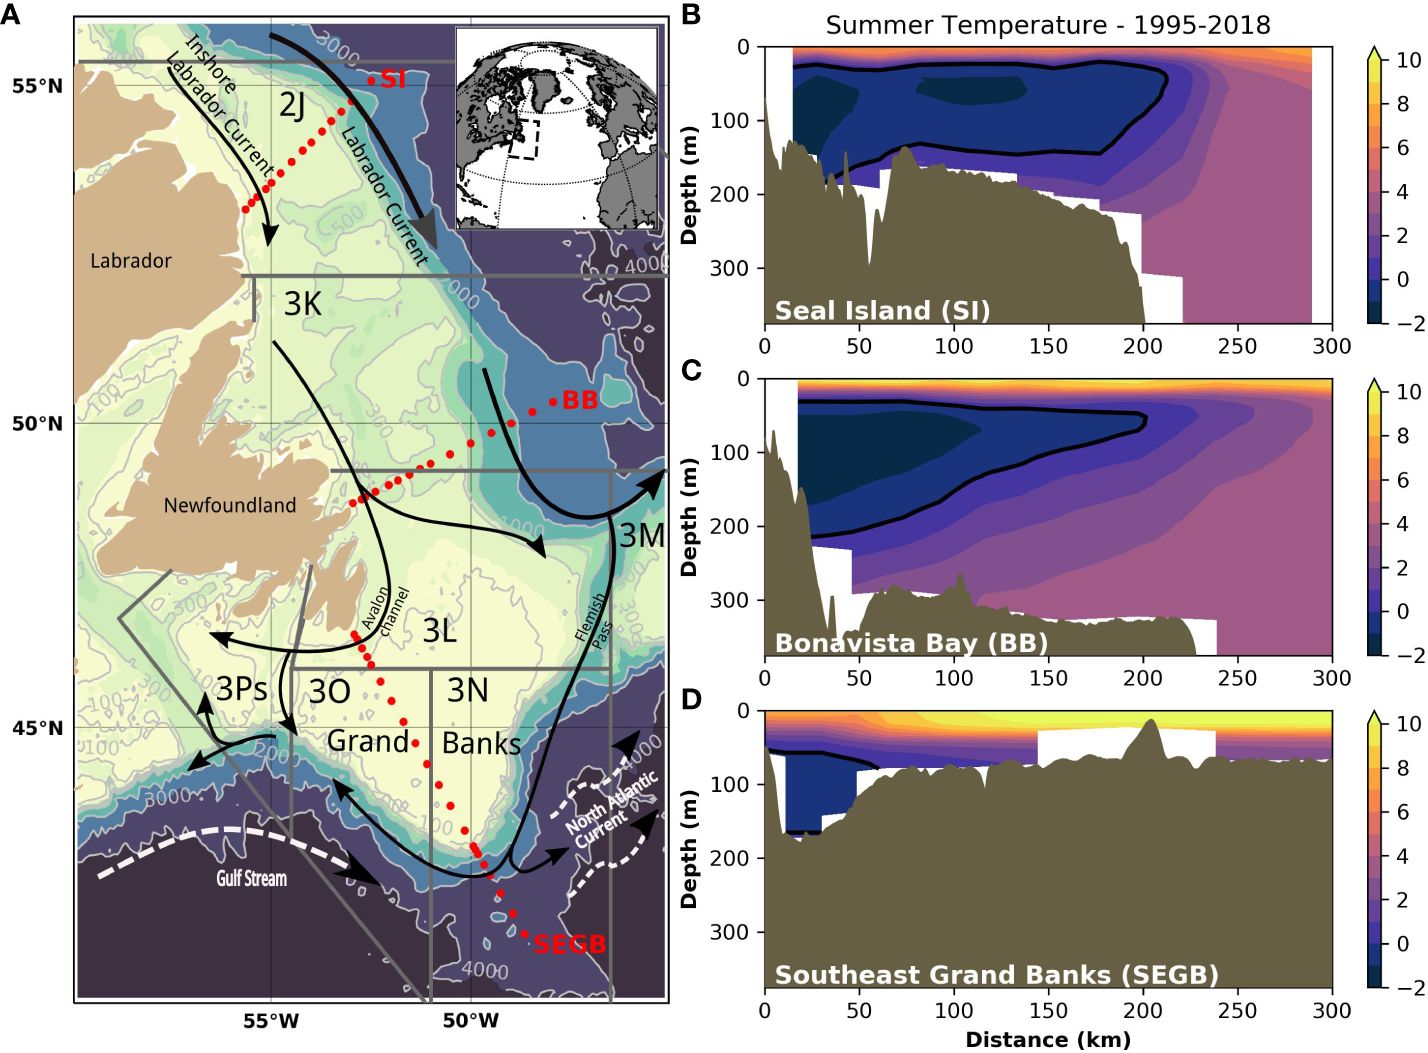
Figure 1 Bathymetric map of the Newfoundland and Labrador shelf (A). The grey lines show the NAFO Divisions, black arrows show the movement of ocean currents, and the red dots indicate three transects presented on the right panels. The average summer temperature over the period 1995-2018 is shown for each transect (B) Seal Island (SI), (C) Bonavista Bay (BB), and (D) Southeast Grand Banks (SEGB). A thick black line shows the 0°C isotherm delimiting the Cold Intermediate Layer for each transect. Bathymetric contours are displayed in light grey with data from GEBCO Compilation Group (2023).
Previous studies have shown that the collapse occurred across numerous commercial and non-commercial species (e.g., Dawe et al., 2012; Pedersen et al., 2017, 2020; Koen-Alonso et al., 2010; Koen-Alonso and Cuff, 2018). As such, while conventional stock assessments rely on single species’ biomass trajectories, community-level assessments require suites of synthetic metrics in order to capture the different facets of biodiversity and underlying ecosystem processes (Kelly and Harwell, 1990; Purvis and Hector, 2000; Price, 2002). Here, we expand on previous findings by focusing on most fish species and one of the dominant groups of benthic invertebrates (shrimps) found in the NL demersal community, and apply a combination of taxonomic and trait-based diversity metrics to investigate the spatial patterns and temporal development of structural and functional characteristics. Thus, the main objectives of this paper are to: 1) assess the trends in community structure of the NL demersal community during the post-collapse period (1995-2018), 2) explore how the various community-level metrics differ or are redundant, and 3) investigate how these metrics are associated with important covariates.
2 Materials and methods
2.1 Study area
The Newfoundland and Labrador (NL) bioregion (see DFO, 2009) constitutes a large marine ecosystem in the Northwest Atlantic, which encompasses shelf and shelf-break waters from the Labrador Shelf to the southern Newfoundland shelf, including the Grand Banks. This entire area and its subcomponents are typically described using the Northwest Atlantic Fisheries Organization (NAFO) Divisions (fisheries statistical areas). Within this bioregion, our study area includes the Newfoundland Shelf (NAFO Div. 2J3K) and the Grand Bank (NAFO Div. 3LNO) (Figure 1). These areas correspond to two Ecosystem Production Units (EPUs) that have been identified in this bioregion based on physical (bathymetry, water temperature) and biological (chlorophyll-a, primary production, demersal biomass, demersal diversity) variables (Pepin et al., 2014). While EPUs generally define a functional ecosystem, EPUs within the NL bioregion are not isolated systems, with the Labrador Current (see next section) providing a clear north-south connectivity mechanism within the bioregion (NAFO, 2014).
For the EPUs in our study area, the northern portion of the Grand Banks (3L) is considered a transition zone between the Newfoundland Shelf and Grand Banks EPUs (NAFO, 2014; Pepin et al., 2014). Given that our analyses here explore depth-related variability and considering that the bathymetric profile of Div. 3L is more similar to the Newfoundland Shelf (2J3K) than the typically shallow depths (<150 m) that characterize the bank in the Grand Bank EPU, the 3L NAFO Division has been grouped with the Newfoundland Shelf (2J3K) for our analyses. Therefore, the patterns explored in this study consider the broader areas generally consistent with the existing EPUs and defined as Newfoundland Shelf and Northern Grand Bank (NLS) (NAFO Div. 2J3KL), and the Southern Grand Bank (SGB) (NAFO Div. 3NO), within the depth range covered by Fisheries and Oceans Canada (DFO) fall multispecies bottom trawl survey (~50-1500 m). Refer to Table 1 for a full list of acronyms used within.
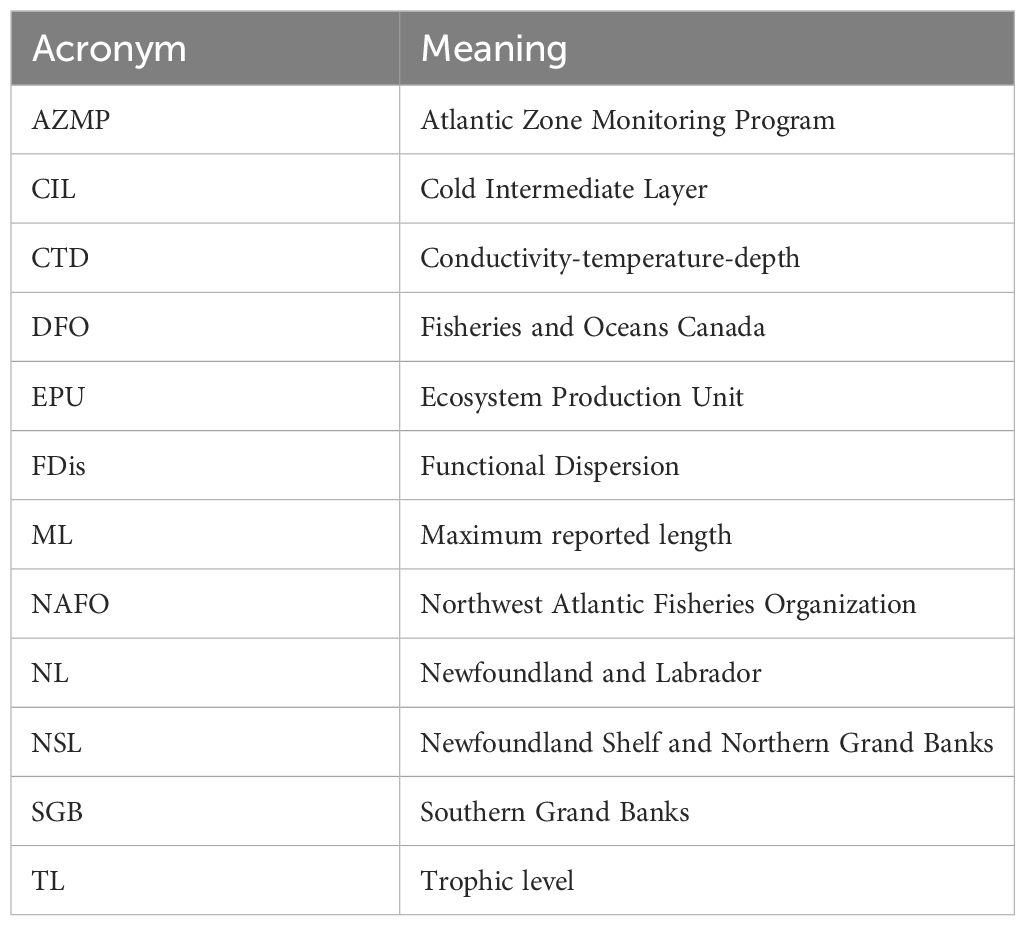
Table 1 List of acronyms (alphabetical order).
2.2 Oceanographic conditions
The main circulation features of the NL marine ecosystem consist of two parallel southward flowing currents (Figure 1). Closer to the coast, cold and fresh Arctic-origin waters flood most of the shelf where the topography is complex and consists of shallow banks and deeper troughs. This current is generally referred to as the inshore branch of the Labrador Current. Further offshore, the main branch of the Labrador Current flows along the shelf edge, carrying sub-polar waters originating from the West Greenland Current, which are modified during their transit around the northern part of the Labrador Sea. In the southern part of the region (e.g., near the tail of the Grand Bank), the Labrador Current waters meet the north-eastward flowing North Atlantic Current, the offshore extension of the Gulf Stream, consisting of warm and salty sub-tropical waters. The confluence of sub-polar and sub-tropical waters in the area makes it especially prone to large interannual variation of its climate at decadal time scales (Cyr and Galbraith, 2021).
The water mass characteristics of the NL marine ecosystem are thus largely typical of sub-polar systems, with the presence of sub-zero waters on the shelf throughout most of the year. A winter-formed layer, referred to as the cold intermediate layer (CIL), is located at mid-depth below a warmer, seasonally heated surface layer and above the warmer and highly saline Atlantic-origin waters, mostly found along the shelf break and in the deep channels and troughs.
Ocean temperature observations are regularly collected along a suite of hydrographic sections as part of DFO’s Atlantic Zone Monitoring Program (AZMP; Therriault et al., 1998). These observations were used to provide context for the bottom conditions relevant to the demersal community along the NL shelf (Figure 1). Bottom temperatures are generally relatively higher (>4°C) offshore along the shelf break and in the numerous channels and troughs. On the shelf, conditions as cold as <0°C are found at the sea floor throughout the year where the CIL intersects with the bottom (Figure 1). Natural fluctuations of the climate influence the annual volume of the CIL and thus the area of the seafloor occupied by a different temperature range (Cyr and Galbraith, 2021). Environmental data were also collected using a Conductivity-Temperature-Depth (CTD) sensor installed on the scientific trawl (see next section). For each tow, the bottom temperature and depth were derived and associated with other biomass metrics for further analysis.
2.3 Biomass data
The analyses were conducted using groundfish and shrimp biomass data (kg/tow; standardized for tow length) collected as part of DFO’s fall multispecies surveys. A Campelen 1800 shrimp trawl has been used to conduct surveys since 1995 (McCallum and Walsh, 1997). The Campelen gear has a mesh size ranging from 80 mm in the wings, to 60 mm in the square and first bellies, and 40 mm in the remaining bellies and cod end. The trawl is towed at 3.0 knots for 15 minutes. The analyses included all successful trawl sets (including those from strata that are irregularly sampled), with the minimum and maximum depth of sets being 32 m and 1500 m, respectively. The survey area is stratified by depth with trawl sets distributed using a generally proportional-allocation scheme, whereby the number of sets allocated for a given stratum is approximately proportional to the stratum area (e.g., some small strata may be allocated more sets to satisfy a minimum number of sets requirement). Additional details regarding survey design can be found in Rideout and Ings (2018) and references within.
The study period examined includes the 24 years following the ecosystem collapse of the early 1990s, from 1995 to 2018. Data were not available for Divisions 3NO in 2014 (see Rideout and Ings, 2018). Also, starting in 2011, deep strata (>732 m) in NAFO Divisions 3NO were no longer included in the fall survey design (Rideout and Ings, 2018), and were not available for this analysis.
2.4 Species and traits matrices
We constructed a trait matrix consisting of 14 functional traits related to four trait categories, coded as either continuous or binary variables (Supplementary Table S1). The traits were selected to represent the species’ functional roles with respect to the flow of energy and material within the ecosystem (for interpretations of links between presently selected trait categories and ecosystem functions, see Wiedmann et al., 2014). All groundfish taxa plus Pandalus shrimps (P. montagui and P. borealis) sampled by the trawl were included in the trait matrix and Fishbase (Froese and Pauly, 2008) was the main source of data for trait coding, with the primary literature being consulted when necessary. In total, 135 taxa were included in the analyses (Supplementary Table S1).
2.5 Metric calculations
Trends in taxonomic and functional characteristics of the groundfish plus shrimp communities were investigated by estimating metrics associated with community structure, biomass allocation and ecosystem function. We considered four types of metrics with increasing degree of computational and interpretational complexity: 1) species richness, 2) evenness, 3) unweighted and biomass-weighted community-weighted means (Lavorel et al., 2008) of each species’ maximum reported length (ML) and trophic level (TL), and 4) unweighted and biomass-weighted functional dispersion (FDis; Laliberté and Legendre, 2010). To support interpretation of these metrics, we also considered biomass fluctuations of various key species in the NL marine ecosystem.
Species richness (i.e., the number of species present in a trawl set) is the most fundamental measure of taxonomic diversity and, as such, a simple indicator of ecosystem functioning (e.g., Sala and Knowlton, 2006). Trawl-level evenness, calculated here as exp(Shannon diversity)/Species richness for each trawl, is a measure of the degree to which the biomass is evenly distributed among the species of a community (Magurran and McGill, 2011). This is directly interpretable as the ratio between the number of effective species (i.e., number of equally-abundant species that would render the observed diversity) and the number of observed species, under the assumption that the probability of finding a species is proportional to its relative abundance (see Tuomisto, 2012 for an in-depth discussion of diversity and evenness indices).
Average maximum length and trophic level serve as indicators of energy flow and trophic status of local communities. To measure changes in trophic status, community-weighted means, i.e., the mean maximum length (ML) and trophic level (TL), were calculated for each trawl. These indices were calculated as unweighted means (MLunw, TLunw) and abundance-weighted means (MLw, TLw). The unweighted version used the mean ML and TL values of the species found in each trawl set. For biomass-weighted mean traits (i.e., community-weighted means), the trait values were weighted according to the species’ relative biomasses per trawl set prior to averaging.
Functional dispersion (FDis) is a measure of functional diversity (Laliberté and Legendre, 2010), which in this study was based on functional characteristics related to body length, trophic level, feeding habits, and habitat, where high values of the metric indicate high functional diversity. Two versions of FDis were calculated: one (unweighted) based on presence/absence survey data, and one (weighted) where the species’ relative biomass (kg/tow) in each trawl set was accounted for. FDis was calculated according to a two-step process (Laliberté and Legendre, 2010). First, based on the trait matrix, a species-species dissimilarity matrix was constructed using the Gower distance measure (Gower, 1971), as our trait matrix consisted of a mix of discrete and continuous variables. Second, FDis was computed as the average distance to a centroid in multivariate trait space for the species found in each trawl. In biomass-weighted FDis, the centroid was shifted towards the species with the greatest biomass, thereby adjusting the average distance between the centroid and the species. FDis is thus a measure of the average difference in trait characteristics among species in a community. The R package ‘FD’, version 1.0-12 (Laliberté et al., 2014) was used to calculate both FDis and mean trait indices. All analyses were done in R version 4.2.1. Pairwise relationships between metrics were calculated by means of Pearson correlation values using the 'Ggally' package in R (Emerson et al., 2012; Schloerke et al., 2021).
All results are shown along depth gradients in order to account for variation in the metrics along environmental gradients not due to temporal changes. To compare the main spatial differences in the trends, these are shown separately for the NLS area and the SGB area, as defined above.
Temporal and depth trends in average values of indicators were estimated via Generalized Additive Models (GAM), using the gam() function in the ‘mgcv’ package in R (Wood, 2017). This approach models variation in each index (y) for each trawl i in region j as a combination of random trawl-specific Gaussian variation and a smoothly changing, area-specific trend in the average value of the index across the study period:
Three levels of model complexity were fitted, including year only, depth only, and both main terms and their interaction as a 2D surface. The smooth trend function was estimated with a thin-plate regression spline with maximum four basis functions for the main terms (s(year, bs=“tp”, k=4) and s(depth, bs=“tp”, k=4) in ‘mgcv’), and a cubic spline with maximum 10 basis functions for the 2D interaction surface (te(year, depth, bs=“cr”, k=10) in ‘mgcv’). The number of basis functions determines the maximum degree of flexibility of the smoother. As the goal of this analysis was to highlight low-frequency (i.e., long-term) variation in the indices that might correspond with large-scale variation in ecological conditions, rather than high-frequency inter-annual fluctuations, the maximum number of basis functions was limited manually. Coefficients and smoothing parameters for each trend model were estimated using Restricted Maximum Likelihood (RML, Wood, 2017).
Maps for each metric were created for each year using ordinary kriging with an exponential variogram (R package ‘gstat’, version 2.1.0; Diggle and Ribeiro, 2007). A 20 by 20 km output grid was used within the study area (i.e., the smallest polygon containing all the sets). In order for the variogram models to converge, 11 out of ~14,000 trawl sets with very high values of weighted ML (0.001 upper percentile) were excluded from the kriging.
3 Results
In total, 14,141 trawl sets across 24 years were used to study spatial and temporal changes in the demersal communities of the NL marine ecosystem. Virtually all variation in community metrics with depth took place on the shelf (i.e., 0 – 150 m) or upper shelf break (i.e., 150 – 450 m). The metrics did not show strong variation with temperature independent of depth (see Supplementary Figures S2–S4 for metrics values at all depths and temperature ranges). Major differences in temporal trends were encountered between the NLS and SGB areas, but not among NAFO Divisions within these areas; hence, these results are presented at the larger scale (see Supplementary Figures S5 and S6 for temporal and depth trends by division, and Supplementary Figure S7 for spatial variation in selected years).
When comparing the variance explained by the time, depth or their combination (Figure 2), it is noticeable that depth explained a much larger part of the total variance for all metrics and areas. This suggests that there are larger differences in metrics along the depth gradients within the same year, than between decades. Year alone did not explain much variance except for the weighted metrics in NLS. The most complex model, including both main terms and interaction, obviously explained the most. Species richness showed the highest R2 in both areas, with depth being the primary explanatory variable. This suggests that the simplest metric was very well predicted by the depth gradient alone. In NLS the weighted metrics were the ones showing the highest variation explained by time.
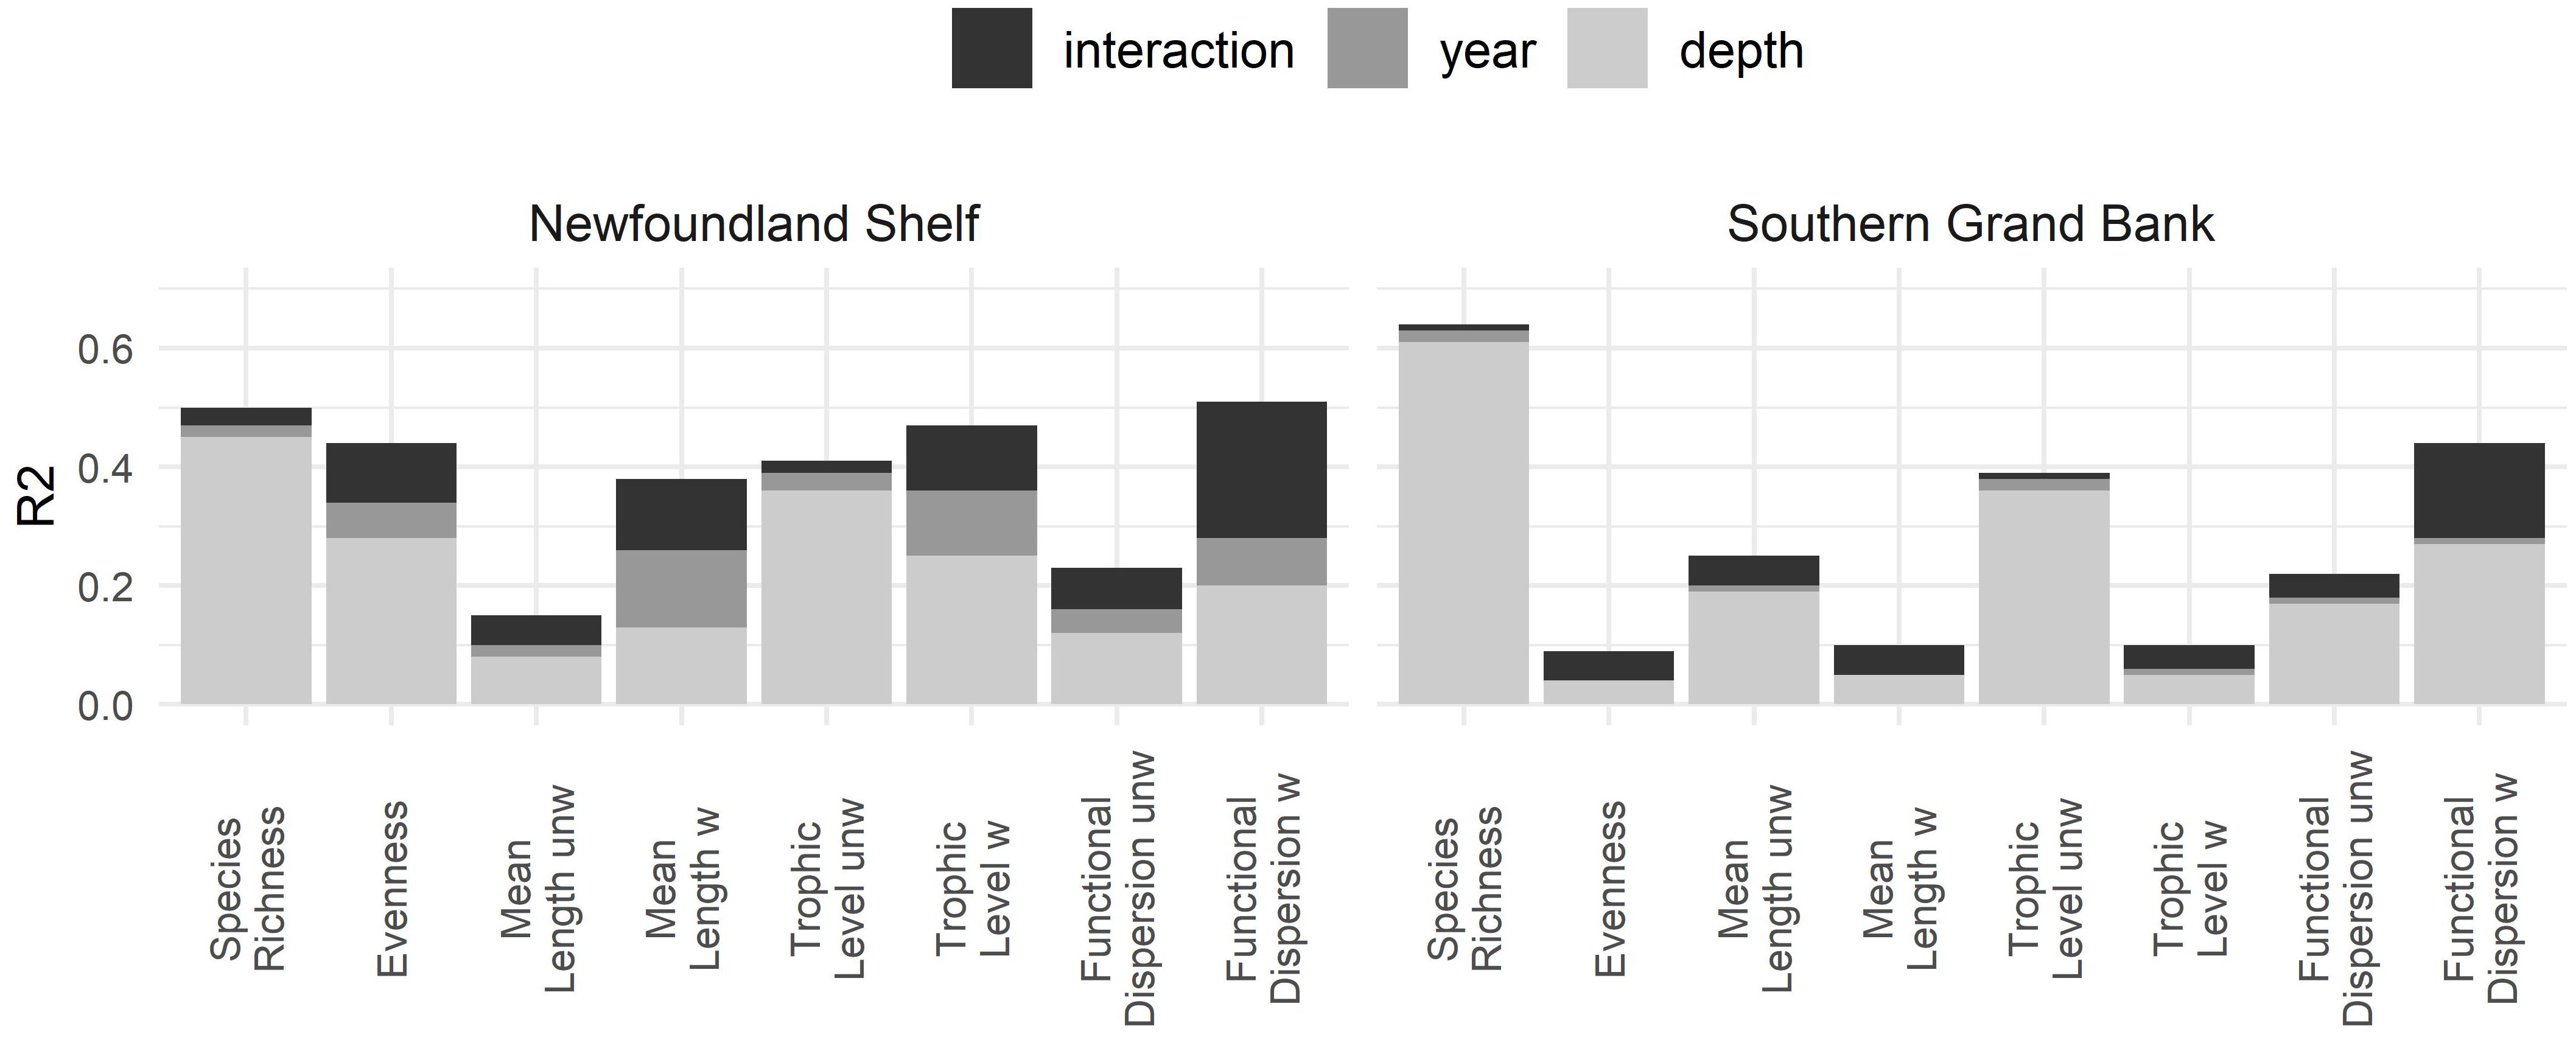
Figure 2 R2 for GAM models with different levels of complexity fitted to all metrics. Three types of models were fitted (see legend and methods) including year, depth or both main terms and their interaction as a 2-dimentional cubic spline. The partial contribution of each main term and interaction is shown in each bar (different colours) and the total height of the bar represents the R2 of the full model. Models were fitted separately for the Newfoundland Shelf (left) and Southern Grand Bank areas (right).
3.1 Species richness and evenness
Species richness showed modest temporal variation throughout the study period, whereas evenness displayed some temporal variation (Figure 3).
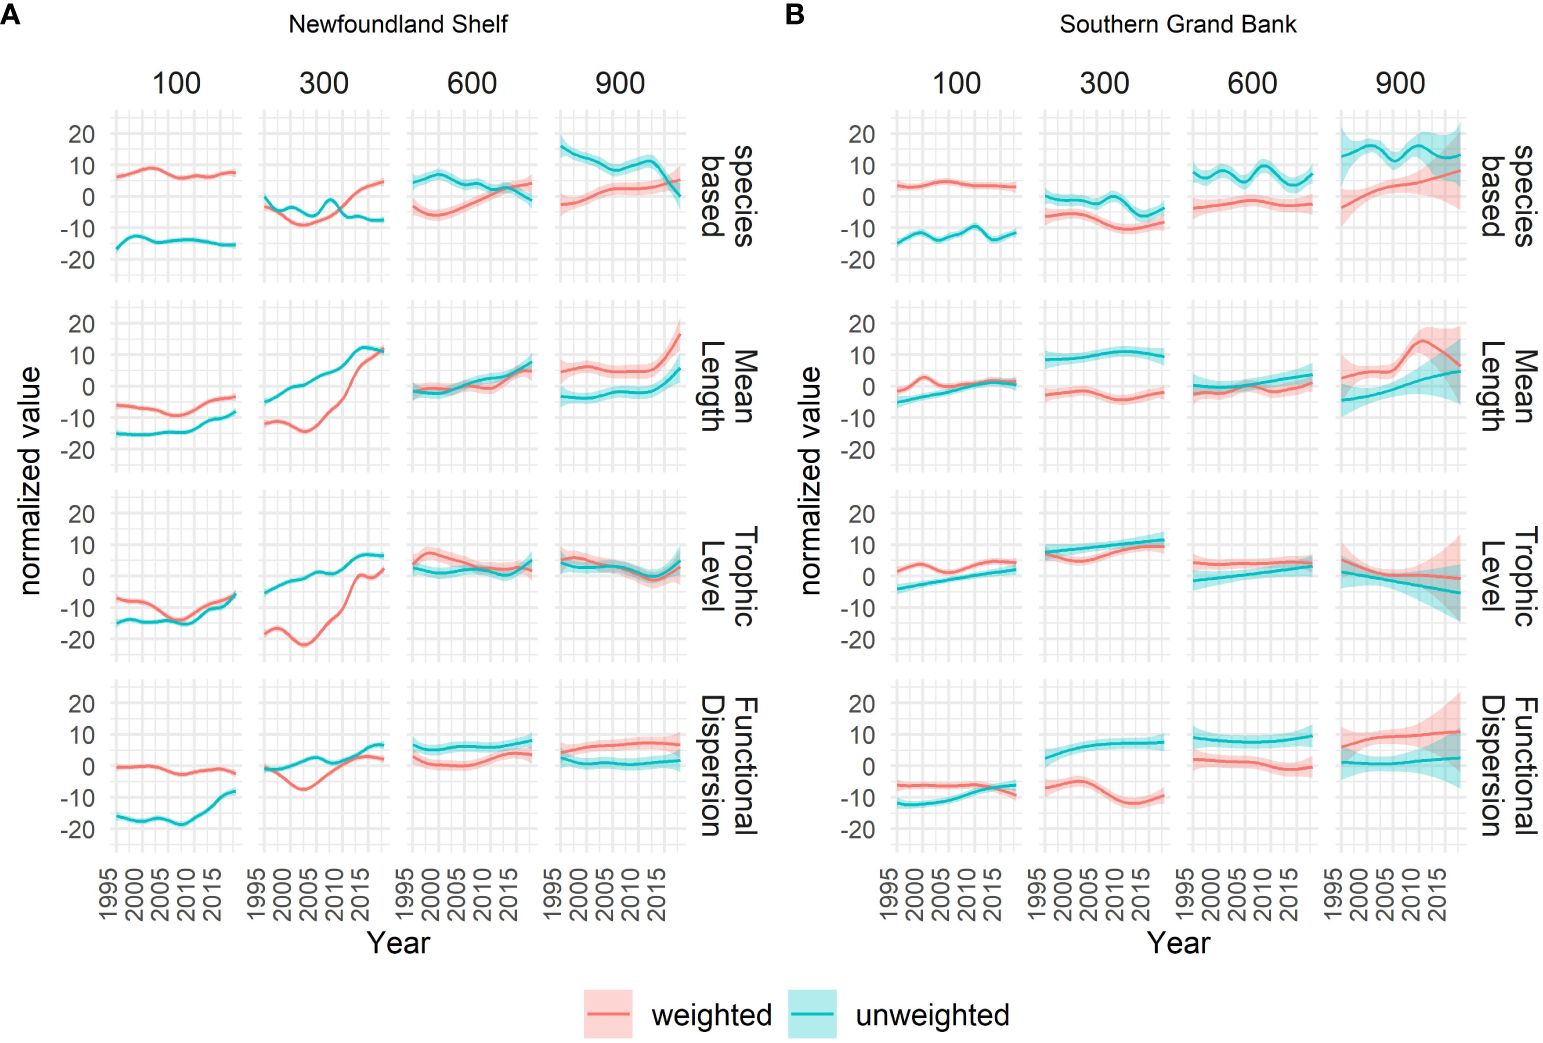
Figure 3 Temporal trajectories of all metrics in their unweighted (blue) and weighted (red) form derived from the 2D smoothed surface modelled from year, depth and their interaction. Values for each metric are normalized for comparability. In this plot species richness and evenness are shown in the same panel as comparable species-based metrics in respectively an unweighted and weighted form (blue = species richness, red = evenness). The smoothed lines (and 95% confidence bands) show the profile of the 2D surface cut at specific depths (panels) for the Newfoundland Shelf (A) and Southern Grand Bank (B) areas.
Most temporal patterns in species richness and evenness were evident only in specific areas and/or depth ranges (Figures 3A, B). For instance, although species richness showed similar levels in the two areas NLS and SGB, a slight decrease of a few species was observed in NLS throughout the study period, whereas no such decrease was observed in the SGB area.
In both areas, species richness increased substantially with depth (by approximately 80%) whereas evenness was highest in shallow shelf waters. Moreover, the most prominent spatial and temporal patterns occurred at the upper shelf break (150 - 450 m depth). For instance, levels of evenness at the start of the study period were similar across most depths, but significant temporal variation in evenness was observed, mostly at the upper shelf break. In this depth range, NLS showed a decrease in evenness during the first 10 years of the study period followed by an equally large and constant increase in the following period. For the SGB area this trend was less evident, with a decrease in evenness followed by a flattening trend.
3.2 Trait-based metrics
All the unweighted trait-based metrics increased with time, consistent with expectations for a recovery trend at the entire community level. Also, weighted ML and TL increased strongly throughout the study period. On the other hand, patterns in weighted FDis strongly resembled corresponding trends in evenness.
Unlike species richness, the trait-based metrics showed no specific persistent pattern along the depth gradient. Yet, as observed in species richness and evenness, many of the temporal patterns in the trait-based metrics were most prominent in specific areas and/or depth ranges. In particular, dramatic temporal increases in weighted and unweighted ML and TL occurred at the upper shelf break in NLS. Here, the values of weighted ML and TL at the start of the study period were lower than any of the values in the other depth ranges, while they increased to similar or higher values by the end of the study period (i.e., after ca. 2002).
At the upper shelf break, unweighted ML and TL had a similar increasing pattern in the NLS area but was less prominent in the SGB area. In the same depth range, the values of weighted ML and TL were much lower in the NLS area than in the SGB area at the start of the study period but, due to the different recovery rates between the two areas, the metrics showed a much smaller difference by the end of the study period. Unweighted FDis increased with time in both areas.
Smoothed plots of weighted TL and ML by depth in four different years confirm that the primary depth range of community change is 150 – 450 m, with the largest changes occurring at around 300 m depth (Figure 4). These four years represent a general temporal development throughout the study period, with a small decline in weighted TL and ML during the first decade of the study period, and a strong and consistent increase in both metrics through the following decade.
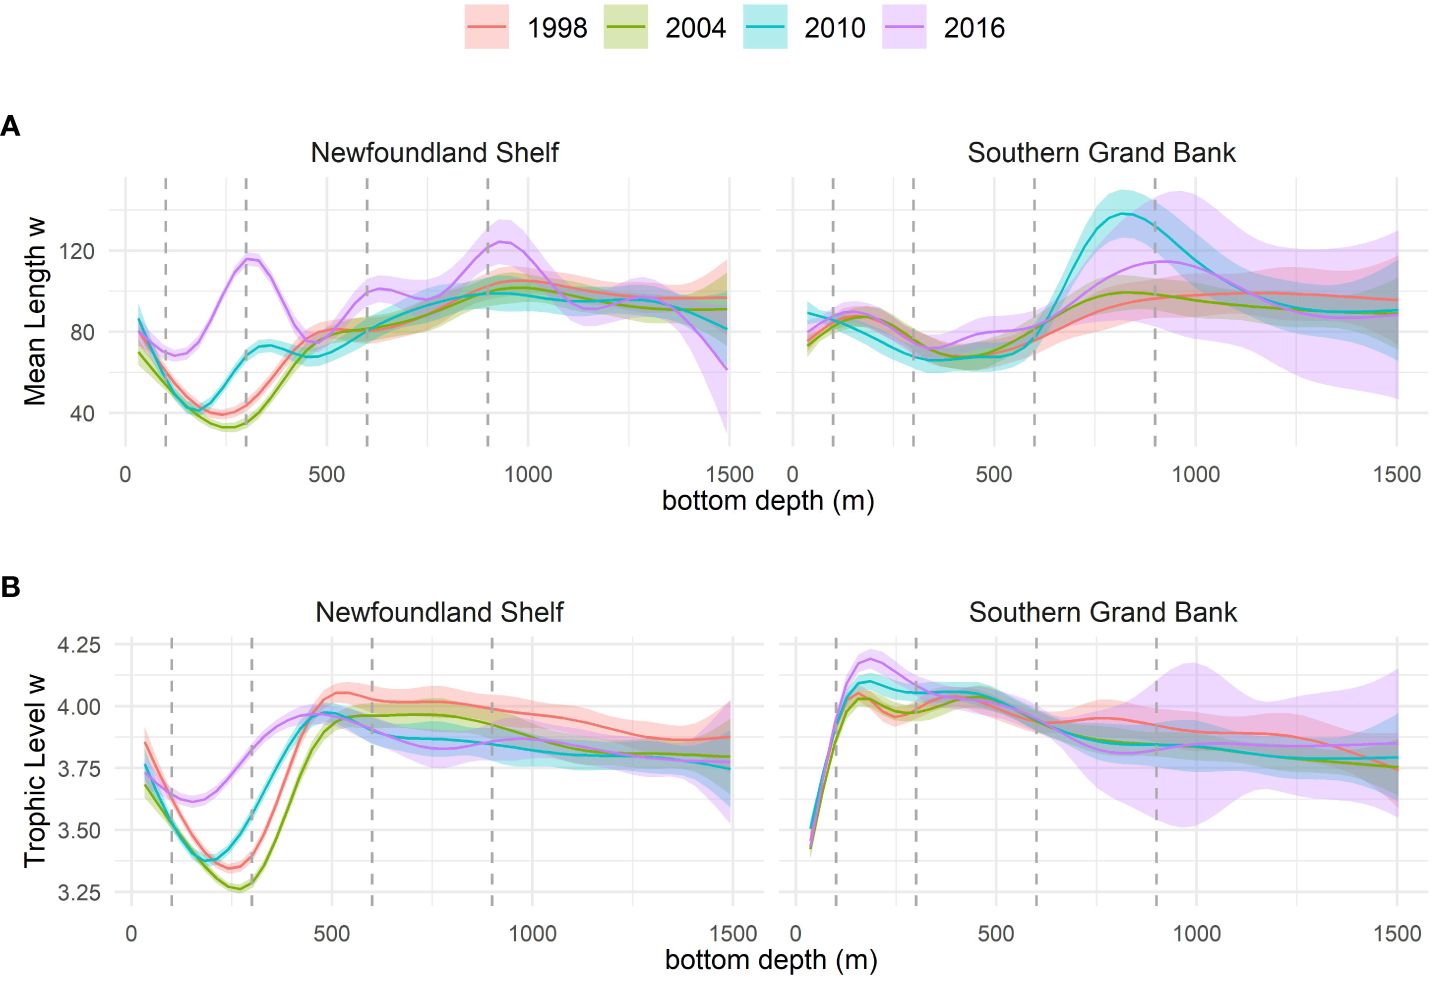
Figure 4 Depth trajectories of (A) weighted Maximum reported Length and (B) weighted Trophic Level from the 2D smoothed surface modelled from year, depth and their interaction. The smoothed lines (and 95% confidence bands) show the profile of the 2D surface cut at specific years (colours) for the Newfoundland Shelf and Southern Grand Bank areas. Dashed vertical lines show the specific depths for which temporal trajectories are shown in Figure 3.
3.3 Spatial variation
Figure 5 shows the spatial distribution of TL and ML in both their unweighted and weighted form. The maps illustrate a general increase in unweighted metrics (panels A and C) over the entire study area in the 24-year period and show how the NLS and SGB areas generally become more similar over time. The maps with weighted metrics (panels B and D) clearly show that the greatest temporal trends occurred at the upper shelf break over the depth range of 150 – 450 m in the NLS area.
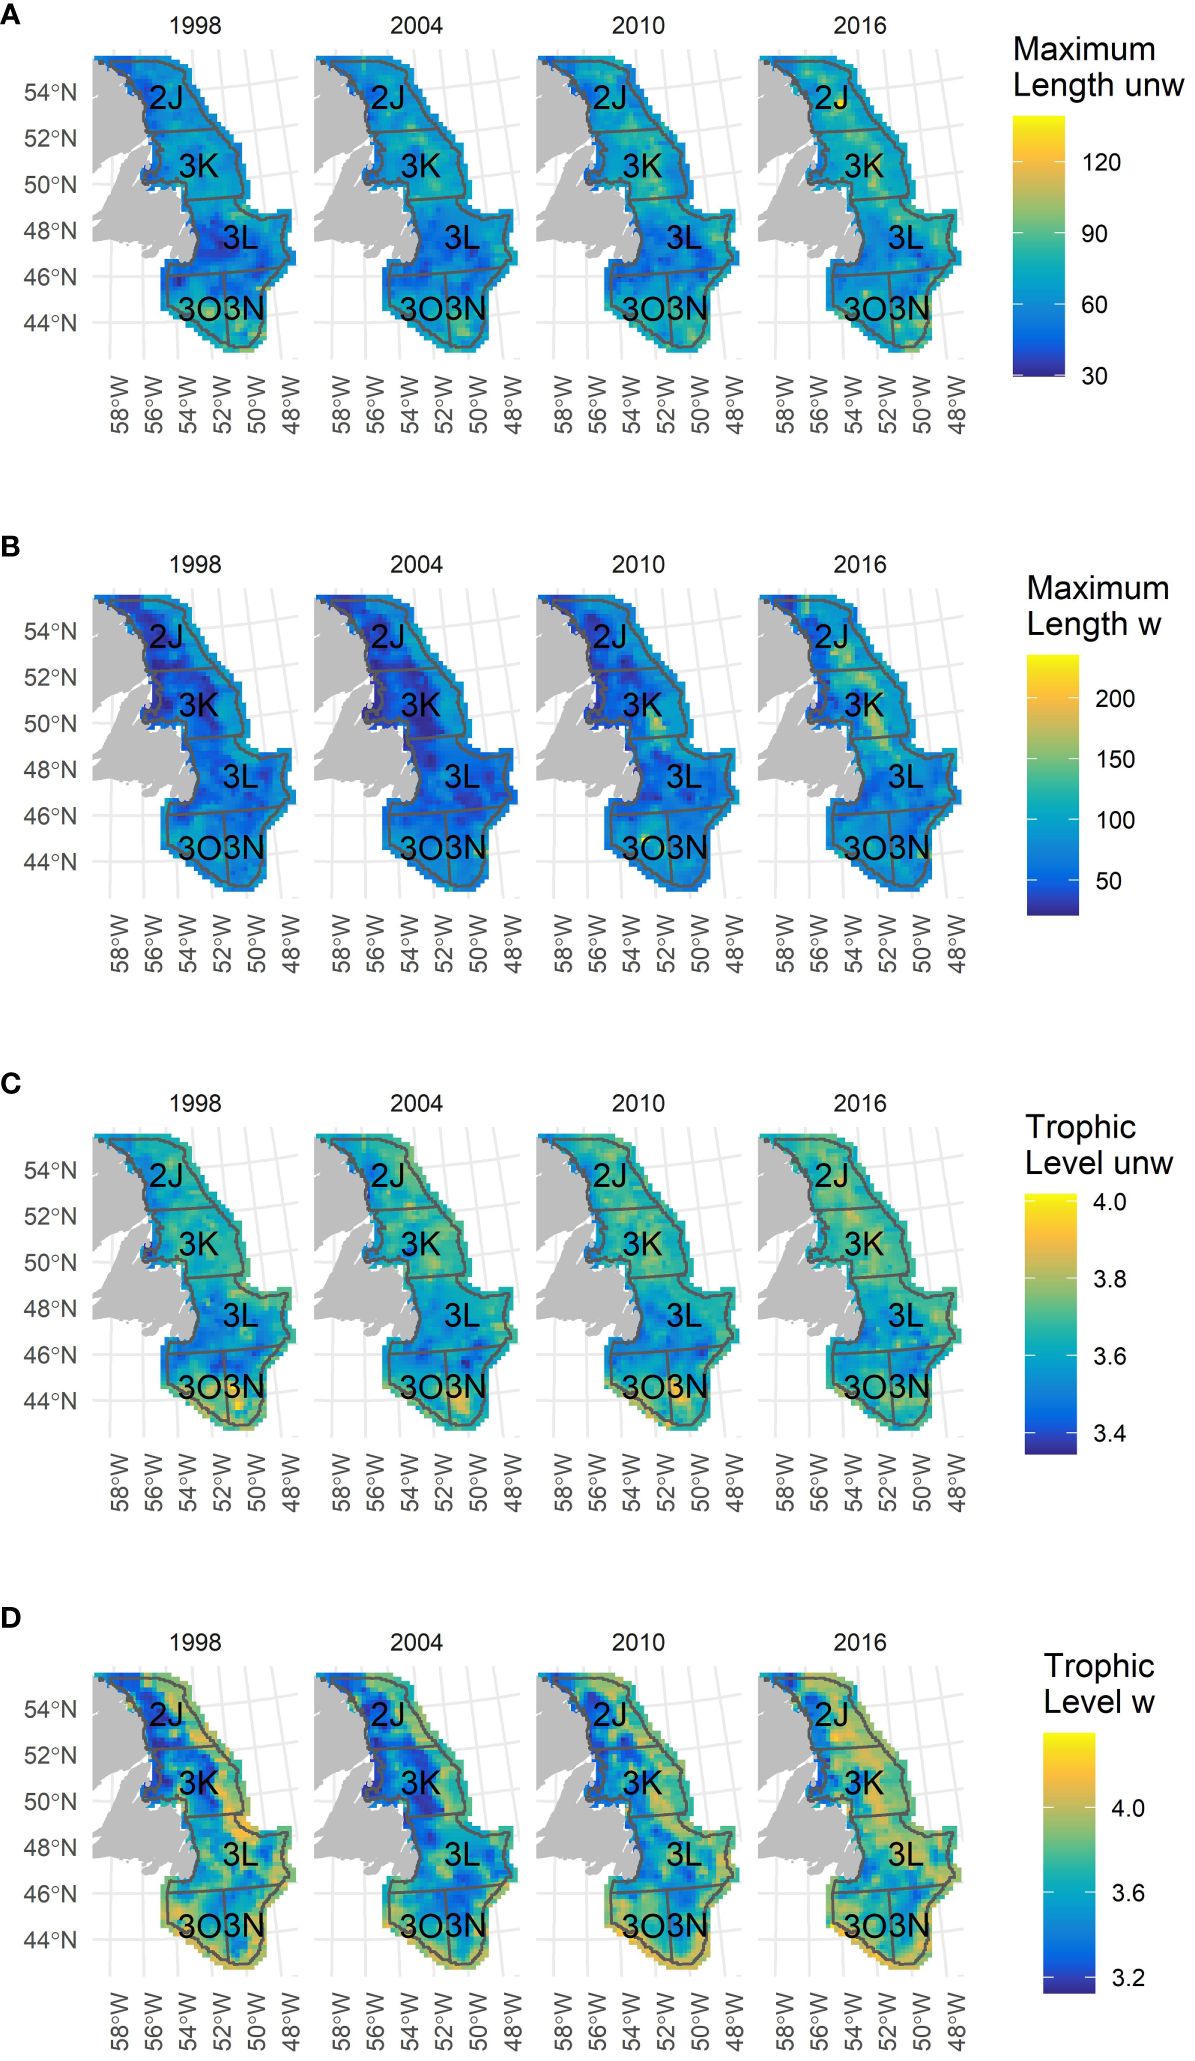
Figure 5 Geographical distribution maps of (A) unweighted and (B) weighted Maximum reported Length, and (C) unweighted and (D) weighted Trophic Level in five selected years. Comparable maps for evenness, species richness and Functional Dispersion can be found in Supplementary Figure S7.
3.4 Correlations between metrics
Unweighted ML and unweighted TL showed the strongest relationship among the metrics currently assessed (Pearson correlation value = 0.809, p<0.001; Supplementary Figure S8), whereas other relationships between ML and TL metrics were also generally strong. Other strong relationships included those between unweighted FDis and both unweighted TL and unweighted ML, and between evenness and weighted FDis.
4 Discussion
In this study, we found considerable spatial and temporal variability in the taxonomic and functional characterization of NL demersal communities during the 1995 to 2018 post-collapse period. There were structural differences between the two study areas (NLS and SGB), as well as across depth gradients. In the north, the temporal changes in functional characterization and diversity were most pronounced at intermediate depths, where mean size and trophic level increased rapidly in later years, responding to a decline in shrimp and an increase in groundfish (Koen-Alonso and Cuff, 2018).
4.1 Recovery as suggested by trait-based metrics
The most prominent spatial and temporal variation observed in this study was related to the trait-based metrics, particularly in weighted ML and TL. These metrics displayed the most prominent changes in the NLS area in later years (after ca. 2002) and within the intermediate depth range of 150-450 m. This is consistent with the effect of the collapse and patterns of subsequent recovery being more prominent in the NLS area and at intermediate depths (e.g., Myers et al., 1997). The collapse of this marine community was driven by the combined effects of long-term overfishing and unfavorable environmental conditions (Koen-Alonso et al., 2010; Dempsey et al., 2017, 2018; Koen-Alonso et al., 2022). Early in the study period, the NL demersal community was characterized by low biomasses of large predatory fish relative to pre-collapse levels, with shrimp becoming a dominant ecosystem component in the northern area (NLS) (Dawe et al., 2012; Koen-Alonso and Cuff, 2018). Long-term selective fishing (typically targeting large individuals of specific species), like what contributed to the NL ecosystem collapse, has been shown to negatively affect the functional diversity of fish communities due to a selective removal of particular traits (i.e., high TL and high ML species), resulting in altered ecosystem functioning (Martins et al., 2012). Consequently, and in line with theoretical and empirical expectations (e.g., Pauly et al., 1998; Le Quesne and Jennings, 2012), weighted ML and TL values were low at the start of the study period. These metrics decreased slightly until the mid 2000’s and then increased significantly at intermediate depths (150 to 450 m), which is the main habitat of two key species in this system, i.e., the Northern shrimp and the Atlantic cod (Scott, 1982; Shumway et al., 1985). This was likely triggered by a modest improvement in capelin (Koen-Alonso and Cuff, 2018; Koen-Alonso et al., 2021), which led to increases in groundfish biomass, and consequently increases in predation pressure on shrimp. This increased predation, together with some influence from fishing, led to an overall decline in shrimp biomass which was more noticeable in the north. This interpretation is also consistent with the differential changes observed in the weighted metrics by area, where the increases after the mid 2000’s led to similar TL values but larger ML values for the NLS by the end of the study period, patterns that were primarily caused by increases in the biomass of cod in the NLS (high TL and ML) and redfish in the SGB (high TL but low ML; see Supplementary Figures S9 and S10 ; DFO, 2020, 2022).
In contrast, unweighted trait-based metrics (FDis, ML, TL) showed a fairly consistent increase in both areas and over a wide depth range (down to 600 m depth) throughout the study period. This increase was most pronounced in the NLS, and this differential rate of increase led to a reduction in spatial differences in unweighted FDis, TL and ML between areas towards the end of the study period (Figure 5). The unweighted metrics are decoupled from both taxonomic diversity and biomass allocation to functional groups (Laliberté and Legendre, 2010), which suggests that the NL marine demersal communities have undergone structural changes during the entire study period, becoming more functionally diverse. Since unweighted functional diversity metrics are more sensitive to the contributions of less abundant species than weighted metrics, this pattern indicates a recovery of this group of species. This could be expected within an overall recovery trajectory given that the collapse affected the entire fish community, not just commercially exploited taxa (Koen-Alonso and Cuff, 2018), and that less abundant species were affected earlier than more common ones (Pedersen et al., 2017). As rare species can often contribute disproportionately to the provisioning of ecosystem function (Mouillot et al., 2013b), this finding underpins that biomass-weighted and unweighted metrics are complementary when assessing different aspects of community change, facilitating detection of previous, ongoing, and future changes.
4.2 Tracking recovery: species richness vs evenness
Despite major changes in FDis, species richness remained virtually constant throughout the study period in all areas but did show higher richness at increasing depths. This absence of temporal trends in a system that has undergone such dramatic structural changes during the study period clearly confirms that species richness itself can be a poor indicator of recovery or structural configuration in the community (Mouillot et al., 2013a). This observation is consistent with prior studies indicating that functional diversity metrics can track community changes to a much greater extent than changes in the number of species can (e.g., Flynn et al., 2009; Teixidó et al., 2018). Indeed, in this study, species richness was weakly yet significantly associated with unweighted FDis, but not significantly associated with weighted FDis (Supplementary Figure S8). Although trait-based metrics are more challenging to interpret, incorporation of traits in community-level analyses thus clearly adds information not carried by the species’ numbers and biomasses alone.
Evenness showed major shifts during the study period. In the NLS area, upper shelf break waters showed decreasing evenness values from the mid-1990’s until the mid-2000’s. This coincided in time and space with high relative abundances of shrimp in the NLS (Koen-Alonso and Cuff, 2018). From the mid-2000’s until the end of the study period, evenness increased at >150 m depths as many groundfish stocks grew and shrimp stocks declined (Koen-Alonso and Cuff, 2018; see Supplementary Figures S9 and S10 for biomass density trends of shrimps and Atlantic cod; DFO, 2022; DFO, 2023). Interestingly, evenness was strongly correlated with weighted FDis, confirming that both metrics are shaped by the same biomass dynamics and are thereby partly redundant. Unweighted FDis was significantly but less strongly correlated with species richness, indicating that the former metric holds considerable information on biodiversity beyond what is carried by the latter one.
Low evenness typically occurs in communities with a few generalist species, whereas an increase in evenness can be expected as the number of abundant species in the community decreases (Magurran et al., 2013; Maureaud et al., 2019). In NLS, the low evenness during the first years of the study period was driven by a high abundance of shrimp, a low trophic level species. Similar transitions in evenness linked to changes between high- and low-trophic-level taxa have been observed in other marine systems. For instance, in a Kenyan marine protected area, small-sized fish showed rising abundances in the first years after closure. Later, as larger species became more abundant, predatory control took effect and a subsequent decline in the abundance of small-bodied species was evident (McClanahan et al., 2007). Also, transitions between dominance of small fish vs. larger fish have recently been documented. In the Barents Sea, increasing water temperatures and declining ice-coverage allowed boreal species, especially Atlantic cod, to expand their distribution in northern areas (Fossheim et al., 2015). This resulted in a cod distribution totally overlapping the historical ranges of the Arctic fish community, consisting mainly of small-bodied fish, and a subsequent decrease in the biomass and distribution of Arctic species (Johannesen et al., 2017; Johannesen et al., 2021).
4.3 Tracking and interpreting ecosystem changes using complementary diversity metrics
Based on unweighted diversity metrics, we were able to identify a directional, structural change in the NL demersal communities indicating a slow but generally steady trend towards a state that is consistent with the features expected from a pre-collapse ecosystem structure (e.g., larger organisms, higher functional diversity). On the other hand, the weighted metrics captured a major shift in dominance between cod and shrimp at intermediate depths which mainly occurred in the NLS area. Pedersen et al. (2017) analyzed changes in weighted functional diversity for the NLS before and after the collapse and found that a functional recovery to pre-perturbation levels was possible. Our present analyses exclusively focused on post-collapse data, and an explicit comparison to pre-collapse levels of various metrics was therefore not possible. Yet, our estimates of weighted FDis did not show strongly positive post-collapse trends comparable to those shown by Pedersen et al. (2017). On the contrary, trends in weighted FDis closely followed trends of the evenness metric, and that provides an avenue to understand and interpret the differences between these studies. Pedersen et al. (2017) analyzed weighted FDis trends considering 30 abundant groundfish species, while our study considered 135 taxa, and more importantly, included shrimp. Therefore, our results emerge from considering a broader community with high biomasses of a few species with very dissimilar traits (i.e., shrimp and predatory fishes), while the Pedersen et al. (2017) study, by focusing on groundfishes, did not capture the effect of shrimp on weighted FDis. These differences suggest that, while the groundfish component of the community may have recovered its pre-collapse functionality (although not its former biomass level), other community components have not. This indicates that rebuilding ecological functionality is not a homogeneous process; different ecosystem components respond to perturbations at different rates, with overall rebuilding resembling more of a temporal mosaic of recovery trajectories.
Taken together, these results confirm the value of considering a suite of diversity metrics to study and interpret ecosystem changes (e.g., Kelly and Harwell, 1990). The ecosystem properties measured in this study were either monotonic increasing, decreasing, or varying with time, indicating that NL ecosystems have been undergoing changes during the entire study period. This supports recent findings that the groundfish community in this ecosystem has likely been away from a stable state since the regime shift (Pedersen et al., 2020). From this perspective, both the high dominance of shrimp in the 2000’s and the more recent trend toward a groundfish-dominated community can be interpreted as different stages in a long-term recovery from the major perturbation that the regime shift represented.
While the average recovery rate of aquatic ecosystems ranges between 5 and 10 years (Jones and Schmitz, 2009), 30 years have passed since the regime shift in NL ecosystems in the early 1990s. Our study confirms that more complex ecosystems and long-lived species can take much longer to recover (Lotze et al., 2011). Whether NL ecosystems will return to their pre-collapse state is challenging to predict; even the current trend towards a groundfish-dominated community does not imply that a fully rebuilt community will have the same structure as the one that existed prior to the collapse. Any future ecosystem configuration will be a function of the capacity of the system to tolerate and respond to perturbations (Van Meerbeek et al., 2021), as well as the changing environmental conditions and human pressures that it is exposed to. The importance of these drivers cannot be understated. The changes in the NL ecosystem coincided with similar regime shifts in other northern marine ecosystems (Möllmann and Diekmann, 2012), and this synchrony has been associated with large-scale climate drivers. This exemplifies the major role that environmental changes can have on ecosystem functionality by setting boundary conditions for ecological processes. In a world increasingly defined by climate change, predicting future ecosystem trajectories and states becomes an increasingly difficult endeavor, and one that cannot be tackled without considering climate impacts.
The regime shift in the NL marine ecosystem is a classic example of a major ecosystem reorganization that has had significant ecological and socio-economic consequences (e.g., Steele et al., 1992; Bundy et al., 2009). However, our results indicate that overall differences in metrics between areas and along a depth gradient were far larger than any of the temporal trends in the 24-year study period. Metrics calculated across large environmental gradients and different habitats may average out specific temporal trends that occur in specific areas or habitats. This is particularly remarkable given the magnitude of the changes this ecosystem has experienced over time (e.g., Pedersen et al., 2017, 2020; Koen-Alonso and Cuff, 2018), and provides support to the idea that topographical and oceanographic characteristics provide major boundary conditions to the organization of these marine communities (NAFO, 2014; Pepin et al., 2014; Wells et al., 2017). Moreover, another factor possibly affecting diversity and allocation of species is the spatial variation in seabed sediment type, which is substantial in the study area (e.g., Piper, 1991). Indeed, the seabed sediment texture may impact fish and benthos diversity and community structure (e.g., Callaway et al., 2002; Schultz et al., 2015). The sediments of the shallow Grand Bank area are largely sandy, whereas deeper areas and areas further north mainly consist of mud and sandy mud (Piper, 1991). Muddy sediments in the north facilitate higher benthic oxygen consumption than sandy sediments on the Grand Bank (Grant et al., 1991), possibly resulting in a higher benthic production and increased potential for diverse fish communities in these areas. Although our current data do not allow for explicit analyses of the impact of seabed type on the fish community structure in the NL ecosystem, this topic represents an interesting path for follow-up investigations.
As this evidence of large-scale climate connections across marine ecosystems highlights some challenges, it also reveals opportunities. The general similarity in the responses across ecosystems (Möllmann and Diekmann, 2012) also indicates likely commonalities in the processes that regulate their dynamics. This provides a way for gaining knowledge on how ecosystems may respond to future perturbations, not just through comparative studies using metrics like the ones considered here, but also complementing those with integrated modelling of multiple ecosystems sharing common regulatory mechanisms (e.g., Koen-Alonso et al., 2021).
5 Conclusions
While ecosystem collapses or regime shifts can occur abruptly, their recovery is often a slow and non-homogenous process in space and time, and depend on the components involved (e.g., Lotze et al., 2011; Robertson et al., 2021). Assessments of the recovery phase following major ecosystem perturbation is key to allow for more efficient management of both ecosystem sustainability and economic and societal concerns (e.g., Kelly and Harwell, 1990). Our study documents the 1995-2018 post-collapse period of the NL ecosystem, and shows the utility of considering a range of complementary diversity metrics, including taxonomic and functional diversity using weighted and unweighted metrics, to capture the multifaceted nature of ecosystem changes. Our results describe a slow recovery process that has different characteristics between NLS and SGB, highlighting that different ecosystem components (e.g., groundfish vs. broader community) respond at different rates. Moreover, the most prominent changes occurred within a relatively narrow depth range at the upper shelf break. While several metrics were partly redundant, all metrics displayed different spatio-temporal patterns. For instance, the temporal variation in species richness was limited, whereas the number of species increased with depth. On the other hand, unweighted community-weighted means of body length and trophic level displayed increasing values at the upper shelf break throughout the study period, whereas corresponding biomass-weighted metrics increased more strongly, but only in later years. These differences between weighted and unweighted metrics indicate that changes in the structure of this demersal community were occurring from the beginning of the study period in both areas, whereas the biomass recovery of large predators started a decade later. Furthermore, unweighted functional dispersion, a metric of functional diversity, also increased over time, indicating that the ecosystem recovered from a collapse that affected functionality of the entire fish community, not only commercially exploited species. This paper thus highlights how a suite of community-level diversity metrics can be applied in order to assess post-collapse biodiversity trends, in space and time. Further, the paper provides additional support for the importance of physical and environmental conditions in setting up boundaries for ecological process, which emphasizes the role of future ocean climate in defining how this recovery process will proceed.
Data availability statement
The data analyzed in this study is subject to the following licenses/restrictions: The dataset used is held and maintained by Fisheries and Oceans Canada. Requests to access these datasets should be directed to https://www.meds-sdmm.dfo-mpo.gc.ca/isdm-gdsi/request-commande/form-eng.asp.
Ethics statement
The animal study was approved by ethical review and approval was not required for the animal study because this study used data collected by DFO research vessel surveys which are authorized pursuant to Sections 52 and 56 of the Fishery (General) Regulations to harvest, collect, sample, capture, enumerate, biopsy, and/or tag (including capture and release) finfish, shellfish, and other vertebrates/invertebrates, marine mammals, marine turtles, and marine plants for scientific, research, and educational purposes (license # NL-7295-23). The study was conducted in accordance with the local legislation and institutional requirements.
Author contributions
MA, NW, EP, EE, MK-A, RP, UL, and PR conceptualized study. NW and MA compiled the trait matrix. VR conducted the analyses. FC compiled the environmental data and generated the map. MA, VR, NW, and MW wrote first draft of the manuscript. All authors contributed significantly to the manuscript and approved the submitted version.
Funding
The author(s) declare financial support was received for the research, authorship, and/or publication of this article. This paper is a contribution to the research project “A Transatlantic innovation arena for sustainable development in the Arctic” (CoArc). We greatly acknowledge funding from the Norwegian Ministry of Foreign Affairs (project number QZ-15/0457), and additional financial support from Akvaplanniva and Fisheries and Oceans Canada (DFO).
Acknowledgments
This study builds upon the work of many people and benefited from the discussions we initiated during a CoArc Project Workshop held in Brest, France in 2019. We are especially grateful to G. Stenson, for discussions that helped in shaping the paper. Many thanks to the scientists and technicians at DFO that collected the data used for this paper. Constructive comments from three reviewers are greatly acknowledged.
Conflict of interest
The authors declare that the research was conducted in the absence of any commercial or financial relationships that could be construed as a potential conflict of interest.
Publisher’s note
All claims expressed in this article are solely those of the authors and do not necessarily represent those of their affiliated organizations, or those of the publisher, the editors and the reviewers. Any product that may be evaluated in this article, or claim that may be made by its manufacturer, is not guaranteed or endorsed by the publisher.
Supplementary material
The Supplementary Material for this article can be found online at: https://www.frontiersin.org/articles/10.3389/fmars.2024.1237573/full#supplementary-material
References
Aune M., Aschan M. M., Greenacre M., Dolgov A. V., Fossheim. M., Primicerio R. (2018). Functional roles and redundancy of demersal Barents Sea fish: Ecological implications of environmental change. PloS One 13, e0207451. doi: 10.1371/journal.pone.0207451
Beverton R. J. H. (1990). Small marine pelagic fish and the threat of fishing; are they endangered? J. Fish Biol. 37, 5–16. doi: 10.1111/j.1095-8649.1990.tb05015.x
Bundy A., Heymans J. J., Morissette L., Savenkoff C. (2009). Seals, cod and forage fish: A comparative exploration of variations in the theme of stock collapse and ecosystem change in four Northwest Atlantic ecosystems. Prog. Oceanogr. 81, 188–206. doi: 10.1016/j.pocean.2009.04.010
Buren A. D., Koen-Alonso M., Stenson G. B. (2014a). The role of harp seals, fisheries and food availability in driving the dynamics of northern cod. Mar. Ecol. Prog. Ser. 511, 265–284. doi: 10.3354/meps10897
Buren A. D., Koen-Alonso M., Pepin P., Mowbray F., Nakashima B., Stenson G., et al. (2014b). Bottom-up regulation of capelin, a keystone forage species. PloS One 9, e87589. doi: 10.1371/journal.pone.0087589
Buren A. D., Murphy H. M., Adamack A. T., Davoren G. K., Koen-Alonso M., Montevecchi W. A., et al. (2019). The collapse and continued low productivity of a keystone forage fish species. Mar. Ecol. Prog. Ser. 616, 155–170. doi: 10.3354/meps12924
Callaway R., Alsvåg J., de Boois I., Cotter J., Ford A., Hinz H., et al. (2002). Diversity and community structure of epibenthic invertebrates and fish in the North Sea. ICES J. Mar. Sci. 59, 1199–1214. doi: 10.1006/jmsc.2002.1288
Cyr F., Galbraith P. S. (2021). A climate index for the Newfoundland and Labrador shelf. Earth Syst. Sci. Data 13, 1807–1828. doi: 10.5194/essd-13-1807-2021
Dawe E., Koen-Alonso M., Chabot D., Stansbury D., Mullowney D. (2012). Trophic interactions between key predatory fishes and crustaceans: comparison of two Northwest Atlantic systems during a period of ecosystem change. Mar. Ecol. Prog. Ser. 469, 233–248. doi: 10.3354/meps10136
Dempsey D. P., Gentleman W. C., Pepin P., Koen-Alonso M. (2018). Explanatory power of human and environmental pressures on the fish community of the Grand Bank before and after the biomass collapse. Front. Mar. Sci. 5. doi: 10.3389/fmars.2018.00037
Dempsey D. P., Koen-Alonso M., Gentleman W. C., Pepin P. (2017). Compilation and discussion of driver, pressure, and state indicators for the Grand Bank ecosystem, Northwest Atlantic. Ecol. Ind. 75, 331–339. doi: 10.1016/j.ecolind.2016.12.011
DFO (2009). Development of a framework and principles for the biogeographic classification of Canadian marine areas. DFO Can. Sci. Advis. Sec. Sci. Advis. Rep. 2009/056 (Ottawa ON: Fisheries and Oceans Canada).
DFO (2020). Stock status of redfish in NAFO SA 2 + Divs. 3K. Can. Sci. Advis. Sec. Sci. Advis. Rep. 2020/021 (Ottawa ON: Fisheries and Oceans Canada).
DFO (2022). Stock assessment of northern cod (NAFO divisions 2J3KL) in 2021. Can. Sci. Advis. Sec. Sci. Advis. Rep. 2022/041 (Ottawa ON: Fisheries and Oceans Canada).
DFO (2023). Assessment of Northern shrimp (Pandalus borealis) in shrimp fishing areas 4-6 in 2021. Can. Sci. Advis. Sec. Sci. Advis. Rep. 2023/038 (Ottawa ON: Fisheries and Oceans Canada).
Diggle P. J., Ribeiro P. J. (2007). Model-based geostatistics (Springer Series in Statistics) (New York, NY: Springer). doi: 10.1007/978-0-387-48536-2
Emerson J. W., Green W. A., Schloerke B., Crowley J., Cook D., Hofmann H., et al. (2012). The generalized pairs plot. J. Comput. Graph. Stat. 22, 79–91. doi: 10.1080/10618600.2012.694762
Flynn D. F. B., Gogol-Prokurat M., Nogeire T., Molinari N., Richers B. T., Lin B. B., et al. (2009). Loss of functional diversity under land use intensification across multiple taxa. Ecol. Lett. 12, 22–33. doi: 10.1111/j.1461-0248.2008.01255.x
Fossheim M., Primicerio R., Johannesen E., Ingvaldsen R. B., Aschan M. M., Dolgov A. V. (2015). Recent warming leads to a rapid borealization of fish communities in the Arctic. Nat. Clim. Change 5, 673–677. doi: 10.1038/nclimate2647
Frainer A., Primicerio R., Kortsch S., Aune M., Dolgov A. V., Fossheim M., et al. (2017). Climate-driven changes in functional biogeography of Arctic marine fish communities. Proc. Natl. Acad. Sci. U.S.A. 114, 12202–12207. doi: 10.1073/pnas.1706080114
Froese R., Pauly D. (2008) FishBase. Available online at: http://www.fishbase.org.
GEBCO Compilation Group. (2023). GEBCO 2023 Grid (Paris (FR: Intergovernmental Oceanographic Commission). doi: 10.5285/f98b053b-0cbc-6c23-e053-6c86abc0af7b
Gomes M. C., Haedrich R. L., Villagarcia M. G. (1995). Spatial and temporal changes in the groundfish assemblages on the north-east Newfoundland/Labrador Shelf, north-west Atlantic 1978-1991. Fish. Oceanogr. 4, 85–101. doi: 10.1111/j.1365-2419.1995.tb00065.x
Gower J. C. (1971). A general coefficient of similarity and some of its properties. Biometrics 27, 857–871. doi: 10.2307/2528823
Grant J., Emerson C. W., Hargrave B. T., Shortle J. L. (1991). Benthic oxygen consumption on continental shelves off eastern Canada. Cont. Shelf Res. 11, 1083–1097. doi: 10.1016/0278-4343(91)90092-K
Halliday R. G., Pinhorn A. T. (2009). The roles of fishing and environmental change in the decline of Northwest Atlantic groundfish populations in the early 1990s. Fish. Res. 97, 163–182. doi: 10.1016/j.fishres.2009.02.004
Hamilton L. C., Haedrich R. L. (1999). Ecological and population changes in fishing communities of the North Atlantic Arc. Polar Res. 18, 383–388. doi: 10.1111/j.1751-8369.1999.tb00318.x
Hamilton L. C., Haedrich R. L., Duncan C. M. (2004). Above and below the water: social/ecological transformation in Northwest Newfoundland. Popul. Environ. 25, 195–215. doi: 10.1007/s11111-004-4484-z
Johannesen E., Mørk H. L., Korsbrekke K., Wienerroither R., Eriksen E., Fossheim M., et al. (2017). Arctic fishes in the Barents Sea 2004–2015: Changes in abundance and distribution. IMR/PINRO Joint Report Series, No. 1/2017 (Bergen, Norway: Institute of Marine Research).
Johannesen E., Wienerroither R., Langøy Mørk H., Husson B., Holmin A. N., Johnsen E., et al. (2021). Fish diversity data from the Barents Sea Ecosystem Survey 2004-2019 (Bergen, Norway: Institute of Marine Research).
Jones H. P., Schmitz O. J. (2009). Rapid recovery of damaged ecosystems. PloS One 4, e5653. doi: 10.1371/journal.pone.0005653
Kelly J., Harwell M. (1990). Indicators of ecosystem recovery. Environ. Manage. 14, 527–545. doi: 10.1007/BF02394708
Koen-Alonso M., Cuff A. (2018). Status and trends of the fish community in the Newfoundland Shelf (NAFO Div. 2J3K), Grand Bank (NAFO Div. 3LNO) and Southern Newfoundland Shelf (NAFO Div. 3Ps) Ecosystem Production Units. NAFO SCR Doc. 18/070. Serial No. N7023. (Dartmouth, NS: Northwest Atlantic Fisheries Organization).
Koen-Alonso M., Lindstrøm U., Cuff A. (2021). Comparative modeling of cod-capelin dynamics in the Newfoundland-Labrador shelves and Barents Sea ecosystems. Front. Mar. Sci. 8. doi: 10.3389/fmars.2021.579946
Koen-Alonso M., Pepin P., Fogarty M., Gamble R. (2022). Review and Assessment of the Ecosystem Production Potential (EPP) model structure, sensitivity, and its use for fisheries advice in NAFO. NAFO SCR Doc. 22/002, 52pp. (Dartmouth, NS: Northwest Atlantic Fisheries Organization).
Koen-Alonso M., Pepin P., Mowbray F. (2010). Exploring the role of environmental and anthropogenic drivers in the trajectories of core fish species of the Newfoundland-Labrador marine community. NAFO SCR Doc. 10/37. Serial No. N5795 (Dartmouth, NS: Northwest Atlantic Fisheries Organization).
Laliberté E., Legendre P. (2010). A distance-based framework for measuring functional diversity from multiple traits. Ecol. 91, 299–305. doi: 10.1890/08-2244.1
Lavorel S., Grigulis K., McIntyre S., Williams N. S. G., Garden D., Dorrough J., et al. (2008). Assessing functional diversity in the field – methodology matters! Funct. Ecol. 22, 134–147. doi: 10.1111/j.1365-2435.2007.01339.x
Le Quesne W. J. F., Jennings S. (2012). Predicting species vulnerability with minimal data to support rapid risk assessment of fishing impacts on biodiversity. J. Appl. Ecol. 49, 20–28. doi: 10.1111/j.1365-2664.2011.02087.x
Levin P. S., Möllmann C. (2015). Marine ecosystem regime shifts: challenges and opportunities for ecosystem-based management. Phil. Trans. R. Soc B 370, 20130275. doi: 10.1098/rstb.2013.0275
Lilly G. R., Nakken O., Brattey J. (2013). A review of the contributions of fisheries and climate variability to contrasting dynamics in two Arcto-boreal Atlantic cod (Gadus morhua) stocks: Persistent high productivity in the Barents Sea and collapse on the Newfoundland and Labrador Shelf. Prog. Oceanogr. 114, 106–125. doi: 10.1016/j.pocean.2013.05.008
Lotze H. K., Coll M., Magera A. M., Ward-Paige C., Airoldi L. (2011). Recovery of marine animal populations and ecosystems. Trends Ecol. Evol. 26, 595–605. doi: 10.1016/j.tree.2011.07.008
Magurran A. E., McGill B. J. (2011). Biological Diversity: Frontiers in Measurement and Assessment (Oxford, UK: Oxford University Press).
Magurran A. E., Queiros H. L., Hercos A. P. (2013). Relationship between evenness and body size in species rich assemblages. Biol. Lett. 9, 20130856. doi: 10.1098/rsbl.2013.0856
Martins G. M., Arenas F., Neto A. I., Jenkins S. R. (2012). Effects of fishing and regional species pool on the functional diversity of fish communities. PloS One 7, e44297. doi: 10.1371/journal.pone.0044297
Maureaud A., Hodapp D., van Denderen P. D., Hillebrand H., Gislason H., Spaanheden Dencker T., et al. (2019). Biodiversity–ecosystem functioning relationships in fish communities: Biomass is related to evenness and the environment, not to species richness. Proc. R. Soc B 286, 20191189. doi: 10.1098/rspb.2019.1189
McCallum B. R., Walsh S. J. (1997). Groundfish survey trawls used at the Northwest Atlantic Fisheries Centre 1971 to present Vol. 29 (Dartmouth, NS, Canada: Northwest Atlantic Fisheries Organization Sci. Counc. Stud), 93–104.
McClanahan T. R., Graham N. A. J., Calnan J. M., MacNeil A. (2007). Towards pristine biomass: reef fish recovery in coral reef marine protected areas in Kenya. Ecol. Appl. 17, 1055–1067. doi: 10.1890/06-1450
Möllmann C., Diekmann R. (2012). Marine ecosystem regime shifts induced by climate and overfishing—a review for the Northern hemisphere. Adv. Ecol. Res. 47, 303–347. doi: 10.1016/B978-0-12-398315-2.00004-1
Mouillot D., Bellwood D. R., Baraloto C., Chave J., Galzin R., Harmelin-Vivien M. (2013b). Rare species support vulnerable functions in high-diversity ecosystems. PloS Biol. 11, e1001569. doi: 10.1371/journal.pbio.1001569
Mouillot D., Graham N. A. J., Villéger S., Mason N. W. H., Bellwood D. R. (2013a). A functional approach reveals community responses to disturbances. Trends Ecol. Evol. 28, 167–177. doi: 10.1016/j.tree.2012.10.004
Mullowney D. R., Rose G. A., Dawe E. G., Rowe S., Maillet G. L., Pedersen E. J. (2019). Temperature influences on growth of unfished juvenile Northern cod (Gadus morhua) during stock collapse. Fish. Oceanogr. 28, 612–627. doi: 10.1111/fog.12447
Myers R. A., Hutchings J. A., Barrowman N. J. (1996). Hypotheses for the decline of cod in the North Atlantic. Mar. Ecol. Prog. Ser. 138, 293–308. doi: 10.3354/meps138293
Myers R. A., Hutchings J. A., Barrowman N. J. (1997). Why do fish stock collapse? The example of cod in Atlantic Canada. Ecol. Appl. 7, 91–106. doi: 10.1890/1051-0761(1997)007[0091:WDFSCT]2.0.CO;2
NAFO (2010). Report of the 6th Meeting of the NAFO Scientific Council Working Group on Ecosystem Science and Assessment (WGESA) [Formerly WGEAFM]. NAFO SCS Doc. 13/024. Serial No. N6277 (Dartmouth, NS: Northwest Atlantic Fisheries Organization).
NAFO (2014). Report of the 7th meeting of the NAFO Scientific Council (SC) Working Group on Ecosystem Science and Assessment (WGESA) [Formerly SC WGEAFM]. NAFO SCS Doc. 14/023, Serial No. N6410 (Dartmouth, NS: Northwest Atlantic Fisheries Organization).
Nogueira A., González-Troncoso D., Tolomieri N. (2016). Changes and trends in the overexploited fish assemblages of two fishing grounds of the Northwest Atlantic. ICES J. Mar. Sci. 73, 345–358. doi: 10.1093/icesjms/fsv172
Parsons L. S., Lear W. H. (2001). Climate variability and marine ecosystem impacts: a North Atlantic perspective. Prog. Oceanogr. 49, 167–188. doi: 10.1016/S0079-6611(01)00021-0
Pauly D., Christensen V., Dalsgaard J., Froese R., Torres F. (1998). Fishing down marine food webs. Science 279, 860–863. doi: 10.1126/science.279.5352.860
Pedersen E. J., Koen-Alonso M., Tunney T. D. (2020). Detecting regime shifts in communities using estimated rates of change. ICES J. Mar. Sci. 77 (4), 1546–1555. doi: 10.1093/icesjms/fsaa056
Pedersen E. J., Skanes K., Le Corre N., Koen-Alonso M., Baker K. D. (2022). A new spatial ecosystem-based surplus production model for SFA 4-6 Northern Shrimp. Can. Sci. Advis. Sec. Res. Doc. No. 2022/062 (Ottawa ON: Fisheries and Oceans Canada).
Pedersen E. J., Thompson P. L., Ball R. A., Fortin M.-J., Gouhier T. C., Link H., et al. (2017). Signatures of the collapse and incipient recovery of an overexploited marine ecosystem. R. Soc Open Sci. 4, 170215. doi: 10.1098/rsos.170215
Pepin P., Higdon J., Koen-Alonso M., Fogarty M., Ollerhead N. (2014). Application of ecoregion analysis to the identification of Ecosystem Production Units (EPUs) in the NAFO Convention Area. NAFO SCR Doc. 14/069. Serial No. N6412 Dartmouth, NS: Northwest Atlantic Fisheries Organization).
Petchey O. L., Gaston K. J. (2002). Functional diversity (FD), species richness and community composition. Ecol. Lett. 5, 402–411. doi: 10.1046/j.1461-0248.2002.00339.x
Piper D. J. W. (1991). Seabed geology of the Canadian eastern continental shelf. Cont. Shelf Res. 11, 1013–1035. doi: 10.1016/0278-4343(91)90089-O
Price A. R. G. (2002). Simultaneous ‘hotspots’ and ‘coldspots’ of marine biodiversity and implications for global conservation. Mar. Ecol. Prog. Ser. 241, 23–27. doi: 10.3354/meps241023
Purvis A., Hector A. (2000). Getting the measure of biodiversity. Nature 405, 212–219. doi: 10.1038/35012221
Rideout R. M., Ings D. W. (2018). Research vessel bottom trawl survey report (NL region): A stock-by-stock summary of survey information up to and including the 2017 spring and autumn surveys. Can. Tech. Rep. Fish. Aquat. Sci., 3267.
Robertson M. D., Gao J., Regular P. M., Morgan M. J., Zhang F. (2021). Lagged recovery of fish spatial distributions following a cold-water perturbation. Sci. Rep. 11, 9513. doi: 10.1038/s41598-021-89066-x
Rocha J., Yletyinen J., Biggs R., Blenckner T., Peterson G. (2015). Marine regime shifts: drivers and impacts on ecosystem services. Phil. Trans. R. Soc B. 370, 20130273. doi: 10.1098/rstb.2013.0273
Rose G. A. (2004). Reconciling overfishing and climate change with stock dynamics of Atlantic cod (Gadus morhua) over 500 years. Can. J. Fish. Aquat. Sci. 61, 1553–1557. doi: 10.1139/f04-173
Rothschild B. J. (2007). Coherence of Atlantic cod stock dynamics in the northwest Atlantic Ocean. Trans. Amer. Fish. Soc 136, 858–874. doi: 10.1577/T06-213.1
Sala E., Knowlton N. (2006). Global marine biodiversity trends. Annu. Rev. Environ. Resour. 31, 93–122. doi: 10.1146/annurev.energy.31.020105.100235
Schloerke B., Cook D., Larmarange J., Briatte F., Marbach M., Thoen E., et al. (2021). GGally: Extension to ‘ggplot2’ (R package version 2.1.2). Available at: https://CRAN.R-project.org/package=GGally.
Schultz A. L., Malcolm H. A., Linklater M., Jordan A., Ingleton T., Smith S. D. A. (2015). Sediment variability affects fish community structure in unconsolidated habitats of a subtropical marine park. Mar. Ecol. Prog. Ser. 532, 213–226. doi: 10.3354/meps11311
Scott J. S. (1982). Depth, temperature and salinity preferences of common fishes of the Scotian Shelf. J. Northw. Atl. Fish. Sci. 3, 29–39. doi: 10.2960/J.v3.a2
Shumway S. E., Perkins H. C., Schlck D. F., Stickney A. P. (1985). Synopsis of biological data on the pink shrimp, Pandalus borealis Kroyer 1838. (FAO Fish. Synopses No. 144) NOAA Tech. Rep. NMFS 30 (Milford, CT, USA: NOAA/National Marine Fisheries Service).
Steele D. H., Andersen R., Green J. M. (1992). The managed commercial annihilation of Northern cod Vol. 8 (St. John's, NL, Canada: Newfoundland and Labrador Studies).
Teixidó N., Gambi M. C., Parravacini V., Kroeker K., Micheli F., Villéger S., et al. (2018). Functional biodiversity loss along natural CO2 gradients. Nat. Commun. 9, 5149. doi: 10.1038/s41467-018-07592-1
Therriault J., Petrie B., Pepin P., Gagnon J., Gregory D., Helbig J., et al. (1998). Proposal for a northwest zonal monitoring program. Can. Tech. Rep. Hydrogr. Ocean Sci. (Ottawa ON: Fisheries and Oceans Canada) 194. vii + 57 pp.
Tilman D., Knops J., Wedin D., Reich P., Ritchie M., Siemann E. (1997). The influence of functional diversity and composition on ecosystem processes. Science 277, 1300–1302. doi: 10.1126/science.277.5330.1300
Tuomisto H. (2012). An updated consumer’s guide to evenness and related indices. Oikos 121, 1203–1218. doi: 10.1111/j.1600-0706.2011.19897.x
Van Meerbeek K., Jucker T., Svenning J.-C. (2021). Unifying the concepts of stability and resilience in ecology. J. Ecol. 109, 3114–3132. doi: 10.1111/1365-2745.13651
Villéger S., Mason N. W. H., Mouillot D. (2008). New multidimensional functional diversity indices for a multifaceted framework in functional ecology. Ecol. 89, 2290–2301. doi: 10.1890/07-1206.1
Wells N. J., Stenson G. B., Pepin P., Koen-Alonso M. (2017). Identification and descriptions of ecologically and biologically significant areas in the Newfoundland and Labrador Shelves Bioregion. DFO Can. Sci. Advis. Sec. Res. Doc. 2017/013 (Ottawa ON: Fisheries and Oceans Canada).
Wiedmann M. A., Aschan M., Certain G., Dolgov A., Greenacre M., Johannesen E., et al. (2014). Functional diversity of the Barents Sea fish community. Mar. Ecol. Prog. Ser. 495, 205–218. doi: 10.3354/meps10558
Keywords: regime shift, biodiversity, trophic level, Gadus morhua, species richness, functional dispersion, spatial and temporal variability
Citation: Aune M, Ramasco V, Wells N, Warren M, Cyr F, Pedersen EJ, Koen-Alonso M, Eriksen E, Primicerio R, Lindstrøm U and Renaud PE (2024) Taxonomic and functional-trait metrics track recovery of demersal fish and shrimp communities following system collapse. Front. Mar. Sci. 11:1237573. doi: 10.3389/fmars.2024.1237573
Received: 09 June 2023; Accepted: 26 February 2024;
Published: 11 March 2024.
Edited by:
Alberto Basset, University of Salento, ItalyReviewed by:
Vadim Karatayev, University of Guelph, CanadaFrancesca Strano, Victoria University of Wellington, New Zealand
Meilin Wu, Chinese Academy of Sciences (CAS), China
Copyright © 2024 Aune, Ramasco, Wells, Warren, Cyr, Pedersen, Koen-Alonso, Eriksen, Primicerio, Lindstrøm and Renaud. This is an open-access article distributed under the terms of the Creative Commons Attribution License (CC BY). The use, distribution or reproduction in other forums is permitted, provided the original author(s) and the copyright owner(s) are credited and that the original publication in this journal is cited, in accordance with accepted academic practice. No use, distribution or reproduction is permitted which does not comply with these terms.
*Correspondence: Margaret Warren, TWFyZ2FyZXQud2FycmVuQGRmby1tcG8uZ2MuY2E=
†Present address: Magnus Aune, Deepwater and Cartilaginous Fish Research Group, Institute of Marine Research, Tromsø, Norway
‡These authors have contributed equally to this work and share first authorship