 Mark Trinder
 Susan H. O’Brien1
94% of researchers rate our articles as excellent or good
Learn more about the work of our research integrity team to safeguard the quality of each article we publish.
Find out more
ORIGINAL RESEARCH article
Front. Mar. Sci., 22 April 2024
Sec. Marine Conservation and Sustainability
Volume 11 - 2024 | https://doi.org/10.3389/fmars.2024.1235061
This article is part of the Research TopicAssessing and Limiting the Adverse Effects of Offshore Wind Farm Development on Seabirds and Marine MammalsView all 6 articles
The climate crisis is driving a rapid increase in size and number of offshore wind farms to reduce carbon emissions from electricity generation. However, there are concerns about the potential impact of offshore wind farms on the marine environment. Seabirds are considered to be at risk of being displaced from preferred foraging habitat, by construction and operation of offshore wind farms, resulting in reduced energy intake or elevated energetic costs and consequent decreases in survival and/or productivity. Typically, displacement or avoidance behaviour is assessed by comparing abundance and spatial distributions of seabirds before and after an offshore wind farm is constructed. However, seabird distributions are highly variable through time and space and so discerning a change in distribution caused by an offshore wind farm from other environmental variables can be challenging. We present a new method that controls for temporal variation by examining the location of individual seabirds relative to turbines. Mean seabird density at different distances from individual turbines (0-400m) was calculated from data collected on a total of 12 digital aerial surveys of the Beatrice Offshore Wind Farm (UK), in May-August in 2019 and 2021. Mean densities of common guillemot (Uria aalge), razorbill (Alca torda), Atlantic puffin (Fratercula arctica) and black-legged kittiwake (Rissa tridactyla), both flying and sat on the water, were calculated. If the presence of turbines had no effect on seabird distribution, there should be no relationship between distance from turbine and seabird density. This was tested by simulating a relocation of turbines, relative to seabird distribution, and recalculating seabird density over 0-400m from simulated turbine locations. This was repeated to generate a bootstrapped distribution of expected densities against which observed density was compared. If displacement was occurring, mean observed density close to turbines would be significantly lower than expected density, derived from the bootstrap distribution. Overall, observed mean density did not differ significantly from expected density, i.e. no displacement effect was detected. There was a slight tendency for guillemot and razorbill, when sat on the water, to be at higher densities than expected, near turbines, suggestive of possible attraction to turbines, and for flying birds to be at lower densities than expected, near turbines, suggestive of possible avoidance. No flying razorbills were recorded within 100m of turbines but sample sizes were small. Kittiwake tended to show no avoidance or attraction behaviour, although flying kittiwake density was slightly lower than expected at 200m from turbines. Puffins sat on the water were recorded in densities similar to the expected density. Overall, no effect of turbine rotor speed was found, i.e. birds were not more likely to be displaced/avoid turbines at higher or lower rotor speeds. The results of the turbine relocation analysis gave a more consistent and more easily interpreted assessment of displacement/avoidance behaviour than the typical approaches of comparing abundance and seabird distribution through time. We strongly encourage application of this new approach to post-construction spatial distribution data from other offshore wind farms, to build the evidence base on the effects of offshore wind farms on seabirds.
To address the current climate change crisis, the UK Government has set a net zero target of 100% reduction of greenhouse gas emissions by 2050, compared with 1990 levels (https://commonslibrary.parliament.uk/research-briefings/cdp-2023-0124/). Among a range of policies aimed at reducing greenhouse gas emissions, the UK Government has an ambition to deliver up to 50GW from offshore wind farms by 2030 (HM Government, 2022). Current offshore electricity generation in the UK is estimated as 13.6GW, second only to China in installed capacity, (https://www.renewableuk.com/page/UKWEDhome [accessed 01/05/2023]. Consequently, the scale of deployment of offshore wind farms in the UK is rapidly increasing to deliver 50GW by 2030.
While offshore wind farms are clearly critical for reducing carbon emissions from electricity generation, there remains considerable uncertainty about the potential impacts on the marine environment, especially when constructed at scale (Furness et al., 2013). The UK supports very large populations of breeding seabirds and there are concerns that the rapid expansion of offshore wind generation has the potential to have detrimental effects on these seabird populations, many of which are already at risk from other factors such as reduced prey stocks and predation by introduced mammals (Cury et al., 2011; Stanbury et al., 2017; Burnell et al., 2023). Offshore wind development is recognised as potentially being one of the most important pressures on the UK’s seabird populations (Burnell et al., 2023; OSPAR, 2023).
Environmental Impact Assessment (EIA) used in UK offshore wind farm planning applications, explicitly considers potential mortality of protected seabird populations by the proposed development. The potential effects of operational offshore wind farms on seabird populations are assessed via two impact pathways: (i) mortality via collision with turbine rotors and (ii) mortality and/or reduced productivity via barrier effects and displacement (Drewitt and Langston, 2006).
Collision mortality is assessed using a model that considers the likelihood of birds colliding with a turbine rotor, which is then corrected for avoidance behaviour by the bird (Cook et al., 2018). Avoidance behaviour is classified as occurring at three different spatial scales: macro avoidance, where a bird does not enter a wind farm; meso avoidance where a bird avoids individual turbines within a wind farm, e.g. by flying down corridors between arrays; and micro avoidance where a bird changes its behaviour in close proximity to individual rotor blades (Pavat et al., 2023).
Barrier effect describes birds that fly around an offshore wind farm rather than through it, and hence have a longer flight path (Masden et al., 2010). Barrier effects are assumed to cause mortality through increased energy expenditure (Searle et al., 2018).
Displacement, described as ‘a reduced number of birds occurring within or immediately adjacent to an offshore wind farm’ by Furness et al. (2013), assumes that a bird changes its behaviour in response to the presence of a turbine or offshore wind farm, potentially leading to reduced energy intake or increased energy expenditure (JNCC, 2022). Seabirds can also be attracted to offshore wind farms (Petersen et al., 2006; Leopold et al., 2013; Mendel et al., 2014; Vanermen et al., 2014). When assessing displacement effects, the assumption is that a bird moves to a new location that is more distant from a turbine, compared to the preferred location if no turbine was present. This displacement or avoidance distance might be over a few hundreds of metres, i.e. the bird remains within the wind farm, or over kilometres, meaning the bird moves to outside of the wind farm. The framework used for assessing this in an EIA only considers birds displaced to outside of the wind farm boundary and not a redistribution of birds within the wind farm (‘within wind farm displacement’). Displacement to locations outside of the wind farm is analogous to macro-avoidance but is not directly interchangeable (Searle et al., 2020; Pavat et al., 2023). Within wind farm displacement is analogous to meso-avoidance. Disentangling a spatial redistribution of birds following construction of an offshore wind farm, into avoidance, displacement and barrier effects is problematic (Humphreys et al., 2015; Cook et al., 2018; Searle et al., 2020; Pavat et al., 2023).
When assessing displacement effects, it is assumed that a bird will be displaced from their preferred foraging habitat into a different area, i.e. effective habitat loss. The assumed change in energy budget could arise through one or more of: foraging in a poorer habitat, e.g. prey poorer quality or less abundant; less efficient foraging due to being unfamiliar with the new area; increased competition for prey with conspecifics and/or other species; increased travel time to/from a new foraging area; less time spent at the nest site incubating, brooding or protecting eggs/chicks from both weather conditions and predators; less time spent in other key maintenance behaviours such as preening (Dierschke et al., 2017; JNCC, 2022). The consequence of a seabird being unable to meet its daily energy requirements may be reduced survival and/or reduced productivity with sub-lethal effects potentially being carried over to some future point, e.g. the following breeding season (Dunn et al., 2020). The framework used in EIA to assess displacement effects (both mortality and reduced productivity) applies a pre-determined displacement rate to the number of birds recorded in an offshore wind farm footprint and then, using either an individual based model or expert opinion, the mortality rate of displaced birds is estimated (Warwick-Evans et al., 2017; Searle et al., 2018; JNCC, 2022). This framework assumes a percentage of birds in the wind farm footprint are excluded, i.e. displaced, from that area and, of those excluded, a fraction of those will die or fail to breed (Searle et al., 2020; JNCC, 2022).
In the UK, collision risk, as a direct source of mortality, has been the main focus for large-scale empirical studies (Skov et al., 2018; Tjørnløv et al., 2023). While much remains to be learned about seabird collision risks, studies conducted to date have resulted in a gradual reduction in the degree of uncertainty and estimated magnitude of impacts of collision on seabird populations (Cook et al., 2014; Bowgen and Cook, 2018; Ozsanlav-Harris et al., 2023). However, much less progress has been made in improving our understanding of displacement effects. As a consequence, there remains large uncertainty about the magnitude of effects that any displacement or avoidance behaviour may have on protected populations. Quantifying the extent of seabird redistribution in response to an offshore wind farm, i.e. displacement, avoidance or attraction behaviour, is not straightforward and shows large variation among offshore wind farms (e.g. Zuur, 2018; APEM, 2022; Pavat et al., 2023). Understanding the energetic and demographic consequences of a behavioural change is very challenging and relies on many assumptions (Searle et al., 2018).
Attempts to quantify the magnitude of displacement of seabirds by offshore wind farms have tended to compare the spatial distributions of seabirds before and after wind farm construction recorded from boat or aerial surveys (e.g. Canning et al., 2013; Vanermen et al., 2014). Traditional BACI (Before-After-Control-Impact) studies rely on a control area with no impact, i.e. no offshore wind farm, to quantify the magnitude of impact against background change (Green, 1979; Vanermen et al., 2014). However, identifying representative control areas in the marine environment is challenging. To overcome this, there has been a shift to using a BAG (Before-After-Gradient) approach, sampling along a spatial gradient with increasing distance from the offshore wind farm, both before and after construction (e.g. Petersen et al., 2004). However, seabird populations are known to be highly variable through space and time, especially those feeding on mobile prey and while predictable patterns in seabird distribution may occur over wider spatial scales, such as oceanographic features, this predictability breaks down at the relatively small scales over which wind farms might cause displacement (Fauchald et al., 2000; Wakefield et al., 2009). Consequently, it is difficult to control for temporal and spatial changes in seabird distribution and to correctly attribute changes in spatial distribution to an offshore wind farm rather than environmental variation.
Here we present a new approach for investigating offshore wind farm effects which overcomes the difficulties of comparing seabird spatial distributions through time. The method applies a more general, mechanistic approach, derived from the premise that displacement is the result of birds responding to the presence of the novel structures (turbines) in their environment by avoiding them. This new approach is not dependent on making temporal comparisons in distribution which may be influenced by multiple environmental factors, as required for the BAG approach, and instead compares the location of birds relative to turbines at a single point in time.
We use information on seabird abundance and distribution collected before construction of an offshore wind farm in Scottish waters, and when the wind farm was operational, to estimate displacement, avoidance and attraction behaviour of seabirds. We compare the results with those from the traditional methods (e.g. derived from large scale spatial models) and illustrate the challenges of discerning an offshore wind farm effect from environmental effects driving spatial and temporal variation in seabird distributions. We then apply our novel method to the same data and demonstrate the robustness of this new approach to assessing displacement, avoidance and attraction effects in both seabirds sat on the water and in flight. This new method considers a spatial redistribution of seabirds within an offshore wind farm, in response to turbine location. Here, we describe this measure as both meso-avoidance, henceforth ‘avoidance’, and within wind farm displacement, henceforth ‘displacement’, hereafter displacement/avoidance, to capture both the collision and displacement frameworks used in Environmental Impact Assessments.
The Beatrice Offshore Wind Farm is approximately 8km wide (NW-SE) and 18km long (NE-SW) and is located between 13 and 22km from the Caithness coast of Scotland in the Moray Firth (Figure 1). It comprises 84 turbines arranged in an approximate rectangular shape parallel to the coast and has been fully operational since June 2019.
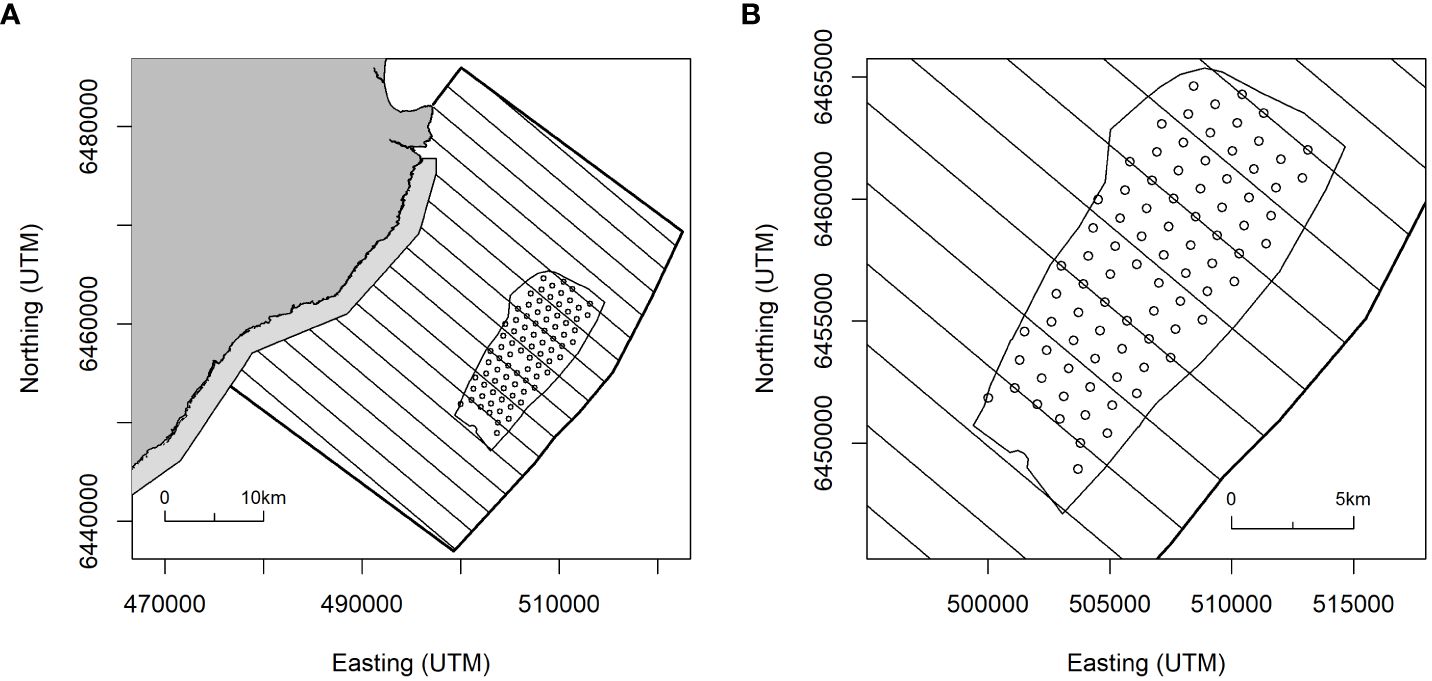
Figure 1 (A) Survey area for digital aerial survey coverage of the Beatrice Offshore Wind Farm and the region of sea between the Wind Farm and the Caithness coast of north-east Scotland. Transect lines were oriented perpendicular to coastline, wind farm boundary and turbine locations (circles) shown. Light shading indicates the seaward extension of the East Caithness Cliffs Special Protection Area (SPA); (B) Detail of alternate transects crossing rows of turbines.
The East Caithness Cliffs Special Protection Area (SPA) lies along the adjacent coast and is designated for breeding seabirds (https://sitelink.nature.scot/site/8492), including guillemot, razorbill puffin and kittiwake.
Ornithological monitoring is a requirement of the Beatrice offshore wind farm’s planning consent and began in 2015 with pre-construction surveys in the breeding season. Following construction, identical surveys were conducted in 2019 and 2021. In each year, HiDef Aerial Surveying Ltd. undertook six digital video aerial surveys between May and early August, using the same methods. Each survey comprised sixteen transects, spaced 2.4km apart and aligned perpendicularly to the coast and extending from the shore to 4km beyond the seaward boundary of the wind farm (Figure 1). The data were collected as high definition video images from four cameras mounted in parallel across the transect. Video footage from each camera was clipped to provided a strip width on the sea surface of 125m and an effective pixel size at ground level, i.e. Ground Sampling Distance (GSD) of 2cm. The width of transect varied through the survey area; within the wind farm and a 2km buffer the transect width was 500m (i.e. data from all four cameras), with a width of 250m elsewhere (two cameras). The transects were aligned to ensure a representative range of possible bird positions throughout the wind farm was obtained. This was achieved by locating alternate transects over rows of turbines (Figure 1) with the intermediate transects flown along ‘corridors’ between turbine rows (or where the turbines would ultimately be, for the 2015 pre-construction survey). The imagery was viewed by experienced seabird ornithologists and seabirds were identified to species level wherever possible, or species groups where identification was uncertain.
Species analysed in this study were those considered to be at risk of wind farm displacement effects which breed in the East Caithness Cliffs SPA and occurred in sufficient densities within the wind farm to test for any effect of construction of the wind farm on distribution: auks (guillemot, razorbill, puffin) and kittiwake. Additionally, Northern gannet Morus bassanus were also recorded in sufficient densities in the survey area to enable a pre- and post construction comparison in distribution. Birds were assigned coordinates derived from the aircraft GPS, and categorised as ‘in flight’ or ‘on the sea surface’.
To test for a redistribution of birds due to the offshore wind farm (displacement/macro avoidance), seabird density surfaces were generated and pre- and post-construction comparisons made using the R package MRSea (Scott-Hayward et al., 2013 https://lindesaysh.github.io/MRSea/articles/). Comparisons were made of the pre-construction survey (2015) with the two post-construction (post-1, in 2019, and post-2, in 2021) model distributions: pre and post-1; pre and post-2; and post-1 and post-2. These three comparisons enabled testing for any habituation effects after the wind farm had been operational for two years (post-1 vs post-2), as well as the effect of an operational wind farm on seabird distributions (pre vs post-1; pre vs post-2). For each analysis, the two datasets in question were combined and modelled with explanatory environmental covariates: sea depth (obtained from EMODnet, 13/12/2019) and distance to coast, together with a spatial term (a combined x-y position). The initial model formulation was as follows:
with only significant terms (at p<0.05) retained in the final model. As well as wind farm (0/1) this model included smoothed, one-dimensional terms for depth and distance to coast, a two dimensional spatial smooth term (x,y) and an interaction between the spatial smoother and wind farm (or year) to test for a redistribution effect (i.e. rather than simply an overall change in number). It is not possible to determine from the model coefficients what the spatial nature of the changes are. Thus, while a significant interaction between the wind farm and spatial terms indicates a before-after re-distribution effect, this does not on its own indicate where the change has occurred. To visualise the changes to the spatial distribution, the models were used to make predictions across a grid of cells covering the study area. To ensure the outputs are robust, MRSea employs a bootstrap routine, thereby incorporating parameter uncertainty. The median differences between the pre- and post- surfaces were plotted as maps which indicate where changes in distribution have occurred. Cells which have changed significantly are identified with symbols that also denoted the direction of change (increase or decrease in abundance). See MacArthur Green (2023) for more information.
To test for within wind farm displacement/avoidance or attraction to individual turbines, the density of birds at different distances from turbines was examined. If birds were attracted to turbines, density would be higher closer to turbines and lower if displacement/avoidance was occurring. To do this, the exact location of each individual bird and turbine on each survey was found.
The cameras were not mounted vertically beneath the aircraft, but angled forwards at 30° from the vertical, to minimise glare from the sun. Because bird positions were obtained from the aircraft GPS it was necessary to apply an adjustment to account for the offset introduced by the camera angle. Using images collected along the transects which cross turbines, the difference in the position between observations labelled as ‘turbine’ in the survey data and the actual turbine position was calculated. However, because the object identified as ‘turbine’ in the data could refer to different parts of the structure (e.g. rotor tip, tower, etc.) the calculated offset varied among turbines. The average difference in position obtained in 2019 was 69.7m (s.d. 25.5m) and in 2021 was 57.3m (s.d. 18.9m). Using the transect orientation (130° from north) and the mean offset distance in each year, adjusted bird positions were calculated.
The densities of each species within circles of radius 100, 200, 300 and 400m, centred on the turbines as recorded post-construction (2019 and 2021), were calculated (the density for each larger circle included all birds within that distance, i.e. the circles were nested). Birds in flight and sat on the water were treated separately, i.e. for each species eight mean densities were calculated. A maximum distance of 400m from the turbine was used to ensure that no neighbouring turbine’s circles overlapped, potentially confusing which turbine a bird might be responding to. Initially, data were analysed for each year separately and the results compared to look for any significant differences between years. Where no difference was found, surveys were pooled across years to increase sample sizes.
Following estimation of the density of each species around the true turbine locations, a test was conducted to determine how likely it would be to observe these densities if the birds were either avoiding turbines, attracted to them, or showing no response. If seabird spatial distribution was uninfluenced by the location of turbines (i.e. no attraction or displacement effects), the seabird density within each of the circles of increasing distance from a turbine would be expected to be similar.
This can be tested more robustly by simulating a random repositioning of the turbines’ locations, without changing the underlying seabird spatial distribution. If there are no attraction or displacement/avoidance effects, the seabird densities in the circles around simulated turbine locations will not be significantly different to the densities around the true turbine locations. The advantage of simulating relocation of turbines rather than relocation of seabirds, is that no information on drivers of seabird distribution are required to provide a realistic simulation of bird distribution. Since the turbine arrays are on a fixed grid, simulating relocation of turbines is straightforward. To do this, 1,000 pairs of turbine coordinate offset values were drawn from random uniform distributions bounded by the inter-turbine distances; +/-510m for eastings and +/-550m for northings. Adding each randomised coordinate pair to all of the actual turbine coordinates provided 1,000 sets of alternative turbine locations, while maintaining the turbine layout (i.e. their positions relative to the other turbines). Affine transformation was applied to the alternative turbine locations to ensure a comprehensive range of wind farm locations was obtained without overlaps between adjacent turbines (Figure 2). The resampled turbine positions were thus located within the easting and northing ranges defined above while preserving their relative positions.
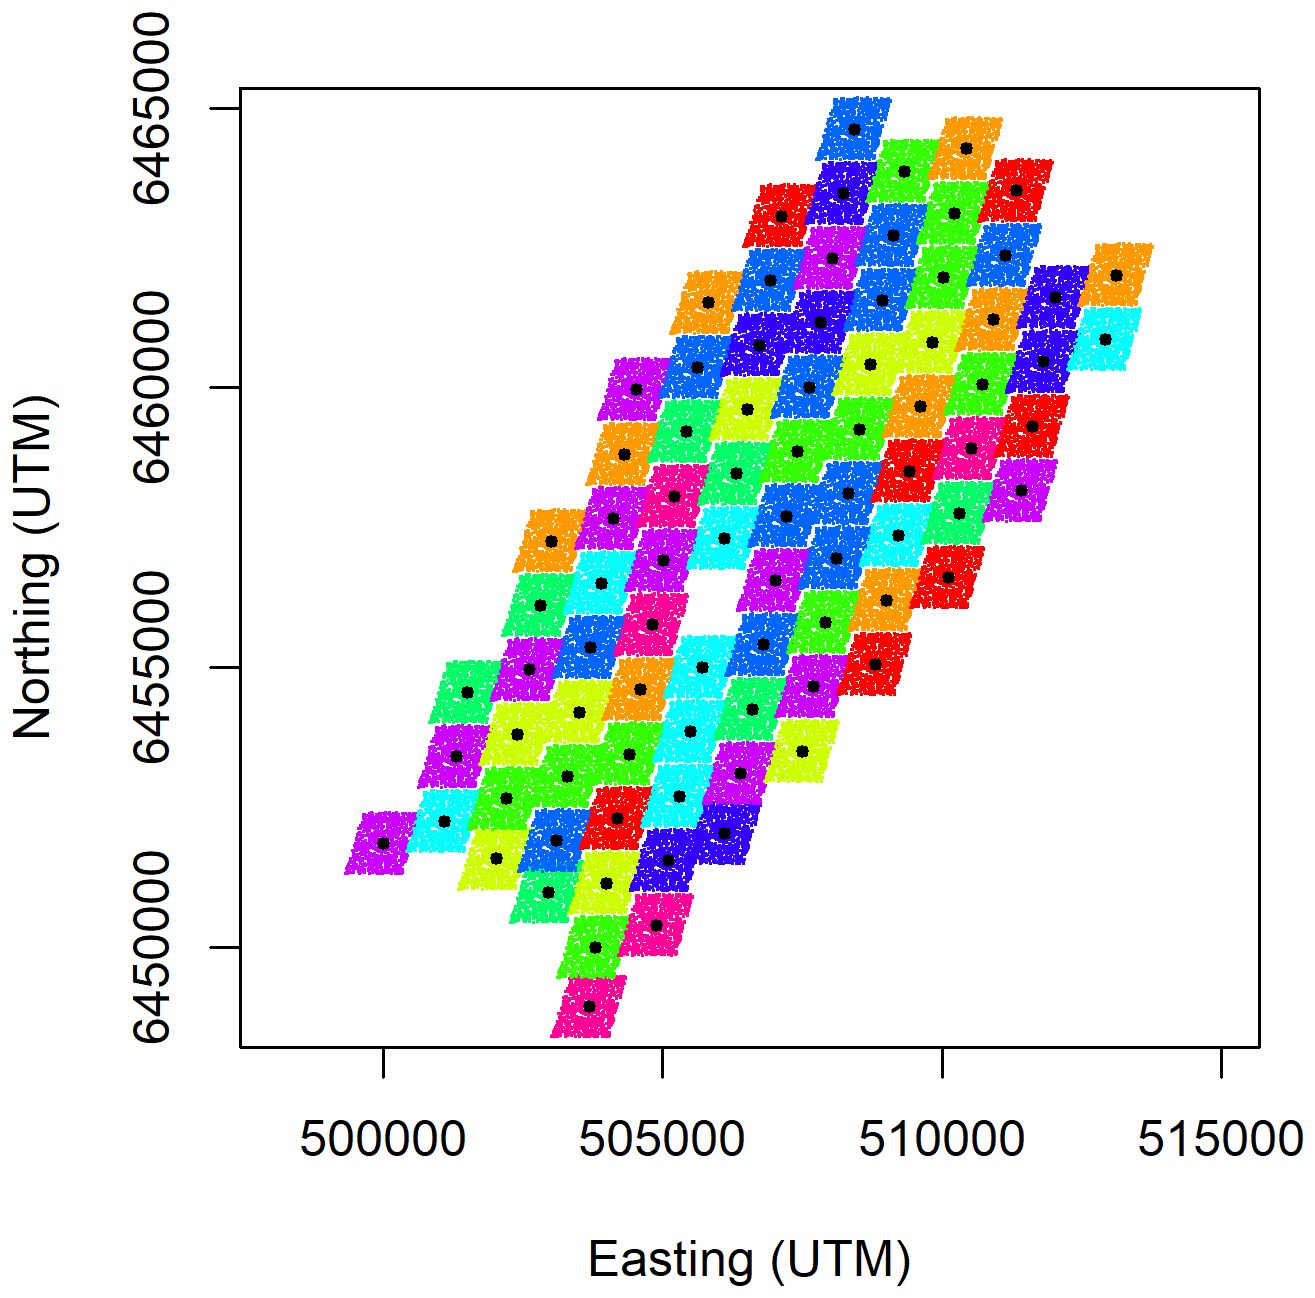
Figure 2 Illustration of 1,000 randomised turbine positions for the Beatrice wind farm. Each coloured parallelogram contains 1,000 dots, each one obtained by adjusting the real turbine locations (black dots) using a single pair of easting (+/-510m) and northing (+/-550m) offset values, with affine transformation to ensure adjacent turbine distributions had minimal overlap. There was a gap with no turbine in the centre of the wind farm.
For each resampled turbine dataset the seabird densities within the 100, 200, 300 and 400m circles were calculated, thereby obtaining 1,000 randomly generated simulated density values for comparison with the observed density values. To allow for the fact that the surveyed transects did not completely overlap all of the circles around the turbines (both true turbine locations and simulated relocations) the overlap of transect and circles was calculated in each case to prevent underestimating densities (i.e. by assuming a greater area was observed than was the case). Median simulated density and the interquartile range were calculated from the 1,000 randomly generated density values, for each of the four circles. As for observed densities, flying birds and birds sat on the water were treated separately.
Observed mean bird density in each circle was compared with the simulated bird density distribution derived from the simulated turbine relocations to see if observed density was significantly different to simulated densities. If displacement/avoidance or attraction occurred, observed density would be significantly less or greater than the simulated densities, respectively. If observed and simulated mean densities were similar this indicated neither avoidance nor attraction.
This was also formally estimated, initially using two-sided empirical p-values, calculated for each year of post-construction survey (2019 and 2021), species (guillemot, razorbill, puffin, kittiwake), behaviour (flying and sitting) and within each circle (100m, 200m, 300m and 400m). This was to test for any inter-annual differences before pooling the two years of survey data. More statistically powerful one-sided p-values were then used to explicitly test for displacement/avoidance and for attraction. Two-sided p-values were obtained as the smaller of one-sided values multiplied by two.
As a test of the method’s sensitivity to detect turbine avoidance, if present, the pooled 2019 and 2021 data for guillemot sat on the water and kittiwakes in flight were reanalysed with an avoidance effect simulated by deleting all observations within a particular radius of the turbines prior to analysis.
Since the operational status of the turbines may influence bird responses, a second analysis was conducted using densities calculated for subsets of the data grouped by the rotor speed (RPM) of the nearest turbine to the bird (the RPM for each turbine was provided by the wind farm operator as the average within 10 minute periods (i.e. six values per hour) on the days surveys were conducted). Four RPM subsets were defined,<2.5, >=2.5 &<5.0, >=5.0 &<7.5 and >=7.5 (the maximum recorded RPM during the study was 10.3) with bird observations assigned to one of these groups. Bird densities in the 100, 200, 300 and 400m circles around turbines were calculated for each RPM group, for each species and flying or sitting on the water.
Guillemot was the most abundant seabird species recorded during surveys, with a maximum population abundance estimate across the total survey area of 103,710 individuals on one of the 2021 surveys (Table 1). Razorbill, puffin and kittiwake were present in similar abundances with peak estimates of 14,774, 16,578 and 11,249, respectively. Gannet were scarce with a peak estimate of just 709 individuals.
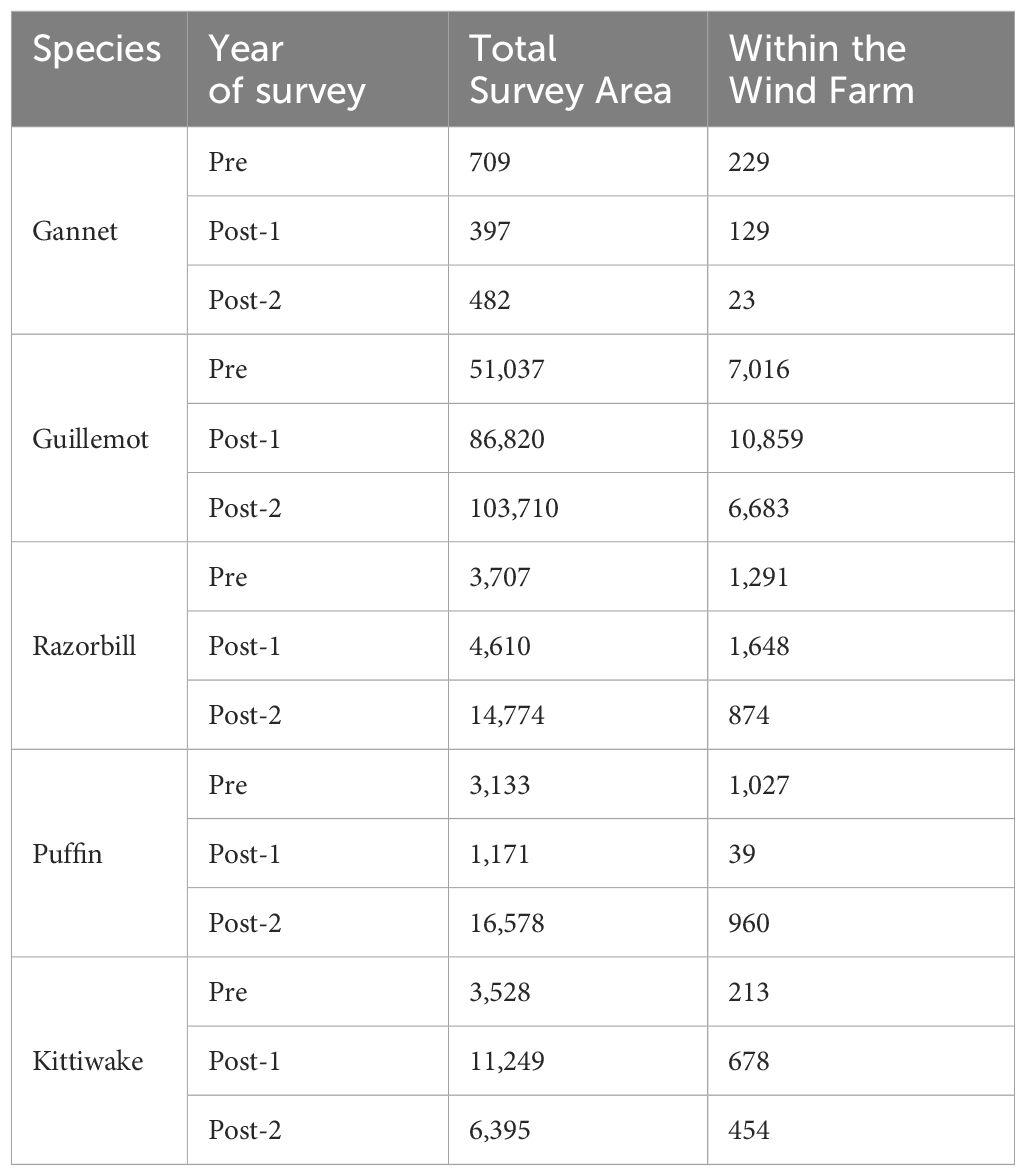
Table 1 Peak population abundance estimates of seabirds within the total survey area and within the wind farm (see Figure 1 for survey area) on the pre-construction survey (‘Pre’, 2015) and the two post-construction surveys (‘Post-1’, 2019 and ‘Post-2’, 2021).
If seabird abundances are largely unaffected by construction of the offshore wind farm, the percentage change in each species’ abundance between the pre and post construction surveys should be approximately 100%. A comparison of pre vs post-1 and pre vs post-2 surveys showed that abundance fluctuated substantially (Figure 3). For each species, the post-1 and post-2 percentage changes in abundance were inconsistent, particularly for puffin which showed a 37% decrease in abundance across the survey area from 2015 to 2019 (post-1) but a 539% increase in abundance comparing 2015 with 2021 (post-2). This suggests large inter-annual variation in seabird abundance, not related to the presence of the wind farm, particularly for razorbill, puffin and kittiwake.
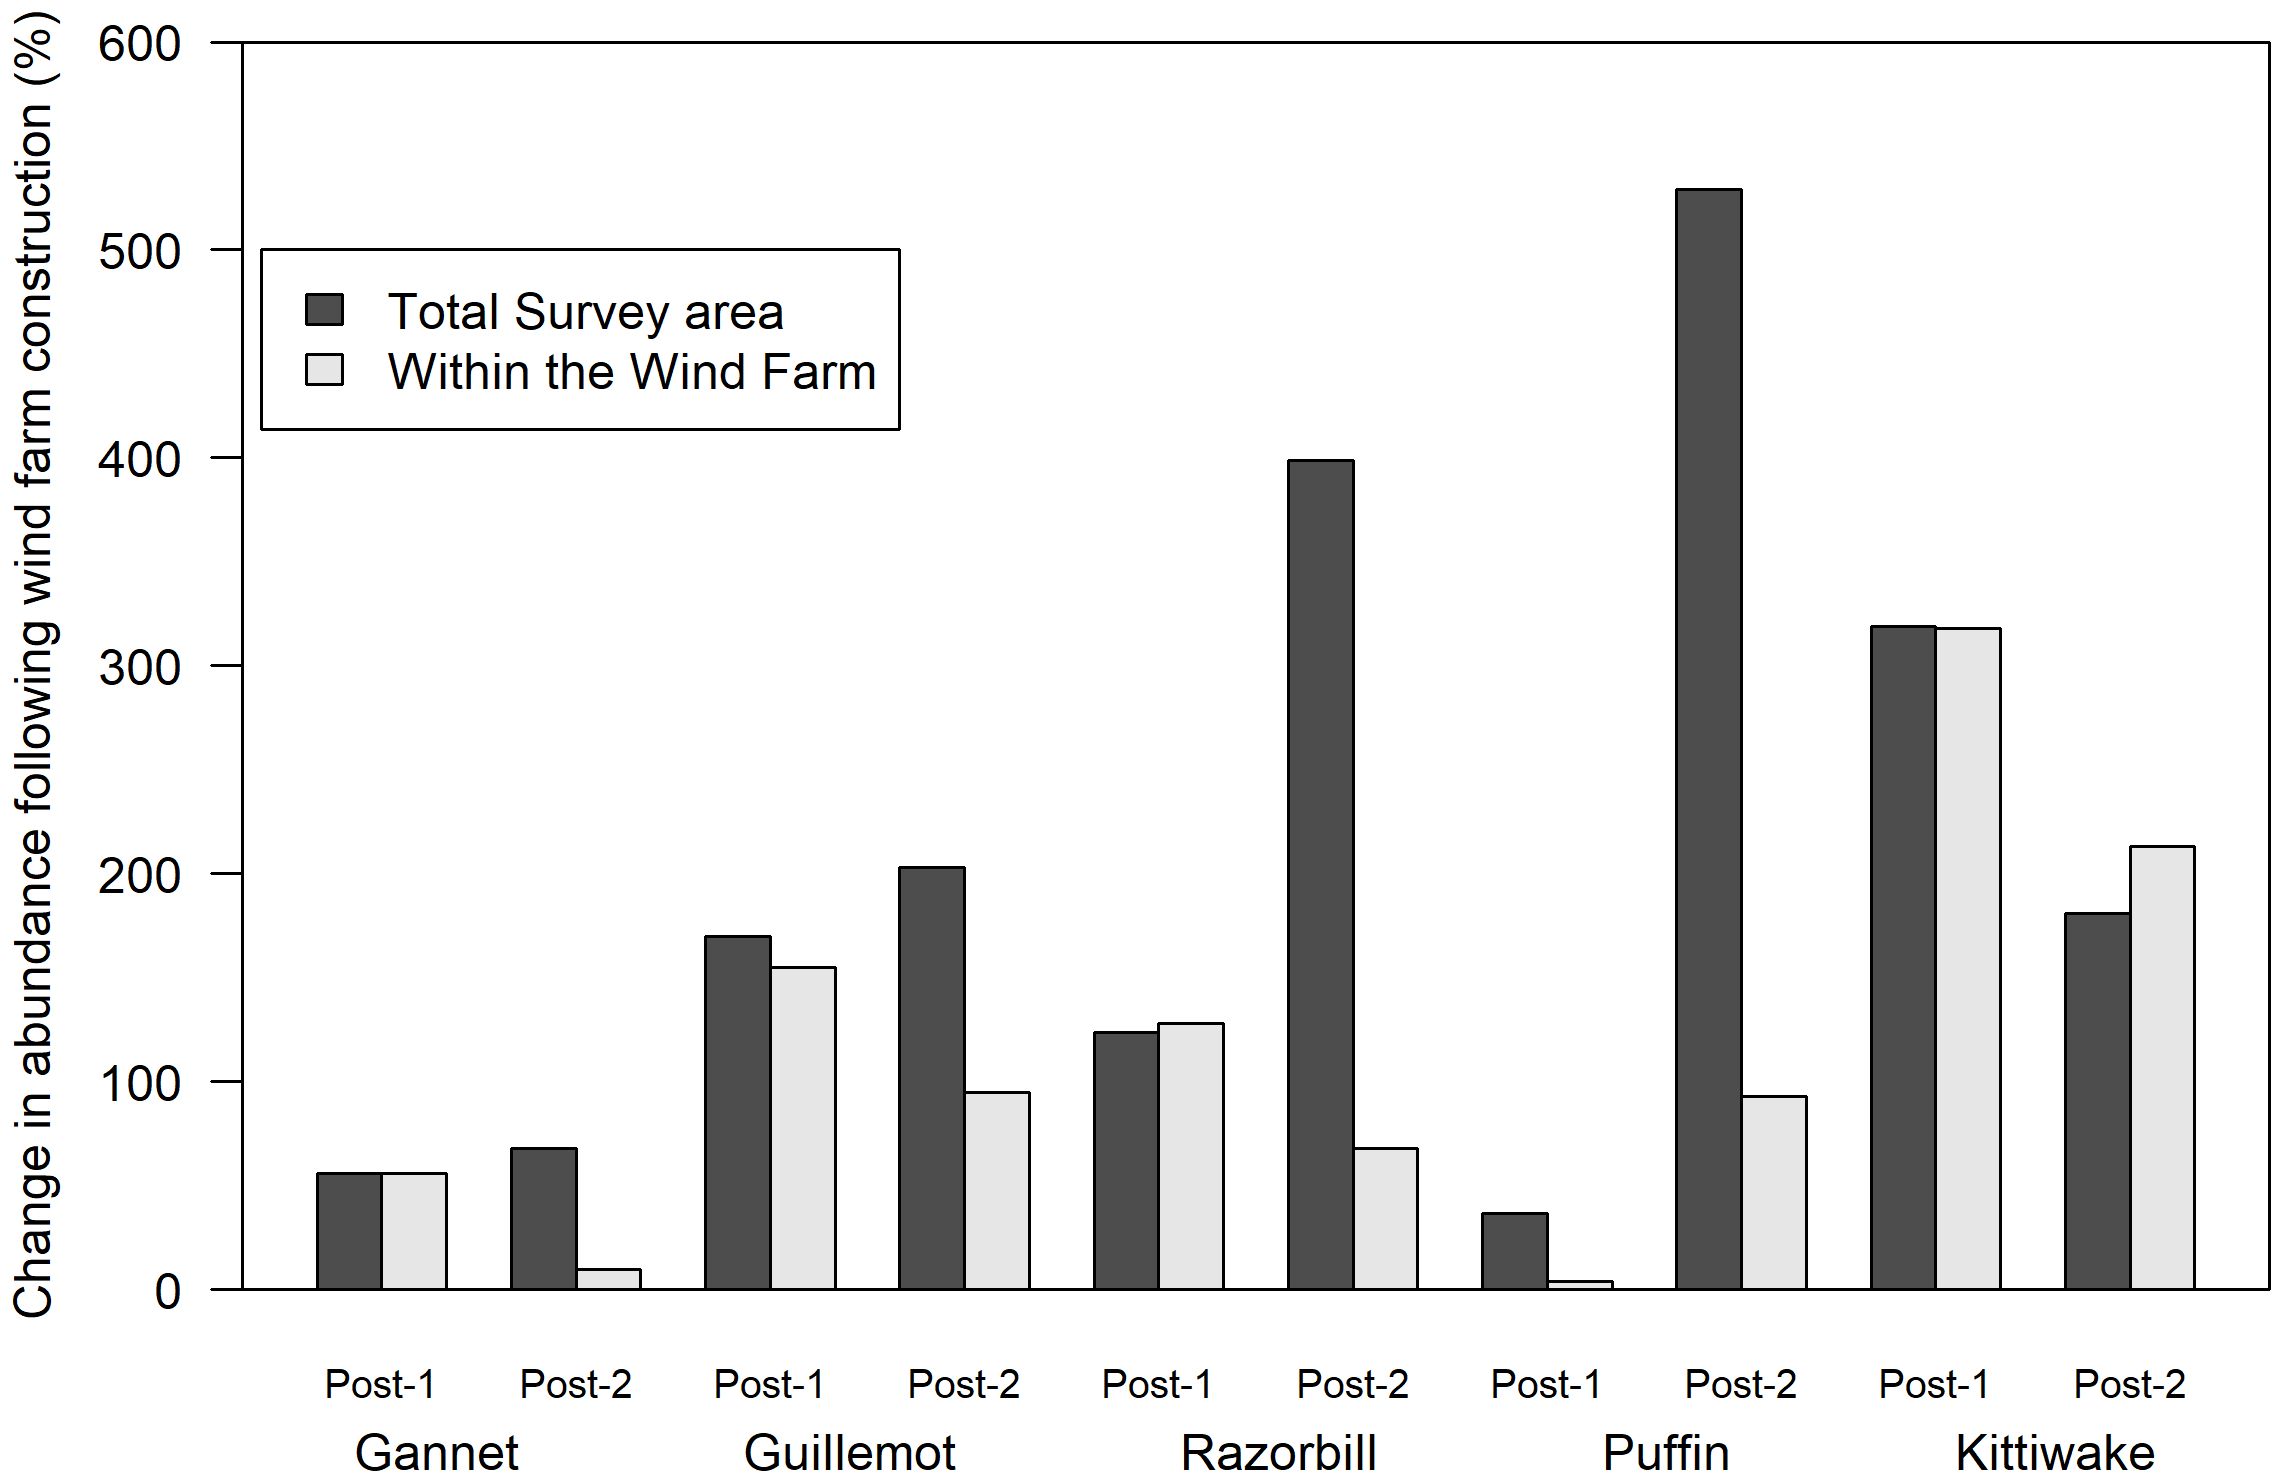
Figure 3 Percentage change in seabird abundance within the offshore wind farm (grey bars) and in the total survey area (black bars) following construction of the offshore wind farm. Abundance on two post construction surveys (post-1, 2019 and post-2, 2021) were compared with abundance on the single pre-construction survey (2015). Abundance changes<100% suggest displacement from or avoidance of the wind farm whereas changes >100% suggest no displacement/avoidance.
The overall abundance and distribution for each species was compared across the pre-construction and post-construction data (Figure 4). Gannet abundance on both post-construction surveys was lower than the pre-construction survey across the total survey area and particularly within an area encompassing the wind farm. In contrast, guillemot, razorbill and kittiwake abundance was higher following construction of the wind farm in both post-construction years, while for puffin abundance was lower in the first post-construction year but higher in the second. In some cases, abundance increased outside of the wind farm but was unchanged within it following construction (e.g. guillemot) while for others (e.g. razorbill) increases occurred throughout the survey area, including the wind farm. With the exception of gannet, these results appear to show no consistent effects of the wind farm on the distributions of the species studied.
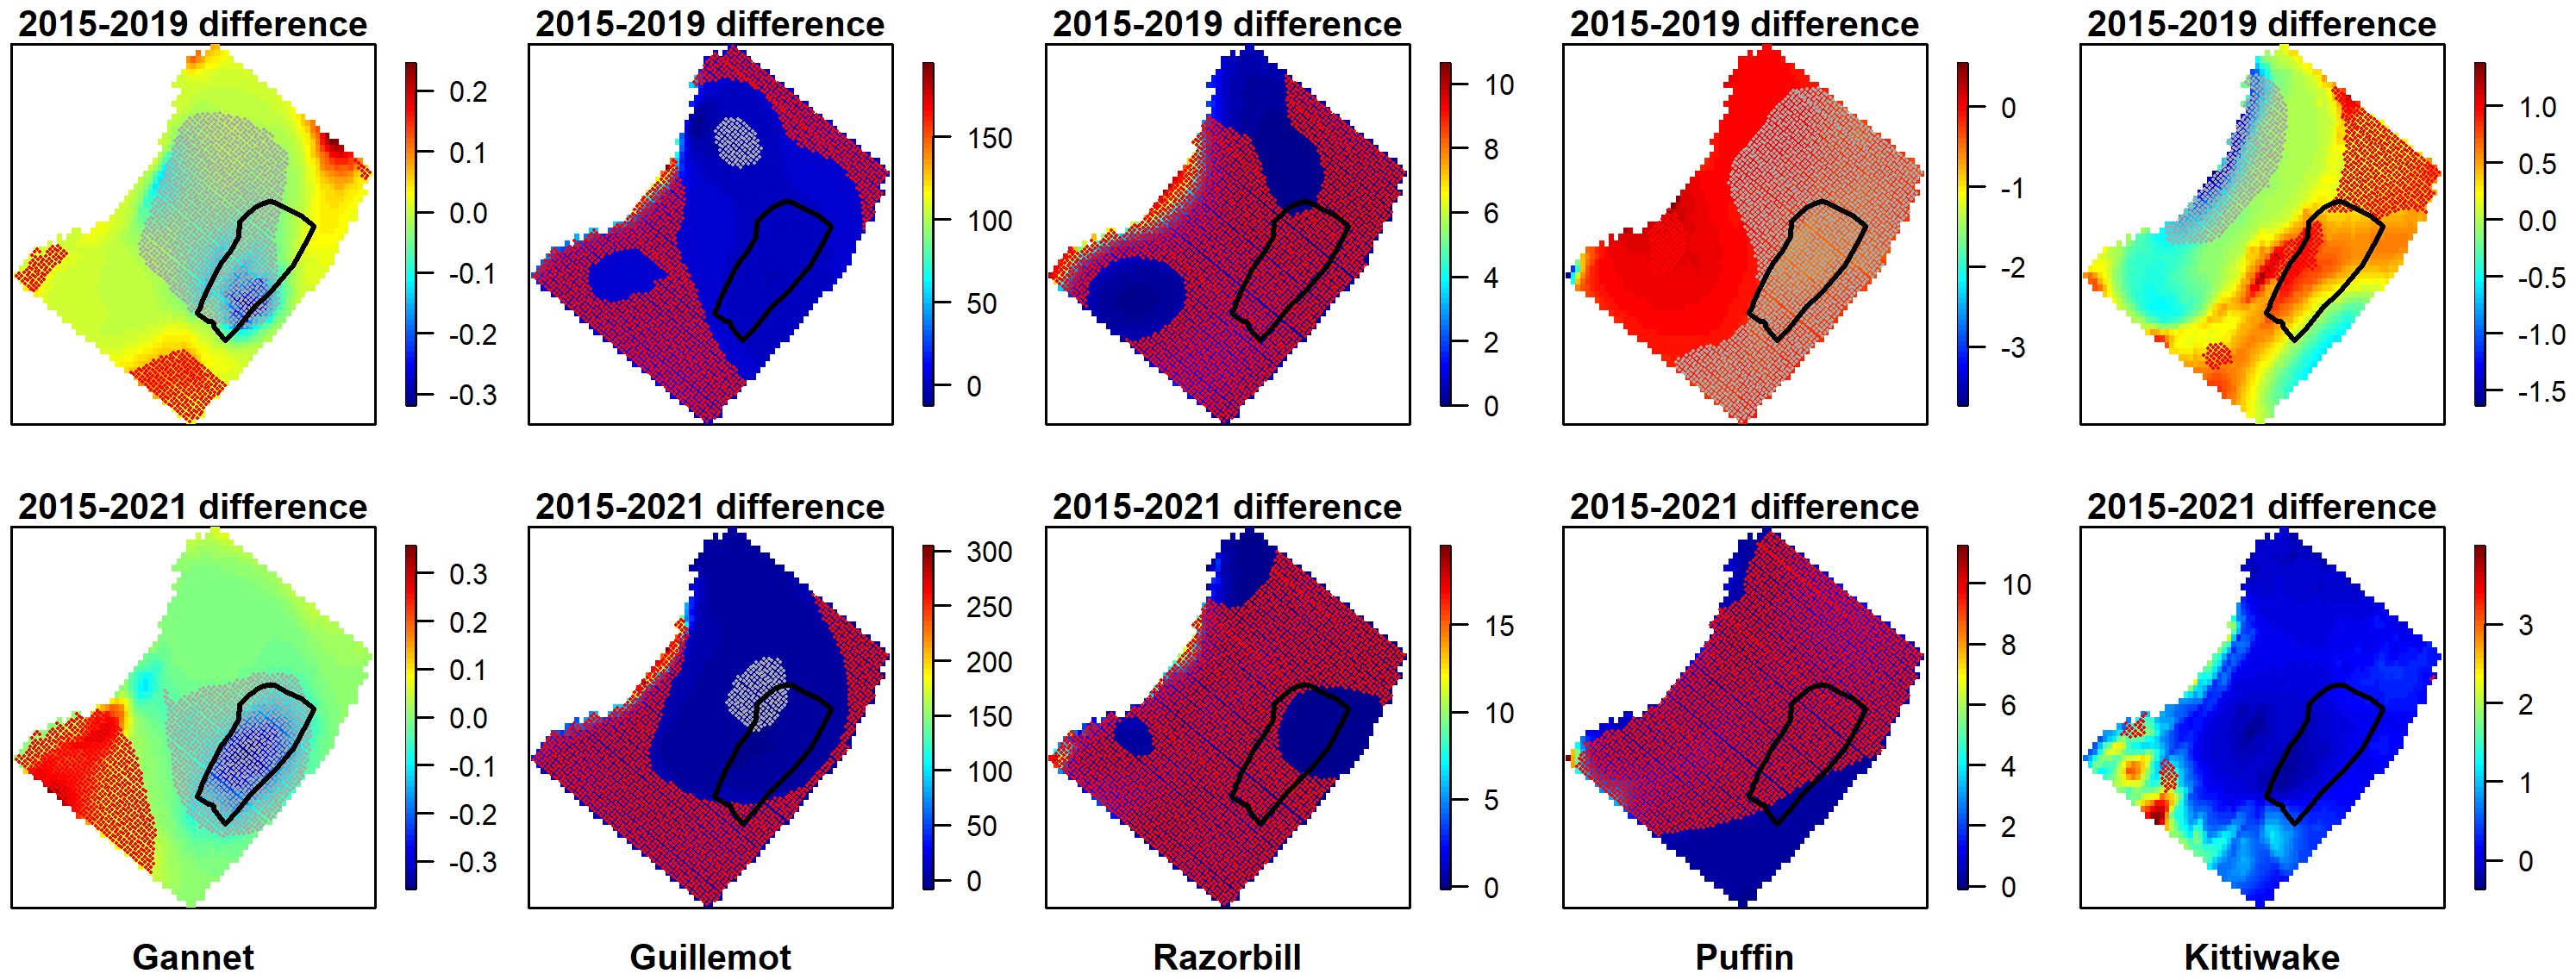
Figure 4 Before-after differences in density surfaces across the whole survey area for gannet, guillemot, razorbill, puffin and kittiwake. Upper figures compare pre-construction and post-construction 1, lower figures compare pre-construction and post-construction 2. The z-axis indicates differences between the years. Negative values identify areas of decrease and positive value are areas of increase, with 0 indicating no difference between years. Areas of significant increase between the two years are overlain with red marker symbols, areas of significant decrease are overlain with grey marker symbols.
To control for the potentially confounding effect of temporal change across years in seabird distributions, we examined the distribution of birds relative to individual turbines at a single point in time. Given the relatively small numbers of gannet observed and the fact that a clear displacement/avoidance effect was evident, we did not look at within wind farm responses of gannet to the presence of turbines.
Sample sizes (numbers of birds observed within 400m of turbines), when broken down into categories of year of survey (2019 or 2021), species (guillemot, razorbill, puffin or kittiwake), behaviour (flying or sitting on the water) and circle radius around turbines (100m, 200m, 300m and 400m) were small for some species (Table 2).
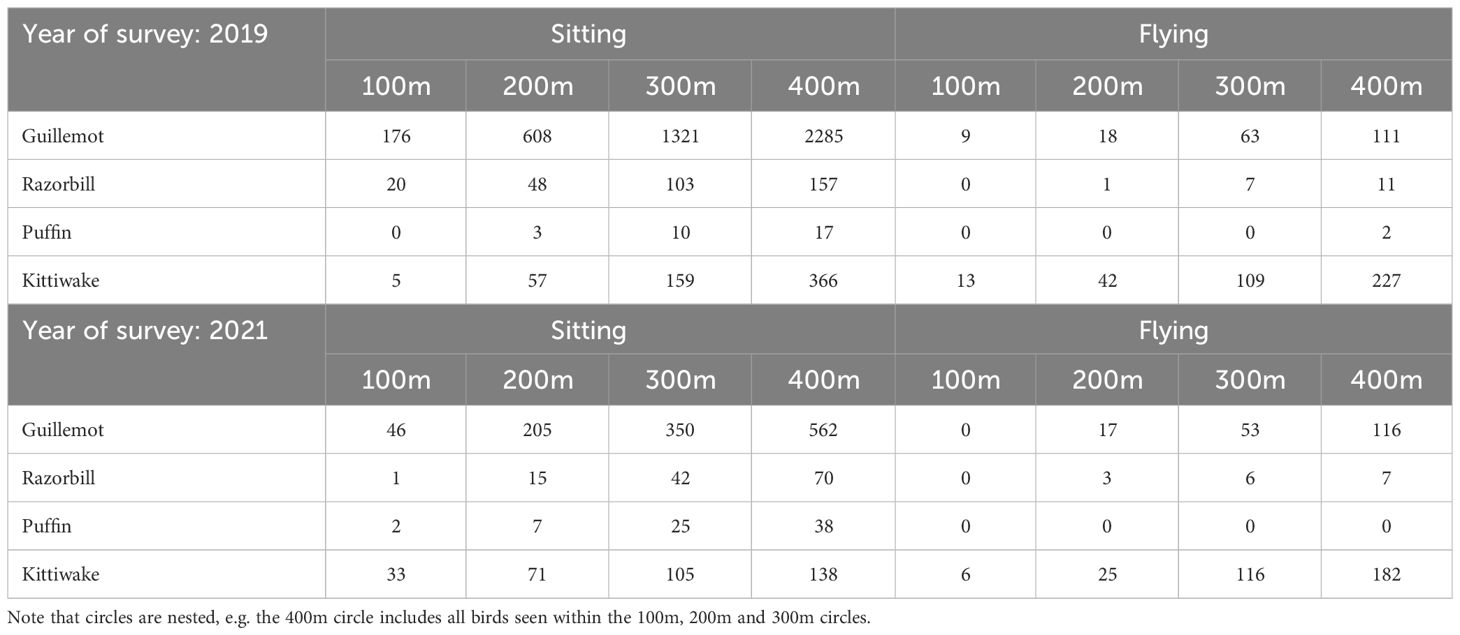
Table 2 The number of individual birds observed in flight or on the water within 100, 200, 300 and 400 m of turbines.
Few razorbills and puffins were recorded flying within 400m of turbines: only two puffins were seen flying within 400m of turbines and only six were recorded flying within the wind farm when transects between turbine rows were included (Figure 5). Consequently, it was not possible to assess avoidance and attraction behaviour for flying individuals in this species. Whilst only 35 razorbills were seen flying within 400m of turbines (across both years), a total of 96 flying razorbills were recorded on survey transects in the entire OWF area (Figure 5). Whilst these are small sample sizes and results should be treated with caution, sample sizes are sufficiently large to assess avoidance and attraction behaviour. More guillemots were seen flying than for the other auk species, although ten times more guillemots were sat on the water. Approximately half of kittiwakes were flying, meaning displacement/avoidance and attraction behaviour could be assessed for these two species both for flying and for sitting on the water.
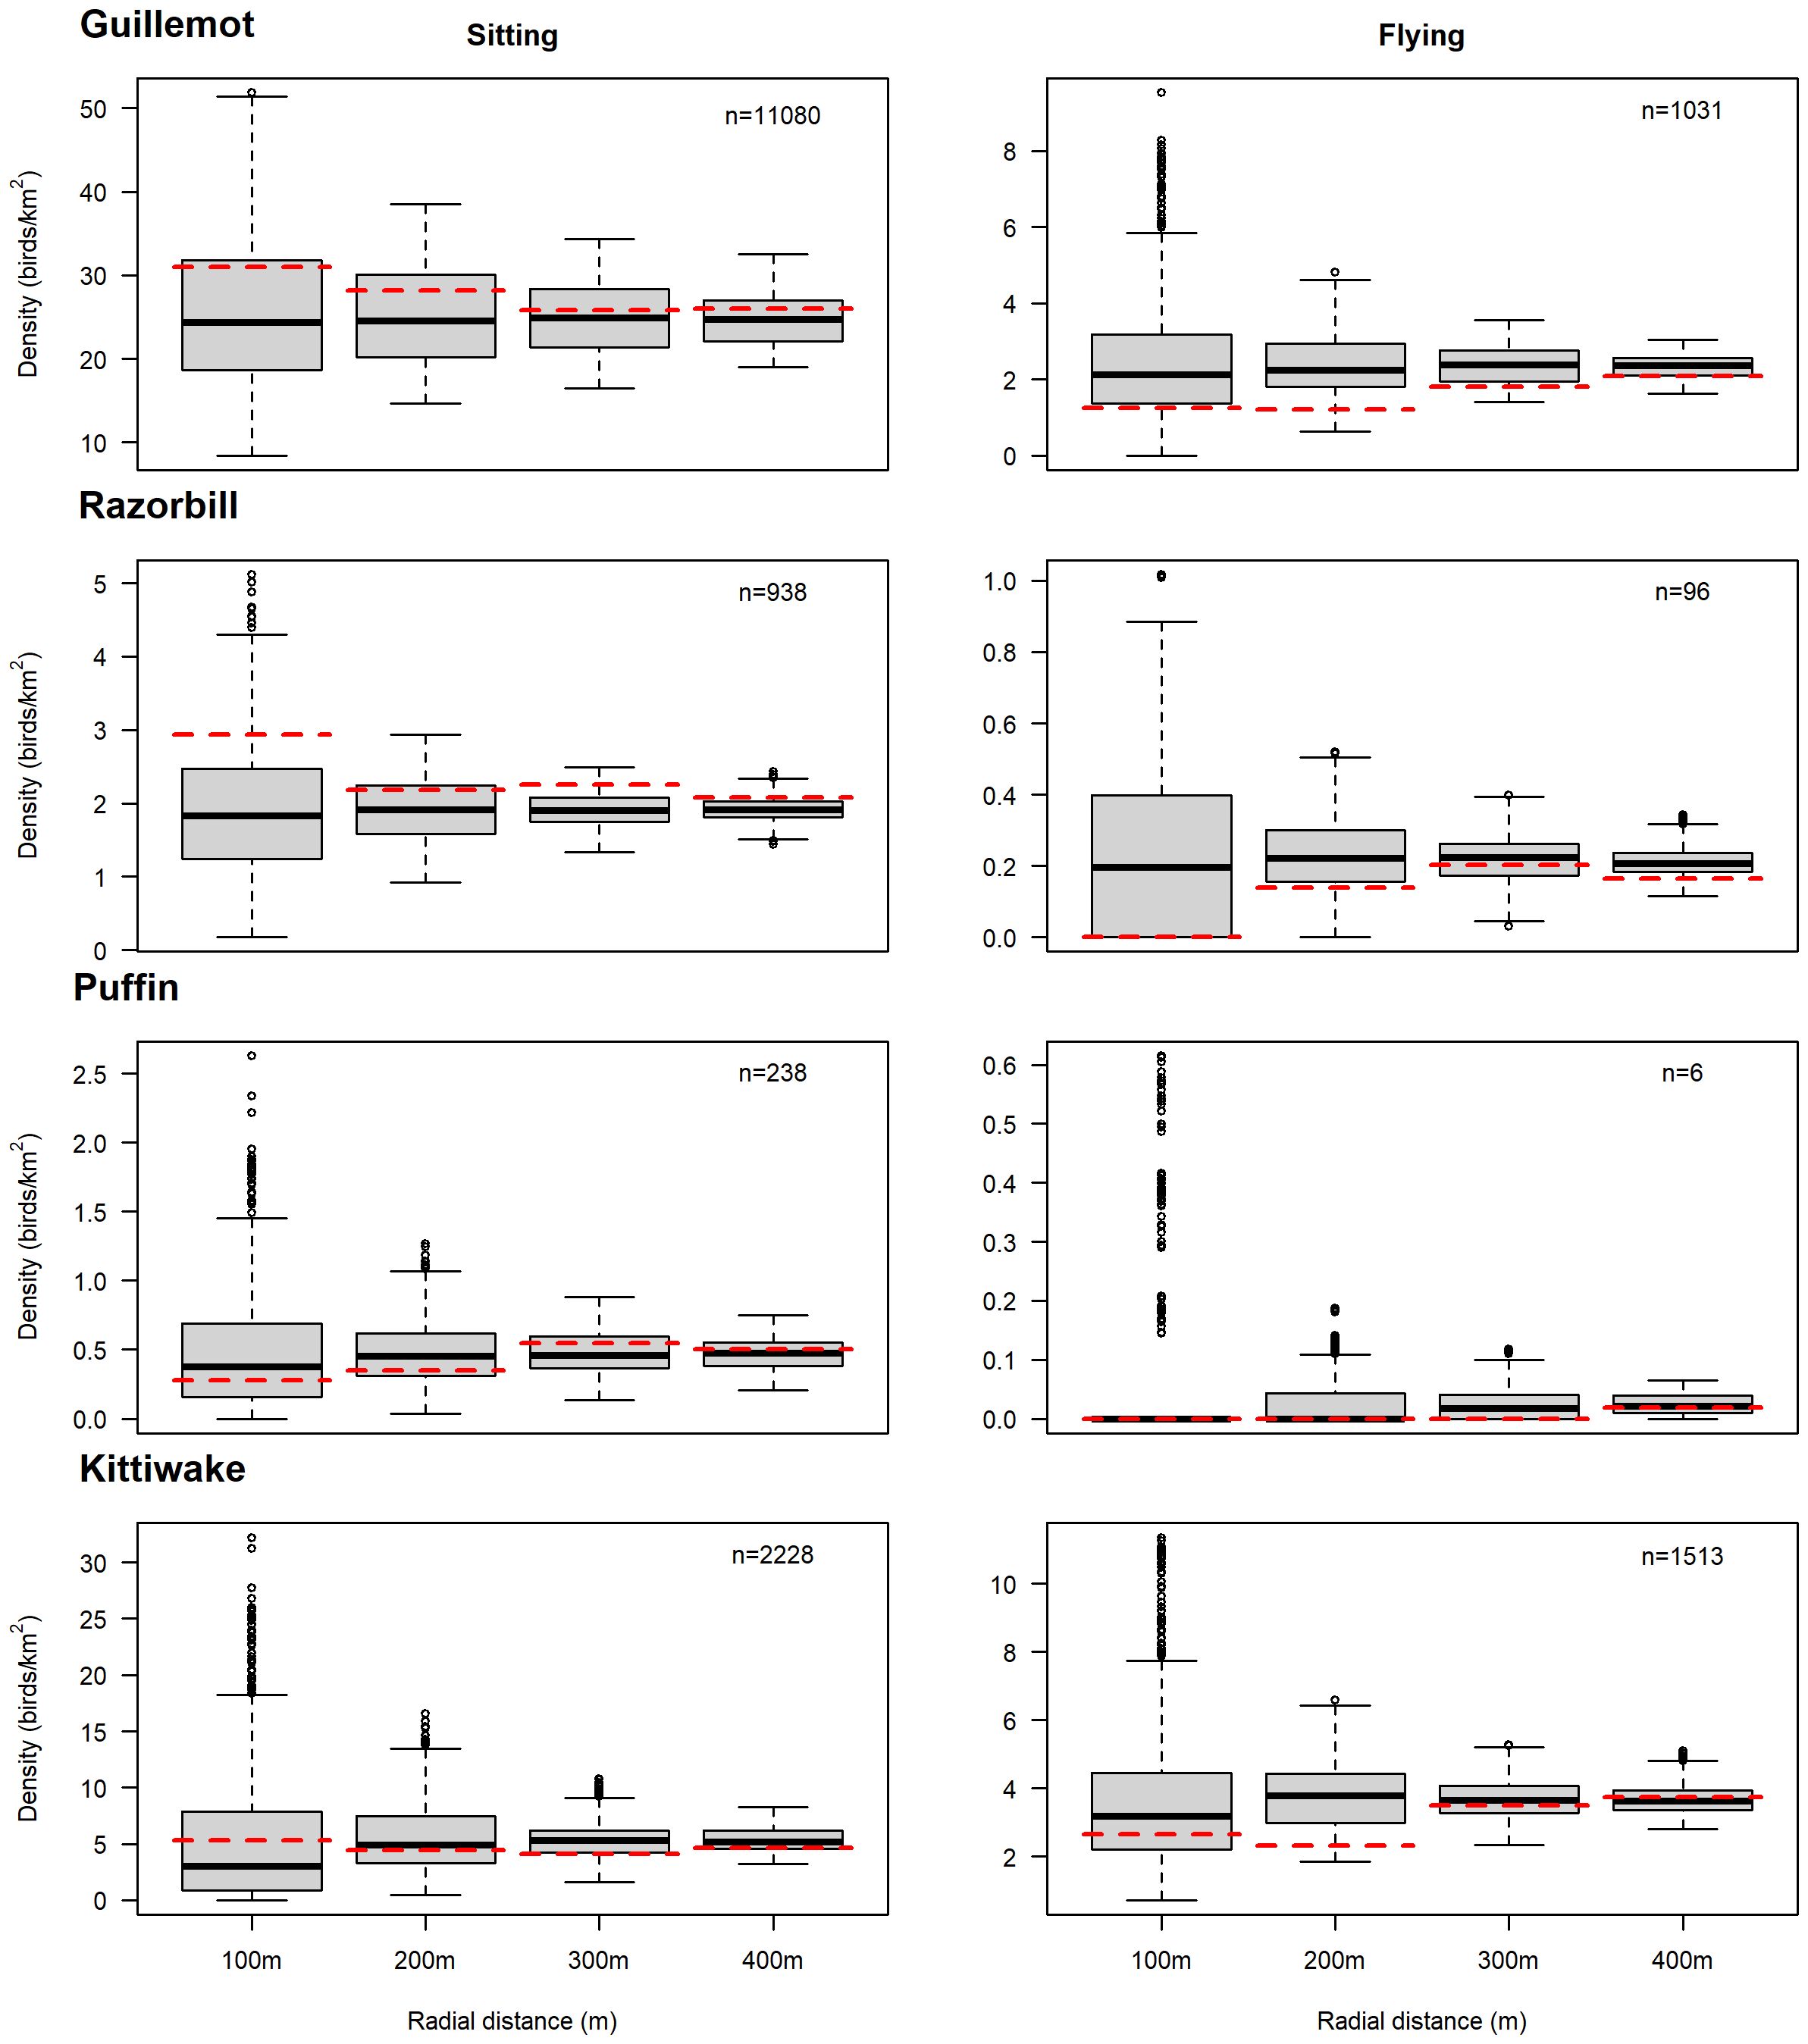
Figure 5 Comparison of observed seabird mean density (red dashed line) with simulated densities (black line = median; grey box = interquartile range) in the 100m, 200m, 300m and 400m circles around turbines. An observed density (red dashed line) less than the simulated median implies avoidance/displacement behaviour whereas an observed density greater than the simulated median implies attraction. The sample size (n) is the total number of that species recorded flying or sitting on the water in the whole offshore wind farm area. Flying puffin sample sizes were too small to permit analysis. See Tables 4, 5 for statistical tests of significance.
Statistical tests (two-tailed test) showed that the mean observed densities did not differ significantly to expected densities for any of the categories, i.e. no p values were <0.05 (Table 3). The exceptions to this were zero values for flying guillemots (in 2021) and razorbills (both years) and for puffins (2019) sat on the water, where few or no birds were recorded within 100m of the turbines. However, these were due to small sample sizes and do not suggest substantial differences in seabird displacement/avoidance across the two survey years. Given this, the two years of survey were pooled to increase sample sizes.
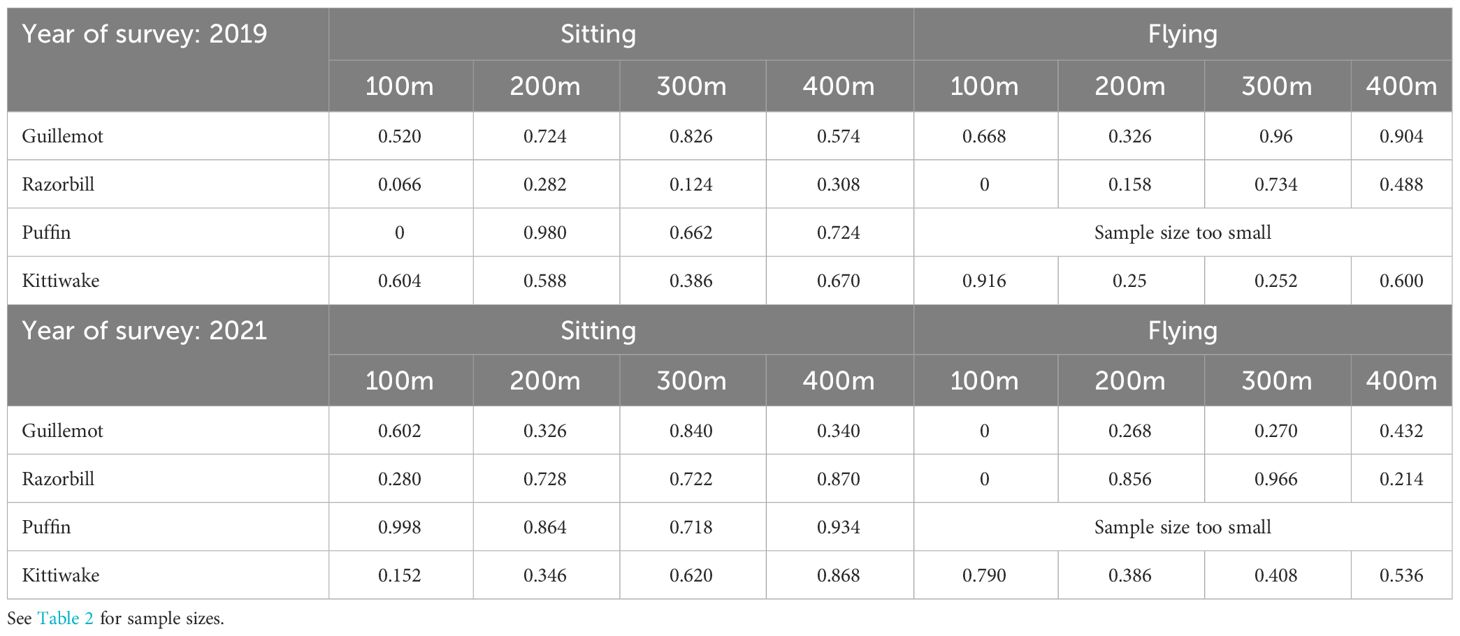
Table 3 P values of two-sided tests for observed mean density being significantly different to expected density, broken down by year, species, behaviour and distance from turbine.
No evidence for significant displacement/avoidance behaviour (defined as p<0.05) was found for birds sat on the water using the turbine relocation method (Table 4). Guillemots were predicted to be at lower densities than expected in flight within 200m of turbines (p = 0.018) and a similar result was observed for kittiwake, albeit this did not attain statistical significance (p = 0.084). However, for both species there was no indication of an effect closer to turbines.
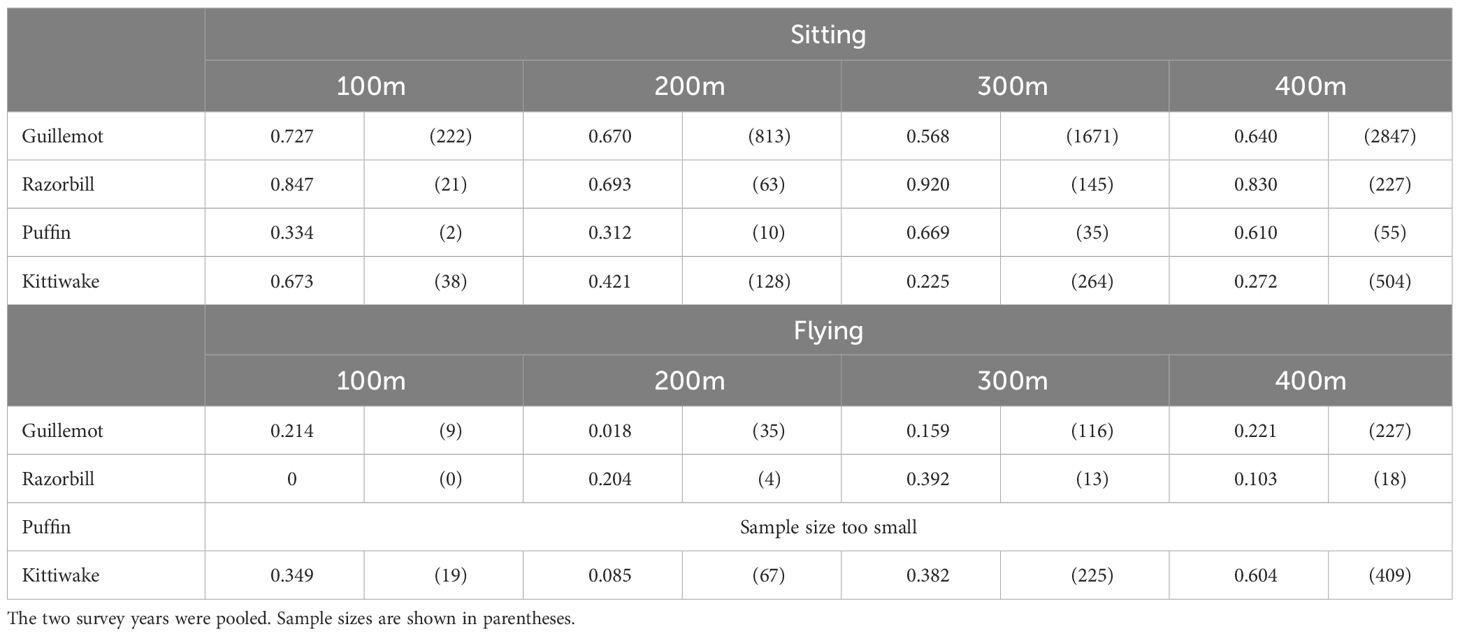
Table 4 P values of one-sided tests for displacement/avoidance behaviour, i.e. observed mean density being significantly less than expected density, broken down by species, behaviour and distance from turbine.
As for displacement/avoidance effects, no significant attraction behaviour (defined as p<0.05) was found using the turbine relocation method (Table 5). There was a tendency for razorbills to be at higher densities than expected at 300m from turbines, although this did not attain statistical significance (p = 0.080).
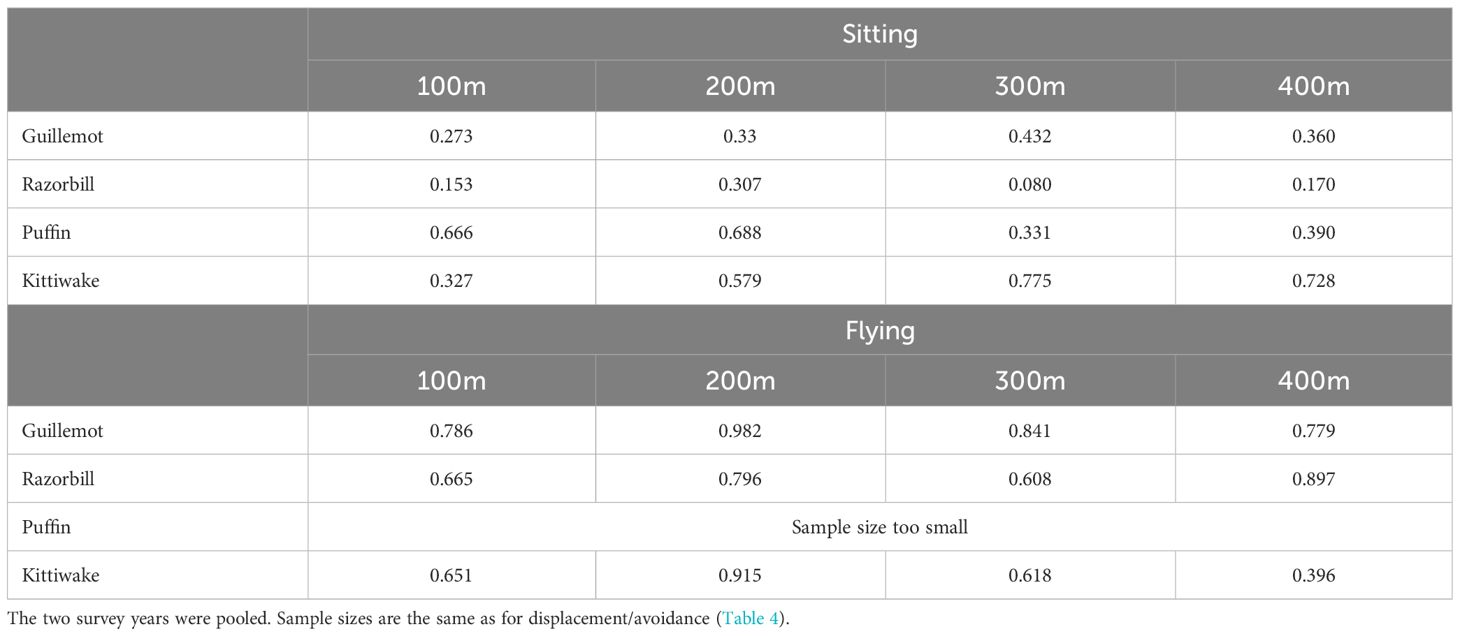
Table 5 P values of one-sided tests for attraction behaviour, i.e. observed mean density being significantly greater than expected density, broken down by species, behaviour and distance from turbine.
The statistical tests supported the patterns evident in Figure 5, that mean densities were not significantly different to those which would be expected if the turbines were in a different location, i.e. birds were not actively avoiding/being displaced (Table 4) nor attracted to turbines (Table 5). This was true for all species and for birds both sat on the water and flying, with the exception of flying razorbills (none of which were recorded within 100m of turbines). There was a slight tendency for flying kittiwakes to be at lower densities than expected within 200m of turbines and razorbills sat on the water to be at higher densities at 300m from turbines, when using a significance threshold of p<0.1.
For guillemot, razorbill and to a lesser extent kittiwake, whilst the statistical tests did not return significant results, the plots indicate that birds sat on the water were at higher densities around turbines than expected by chance while the opposite effect was observed for birds in flight, with lower densities near turbines than expected by chance (Figure 5). Puffins sat on the water were recorded in densities similar to expected densities.
The guillemot (on the water) and kittiwake (in flight) data were modified to simulate the distribution of birds to be expected if turbines were avoided by 100, 200, 300 and 400m and re-analysed (Figure 6). In all cases, where birds have been artificially removed to simulate displacement, there is a clear difference between the observed density and expected density. However, the densities beyond the simulated displacement zone remained within the resampled distributions (albeit with some reduction). For example, when guillemots within 100m of turbines were removed from the dataset, the density within 100m of all actual turbines was (as expected) zero, but the range of densities within 100m of the simulated turbine locations remained largely unaffected (left plot, second row Figure 6). Furthermore, while the density of birds within 200m of turbines was reduced by this data manipulation (e.g. compare row 1 and row 2 of the left plots, Figure 6) as would be expected, the actual density (red line) remained within the interquartile range of the resampled distribution. Very similar results were obtained for flying kittiwake. Thus, the method appears to correctly identify the presence and spatial extent of avoidance/displacement behaviour, if present.
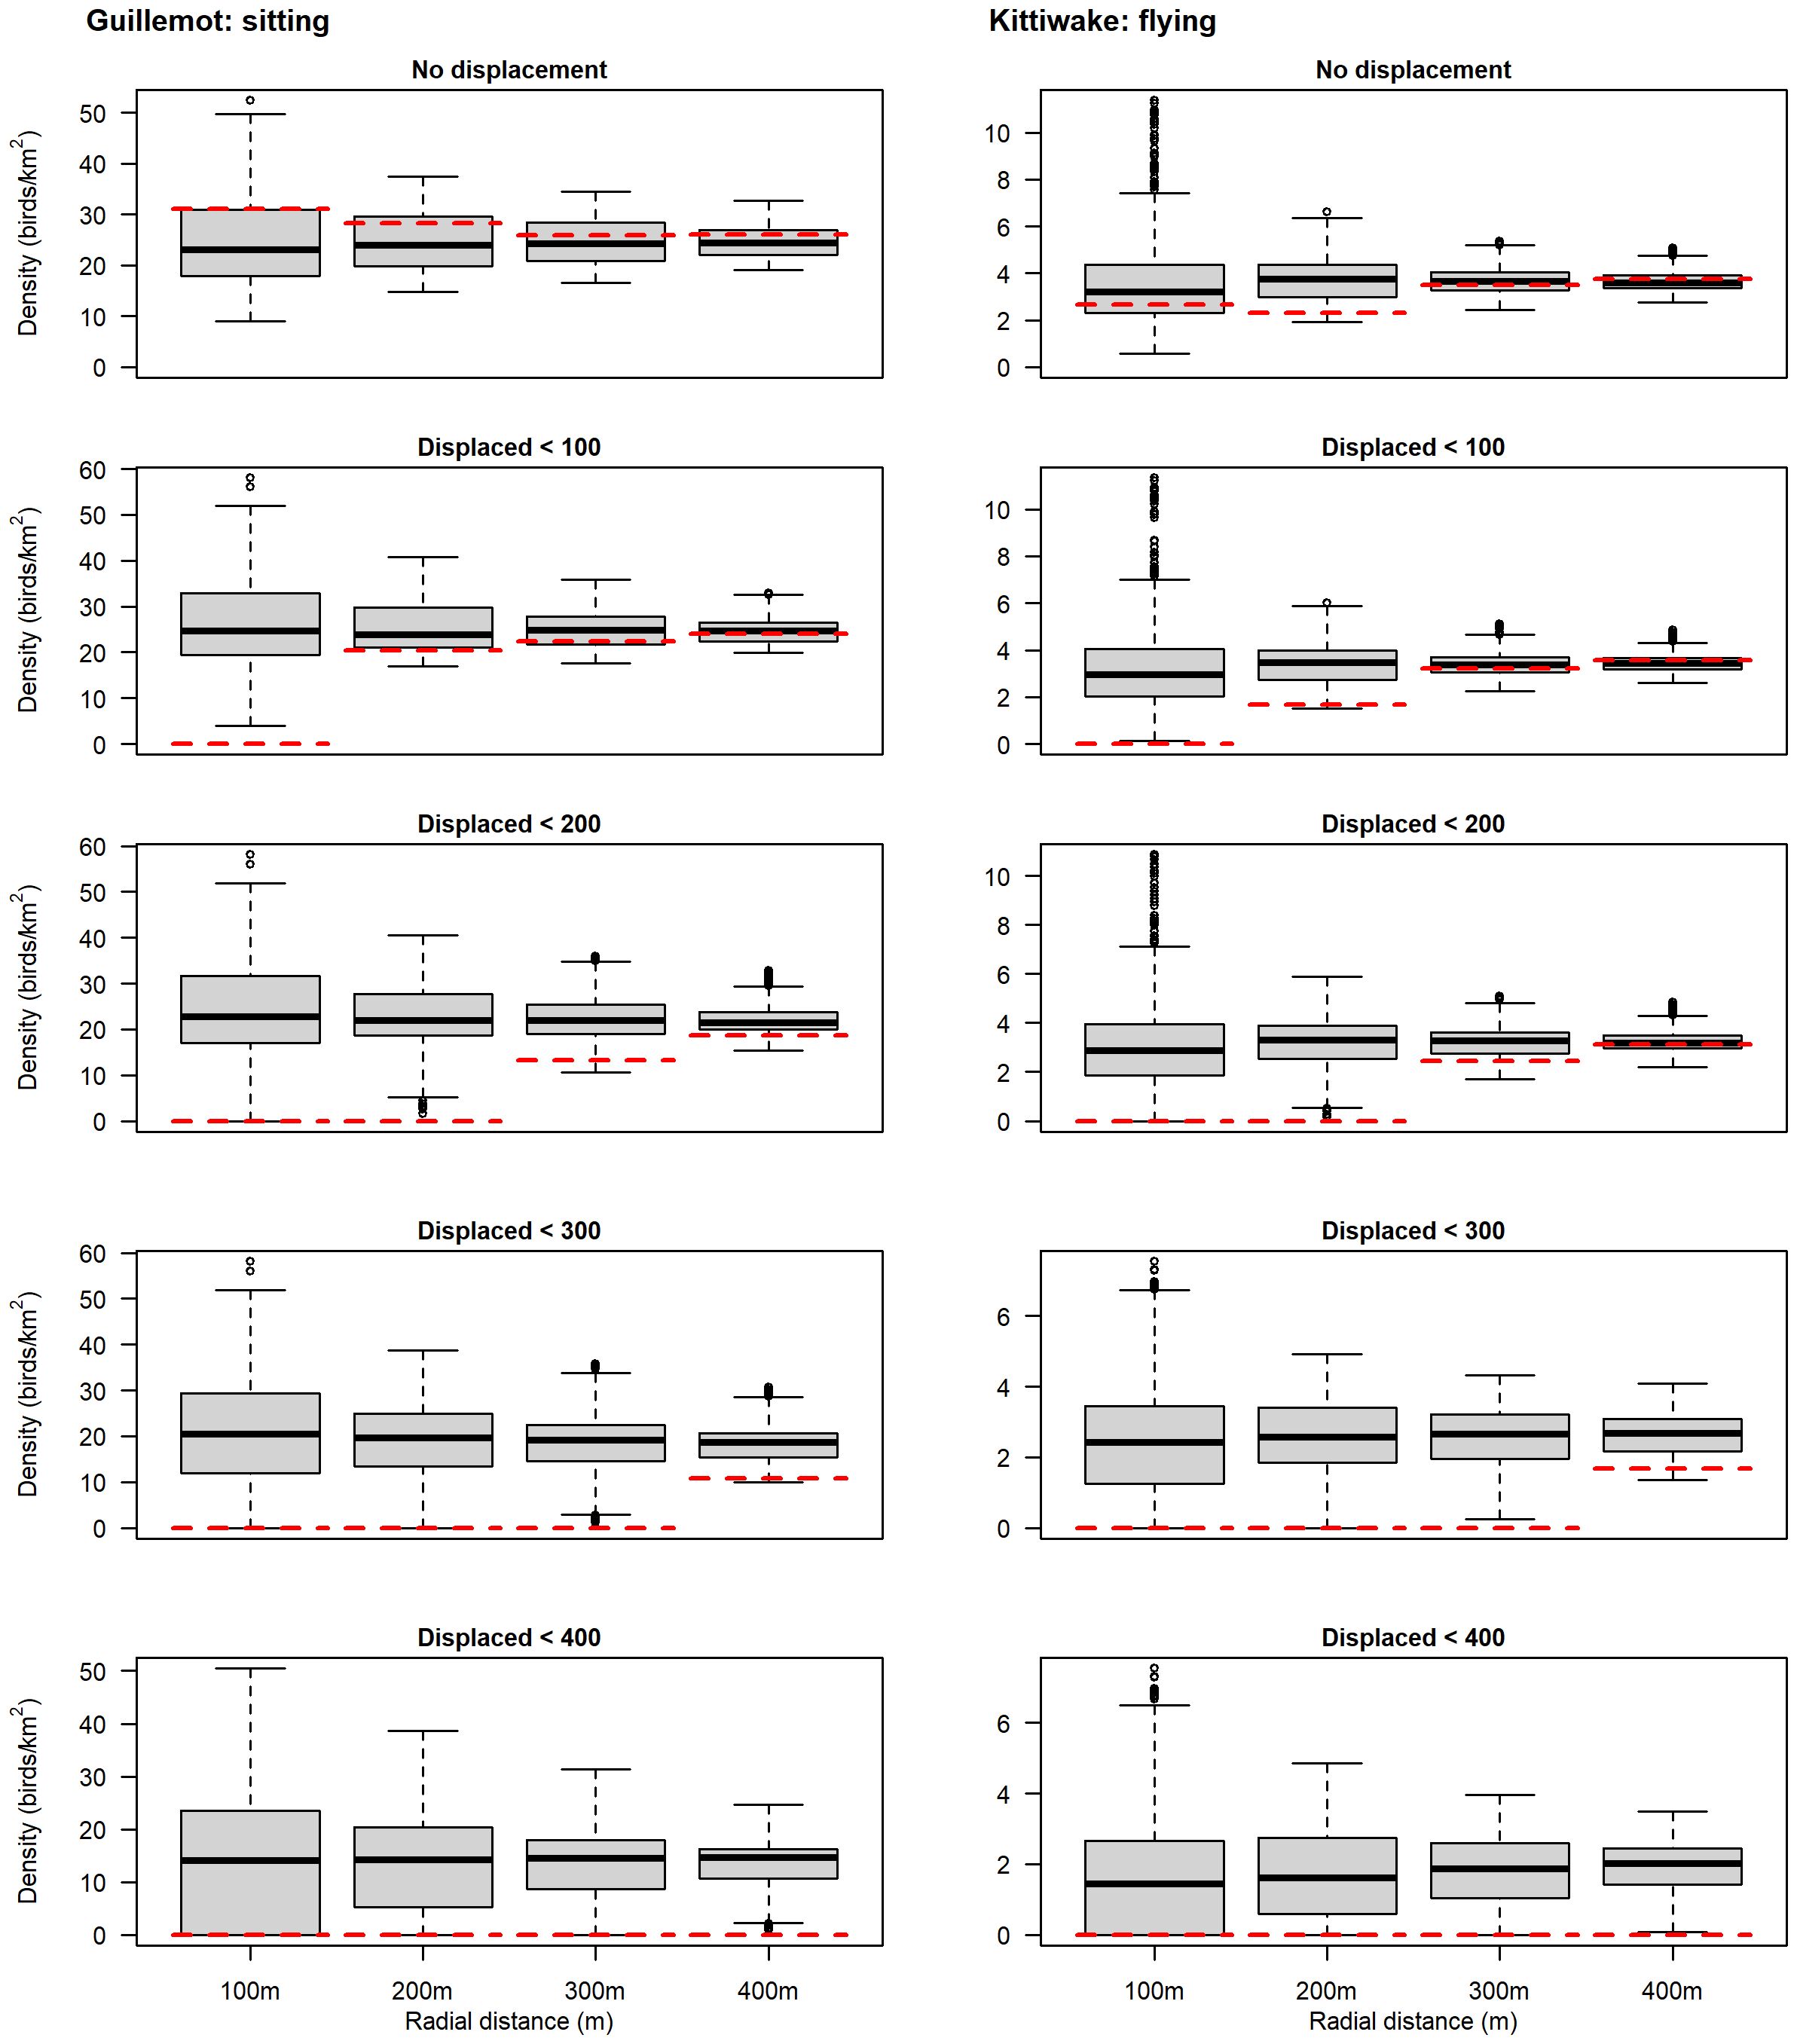
Figure 6 Comparison of observed mean seabird density (red dashed line) with simulated densities (black line = median; grey box = interquartile range) in the 100m, 200m, 300m and 400m circles around turbines. Displacement was simulated by removal of all birds within 100m, 200m, 300m and 400m, sequentially. At each manipulation range the ‘true’ density is 0 but the resampled distribution illustrates the expected density if birds are distributed at random.
There was little indication that bird densities within 400m of turbines were influenced by turbine rotor speed RPM (Table 6), with the real densities falling between the 2.5 and 97.5 percentiles, suggesting neither attraction nor displacement/avoidance, in 95% of instances. Kittiwakes were the only species to show any response to rotor speed, with the exception of a single case for guillemot (Table 6). However, there was no consistent pattern to this with either distance from turbine or rotor speed. The proximity of birds to turbines does not appear to be related to rotor RPM.
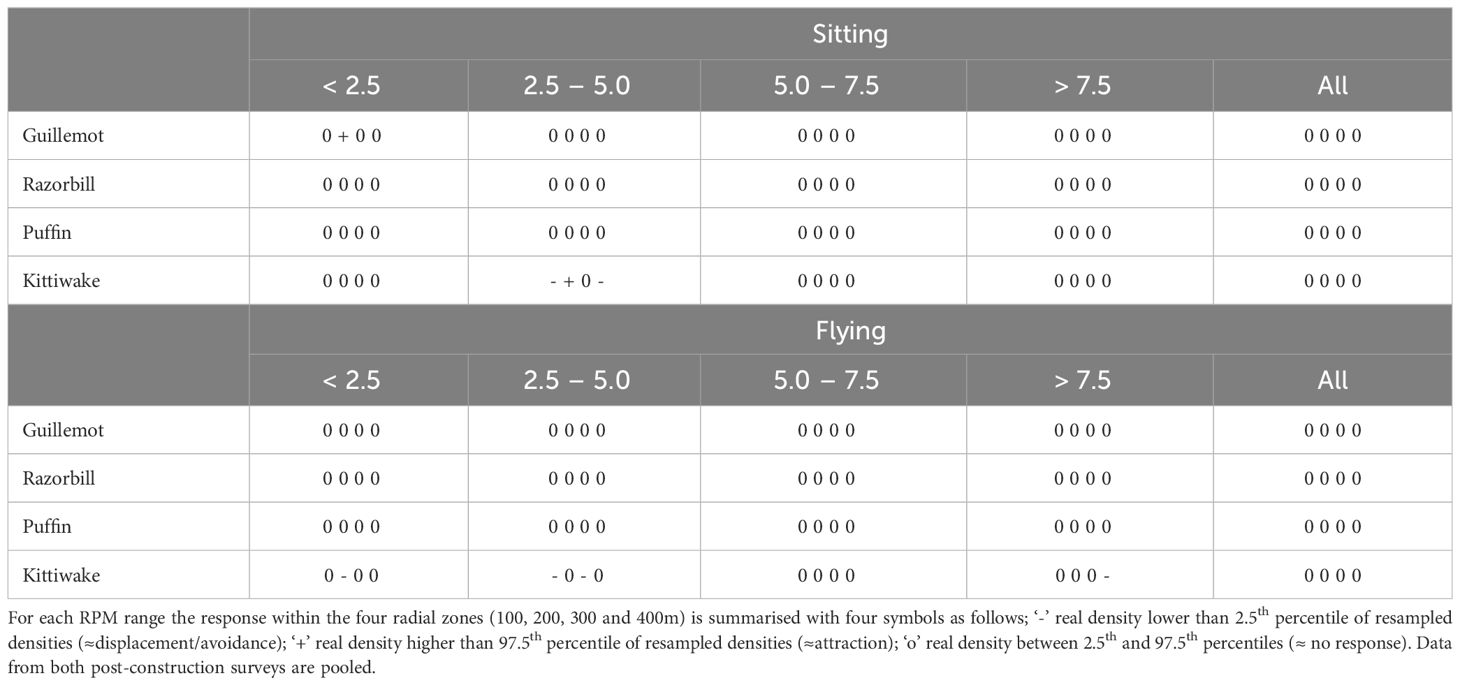
Table 6 Summary of turbine responses subset by turbine RPM (grouped at<2.5, 2.5-5.0, 5.0-7.5, >7.5 and ‘All’ RPMs).
The assessment of displacement/avoidance effects from Beatrice Offshore Wind Farm on five seabird species was carried out using two approaches. Firstly, a widely used approach to assessing displacement was used: (i) a comparison of peak abundance in the wind farm before and after construction and (ii) a comparison of spatial distributions from pre- and post-construction using spatial modelling methods. The abundance comparison and spatial models (Figure 4) showed displacement/avoidance of the offshore wind farm and an area between the wind farm and coast by gannet, with an average 33% decrease in gannet abundance in the wind farm. This gives a mean displacement rate of 67% which agrees with rates found for gannet from other studies of 60-80% (APEM, 2022). However, the change in peak abundance and spatial model approaches gave inconsistent results for the auks (guillemot, razorbill and puffin) and kittiwake and it was not obvious whether any redistribution that occurred was due to the presence of the offshore wind farm or to other drivers of spatial distribution change. Kittiwake peak abundance increased on both post-construction surveys, compared with the pre-construction surveys but distribution changed, with significant declines across much of the survey area including within the wind farm. This suggests no displacement/avoidance behaviour but it is difficult to separate out the redistribution of kittiwakes across the survey area over time from any wind farm effect. Guillemot and razorbill showed a slight increase in peak abundance within the wind farm on the first post-construction survey and a slight decrease on the second post-construction survey. Both species showed strong increases in density outside of the wind farm on the post-construction surveys but whether the birds were electing to not forage in the wind farm because of the presence of operational turbines or whether there were simply better foraging opportunities in another part of the study area outside of the wind farm is difficult to state with any confidence. Peak puffin abundance was much lower in the first post-construction survey compared to the pre-construction estimates, but by only a small amount on the second post-construction survey. However, analysis of the change in spatial distribution of puffins showed a significant increase in density within the wind farm on both post-construction surveys.
This demonstrates the challenges of detecting and quantifying seabird displacement/avoidance behaviour using before-after comparisons, either of abundance or distributions when the effects are less than (or nearly) absolute. For species that are considered to show strong displacement/avoidance of OWFs, such as gannet and red-throated diver Gavia stellata, these approaches can be used to quantify displacement/avoidance, as the response to OWFs has been found to be stronger than environmental drivers on seabird distribution patterns through time (Heinänen et al., 2020; APEM, 2022). However, for species where this effect is less pronounced or there appears to be no displacement/avoidance of the offshore wind farm, such as guillemot, razorbill, puffin and kittiwake in the current study, before-after comparisons are an unreliable basis for quantifying displacement.
The results of the turbine relocation analysis gave a more consistent and more easily interpreted assessment of displacement/avoidance behaviour than the spatial models and peak abundance change approaches. Power analysis of the turbine relocation method, in which observed birds were artificially removed at certain distances from turbines to simulate displacement/avoidance behaviour, provided confidence that the method would detect displacement if present. This lends support both to this study’s findings and also that this is an effective method for detecting displacement at operational wind farms.
There was an indication that guillemot, razorbill and kittiwake when sat on the water were at slightly higher densities than expected near turbines, with the opposite effect for flying birds (slightly lower densities than expected, near turbines). Puffin recorded on the water were observed at very similar densities to those expected by chance, but too few puffins were recorded in flight for analysis. There was no indication that turbine rotor speed influenced these results.
A range of apparent seabird displacement and avoidance responses to offshore wind turbines have been reported (Dierschke et al., 2016). Some species, such as red-throated diver, have been reported to avoid wind farms by distances of more than 10 km (Mendel et al., 2019; Vilela et al., 2021; Garthe et al., 2023), while other species, such as large gulls (Larus sp.), appear to show either no response or attraction to turbines (Welcker and Nehls, 2016; Johnston et al., 2022) and cormorants (Phalacrocorax carbo) are regularly reported to be attracted to turbines, or more pertinently to the structures and the opportunities for roosting provided (Canning et al., 2013; Leopold et al., 2013).
Contrary to the results of this study, guillemot and razorbill have most often been reported to show intermediate levels of displacement/avoidance (e.g. Krijgsveld et al., 2011; Leopold et al., 2013). Tjørnløv et al. (2023) reported meso-avoidance by kittiwakes of 100-120m from turbines which agrees with this study where there was a tendency for kittiwake density to be lower than expected within 200m of turbines. Other reported displacement/avoidance and attraction results for kittiwake are very varied, with some studies reporting large decreases in abundance within wind farms (Vanermen et al., 2016), others no response (Percival, 2013) and still more finding large increases (Canning et al., 2013). To date there has been very little overlap in the distribution of puffin and offshore wind farms where monitoring has been undertaken (for example Dierschke et al., 2016 reported only one study that mentioned puffin) and therefore there are no existing estimates of wind farm response for this species.
Peschko et al. (2020) used GPS tags to study foraging tracks of guillemots breeding at Helgoland, Germany and reported strong avoidance of wind farms, particularly at higher wind speeds (used as a proxy for turbine operation). Their results contrast with those presented here, which found no turbine avoidance and no relationship with turbine RPM. It is unclear why the two studies have reached different conclusions although each uses very different methods. It would be valuable to apply the turbine relocation approach to transect survey data collected from the offshore wind farms in German waters to see if the same strong displacement effect was obtained as was found by tracking individuals. Zuur (2018) reanalysed monitoring data for several wind farms, including Egmond an Zee (Krijgsveld et al., 2011), Princes Amalia (Leopold et al., 2013), Robin Rigg (Canning et al., 2013), Bligh Bank and Thornton Bank (Vanermen et al., 2016) using more sophisticated statistical methods than previously applied. Contrary to the originally published results, this reanalysis found no evidence for significant displacement for guillemot at Princes Amalia and Egmond an Zee wind farms, despite data being collected over a nine year period, and only a weak pattern potentially consistent with an avoidance effect at Robin Rigg, from a five year dataset. Zuur (2018) also found that re-analysis was not possible for data from several other wind farms, e.g. Alpha Ventus (Mendel et al., 2014) and Horns Rev (Petersen et al., 2006) due to large numbers of zero values, despite each study having over five years of survey data. Although this is partly a reflection of the study wind farm locations, which are not in areas with high auk abundance (Waggitt et al., 2019), it nonetheless highlights that temporally extensive monitoring of this type faces considerable challenges in obtaining data at a spatial and temporal resolution sufficient to permit robust displacement analysis.
Such a wide range of apparent displacement, avoidance and attraction responses is equally indicative that the effects attributed to the offshore wind farms in question were spatial redistributions of birds driven by other variables, such as prey availability. Furthermore, this highlights the difficulty which most studies investigating displacement of seabirds have faced, since comparisons of the abundance and distribution of birds before and after wind farm construction are strongly confounded with natural variations in such highly mobile and wide-ranging species (Wakefield et al., 2009).
One of the other findings from the re-analysis of older guillemot datasets (Leopold, 2018; Zuur, 2018) was that spatial patterns differed between surveys, with the consequence that comparing spatial distributions collected at different points in time, to quantify a wind farm effect, is likely to give misleading results. The benefit of the turbine relocation method presented here is that is does not seek to compare spatial distributions before and after wind farm construction (as all previous analyses have) but rather examines the location of birds relative to turbines at a single point in time. This new method therefore removes a key source of uncertainty when trying to quantify displacement/avoidance effects.
For displacement to have a demographic impact on protected seabird populations there needs to be a negative energetic and fitness consequence for affected individuals, following displacement/avoidance (JNCC, 2022). In wind farm impact assessments, displacement mortality is calculated as the product of the percentage displaced and the rate of mortality for displaced individuals (JNCC, 2022; Parker et al., 2022). Obtaining mortality rates associated with displacement is a considerable challenge and while biologging techniques do provide insights into behaviour and energetics can be inferred from this (e.g. Burke and Montevecchi, 2018; Dunn et al., 2020; Duckworth et al., 2021; Buckingham et al., 2023) there is currently no empirical evidence on how displacement/avoidance behaviour changes condition and survival/productivity of displaced individuals. Whilst the new methodological approach for assessing displacement that we have presented here provides no information on the energetic and demographic consequences of displacement, the fact that no displacement/avoidance behaviour was detected gives reassurance that there should also be no energetic or, perhaps most importantly, demographic consequences of displacement for auks and kittiwakes in and around the Beatrice Offshore Wind Farm.
Faced with the need to predict displacement effects for seabird populations and the absence of empirical observations on displacement consequences, UK statutory conservation agencies have advised developers to assume displacement rates of up to 70% for auks and 30% for kittiwakes (Parker et al., 2022; NatureScot, 2023), which imply much greater impacts than the results presented here, which have found an absence of displacement/avoidance behaviour for kittiwakes, guillemots, razorbills and puffins. This highlights the urgent need for further empirical studies from operational offshore wind farms, to build the evidence base on the extent to which displacement occurs. Since the turbine relocation method reported here was developed to be suitable for use at operational wind farms and is not reliant on the collection of pre-wind farm data it can be applied at any existing wind farm over which digital aerial surveys can be flown. Further application of this method at other locations would increase confidence in the findings reported here and is strongly encouraged.
The motivation for the current study was to gain an understanding of the distance over which seabirds avoid turbines. If it is assumed that displacement from a wind farm is the consequence of turbine avoidance, it follows that once the distance over which avoidance occurs is known, the percentage of a wind farm’s footprint within this distance of turbines provides an estimate of the displacement rate from that wind farm. This turbine avoidance distance could then be applied to other wind farms, for example with different turbine spacing, to obtain site-specific estimates of displacement for planned offshore wind farms. The turbine relocation method therefore provides empirical data that can be fed into a framework for applying generic turbine responses to obtain site-specific wind farm predictions, rather than assuming that an overall reduction in abundance at one wind farm is applicable to another, irrespective of wind farm design.
Species that show a strong displacement or avoidance response to offshore wind farms, such as gannet and red-throated diver, will only be present within an offshore wind farm in very low densities. Low densities within a wind farm give low confidence in the change in bird densities with distance from the turbine. Consequently, the turbine relocation method may not be well-suited to species that tend to occur in low densities within operational offshore wind farms. However, for these species, the redistribution response to the presence of an offshore wind farm is likely to be a strong enough signal to be detected among the variance in seabird distribution caused by other environmental factors. This means that traditional spatial modelling methods would likely detect displacement responses for species that show strong displacement/avoidance of offshore wind farms.
The results of this study indicate that, during the breeding season, the species in question did not avoid the turbines, since at all distances considered the observed densities in both years were indistinguishable from those expected by chance. It is possible that, since the smallest distance assessed was 100m, there may be avoidance at distances less than this but it could be argued that this would functionally be of little concern as it would represent a very small area of possible habitat loss within a wind farm (e.g. only 0.5% of the area within the Beatrice wind farm is<50m from turbines).
The survey design of the current study had survey transects placed over turbines and along corridors between turbine arrays, ensuring sufficient sampling of bird numbers in close proximity to turbines and more distant from turbines. Retrospective application of the turbine relocation method to existing survey data may be difficult if survey design did not include transects overflying a sufficient number of turbines.
This study found no evidence of displacement or avoidance of turbines by guillemots, razorbills, puffins and kittiwakes but these results are from a single offshore wind farm. We therefore strongly encourage application of this method to seabird spatial distribution data from other offshore wind farms, to build confidence in the evidence for displacement effects.
In this study we have demonstrated the application of a new method for quantifying behavioural responses of seabirds to an operational offshore wind farm. Using this method, we found no strong evidence for displacement/avoidance of turbines nor attraction to turbines by guillemots, razorbills, puffins or kittiwakes, within the offshore wind farm. However, these results are from a single offshore wind farm. We would therefore strongly encourage application of these methods to post-construction data from other offshore wind farms, to build the evidence base on the effects of offshore wind farms on seabirds.
The datasets presented in this article are not readily available because they may contain potentially commercially sensitive data collected at an operational wind farm. Requests to access the datasets should be directed to bWFyay50cmluZGVyQG1hY2FydGh1cmdyZWVuLmNvbQ==.
Ethical approval was not required for the study involving animals in accordance with the local legislation and institutional requirements because Wild animals were observed using remote techniques.
MT conceived and developed the study methods and analysis and wrote the manuscript. SO contributed to presenting study results and writing the manuscript. JD provided project support and comments on the early drafts and all authors contributed to the submitted version. All authors contributed to the article and approved the submitted version.
The author(s) declare financial support was received for the research, authorship, and/or publication of this article.
We would like to thank the members of the ornithology subgroup of the Moray Firth Regional Advisory Group (NatureScot, Marine Scotland, RSPB) for helpful comments and discussion during the development of this study. Bob Furness, Ross McGregor and Emily Nelson provided valuable comments on an earlier draft of this paper.
Author JD was employed by SSE Renewables Ltd. Authors MT and SO were employed by MacArthur Green.
The authors declare that this study received funding from Beatrice Offshore Windfarm Limited. The funder was not involved in the study design, collection, analysis, interpretation of data, the writing of this article, or the decision to submit it for publication.
All claims expressed in this article are solely those of the authors and do not necessarily represent those of their affiliated organizations, or those of the publisher, the editors and the reviewers. Any product that may be evaluated in this article, or claim that may be made by its manufacturer, is not guaranteed or endorsed by the publisher.
APEM. (2022). Hornsea Project Four: Gannet Displacement and Mortality Evidence Review, Microsoft Word - G2.9 Gannet Displacement and Mortality Review cover page (07673133_A).docx (planninginspectorate.gov.uk). https://infrastructure.planninginspectorate.gov.uk/wp-content/ipc/uploads/projects/EN010098/EN010098-001144-Hornsea%20Project%20Four%20-%20Other-%20G2.9%20Gannet%20Displacement%20and%20Mortality%20Evidence%20Review.pdf.
Bowgen K., Cook A. (2018). Bird Collision Avoidance: Empirical evidence and impact assessments (Peterborough: JNCC Report No. 614, JNCC).
Buckingham L., Daunt F., Bogdanova M. I., Furness R. W., Bennett S., Duckworth J., et al. (2023). Energetic synchrony throughout the non-breeding season in common guillemots from four colonies. J. Avian Biol. 2023, (1–2). doi: 10.1111/jav.03018
Burke C. M., Montevecchi W. A. (2018). Taking the bite out of winter: common murres Uria aalge push their dive limits to surmount energy constraints. Front. Mar. Sci. 5, e00063. doi: 10.3389/fmars.2018.00063
Burnell D., Perkins A. J., Newton S. F., Bolton M., Tierney T. D., Dunn T. E. (2023). Seabirds Count: a census of breeding seabirds in Britain and Ireland, (2015 – 2021) (Barcelona: Lynx Nature Books).
Canning S., Lye G., Kerr D. (2013). Analysis of Marine Ecology Monitoring Plan Data from the Robin Rigg Offshore Wind Farm, Scotland (Operational Year 3) – Birds (Dalry: Natural Power Consultants).
Cook A. S. C. P., Humphreys E. M., Bennet F., Masden E. A., Burton N. H. K. (2018). Quantifying avian avoidance of offshore wind turbines: current evidence and key knowledge gaps. Mar. Environ. Res. 140, 278–288. doi: 10.1016/j.marenvres.2018.06.017
Cook A. S. C. P., Humphreys E. M., Masden E. A., Burton N. H. K. (2014). The avoidance rates of collision between birds and offshore turbines. Scottish Mar. Freshw. Sci. 5.
Cury P. M., Boyd I. L., Bonhommeau S., Anker-Nilssen T., Crawford R. J. M., Furness R. W., et al. (2011). Global seabird response to forage fish depletion – one-third for the birds. Science 334, 1703–1706. doi: 10.1126/science.1212928
Dierschke V., Furness R. W., Garthe S. (2016). Seabirds and offshore wind farms in European waters: Avoidance and attraction. Biol. Conserv. 202, 59–68. doi: 10.1016/j.biocon.2016.08.016
Dierschke V., Furness R. W., Gray C. E., Petersen I. K., Schmutz J., Zydelis R., et al. (2017). Possible Behavioural, Energetic and Demographic Effects of Displacement of Red-throated Divers (Peterborough: JNCC Report No. 605. JNCC).
Drewitt A. L., Langston R. H. (2006). Assessing the impacts of wind farms on birds. Ibis 148, 29–42. doi: 10.1111/j.1474-919X.2006.00516.x
Duckworth J., O’Brien S., Petersen I. K., Petersen A., Benediktsson G., Johnson L., et al. (2021). Spatial and temporal variation in foraging of breeding red-throated divers. J. Avian Biol. 52. doi: 10.1111/jav.02702
Dunn R. E., Wanless S., Daunt F., Harris M. P., Green J. A. (2020). A year in the life of a North Atlantic seabird: behavioural and energetic adjustments during the annual cycle. Sci. Rep. 10, 5993. doi: 10.1038/s41598-020-62842-x
Fauchald P., Erikstad K. E., Skarsfjord H. (2000). Scale-dependent predator-prey interactions: The hierarchical spatial distribution of seabirds and prey. Ecology 81, 773–783.
Furness R. W., Wade H. M., Masden E. A. (2013). Assessing vulnerability of marine bird populations to offshore wind farms. J. Environ. Manage. 119, 56–66. doi: 10.1016/j.jenvman.2013.01.025
Garthe S., Schwemmer H., Peschko V., Markones N., Müller S., Schwemmer P., et al. (2023). Large-scale effects of offshore wind farms on seabirds of high conservation concern. Sci. Rep. 13, 4779. doi: 10.1038/s41598-023-31601-z
Green R. H. (1979). Sampling Design and Statistical Methods for Environmental Biologists (New York, NY: John Wiley and Sons).
Heinänen S., Žydelis R., Kleinschmidt B., Dorsch M., Burger C., Morkūnas J., et al. (2020). Satellite telemetry and digital aerial surveys show strong displacement of Red-throated Divers (Gavia stellata) from offshore wind farms. Mar. Environ. Res. 160, 104989. doi: 10.1016/j.marenvres.2020.104989
HM Government. (2022). British Energy Security Strategy. Secure, clean and affordable British energy for the long term. Available online at: https://assets.publishing.service.gov.uk/media/626112c0e90e07168e3fdba3/british-energy-security-strategy-web-accessible.pdf.
Humphreys E. M., Cook A. S. C. P., Burton N. H. K. (2015). Collision, displacement and barrier effect concept note. BTO Research Report No. 669. https://www.bto.org/sites/default/files/shared_documents/publications/research-reports/2015/rr669.pdf.
JNCC. (2022). Joint SNCB Interim Displacement Advice Note, Joint SNCB Interim Displacement Advice Note (jncc.gov.uk). https://hub.jncc.gov.uk/assets/9aecb87c-80c5-4cfb-9102-39f0228dcc9a.
Johnston D. T., Thaxter C. B., Boersch-Supan P. H., Humphreys E. M., Bouten W., Clewley G. D., et al. (2022). Investigating avoidance and attraction responses in lesser black-backed gulls Larus fuscus to offshore wind farms. Mar. Ecol. Prog. Ser. 686, 187–200. doi: 10.3354/meps13964
Krijgsveld K., Fljn R., Japink M., van Horssen P., Heunks C., Collier M., et al. (2011). Effect Studies Offshore Wind Farm Egmond aan Zee - Final Report on Fluxes, Flight Altitudes and Behaviour of Flying Birds (Report No. OWEZ_R_231_T1_20111114_flux&flight). Report by Bureau Waardenburg. https://www.researchgate.net/publication/260591425_Effect_Studies_Offshore_Wind_Farm_Egmond_aan_Zee_Final_report_on_fluxes_flight_altitudes_and_behaviour_of_flying_birds.
Leopold M. F. (2018). Common Guillemots and offshore wind farms: an ecological discussion of statistical analyses conducted by Alain Zuur (WOZEP Birds-1) (Wageningen Marine Research (University & Research centre), Wageningen Marine Research report C093/18: Wageningen).
Leopold M. F., van Bemmelen R. S. A., Zuur A. F. (2013). Responses of local birds to the offshore wind farms PAWP and OWEZ off the Dutch mainland coast. Report C151:12 (Wageningen: Imares).
MacArthur Green. (2023). Beatrice Offshore Wind Farm: Year 2 Post-construction Ornithological Monitoring Report. MFRAG - Ornithology - Beatrice Offshore Windfarm - Post-construction Ornithological Monitoring Report (Year 2) (Marine Scotland Information). https://marine.gov.scot/sites/default/files/bowl_2021_post_construction_ornithology_monitoring_report_25_07_2023.pdf.
Masden E. A., Haydon D. T., Fox A. D., Furness R. W. (2010). Barriers to movement: Modelling energetic costs of avoiding marine wind farms amongst breeding seabirds. Mar. pollut. Bull. 60, 1085–1091. doi: 10.1016/j.marpolbul.2010.01.016
Mendel B., Kotzerka J., Sommerfeld J., Schwemmer H., Sonntag N., Garthe S. (2014). Effects of the alpha ventus offshore test site on distribution patterns, behaviour and flight heights of seabirds. Federal Maritime and Hydrographic Agency & Federal Ministry for the Environment, Nature Conservation and Nuclear Safety (Hrsg.): Ecological Research at the Offshore Windfarm alpha ventus (Wiesbaden: Springer), 95–110.
Mendel B., Schwemmer P., Peschko V., Müller S., Schwemmer H., Mercker M., et al. (2019). Operational offshore wind farms and associated ship traffic cause profound changes in distribution patterns of Loons (Gavia spp.). J. Environ. Manage. 231, 429–438. doi: 10.1016/j.jenvman.2018.10.053
NatureScot. (2023). Guidance Note 8: Guidance to support Offshore Wind Applications: Marine Ornithology Advice for assessing the distributional responses, displacement and barrier effects of Marine birds. Guidance Note 8: Guidance to support Offshore Wind Applications: Marine Ornithology Advice for assessing the distributional responses, displacement and barrier effects of Marine birds (NatureScot). https://www.nature.scot/doc/guidance-note-8-guidance-support-offshore-wind-applications-marine-ornithology-advice-assessing.
OSPAR. (2023). The 2023 Quality Status Report for the Northeast Atlantic (London: OSPAR Commission). Quality Status Report 2023 | OSPAR Commission.
Ozsanlav-Harris L., Inger R., Sherley R. (2023) Review of data used to calculate avoidance rates for collision risk modelling of seabirds. JNCC Report 732 (Research & review report) (Peterborough: JNCC). Available online at: https://hub.jncc.gov.uk/assets/de5903fe-81c5-4a37-a5bc-387cf704924d (Accessed 01/05/2023).
Parker J., Fawcett A., Banks A., Rowson T., Allen S., Rowell H., et al. (2022). Offshore Wind Marine Environmental Assessments: Best Practice Advice for Evidence and Data Standards. Phase III: Expectations for data analysis and presentation at examination for offshore wind applications. Natural Engl. 140 pp.
Pavat D., Harker A. J., Humphries G., Keogan K., Webb A., Macleod K. (2023). Consideration of avoidance behaviour of northern gannet (Morus bassanus) in collision risk modelling for offshore wind farm impact assessments. Natural Engl. NECR490.
Percival S. (2013). Thanet Offshore Wind Farm Ornithological Monitoring 2012–2013 (Vattenfall & Royal Haskoning).
Peschko V., Mercker M., Garthe S. (2020). Telemetry reveals strong effects of offshore wind farms on behaviour and habitat use of common guillemots (Uria aalge) during the breeding season. Mar. Biol. 167, 118. doi: 10.1007/s00227-020-03735-5
Petersen I. K., Christensen T. K., Kahlert J., Desholm M., Fox A. D. (2006). Final results of bird studies at the offshore wind farms at Nysted and Horns Rev, Denmark. Commissioned by DONG energy and Vattenfall A/S.
Petersen I. K., Clausager I., Christensen T. J. (2004). Bird numbers and distribution on the Horns Rev Offshore Wind Farm Area. Annual Status Report 2003. Report commissioned by Elsam Engineering A/S 2003 (Rønde, Denmark: National Environmental Research Institute).
Scott-Hayward L. A. S., Oedekoven C. S., Mackenzie M. L., Walker C. G., Rexstad. E. (2013). User Guide for the Mrsea Package V0.1.2: Statistical Modelling of Bird and Cetacean Distributions in Offshore Renewables Development Areas (University of St. Andrews Contract for Marine Scotland). Available at: https://lindesaysh.github.io/MRSea/articles/. Sb9 (Cr/2012/05). University of St Andrews.
Searle K., Butler A., Mobbs D., Trinder M., McGregor R., Cook A., et al. (2020). Study to Examine how Seabird Collision Risk, Displacement and Barrier Effects Could be Integrated for Assessment of Offshore Wind Developments (Marine Scotland Science). https://tethys.pnnl.gov/sites/default/files/publications/Searle-et-al-2022_0.pdf.
Searle K. R., Mobbs D. C., Butler A., Furness R. F., Trinder M. N., Daunt F. (2018). Finding out the fate of displaced birds. Scottish Mar. Freshw. Sci. 9. 149pp.
Skov H., Heinänen S., Norman T., Ward R. M., Méndez-Roldán S., Ellis I. (2018). ORJIP Bird Collision and Avoidance Study. Final report – April 2018 (United Kingdom: The Carbon Trust). 247 pp.
Stanbury A., Thomas S., Aegerter J., Brown A., Bullock D., Eaton M., et al. (2017). Priotitising islands in the United Kingdom and crown dependencies for the eradication of invasive alien vertebrates and rodent biosecurity. Eur. J. Wildl. Res. 63, 31. doi: 10.1007/s10344-017-1084-7
Tjørnløv R. S., Skov H., Armitage M., Barker M., Jørgensen J. B., Mortensen L. O., et al. (2023). Resolving Key Uncertainties of Seabird Flight and Avoidance Behaviours at Offshore Wind Farms. Final Report for the study period 2020-2021. Report by Danish Hydraulic Institute (DHI). Report for Vattenfall. https://group.vattenfall.com/uk/contentassets/1b23f720f2694bd1906c007effe2c85a/aowfl_aberdeen_seabird_study_final_report_20_february_2023.pdf.
Vanermen N., Courtens W., Van de Walle M., Verstraete H., Stienen E. W. M. (2016). Seabird monitoring at offshore wind farms in the Belgian part of the North Sea - Updated results for the Bligh Bank & first results for the Thorntonbank. Rapporten van het Instituut voor Natuur- en Bosonderzoek 2016 (INBO.R.2016.11861538) (Brussel: Instituut voor Natuur- en Bosonderzoek).
Vanermen N., Onkelinx T., Courtens W., Verstaete H., Stienen E. W. M. (2014). Seabird avoidance and attraction at an offshore wind farm in the Belgian part of the North Sea. Hydrobiologia 756, 51–61. doi: 10.1007/s10750-014-2088-x
Vilela R., Burger C., Diederichs A., Bachl F. E., Szostek L., Freund A., et al. (2021). Use of an INLA latent gaussian modeling approach to assess bird population changes due to the development of offshore wind farms. Front. Mar. Sci. 8. doi: 10.3389/fmars.2021.701332
Waggitt J. J., Evans P. G. H., Andrade J., Banks A.N., Boisseau O., Bolton M. (2019). Distribution maps of cetacean and seabird populations in the North-East Atlantic. J. Appl. Ecol. 57, 253–269. doi: 10.1111/1365-2664.13525
Wakefield E. D., Phillips R. A., Matthiopoulos J. (2009). Quantifying habitat use and preferences of pelagic seabirds using individual movement data: a review. Mar. Ecol. Prog. Ser. 391, 165–182. doi: 10.3354/meps08203
Warwick-Evans V., Atkinson P. W., Wakington I., Green J. A. (2017). Predicting the impacts of wind farms on seabirds: An individual-based model. J. Appl. Ecol. 55, 503–515.
Welcker J., Nehls G. (2016). Displacement of seabirds by an offshore wind farm in the North Sea. Mar. Ecol. Prog. Ser. 554, 173–182. doi: 10.3354/meps11812
Zuur A. F. (2018). Effects of wind farms on the spatial distribution of guillemots. Unpublished report Vol. 31 (Wageningen Marine Research T), 317. https://www.google.com/url?sa=t&source=web&rct=j&opi=89978449&url=https://www.noordzeeloket.nl/publish/pages/161187/effects_of_wind_farms_on_the_spatial_distribution_of_guillemots.pdf&ved=2ahUKEwjytIifu5KFAxUPQkEAHXiAA_8QFnoECA8QAQ&usg=AOvVaw0wqVd59G2hQF-xmYZUiTPT.
Keywords: displacement, meso-avoidance, environmental impact assessment, monitoring, seabirds
Citation: Trinder M, O’Brien SH and Deimel J (2024) A new method for quantifying redistribution of seabirds within operational offshore wind farms finds no evidence of within-wind farm displacement. Front. Mar. Sci. 11:1235061. doi: 10.3389/fmars.2024.1235061
Received: 05 June 2023; Accepted: 20 March 2024;
Published: 22 April 2024.
Edited by:
Emeline Pettex, La Rochelle University - Cohabys, FranceReviewed by:
Grant Humphries, Stony Brook University, United StatesCopyright © 2024 Trinder, O’Brien and Deimel. This is an open-access article distributed under the terms of the Creative Commons Attribution License (CC BY). The use, distribution or reproduction in other forums is permitted, provided the original author(s) and the copyright owner(s) are credited and that the original publication in this journal is cited, in accordance with accepted academic practice. No use, distribution or reproduction is permitted which does not comply with these terms.
*Correspondence: Mark Trinder, bWFyay50cmluZGVyQG1hY2FydGh1cmdyZWVuLmNvbQ==
Disclaimer: All claims expressed in this article are solely those of the authors and do not necessarily represent those of their affiliated organizations, or those of the publisher, the editors and the reviewers. Any product that may be evaluated in this article or claim that may be made by its manufacturer is not guaranteed or endorsed by the publisher.
Research integrity at Frontiers
Learn more about the work of our research integrity team to safeguard the quality of each article we publish.