- 1Oceans Department, Hopkins Marine Station, Stanford University, Pacific Grove, CA, United States
- 2Institute of Marine Sciences, University of California, Santa Cruz, Santa Cruz, CA, United States
- 3Independent Researcher, Seaside, CA, United States
- 4Monterey Bay Aquarium Research Institute, Moss Landing, CA, United States
The energetic content of primary and secondary consumers is central to understanding ecosystem functioning, community assembly, and trophodynamics. However, these foundational data are often limited, especially for marine ecosystems. Here we report the energy densities of important prey species in the California Current Ecosystem. We investigated variation in energy density within and between species and explored potential underlying causes of these differences. Northern anchovy (Engraulis mordax) is the most energy dense of the species analyzed with a median value nearly twice as high as was found in krill (Euphausia pacifica and Thysanoessa spinifera). Relationships with body size varied among species; krill energy density increased, with both length and wet weight. In addition, we find that anchovy, sardine (Sardinops sagax), and market squid (Doryteuthis opalescens) have higher energy content in the summer and fall as compared to the spring. This aligns with the ecosystem phenology of strong upwelling during spring (March – May) driving high primary productivity, followed by widespread predator presence through the summer and fall (June – October). Our results inform food web studies in the California Current and suggest new avenues for investigating differences in species and ecosystem energetics in an era of rapid global change.
Introduction
Understanding the flow of energy from prey to predators gives insight into ecosystem production and functioning in that the energy available at the lowest trophic levels limits potential production at higher trophic levels (Paine, 1972). The energetic content of prey species themselves is also likely to vary based on seasonality, sex, ontogeny, and other factors. Together with trophic efficiency, based on energy loss as it transfers up trophic levels, these fundamental parameters mediate the proportion of that energy that ultimately supports predator populations and thus overall food web structure and productivity (Eddy et al., 2021). Despite the importance of these fundamental data, the energy content of prey species (primary and secondary consumers) remains poorly understood, particularly in marine ecosystems that are undergoing rapid environmental change. It is well established that energy density within food webs is influenced by environmental conditions. In the North Pacific, for example, the marine heatwave in 2015 and 2016 resulted in smaller krill (Robertson and Bjorkstedt, 2020), which may lead to lower energetic quality. Similarly, the 2015-2016 heatwave caused a decline in nutritional quality of Pacific sand lance (Ammodytes personatus), a forage fish species, in Prince William Sound, Alaska (Von Biela et al., 2019).
The California Current Large Marine Ecosystem (CCLME) is a highly productive ecosystem along the west coast of North America where wind-driven, coastal upwelling brings nutrient-rich deep waters to the surface. These physical forcings in the spring underlie strong primary production in the late spring and summer, which are the basis for a rich and biodiverse ecosystem (Checkley and Barth, 2009). The CCLME supports commercial fisheries and a robust ecotourism industry focused on resident and migratory predators, including fish, seabirds, and marine mammals, all of which rely on the prey from this ecosystem. Several studies have reported the energy densities of similar species in other ecosystems (Mr°rtensson et al., 1996; Davis et al., 1998; Abraham and Sydeman, 2006; Tirelli et al., 2006; Dubreuil and Petitgas, 2009; Färber-Lorda et al., 2009; Sánchez et al., 2013; Albo-Puigserver et al., 2017; Chenowith, 2018); however, there has been little published work on important prey species in the CCLME. Without these data it is challenging to develop bioenergetic models for this ecosystem (Dawson et al., 2020; Lawson et al., 2021).
Euphausiids (Euphausia pacifica and Thysanoessa spinifera; hereafter ‘krill’), northern anchovy (Engraulis mordax; hereafter ‘anchovy’), Pacific sardine (Sardinops sagax; hereafter ‘sardine’), and market squid (Doryteuthis opalescens) are fundamental prey for predators including large fish, seabirds, and marine mammals throughout the CCLME (Szoboszlai et al., 2015). In addition, krill are key prey for anchovy, sardine, and market squid. Several predators in the CCLME specialize in krill including Cassin’s auklet (Ptychoramphus aleuticus) and blue whale (Balaenoptera musculus); krill are also important prey for several species targeted by regional commercial and recreational fisheries, including Chinook salmon (Oncorhynchus tshawytscha) and anchovy (Miller et al., 2010). Forage fish, such as anchovy and sardine, are vital mid-trophic links between the base of the food web and top predators. Furthermore, the recent cultural history of some regions of the CCLME, like Monterey Bay, is inextricably linked to these forage fish and the canneries that operated in the 20th-century to harvest them (Palumbi and Sotka, 2011). Market squid comprise Monterey Bay’s largest modern fishery by landings and are important mesopelagic prey for various predatory fish, toothed whales, and seabirds (Vojkovich, 1998; Szoboszlai et al., 2015; Wells et al., 2017; Thompson et al., 2019). Here, we measured the energetic content of krill, anchovy, sardine, and market squid from late spring through early fall in the CCLME. A better understanding of the energetics of these key prey species will provide useful data for fisheries, ecosystem ecology, and understanding responses of foodwebs in the CCLME to environmental change.
Methods
Sample collection
Krill samples were collected by the National Oceanic and Atmospheric Administration’s (NOAA) Rockfish Recruitment and Ecosystem Assessment Survey (RREAS) in April and May of 2021, and separately in July of 2022 under State of California – Department of Fish and Wildlife SCIENTIFIC COLLECTING PERMIT S-210680001-21162-002 (Figure 1). Collected krill were grouped and frozen together, each group (i.e., individual net tow) were considered a separate “collection” as they will be referred to hereafter. A total of 3335 krill individuals weighing 194.34g total were tested in this study.
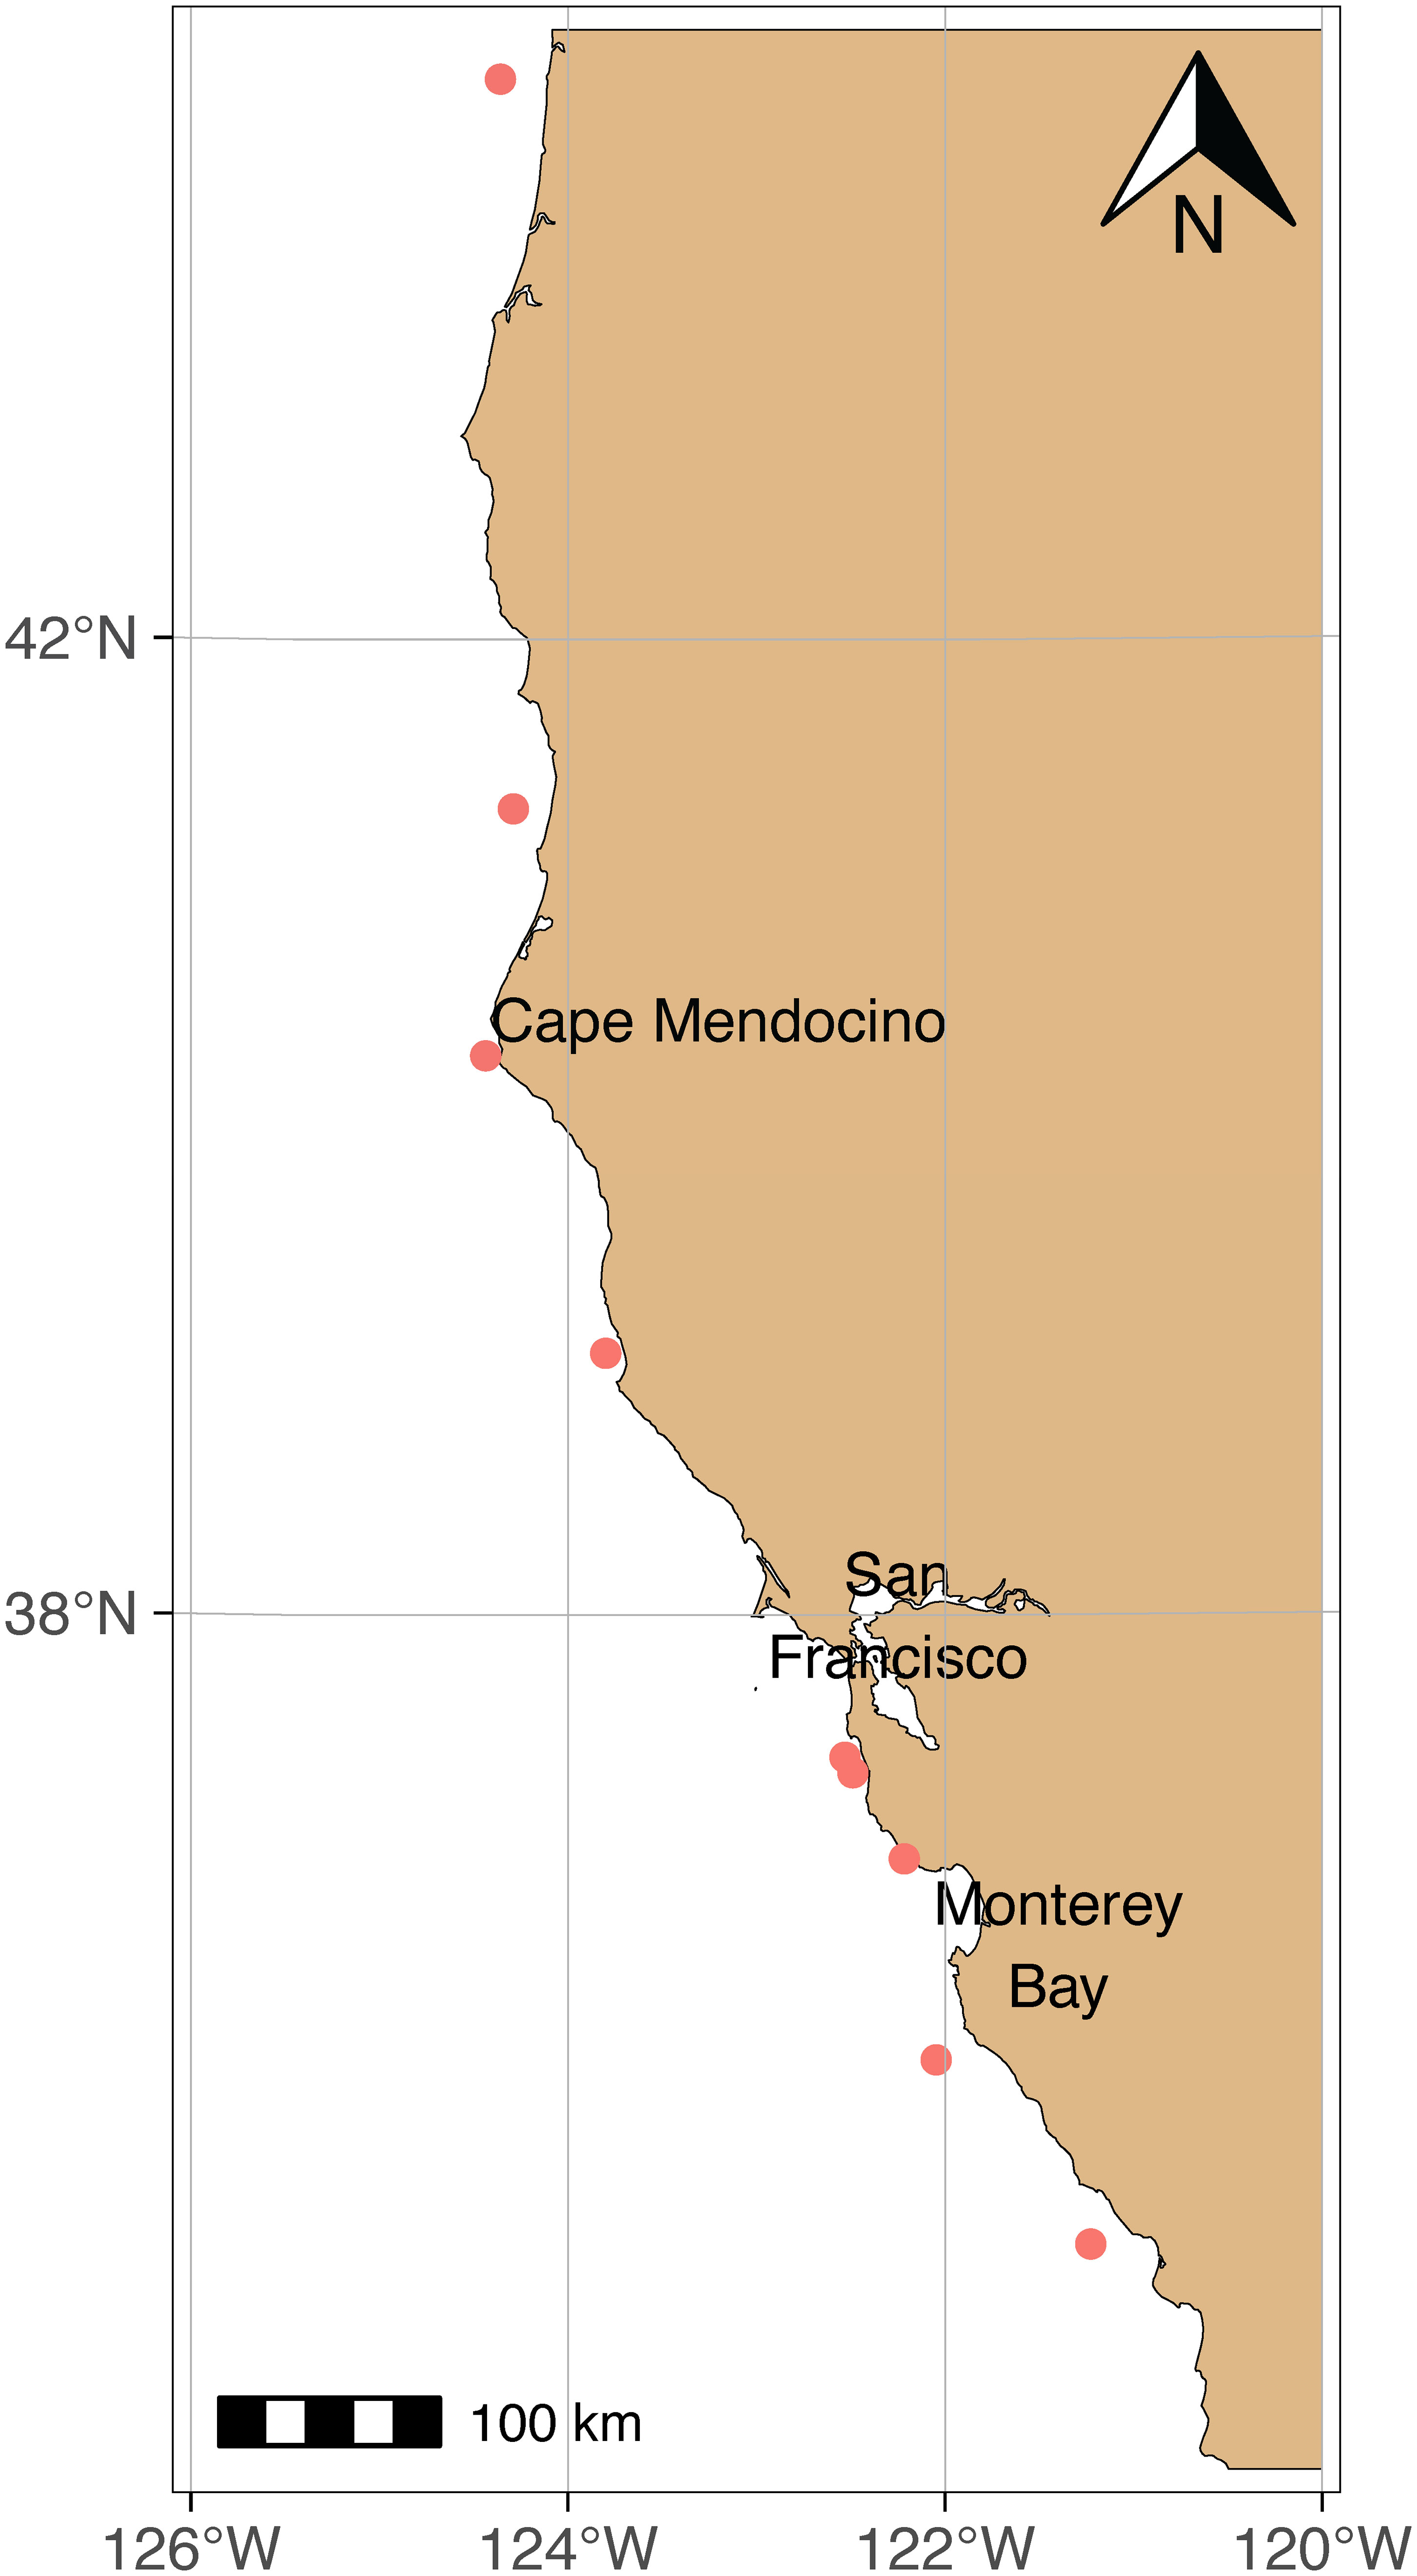
Figure 1 Map of krill collection sites. All krill were collected by NOAA’s RREAS in 2021 except for the collection site in northern Monterey Bay, which was collected in July 2022 by the authors.
Samples of anchovy (n = 50), sardine (n = 59), and market squid (n = 115) were retrieved opportunistically from commercial fishing offload sites in Moss Landing and Monterey, CA USA. Market squid were collected in 2022, anchovy were collected in 2019, 2021, and 2022, sardine were collected in 2019 and 2022; these species were all collected between May and September. They were acquired from coastal waters of the southern Monterey Bay, and are distinct by species, general location, and date. These groups are hereafter referred to as “collections”. Collections of all species were frozen and stored (approximately -20°C) until tested.
Protocol development
Energy density can be determined using various methods; calorimetry was chosen for this study as it is a common determination method in the literature, making the results easier to compare to reported values. In contrast, proximate consumption is another method commonly used in the literature which involves estimating the energy density of a biomass based on measured proportions of proteins, lipids, carbohydrates, and other energy-rich components. However, this is a more complex analytical procedure that was not required to answer our questions. Protocols for calorimetry were developed using published techniques (Paine, 1972; Davis et al., 1998; Tirelli et al., 2006; Dubreuil and Petitgas, 2009; Sánchez et al., 2013; Albo-Puigserver et al., 2017). Calorimetry requires thorough drying to ensure complete sample combustion. It is also important to minimize the volatilization of lipids and other energy-rich tissues during drying, which can occur even at low temperatures. Samples were dried in a lab oven at 60°C until near constant mass was achieved (Tirelli et al., 2006; Dubreuil and Petitgas, 2009; Sánchez et al., 2013; Albo-Puigserver et al., 2017). 60°C was chosen to minimize energy loss due to volatilization of energy-dense tissues. To determine appropriate drying times for each species, we used test samples of Antarctic krill (E. superba), Pacific sardine, and northern anchovy that were provided by the Monterey Bay Aquarium. A subset of test samples of market squid were taken from squid samples to be used for this study. Collections were removed from the freezer and allowed to thaw for one hour. At this point, it was possible to separate individuals from the larger mass of frozen samples which was returned to the freezer. After wet weight was recorded to the nearest 0.0001g using a microbalance, samples were placed in the drying oven and masses were subsequently measured every 24 hours. This process was repeated three times for krill, four times for squid, and five times for anchovy and sardine. Samples were determined to be sufficiently dry when the change in mass during a given drying period was less than 5% (Figure 2). Drying times determined by these methods were used for all subsequent experiments.
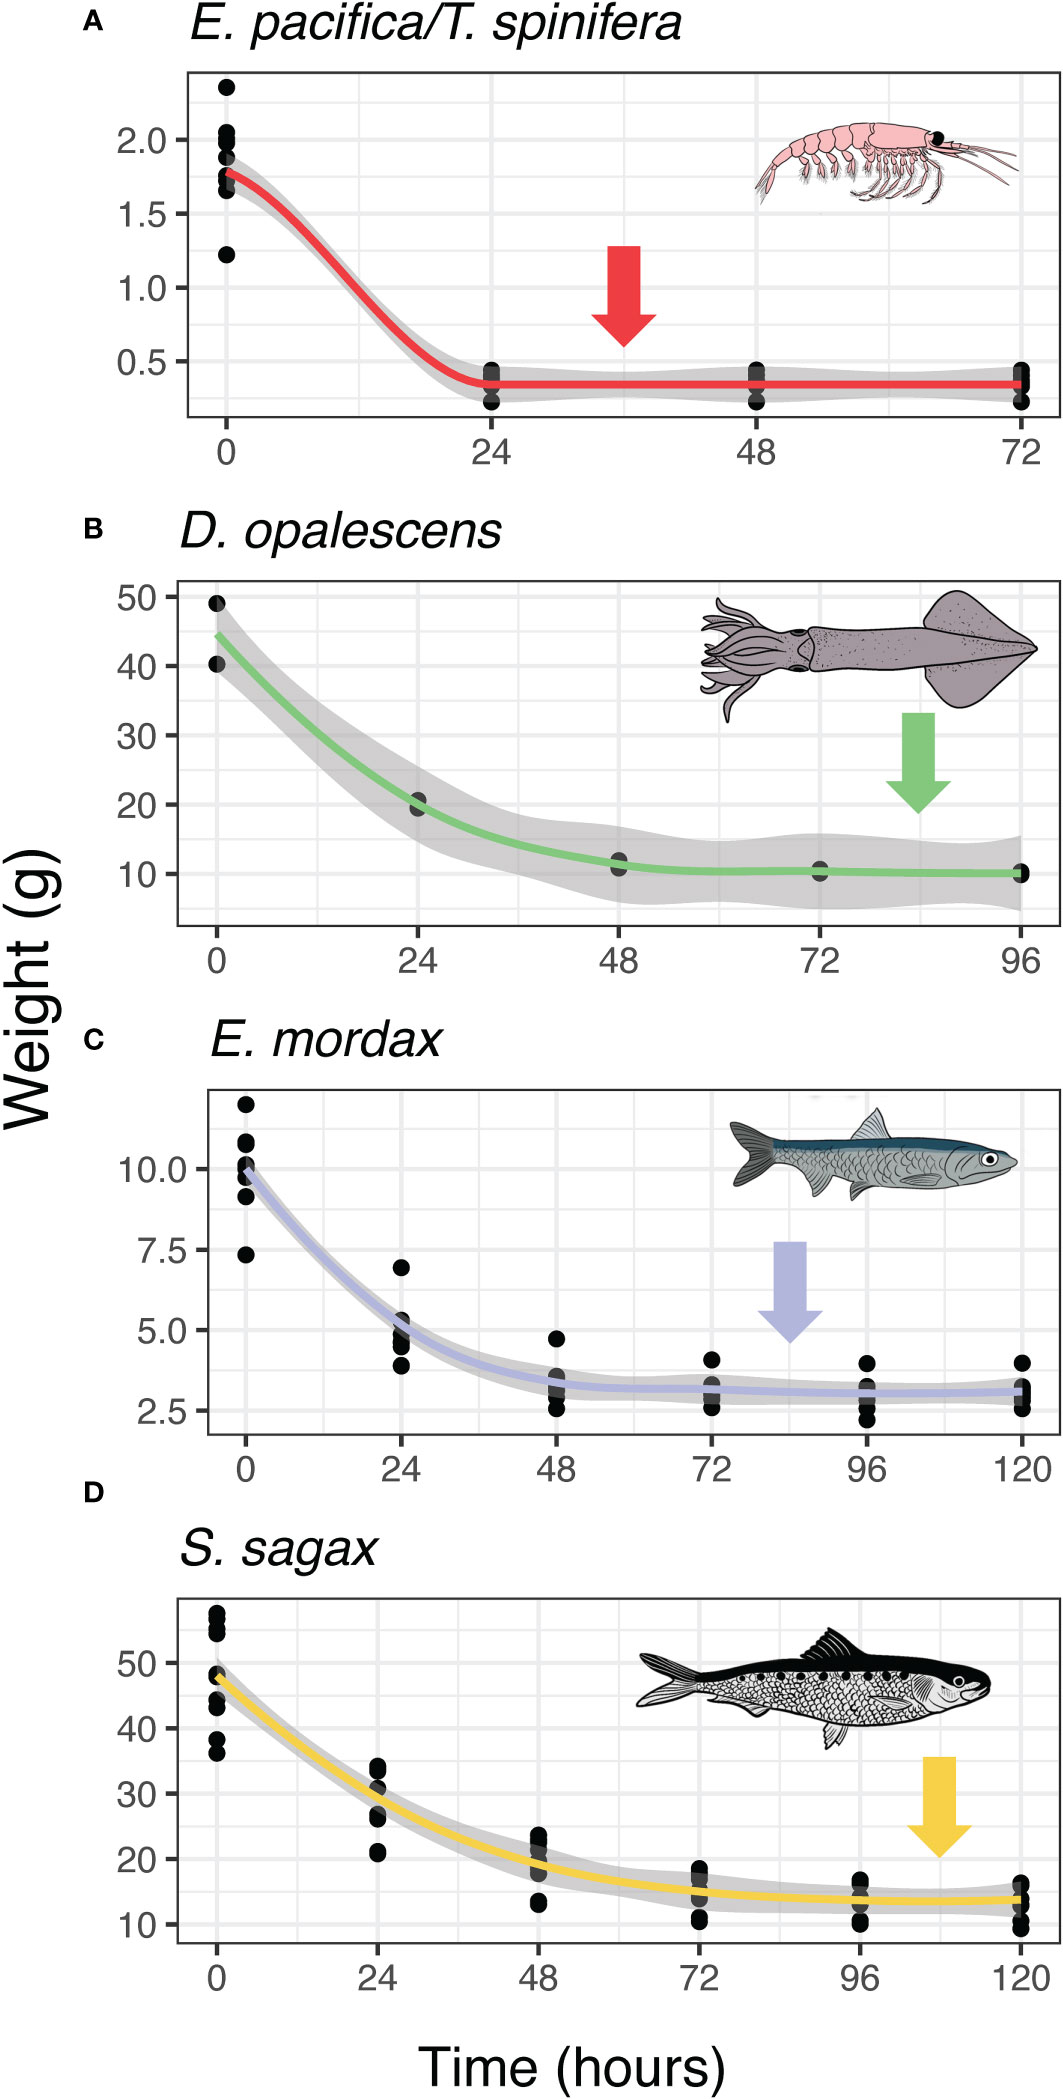
Figure 2 Drying curves for species in this study. Arrows indicate the drying period during which mass change was less than 5%. Drying time for krill (A) was 24 hours, drying time for squid (B), and anchovy (C) was 72 hours, for sardine (D) drying time was 96 hours.
Calorimetry and ash-free dry weight
Collections were removed from the freezer and allowed to thaw for one hour. Individuals were separated from the larger mass of frozen samples which were then returned to the freezer. Samples were processed separately for either calorimetry or ash-free dry weight (AFDW), as both methods are destructive. Samples were blotted and their wet weights measured. All masses were recorded to the nearest 0.0001g using the same microbalance. Krill samples consisted of between 14 and 88 individuals grouped to a target weight of 2g wet weight and remained grouped for the entirety of the experiment. Krill samples were not sorted by species and were assumed to contain both E. pacifica and T. spinifera. Fish and squid samples were whole-body samples of single individuals. Length of each sample was recorded to the nearest 0.01mm. Fish total length was measured from the tip of the snout to the tip of the tail, ensuring that the tail was pinched together during measurement (Figure 3A). Squid mantle length was measured dorsally from the posterior tip to the anterior most point of the mantle (i.e., dorsal mantle length) (Kashiwada and Recksiek, 1979). Krill length was measured from the posterior of the eye to the end of the sixth body segment (Lawson et al., 2006). Samples were placed whole in a lab oven for varying times as previously determined (Figure 3B). After drying, the dry weight of each sample was recorded. Krill remained whole for both calorimetry and AFDW analysis while fish and squid were ground to a powder to ensure even combustion using a commercial coffee grinder, which was cleaned thoroughly between samples (Figure 3C). All samples were temporarily stored in Falcon tubes.
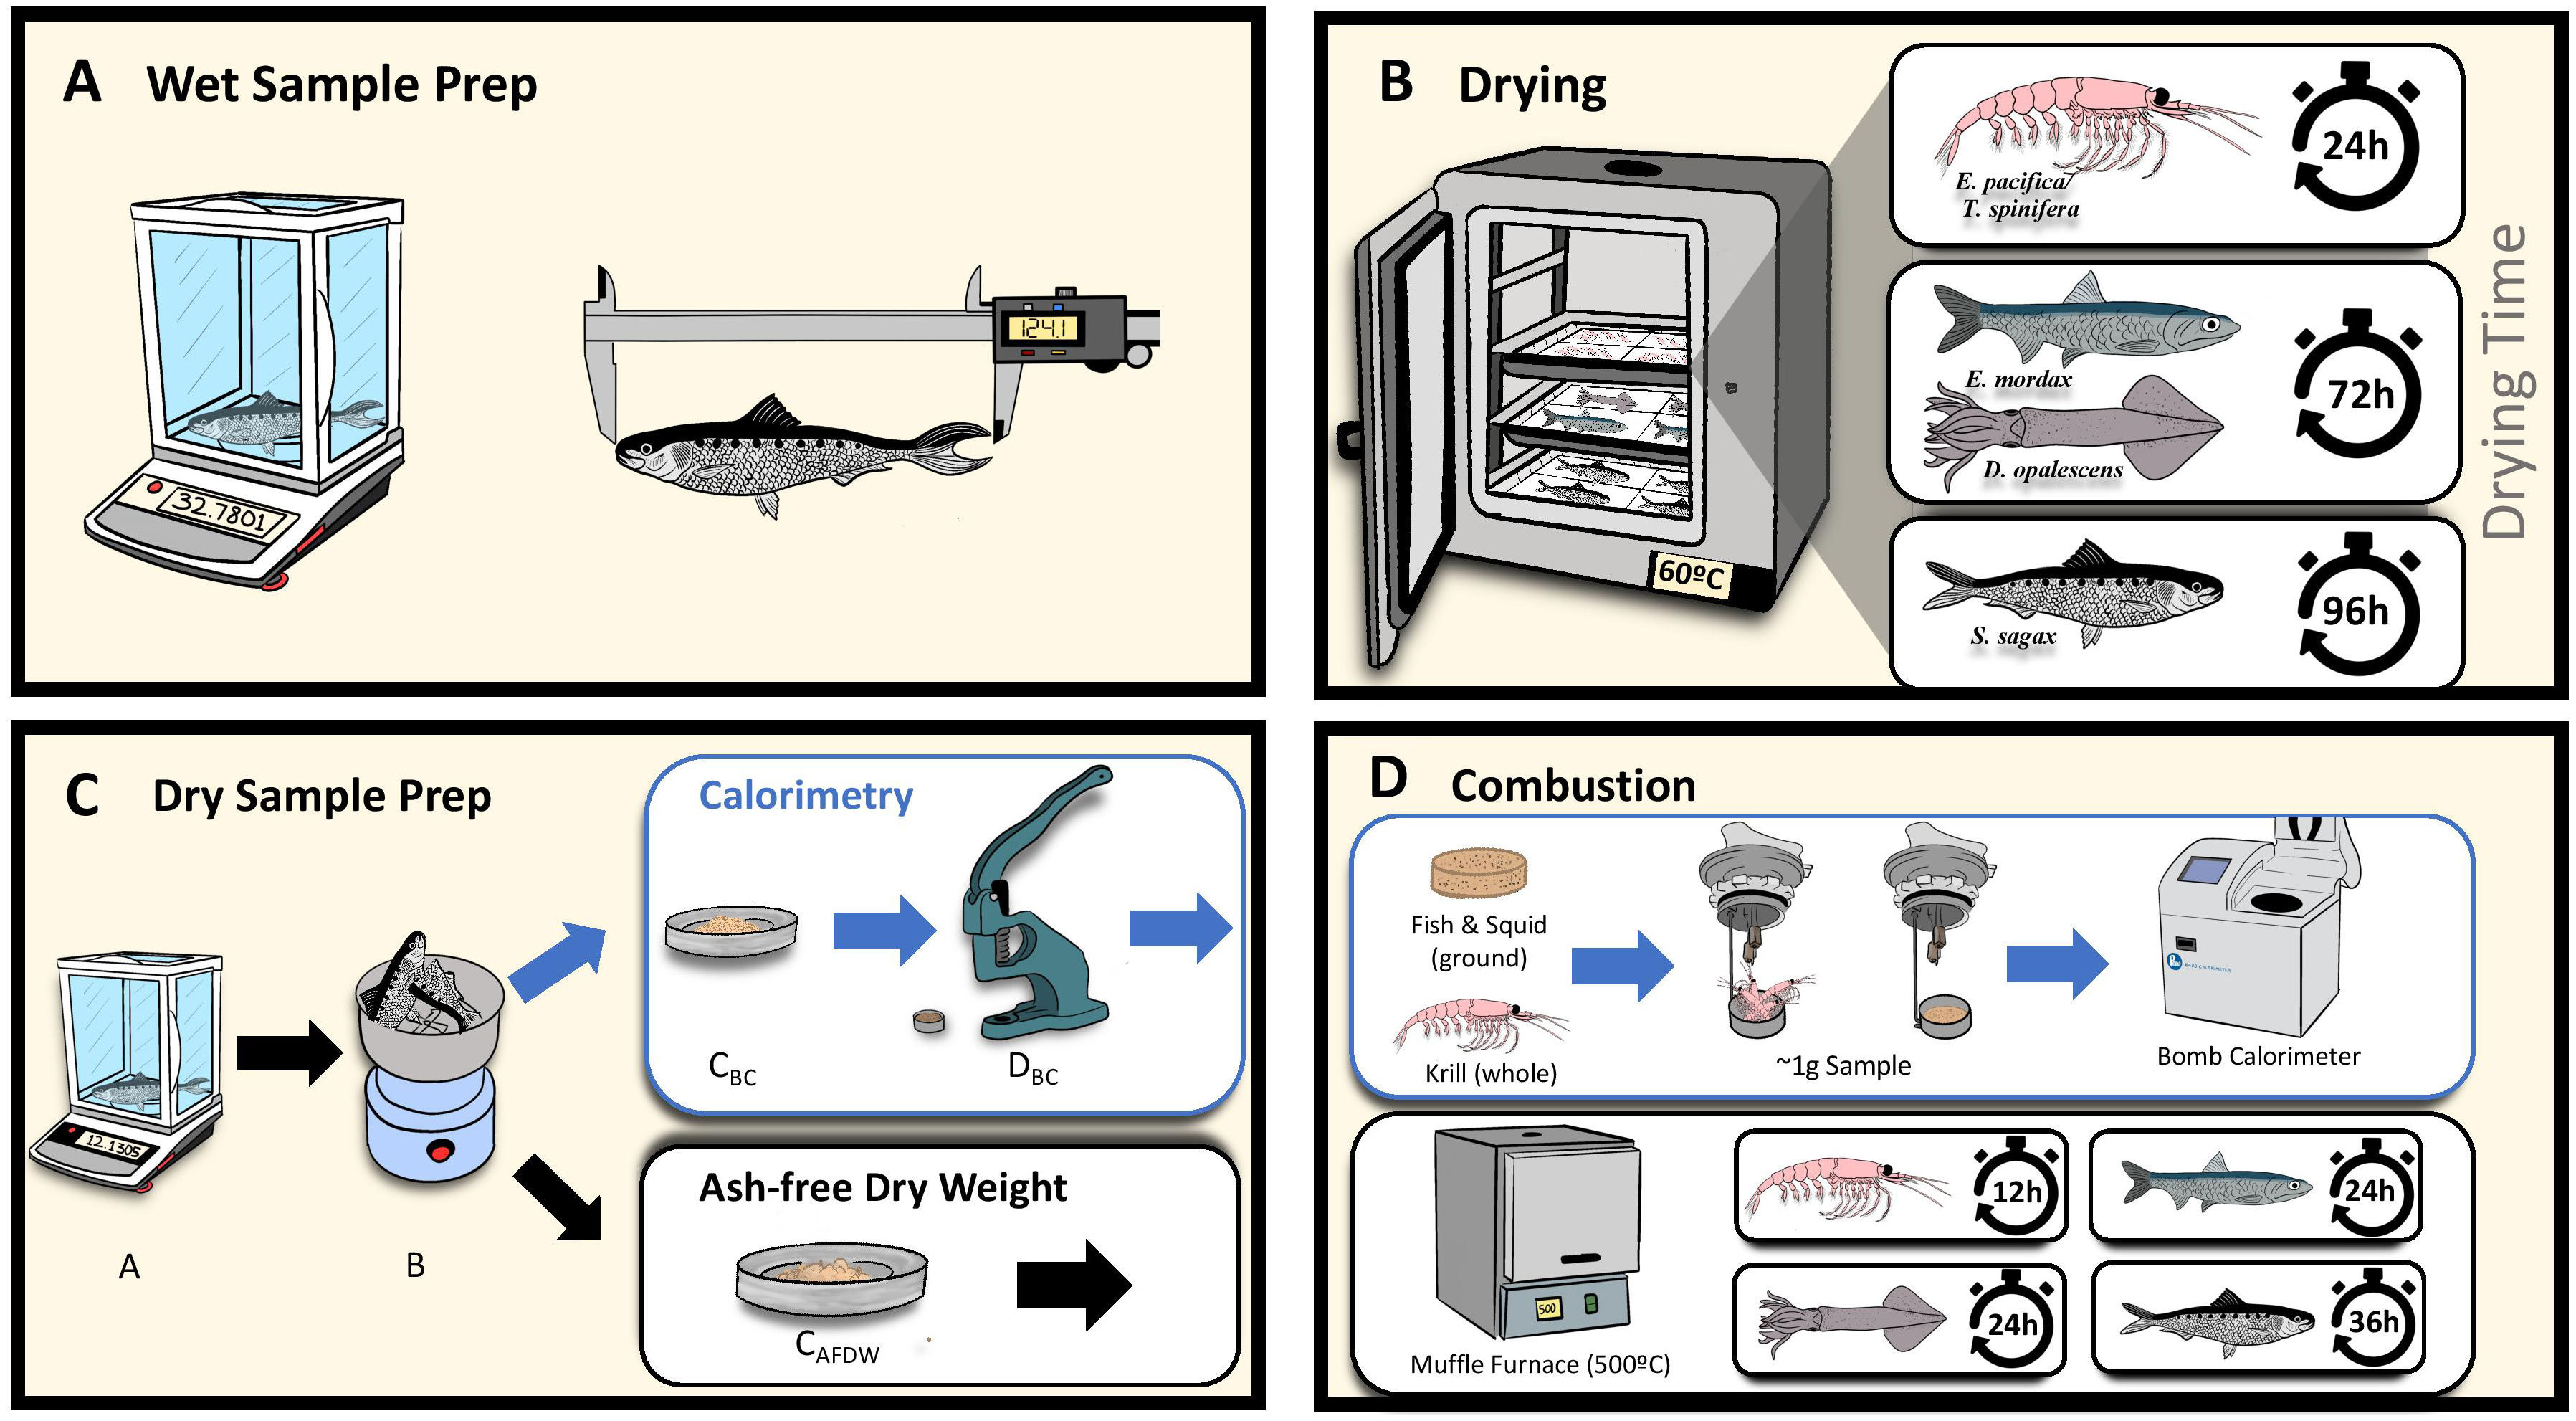
Figure 3 Experimental Workflow. (A) Wet Sample Prep: individual fish, squid, and grouped krill wet weight and lengths recorded. (B) Drying: samples dried in lab oven, time dependent on species. (C) Dry Sample Prep: sample dry weights recorded after drying. For calorimetry, fish and squid were homogenized with a grinder and compressed into ~1g sub-samples, krill remained whole. (D) Combustion: Samples combusted in calorimeter. AFDW samples placed in muffle furnace for varying time depending on species, remaining ash weighed. See methods for more details.
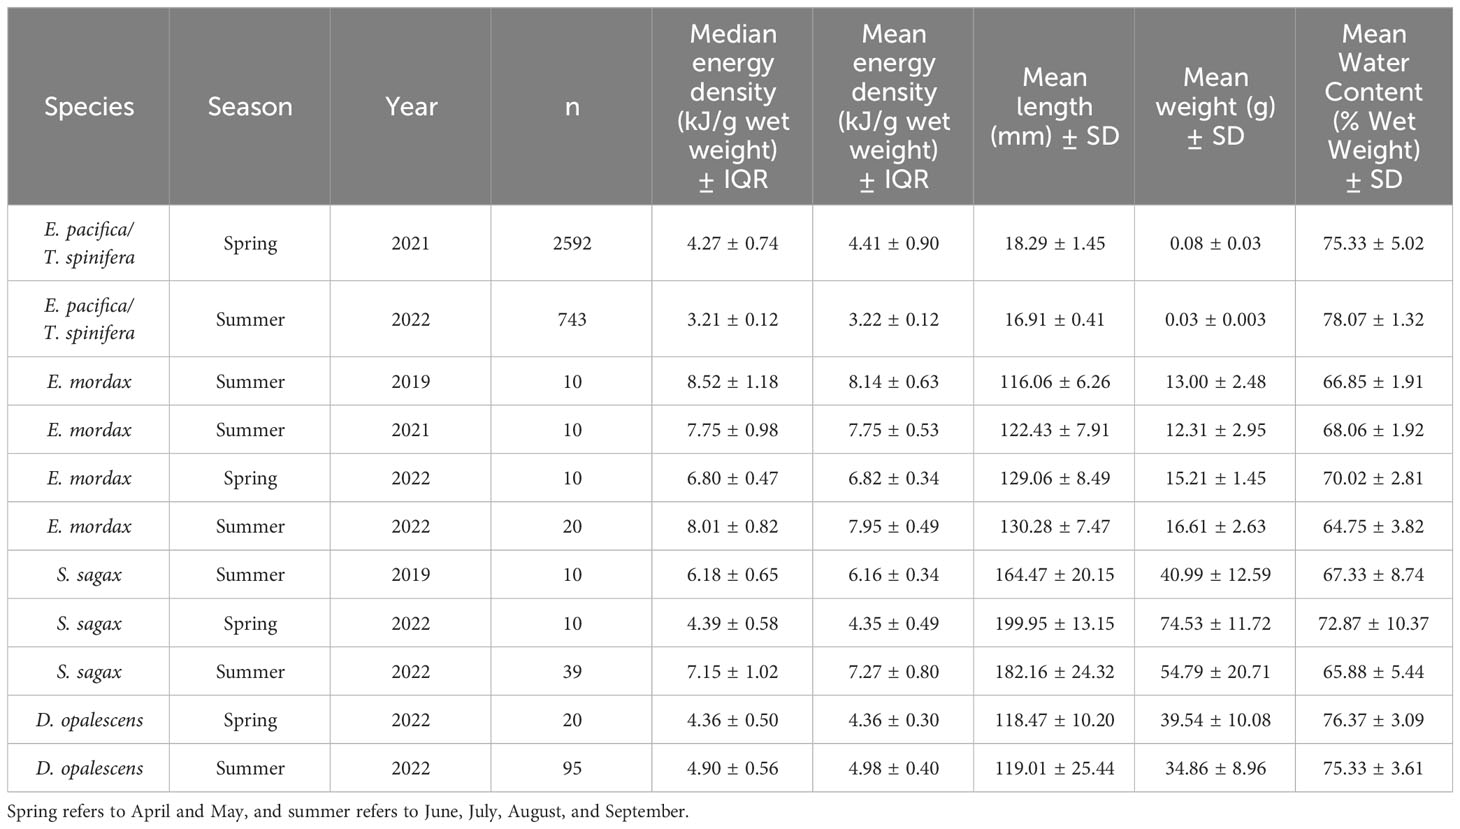
Due to small individual size and minimum mass requirements for proper combustion, krill samples were analyzed whole, and consisted of multiple dried individuals. For fish and squid, multiple ~1 g sub-samples of each dried and ground individual were compressed into pellets to ensure complete combustion. A minimum of three replicate pellets were combusted for each individual fish or squid. More pellets were combusted in cases when the reported gross heat values differed by more than 5%. Where possible, 10 samples of grouped krill, or 10 individual anchovy, sardine, and squid from each collection were analyzed. All samples were combusted in a Parr Instruments 6400 Automatic Isoperibol Calorimeter to determine gross heat. Energy densities are reported on a wet weight basis (Table 1).
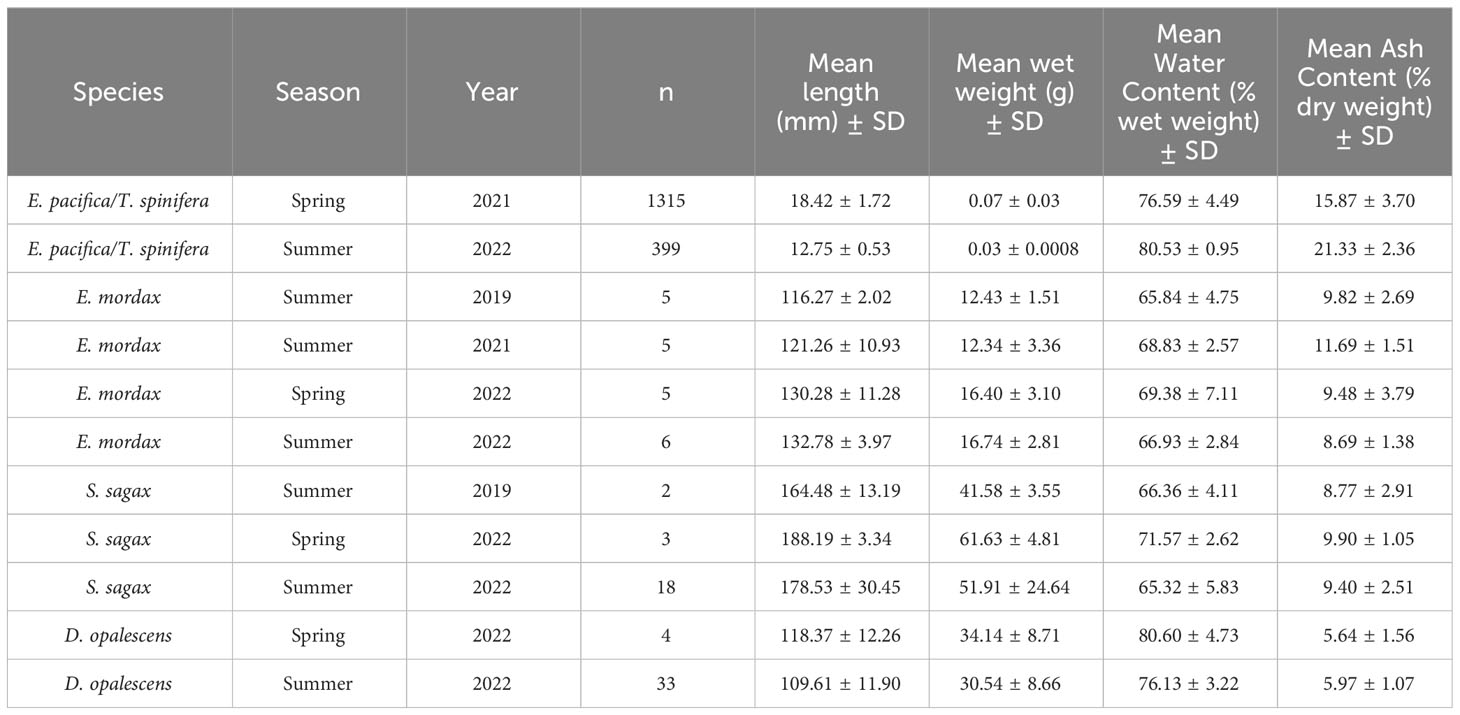
When possible, five AFDW measurements were made for each collection. Dried samples were placed into a muffle furnace at 500°C; krill were combusted for 12 hours, anchovy and squid were combusted for 24 hours, and sardine were combusted for 36 hours (Figure 3D). The resulting ash was weighed using an analytical balance and subtracted from dry weight to give AFDW. Length, wet weight, water content, and ash content of AFDW samples are reported in Table 2. Wet weight energy density (EW) was calculated using the following formula:
where G is the gross heat of the dried sample in J kg-1, xD is dry weight of the sample in g, and xW is wet weight of the sample in g Equation 1.
Statistical methods
To compare energetic differences within and between species, we used generalized linear mixed models using the package lme4 in R (Bates et al., 2014). The response variable for all models was energy density (either EW or ED), main effect predictors that were evaluated were either species, wet weight, or month. To control for pseudoreplication (Hurlbert, 1984), we used random effects of month (in models where month was not the main effect) and year to control for inter-annual differences that were not the focus of this study. Year was not able to be used in models evaluating differences in squid energy density because squid were only collected in 2022. We used the package lmerTest (Kuznetsova et al., 2017) in R to test for statistical significance between levels of the interest within the main effect variable. For analysis within species by month, we used ordinary least squares regression as there were not ecologically relevant categories for random effects. For krill individual mass estimates, we divided the total mass of the subsample prior to dying and combustion by the number of individuals in the subsample. Unless otherwise indicated, we report medians and interquartile range (IQR) as measures of central tendency.
Results
Overall, anchovy EW was 7.85 (1.62) kJ g-1, ahead of sardine 6.66 (1.75) kJ g-1, squid 4.85 (0.83) kJ g-1, and krill 4.22 (1.64) kJ g-1 (Figure 4). Anchovy has a significantly greater energy density than sardine (EW t-value = -9.76, P< 0.001; ED t-value = -19.78, P< 0.001) and squid (EW t-value = - -27.18, P< 0.001; ED t-value = -38.95, P< 0.001). Krill had the lowest energy density, less than squid, though the mean difference was< 0.5 kJ g-1(EW t-value = -14.76, P< 0.001; ED t-value = -23.72, P< 0.001).
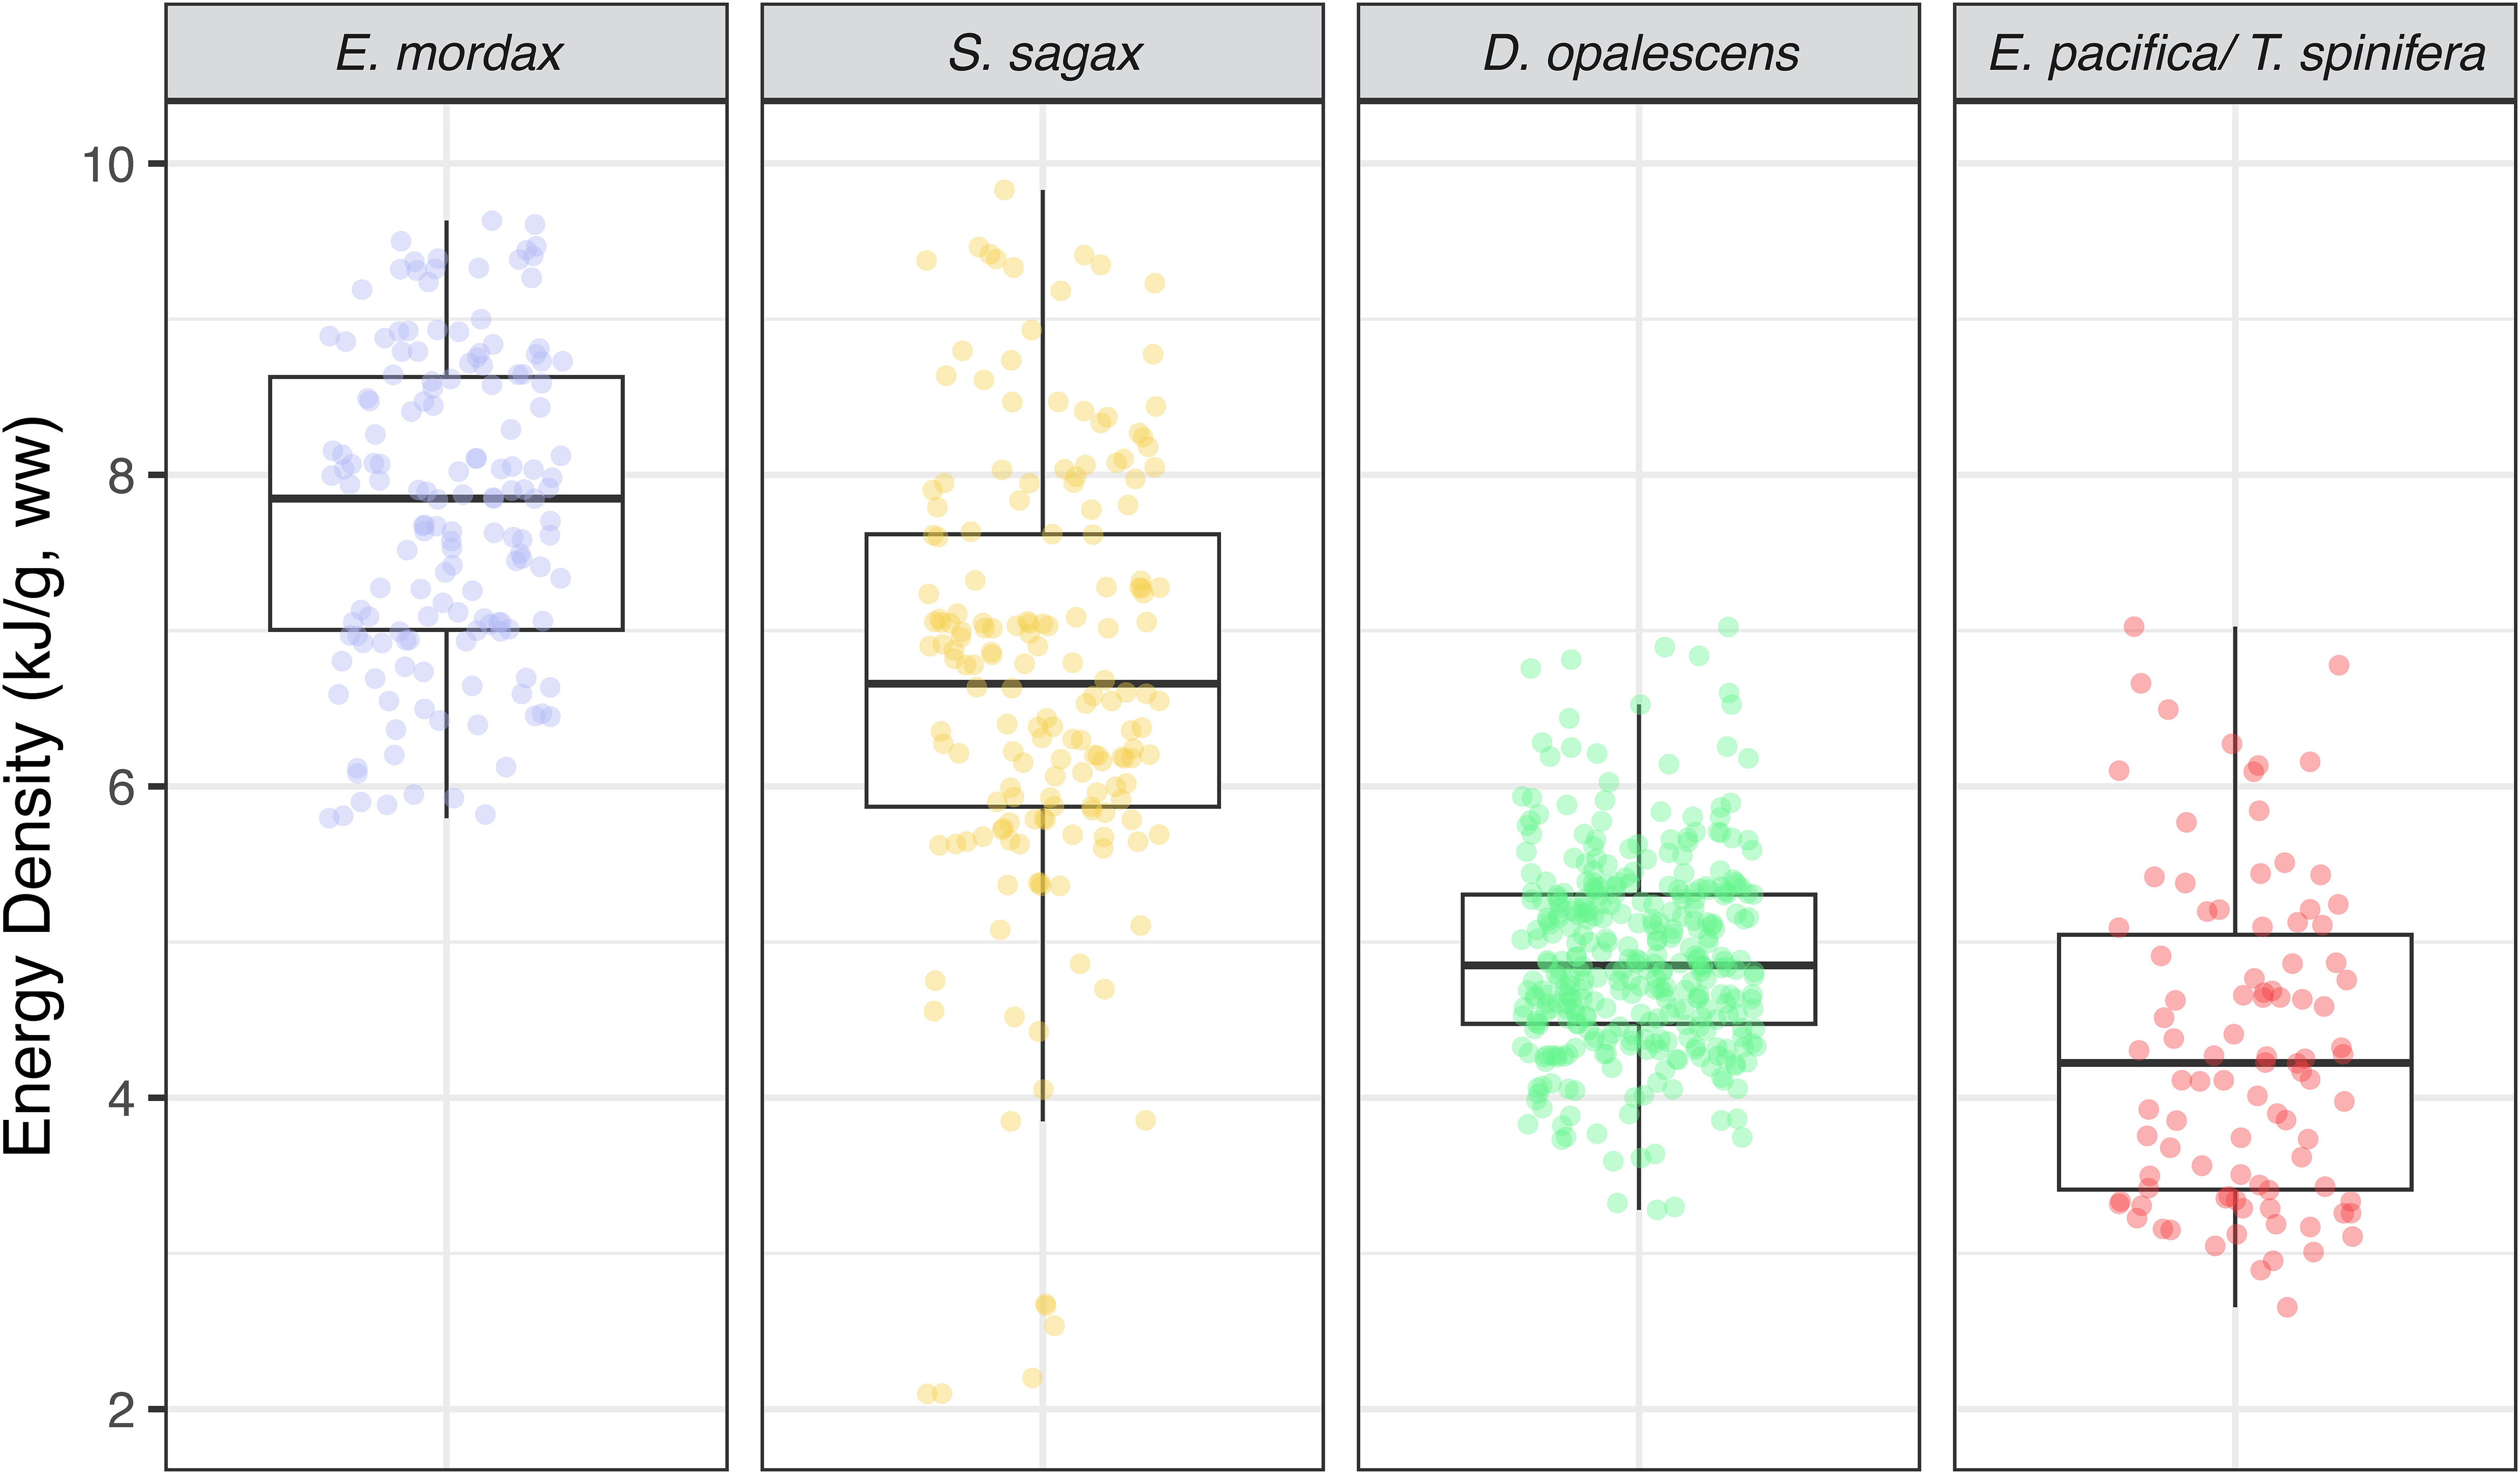
Figure 4 Energy densities (EW) of study species. Boxplots for anchovy, sardine, market squid, and krill respectively. The EW values of the forage fish are considerably higher than either market squid or krill.
Market squid showed the lowest variation in energy density, whereas the greatest variation was found in sardine (Figure 4). Sardine and anchovy reported comparable amounts of water content which tended to be lower than either krill or squid. Ash content was highest in krill and lowest in squid with sardine and anchovy ash contents being comparable. There were no significant relationships for squid energy density (EW) in relation to size (length: t-value = -1.69, P = 0.09; weight: t-value = -0.16, P = 0.87; Figure 5). The same was true of sardine (length: t-value = 0.41, P = 0.73; weight: t-value = 0.53, P = 0.60; Figure 5). Anchovy energy density showed a positive relationship with weight (t-value 5.12, P< 0.001), but no relationship with length (t-value = 1.75, P = 0.08; Figure 5). Energy density in krill showed a strong positive relationship for both length and weight (krill length: t-value = 5.88, P< 0.001; weight: t-value = -4.64, P< 0.001; Figure 5). Sufficient samples were available to test anchovy, sardine, and squid for energetic phenology from across seasons. For all three, energy densities increased significantly from late spring (May) to summer and early fall (June – September; anchovy: F-statistic = 14.65, P< 0.001; sardine: F-statistic = 26.86, P< 0.001; squid: F-statistic = 21.06, P< 0.001 Figure 6).
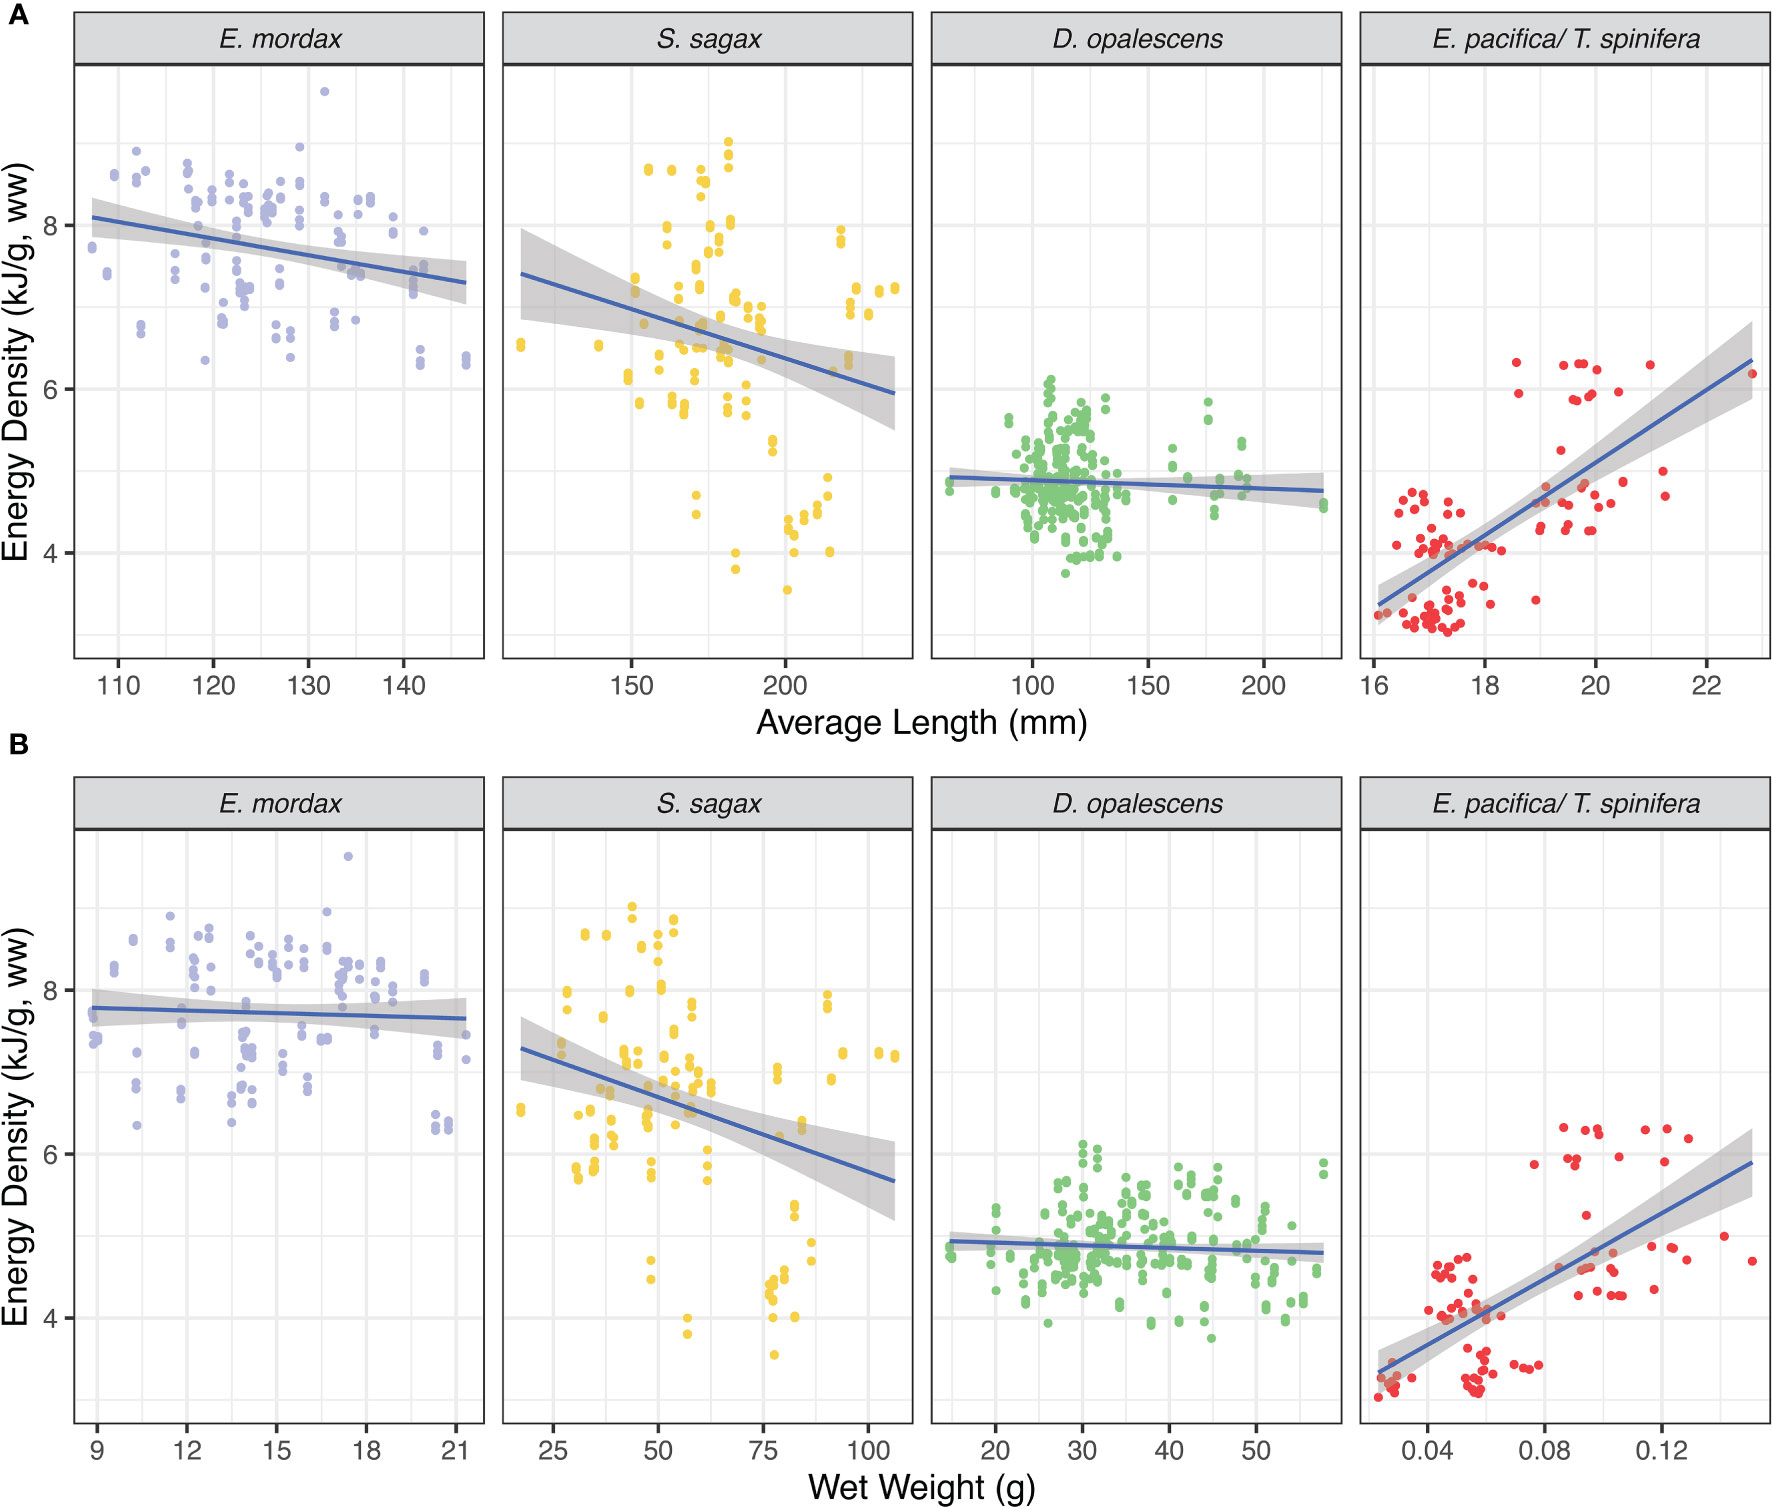
Figure 5 Relationships between energy density (EW) and size. (A) EW by length (B) EW by weight; krill lengths and weights were a mean of the individuals in the sample.
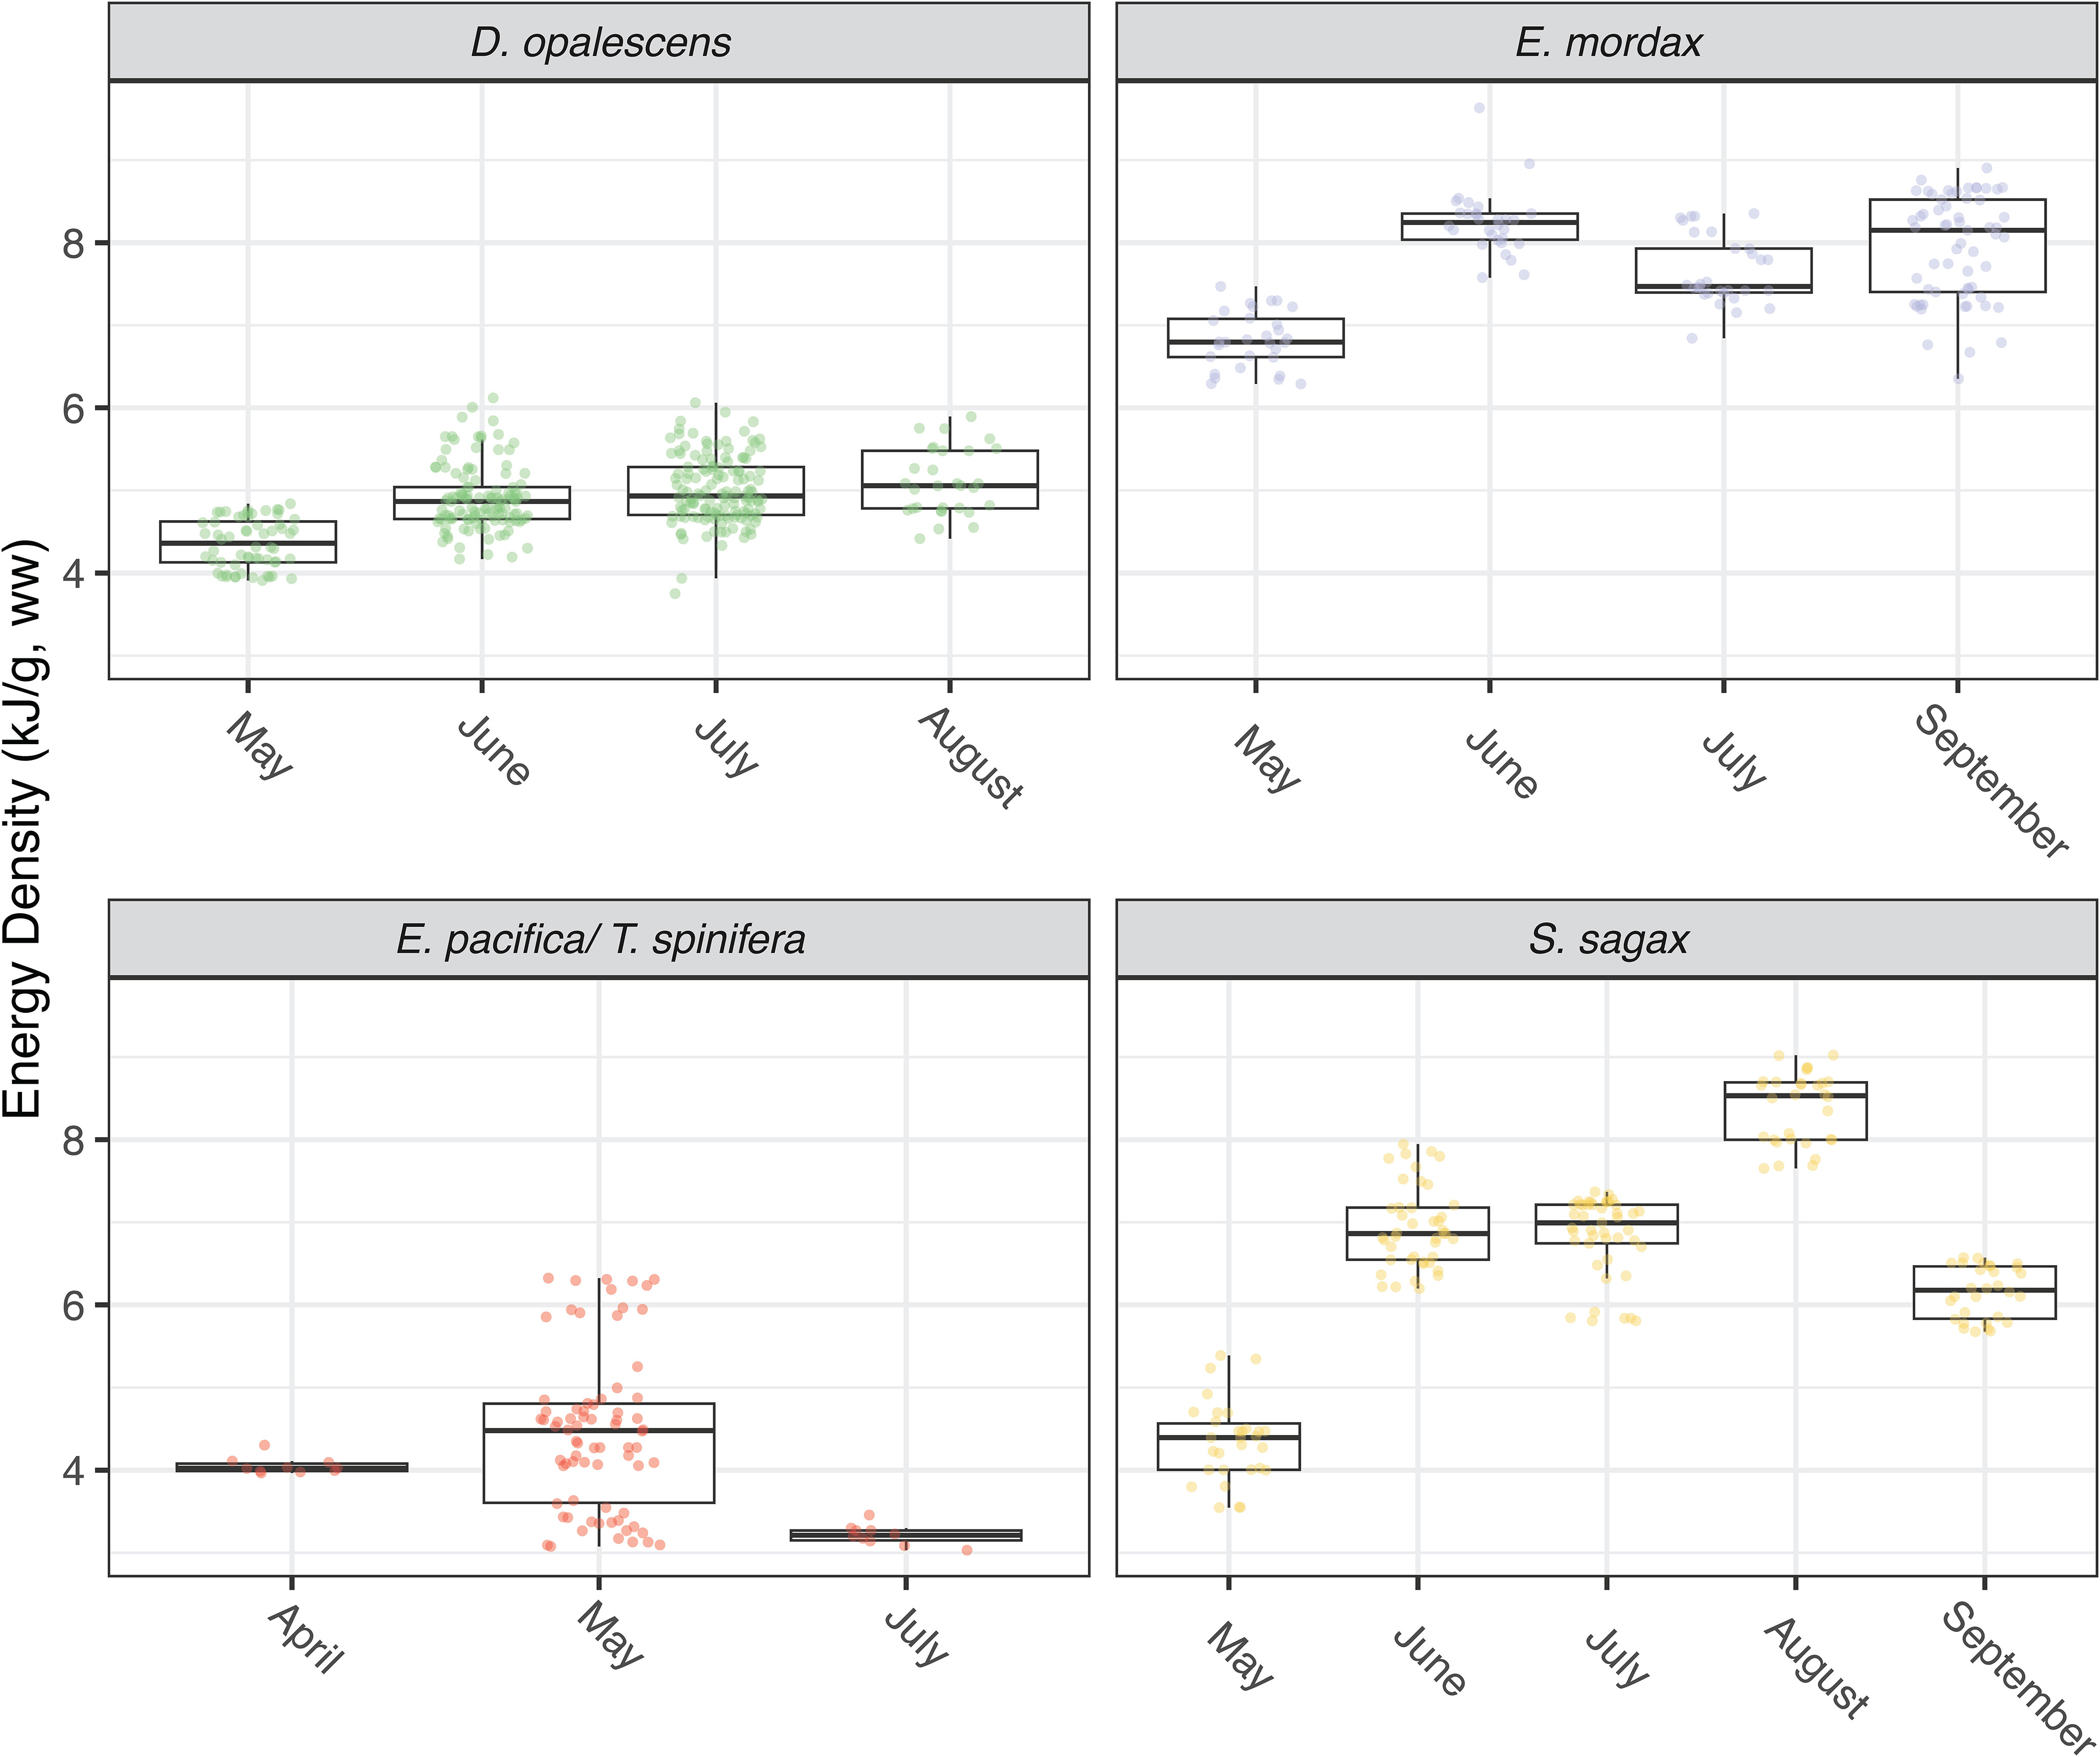
Figure 6 Boxplots showing energy density for each species by month of collection. Market squid were collected in 2022, anchovy were collected in 2019, 2021, and 2022, sardine were collected in 2019 and 2022, and krill were collected in 2021 and 2022.
Discussion
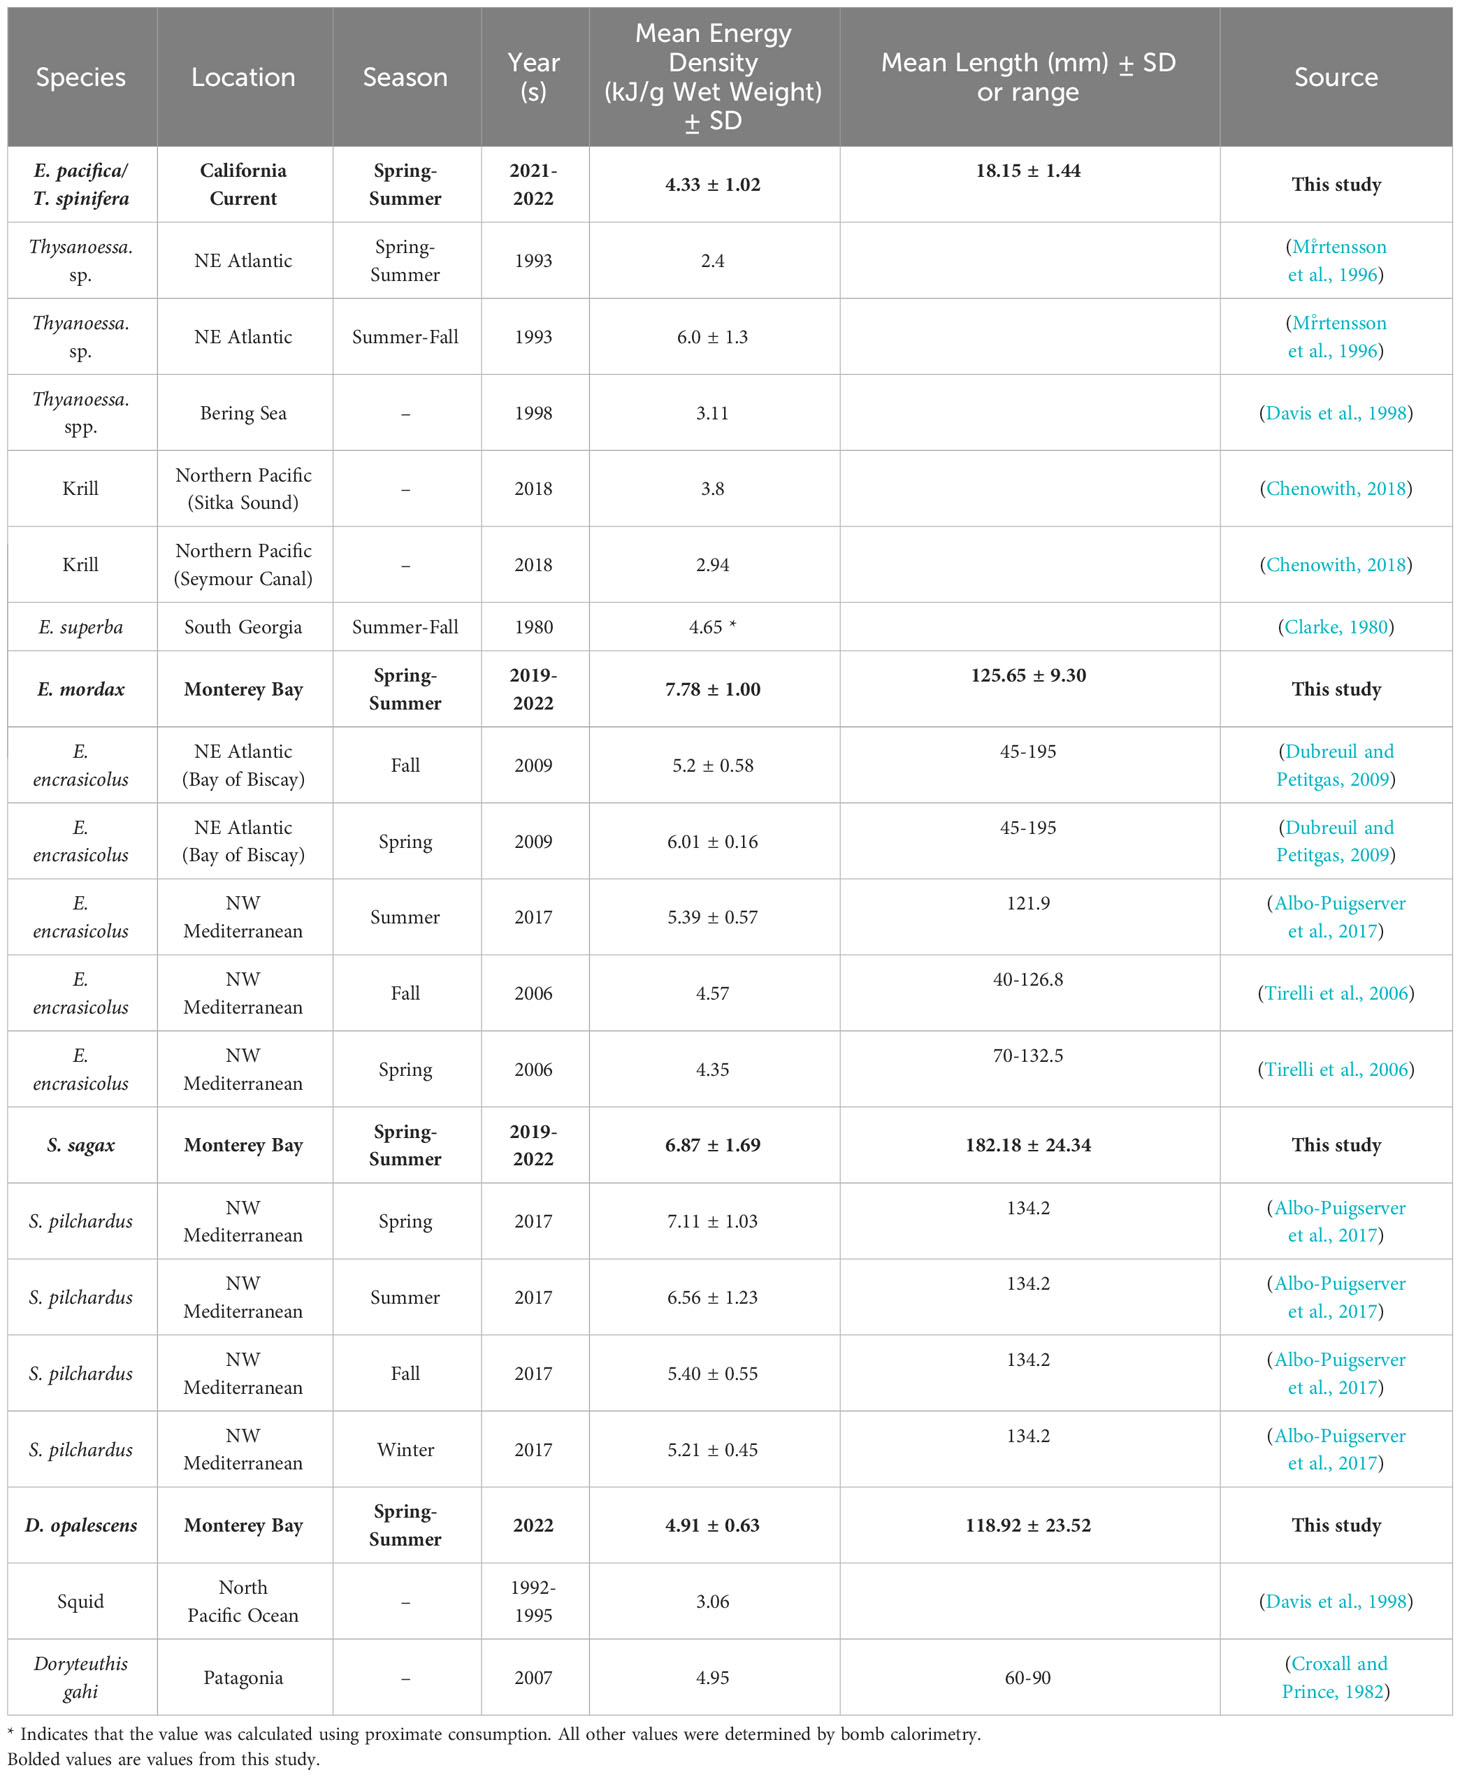
Here, we report energy densities for four key prey groups in the CCLME collected from late spring to early fall. Overall, we find that forage fish are more energy dense than krill or squid (Figure 4). While these results are generally consistent with other studies for similar species, there are some notable discrepancies (Table 3). For example, our values for anchovy are higher than other values reported in the literature (Table 3). The overall lack of these fundamental data for these forage species in the primary literature is striking, especially considering their abundance and importance to the well-studied CCLME.
Within species, we found notable differences across seasons for certain groups. Specifically, we observed an increase in energy densities of forage fish and squid species from late spring (May) to the summer and early fall (June-September; Figure 6). This trend corresponds with the phenology of the ecosystem. During the early spring, upwelling winds drive high primary productivity, which persists throughout the spring and early summer months bolstering phytoplankton blooms that support primary consumers such as larval fish and krill, which subsequently support production at higher trophic levels (Cross et al., 2005; Checkley and Barth, 2009). As krill are a primary prey for other species in this study, increases in anchovy, sardine, and market squid energy densities from the spring to fall may reflect both increasing krill abundance (Cross et al., 2005) and lipid reserves, as has been found in the Oregon and Washington populations (Fisher et al., 2020). Other work has also uncovered seasonal variability in anchovy and sardine energy densities related to ecosystem phenology (Gatti et al., 2018; Albo-Puigserver et al., 2020), though the effects ontogeny and differences in reproductive energy allocation strategies were also significant. These dynamics in the energy densities of fish, squid, and crustaceans have important ecological implications for higher trophic level predators. For example, the temporal patterns we find help explain why highly mobile predators, including seabirds, marine mammals, and predatory fish, aggregate in CCLME in the greatest numbers when their prey is abundant and most energy rich, during the summer and fall (Cross et al., 2005; Block et al., 2011), and spatial and temporal variability in their reproductive success (Warzybok et al., 2018).
For krill, our temporal sampling was too limited to test for differences in energy density related to season; however, changes in krill lipid reserves, likely reflecting energy density, related to phenology has been demonstrated in Oregon and Washington (Fisher et al., 2020). These dynamics many have important ecosystem implications. For example, recording krill energetic density before, during, and after blue whales arrive in Monterey Bay may shed light on how this species modulates the timing of their migration to and from the region (Abrahms et al., 2019; Oestreich et al., 2022). We demonstrated a strong positive relationship between size (both length and weight) and krill energy density (Figure 5). Similar findings have been reported for Antarctic krill (Färber-Lorda et al., 2009), but not yet for krill in the eastern North Pacific. This result has important ecological implications, particularly given the emerging evidence that warm oceans, such as those in the CCLME during recent marine heatwaves, are associated with smaller sized krill for both krill species examined in our study (Robertson and Bjorkstedt, 2020; Killeen et al., 2022). The role of size, along with life stage, sex and species-specific (Färber-Lorda et al., 2009; Fisher et al., 2020), energy densities in mediating these shifts in krill structure is currently unknown and highlights the need to study the bioenergetics of krill, and other species such as forage fish and squid (Cross et al., 2005) that represent important links in marine food webs. Resolving how prey energy density varies in response to climate change and extreme climate events, such as marine heatwaves, could guide understanding and management of ecosystem health and resilience (Dawson et al., 2020). These results come at a critical time for the CCLME that is experiencing a rapid increase in cumulative anthropogenic stressors in recent decades (Calambokidis et al., 2019; Santora et al., 2020; Bograd et al., 2023).
While our study suggests that factors such as seasonality and size play an important role in explaining differences in energy densities, it is also important to consider other aspects that may influence the observed variation within and among groups. For instance, in our study we were unable to account for known sex-specific differences in energy density in krill, anchovy and sardine, which vary with ontogeny (Färber-Lorda et al., 2009; Gatti et al., 2018; Albo-Puigserver et al., 2020) nor potential differences in seasonal energy density between Euphausia pacifica and Thysanoessa spinifera (Fisher et al., 2020). Reproductive cycles may play an important role in mediating energy density in mature individuals of both fish species independent of size, particularly anchovy which are known to exhibit a capital breeding strategy (McBride et al., 2015), accumulating fat in the spring through summer which is utilized for reproduction in the winter (Hunter and Leong, 1981). In addition, the observed variation in water content within sardine, which corresponded with variation in energy density, have been demonstrated elsewhere for sardine and other fish species (Wuenschel et al., 2006; Gatti et al., 2018) highlighting the importance of accounting for ontogeny or other physiological factors. Future studies should aim to account for these potential confounding factors to gain a more complete understanding of the drivers of energy density variation in marine prey species.
Nevertheless, our study outlines foundational understanding of the ecosystem energetics of the CCLME with potential implications for predicting how the environment will affect species and trophic dynamics in the region (Wells et al., 2017; Dawson et al., 2020; Lawson et al., 2021). By shedding light on the drivers of energy density variation among marine prey species, this work may ultimately inform our understanding of higher trophic level predator ecology, such as migration timing, foraging location, and reproductive success. Overall, our findings provide valuable insights into the energy content of CCLME prey species, which could prove instrumental in forecasting how this ecosystem will respond to future environmental change.
Data availability statement
The datasets presented in this study can be found in online repositories. The names of the repository/repositories and accession number(s) can be found below: https://github.com/mssavoca/CCE_preyspp_energetics.
Ethics statement
Ethical approval was not required for the study involving animals in accordance with the local legislation and institutional requirements because samples were collected as part of commerical fishing operations or as part of NOAA cruises under State of California – Department of Fish and Wildlife SCIENTIFIC COLLECTING PERMIT S-210680001-21162-002.
Author contributions
SP: Data curation, Formal analysis, Funding acquisition, Investigation, Methodology, Visualization, Writing – original draft, Writing – review & editing. MS: Conceptualization, Data curation, Formal analysis, Methodology, Project administration, Software, Supervision, Validation, Visualization, Writing – original draft, Writing – review & editing. MK: Conceptualization, Data curation, Investigation, Methodology, Project administration, Supervision, Writing – review & editing. MC: Data curation, Software, Supervision, Validation, Writing – review & editing. DM: Data curation, Investigation, Resources, Writing – review & editing. SL: Methodology, Writing – review & editing. DC: Data curation, Project administration, Writing – review & editing. JG: Conceptualization, Funding acquisition, Project administration, Resources, Supervision, Writing – review & editing.
Funding
The author(s) declare that no financial support was received for the research, authorship, and/or publication of this article.
Acknowledgments
Special thanks to John Field and Jarrod Santora for providing krill samples from NOAA’s Rockfish Recruitment Survey and the Friends of Hopkins for funding the purchase of the bomb calorimeter. We would also like to thank Ron Heintz for AFDW protocol, the Monterey Bay Aquarium for donating test samples, and the Flora Family Foundation that supported SEP. We thank Abby Haney for assistance with Figure 2 and 3, and Kyla Snowden for assistance with labwork.
Conflict of interest
The authors declare that the research was conducted in the absence of any commercial or financial relationships that could be construed as a potential conflict of interest.
Publisher’s note
All claims expressed in this article are solely those of the authors and do not necessarily represent those of their affiliated organizations, or those of the publisher, the editors and the reviewers. Any product that may be evaluated in this article, or claim that may be made by its manufacturer, is not guaranteed or endorsed by the publisher.
References
Abraham C. L., Sydeman W. J. (2006). Prey-switching by Cassin’s auklet Ptychoramphus aleuticus reveals seasonal climate-related cycles of Euphausia pacifica and Thysanoessa spinifera. Mar. Ecol. Prog. Ser. 313, 271–283. doi: 10.3354/meps313271
Abrahms B., Hazen E. L., Aikens E. O., Savoca M. S., Goldbogen J. A., Bograd S. J., et al. (2019). Memory and resource tracking drive blue whale migrations. Proc. Natl. Acad. Sci. U. S. A. 116, 5582–5587. doi: 10.1073/pnas.1819031116
Albo-Puigserver M., Muñoz A., Navarro J., Coll M., Pethybridge H., Sánchez S., et al. (2017). Ecological energetics of forage fish from the Mediterranean Sea: Seasonal dynamics and interspecific differences. Deep-Sea. Res. Part II.: Topical. Stud. Oceanogr. 140, 74–82. doi: 10.1016/j.dsr2.2017.03.002
Albo-Puigserver M., Sánchez S., Coll M., Bernal M., Sáez-Liante R., Navarro J., et al. (2020). Year-round energy dynamics of sardine and anchovy in the north-western Mediterranean Sea. Mar. Environ. Res. 159, 105021. doi: 10.1016/j.marenvres.2020.105021
Bates D., Mächler M., Bolker B., Walker S. (2014). Fitting Linear Mixed-Effects Models using lme4. J. Stat. Softw. 67, 1–41. doi: 10.18637/jss.v067.i01
Block B. A., Jonsen I. D., Jorgensen S. J., Winship A. J., Shaffer S. A., Bograd S. J., et al. (2011). Tracking apex marine predator movements in a dynamic ocean. Nature 475, 86–90. doi: 10.1038/nature10082
Bograd S. J., Jacox M. G., Hazen E. L., Lovecchio E., Montes I., Pozo Buil M., et al. (2023). Climate change impacts on eastern boundary upwelling systems. Annu. Rev. Mar. Sci. 15, 303–328. doi: 10.1146/annurev-marine-032122-021945
Calambokidis J., Fahlbusch J. A., Szesciorka A. R., Southall B. L., Cade D. E., Friedlaender A. S., et al. (2019). Differential vulnerability to ship strikes between day and night for blue, fin, and humpback whales based on dive and movement data from medium duration archival tags. Front. Mar. Sci. 6, 543. doi: 10.3389/fmars.2019.00543
Checkley D. M., Barth J. A. (2009). Patterns and processes in the california current system. Prog. Oceanogr. 83, 49–64. doi: 10.1016/j.pocean.2009.07.028
Chenowith E. M. (2018). Bioenergetic and economic impacts of humpback whale depredation at salmon hatchery release sites (Fairbanks: University of Alaska).
Clarke A. (1980). The biochemical composition of krill Euphausia superba Dana from South Georgia. J. Exp. Mar. Biol. Ecol. 43, 221–236. doi: 10.1016/0022-0981(80)90049-0
Cross A. D., Beauchamp D. A., Armstrong J. L., Blikshteyn M., Boldt J. L., Davis N. D., et al. (2005). Consumption demand of juvenile pink salmon in Prince William Sound and the coastal Gulf of Alaska in relation to prey biomass. Deep-Sea. Res. Part II.: Topical. Stud. Oceanogr. 52, 347–370. doi: 10.1016/j.dsr2.2004.09.021
Croxall J. P., Prince P. A. (1982). Calorific content of squid (Mollusca: Cephalopoda. Br. Antarctic. Survey. Bull. 55, 27–31.
Davis N., Myers K., Ishida Y. (1998). Caloric value of high-seas salmon prey organisms and simulated salmon ocean growth and prey consumption. North Pacific. Anadromous. Fish. Commission. Bull. 1, 146–162.
Dawson G., Suthers I. M., Brodie S., Smith J. A. (2020). The bioenergetics of a coastal forage fish: Importance of empirical values for ecosystem models. Deep-Sea. Res. Part II.: Topical. Stud. Oceanogr. 175, 104700. doi: 10.1016/j.dsr2.2019.104700
Dubreuil J., Petitgas P. (2009). Energy density of anchovy Engraulis encrasicolus in the Bay of Biscay. J. Fish. Biol. 74, 521–534. doi: 10.1111/j.1095-8649.2008.02143.x
Eddy T. D., Bernhardt J. R., Blanchard J. L., Cheung W. W. L., Colléter M., du Pontavice H., et al. (2021). Energy flow through marine ecosystems: confronting transfer efficiency. Trends Ecol. Evol. 36, 76–86. doi: 10.1016/j.tree.2020.09.006
Färber-Lorda J., Gaudy R., Mayzaud P. (2009). Elemental composition, biochemical composition and caloric value of Antarctic krill. Implications in Energetics and carbon balances. J. Mar. Syst. 78, 518–524. doi: 10.1016/j.jmarsys.2008.12.021
Fisher J. L., Menkel J., Copeman L., Shaw C. T., Feinberg L. R., Peterson W. T. (2020). Comparison of condition metrics and lipid content between Euphausia pacifica and Thysanoessa spinifera in the northern California Current, USA. Prog. Oceanogr. 188, 102417. doi: 10.1016/j.pocean.2020.102417
Gatti P., Cominassi L., Duhamel E., Grellier P., Le Delliou H., Le Mestre S., et al. (2018). Bioenergetic condition of anchovy and sardine in the Bay of Biscay and English Channel. Prog. Oceanogr. 166, 129–138. doi: 10.1016/j.pocean.2017.12.006
Hunter J. R., Leong R. (1981). The spawning energetics of female Northern anchovy, Engraulis mordax. Fishery. Bull. 79, 215–230.
Hurlbert S. H. (1984). Pseudoreplication and the design of ecological field experiments. Ecol. Monogr. 54, 187–211. doi: 10.2307/1942661
Kashiwada J., Recksiek C. W. (1979). Beaks of the market squid, Loligo opalescens, as tools for predator studies. California. Cooperative. Oceanic. Fisheries. Investigations. Rep. 20, 65–69.
Killeen H., Dorman J., Sydeman W., Dibble C., Morgan S. (2022). Effects of a marine heatwave on adult body length of three numerically dominant krill species in the California Current Ecosystem. ICES. J. Mar. Sci. 79, 761–774. doi: 10.1093/icesjms/fsab215
Kuznetsova A., Brockhoff P. E., Christensen R. H. B. (2017). lmerTest package: tests in linear mixed effects models. J. Stat. Softw. 82, 1–19. doi: 10.18637/jss.v082.i13
Lawson C. L., Taylor M. D., Smith J. A., Payne N. L., Semmens J. M., Suthers I. M., et al. (2021). Bioenergetic model sensitivity to diet diversity across space, time and ontogeny. Front. Mar. Sci. 8, 1–13. doi: 10.3389/fmars.2021.625855
Lawson G. L., Wiebe P. H., Ashjian C. J., Chu D., Stanton T. K. (2006). Improved parametrization of Antarctic krill target strength models. J. Acoustical. Soc. America 119, 232–242. doi: 10.1121/1.2141229
McBride R. S., Somarakis S., Fitzhugh G. R., Albert A., Yaragina N. A., Wuenschel M. J., et al. (2015). Energy acquisition and allocation to egg production in relation to fish reproductive strategies. Fish. Fisheries. 16, 23–57. doi: 10.1111/faf.12043
Miller T. W., Brodeur R. D., Rau G., Omori K. (2010). Prey dominance shapes trophic structure of the northern California Current pelagic food web: evidence from stable isotopes and diet analysis. Mar. Ecol. Prog. Ser. 420, 15–26. doi: 10.3354/meps08876
Mr̊rtensson P.-E., Lager Gotaas A. R., Norddy E. S., Blix A. S. (1996). Seasonal changes in energy density of prey of. Mar. Mammal. Sci. 12, 635–640. doi: 10.1111/j.1748-7692.1996.tb00080.x
Oestreich W. K., Abrahms B., McKenna M. F., Goldbogen J. A., Crowder L. B., Ryan J. P. (2022). Acoustic signature reveals blue whales tune life-history transitions to oceanographic conditions. Funct. Ecol. 36, 882–895. doi: 10.1111/1365-2435.14013
Paine R. T. (1972). The measurement and application of the calorie to ecological problems. Annu. Rev. Ecol. Systematics. 2, 145–164. doi: 10.1146/annurev.es.02.110171.001045
Palumbi S. R., Sotka C. (2011). The death and life of monterey bay: A story of revival (Washington, D.C: Island Press).
Robertson R. R., Bjorkstedt E. P. (2020). Climate-driven variability in Euphausia pacifica size distributions off northern California. Prog. Oceanogr. 188, 102412. doi: 10.1016/j.pocean.2020.102412
Sánchez S., Palomera I., Albo-Puigserver M., Bernal M. (2013). Energy density and lipid content of sardine (Sardina pilchardus) and anchovy (Engraulis encrasicolus) in the Catalan Sea, Northwestern Mediterranean Sea. 40th. CIESM. Congress.: largest. Forum Mediterr. Black. Sea. Res. 40, 530.
Santora J. A., Mantua N. J., Schroeder I. D., Field J. C., Hazen E. L., Bograd S. J., et al. (2020). Habitat compression and ecosystem shifts as potential links between marine heatwave and record whale entanglements. Nat. Commun. 11, 536. doi: 10.1038/s41467-019-14215-w
Szoboszlai A. I., Thayer J. A., Wood S. A., Sydeman W. J., Koehn L. E. (2015). Forage species in predator diets: Synthesis of data from the California Current. Ecol. Inf. 29, 45–56. doi: 10.1016/j.ecoinf.2015.07.003
Thompson A. R., Harvey C. J., Sydeman W. J., Barceló C., Bograd S. J., Brodeur R. D., et al. (2019). Indicators of pelagic forage community shifts in the California Current Large Marine Ecosystem 1998–2016. Ecol. Indic. 105, 215–228. doi: 10.1016/j.ecolind.2019.05.057
Tirelli V., Borme D., Tulli F., Cigar M., Fonda Umani S., Brandt S. B. (2006). Energy density of anchovy Engraulis encrasicolus L. in the Adriatic Sea. J. Fish. Biol. 68, 982–989. doi: 10.1111/j.0022-1112.2006.00987.x
Vojkovich M. (1998). The California fishery for market squid (Loligo opalescens). California. Cooperative. Oceanic. Fisheries. Investigations. Rep. 39, 55–60.
Von Biela V. R., Arimitsu M. L., Piatt J. F., Heflin B., Schoen S. K., Trowbridge J. L., et al. (2019). Extreme reduction in nutritional value of a key forage fish during the pacific marine heatwave of 2014-2016. Mar. Ecol. Prog. Ser. 613, 171–182. doi: 10.3354/meps12891
Warzybok P., Santora J. A., Ainley D. G., Bradley R. W., Field J. C., Capitolo P. J., et al. (2018). Prey switching and consumption by seabirds in the central California Current upwelling ecosystem: Implications for forage fish management. J. Mar. Syst. 185, 25–39. doi: 10.1016/j.jmarsys.2018.04.009
Wells B. K., Santora J. A., Henderson M. J., Warzybok P., Jahncke J., Bradley R. W., et al. (2017). Environmental conditions and prey-switching by a seabird predator impact juvenile salmon survival. J. Mar. Syst. 174, 54–63. doi: 10.1016/j.jmarsys.2017.05.008
Keywords: bioenergetics, trophic ecology, calorimetry, California Current, forage fish, krill
Citation: Price SE, Savoca MS, Kumar M, Czapanskiy MF, McDermott D, Litvin SY, Cade DE and Goldbogen JA (2024) Energy densities of key prey species in the California Current Ecosystem. Front. Mar. Sci. 10:1345525. doi: 10.3389/fmars.2023.1345525
Received: 28 November 2023; Accepted: 26 December 2023;
Published: 17 January 2024.
Edited by:
Brian P. V. Hunt, University of British Columbia, CanadaReviewed by:
Todd Miller, National Oceanic and Atmospheric Administration (NOAA), United StatesDavid Ainley, H.T. Harvey & Associates, United States
Copyright © 2024 Price, Savoca, Kumar, Czapanskiy, McDermott, Litvin, Cade and Goldbogen. This is an open-access article distributed under the terms of the Creative Commons Attribution License (CC BY). The use, distribution or reproduction in other forums is permitted, provided the original author(s) and the copyright owner(s) are credited and that the original publication in this journal is cited, in accordance with accepted academic practice. No use, distribution or reproduction is permitted which does not comply with these terms.
*Correspondence: Matthew S. Savoca, bXNhdm9jYTEzQGdtYWlsLmNvbQ==; Jeremy A. Goldbogen, amVyZ29sZEBzdGFuZm9yZC5lZHU=
 Samuel E. Price1
 Matthew S. Savoca
 Max F. Czapanskiy
 Steven Y. Litvin
 David E. Cade
 Jeremy A. Goldbogen