
94% of researchers rate our articles as excellent or good
Learn more about the work of our research integrity team to safeguard the quality of each article we publish.
Find out more
ORIGINAL RESEARCH article
Front. Mar. Sci., 19 January 2024
Sec. Ocean Observation
Volume 10 - 2023 | https://doi.org/10.3389/fmars.2023.1341989
This article is part of the Research TopicOcean Observation based on Underwater Acoustic Technology, volume IIView all 23 articles
 Ho Seuk Bae1
 Won-Ki Kim2*
Bubbles greatly affect the propagation of sound waves as the acoustic characteristics of a bubble cluster in water are distinct from those of undisturbed water. Therefore, bubble clusters affect the ability of sensors to detect underwater targets by blocking or reflecting sound waves. Additionally, the bubble wakes produced by ships in movement can be detected by wake-homing torpedoes, thus greatly threatening the safety of the ship. Thus, research on bubble dynamics in water is crucial for the development of military technology. Recently, we conducted a quantitative estimation of the acoustic characteristics of artificial bubbles, including their backscattering strength, existence time, population density spectrum level and void fraction in an ideal water-tank environment. Based on our previous findings, the present study sought to measure the acoustic characteristics of artificial bubbles using an acoustic Doppler current profiler (ADCP) in the southern sea of the Korean Peninsula, which is a real marine environment. Additionally, we validated the ADCP measurements by comparing them to those obtained using a scattering strength measurement system (SSMS) developed by our team. Collectively, our findings provide a basis for the development of military technology, as well as for the study of bubble in water.
Understanding the characteristics of bubbles naturally generated in real marine environments is a very important topic in the fields of oceanography and underwater acoustics. Therefore, many studies have explored the characteristics of naturally occurring bubbles. Keiffer et al. (1995) measured the surface backscattering and reverberation strengths induced by a bubble layer below the water surface and compared them with sound wave propagation and scattering models in the low to moderate frequency range (Keiffer et al., 1995). Caruthers et al. (1999) studied bubble distribution by measuring the acoustic attenuation caused by the bubbles generated in rip currents of very shallow waters (Caruthers et al., 1999). Trevorrow (2003) determined the volume scattering strength of a bubble layer below the water surface in the high-frequency band. To compare the acoustic scattering of bubbles caused by natural wind currents to that induced by the sea bottom roughness, Dahl (2003) measured the acoustic backscattering strength of the sea surface. The gas columns that naturally leak from the sea bottom are also often studied because they have a significant impact on the ocean environment (Schneider von Deimling et al., 2007; Gulf of Mexico Expedition, 2011; Schneider von Deimling and Weinrebe, 2014; Urban et al., 2017).
The study of bubbles in water is very important not only because it provides insights into natural phenomena but also for military purposes. Bubbles in water rise to the surface due to their buoyancy and dissipate gradually. However, smaller bubbles remain in the water for several tens of minutes (United States Office of Scientific Research and Development, 1946). Therefore, these small bubbles could potentially be used in military applications. Bubble layers can interfere with acoustic wave propagation due to their strong attenuation properties. Therefore, bubble clusters can hinder underwater target detection by affecting the detection performance of sonar, thus protecting underwater facilities and equipment from potential attacks. Similarly, the noise emitted by a moving ship can be detected by an enemy sonar, which highlights the vital importance of noise reduction. Noise can be attenuated by generating artificial bubbles around the ship. Additionally, given that wake-homing torpedoes, which is a strong threat to the ship, acoustically track the wake generated by moving ships, the small bubbles in the wake that persist in the water for long periods are very unfavorable for the ship’s defense. Therefore, the characteristics of artificial bubbles in water have attracted the attention of many military experts and researchers.
The ship wakes generated by propeller rotation and hull resistance are dominant factors that determine the formation of artificial bubbles in the ocean. Therefore, many studies have sought to measure ship wakes using a wide variety of equipment to extract the signatures of the ship. Culver and Trujillo (2007) measured the density and size distribution of the ship wake using an upward single-beam sonar mounted on an autonomous underwater vehicle. Stanic et al. (2009) derived the void fraction and the sound speed of the wake using bi-static sonar. Ji et al. (2009) characterized the spatial distribution of bubbles by measuring their backscattering intensity at several positions under the ship wake using a self-manufactured sonar instrument, and Leighton et al. (2011) acquired the backscattering signal of the wake of a 3,900-ton ship using a wake penetration sonar developed by the research team. Li et al. (2014) acquired spatial scattering images of ship wakes with a multi-beam bathymetric sonar, and Karoui et al. (2015) measured ship wakes using forward-looking sonar, which is often equipped on unmanned vehicles.
In addition to the wake caused by ships, several studies have measured the effects of artificially generated bubble clusters. Rustemeier et al. (2012) collaborated with Atlas Elektronik in Germany to create a bubble curtain by injecting compressed air into lake water, after which they measured the changes in acoustic attenuation by the bubble curtain. To reduce the noise generated by ships, compressed air was sprayed to generate a bubble column in a large cavitation tunnel, after which the insertion loss was measured by Park et al. (2021). Except for the aforementioned studies, very few studies have assessed the use of artificial bubbles as a defense mechanism against wake-homing torpedoes for military purposes (Guelou et al., 2002; Guelou et al., 2005).
The quantitative characterization of the acoustic properties of bubble clusters is known to be quite challenging. Unlike in natural bubble studies, there are physical restrictions that affect the generation of artificial bubbles, thus limiting their study in natural environments. Our team recently estimated the acoustic properties (backscattering strength, existence time, population density spectrum level, and void fractions) of artificial bubble clusters using a bubble-generating material (BGM) designed by our team using an acoustic Doppler current profiler (ADCP) (Bae et al., 2022). This study was conducted in a water-tank (i.e., in stable experimental conditions) to quantify the acoustic characteristics of the generated bubbles, and the results were compared to those obtained with highly reliable commercial equipment. However, the salinity, temperature, density, flow, and concentration of organic and inorganic compounds in seawater are different from those of fresh waters in the tank experiments. Moreover, marine environments exhibit strong spatiotemporal variation compared to that in the water-tank experiments. Therefore, the acoustic characteristics of artificial bubbles in marine environments will likely be different.
The present study sought to expand upon our previous work by characterizing the acoustic characteristics of artificial bubbles in a real marine environment (the southern sea of the Korean Peninsula) using ADCP. To validate the backscattering strength derived from the ADCP results, we simultaneously acquired another dataset using a scattering strength measurement system (SSMS) developed by our research team. Section 2 briefly introduces the measurement devices and methods. Section 3 describes our experimental design in the southern sea of the Korean Peninsula. Section 4 describes our quantitative results and Section 5 summarizes our findings and conclusions.
We measured the backscattering strength of artificial bubble clusters generated in the water-tank using an ADCP in our previous study (Bae et al., 2022). The ADCP can measure the echo intensities reflected from bubble clusters, and received intensities can be converted into backscattering strength by the equation presented by Bae et al. (2022). Here, the acoustic characteristics of artificial bubble clusters were estimated using the same procedures. To validate the ADCP-based estimations, an SSMS (i.e., a stand-alone sonar device) was developed to record the acoustic signals with a high resolution.
Figure 1A shows the ADCP used in our experiment. We selected the Workhorse Sentinel 300 model produced by Teledyne RD Instruments) because it is widely used in Korea and our group is highly experienced in its use and deployment. Additionally, this equipment was used in our previous water-tank experiment (Bae et al., 2022). Figure 1B shows the SSMS developed by our team, which records acoustic signals to overcome limitations when measuring underwater bubbles with an ADCP. Basically, the method of receiving acoustic signals is the same as ADCP. However, it has a higher resolution than the commercial ADCP. Moreover, it features a vertical direction beam instead of a tilted beam such as that in the ADCP system, which enables it to identify the exact target position without additional slant correction. The acoustic hydrophone and projector were physically separated from each other to reduce electrical noise. This device was designed to use an arbitrary operating frequency range from 450 to 550 kHz to avoid acoustic interferences with other acoustic sonar devices. Afterward, acoustic signals at a 64 kHz sampling frequency were recorded via frequency modulation (FM). This SSMS can transmit the pulse type continuous wave (CW), FM, or arbitrary signals with a length of 0.5–10.0 ms. The acoustic source level varies depending on the operating frequency, but in the frequency used in this study, the magnitude of the source level was 197.0 dB.
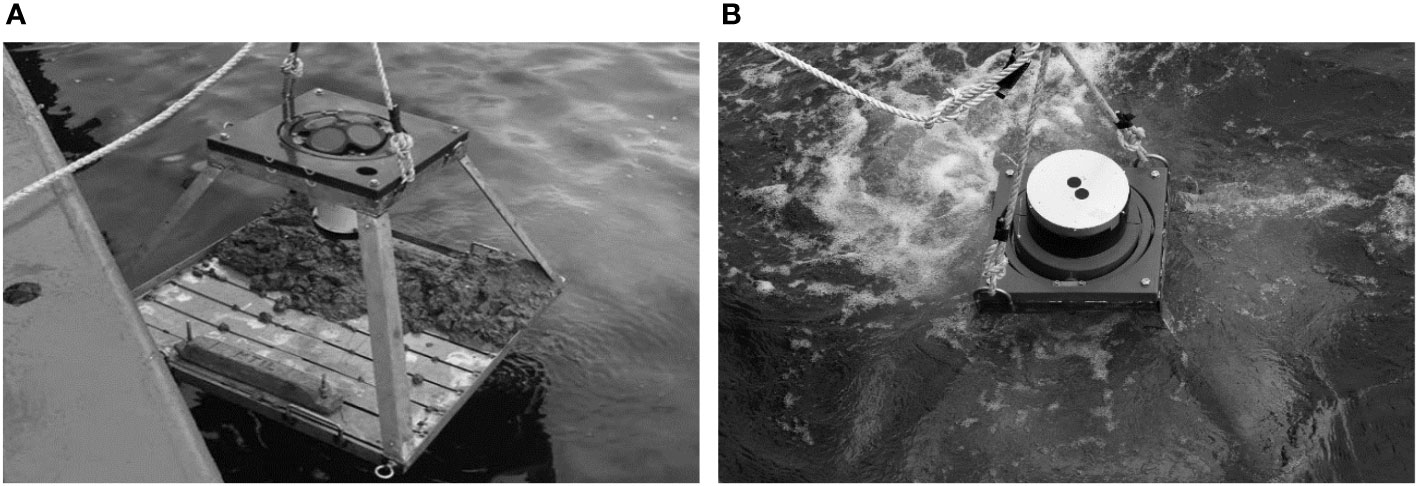
Figure 1 Acoustic measurement devices: (A) ADCP; (B) SSMS.
The scattering strength induced by the bubble cluster can be easily derived using both sonar instruments. In the case of the ADCP instrument, the manufacturer provides a transform equation to determine the backscattering strength from the echo intensity as a function of depth (Deines, 1999; Mullison, 2017). Scattering strength can also be directly obtained through the sonar equation from the volume scattering theory (Urick, 1983). In this study, scattering strength was estimated using the sonar equation because it can account for the precise transmission loss in the ocean environment. Additionally, it allows for the direct application of the parameters from our SSMS device. From the sonar equation, backscattering strength can be determined as described by Equation (1) (Urick, 1983; Bae et al., 2022):
where the RL is the received level reflected from the bubble cluster and the TL is the transmission loss. We applied Jurng’s approach to obtain the TL (Jurng, 1996). SL is the transmitted acoustic pressure level and V is the volume of the acoustic beam.
To obtain the backscattering strength of the artificial bubbles in a real marine environment, various factors were considered when designing our experimental plan. Figure 2 shows a schematic of our sea experiment. First, the most suitable experimental area to stably deploy the measurement equipment was identified, after which data were acquired in the calmest conditions possible. Moreover, we identified the most appropriate measuring period and time to obtain better quality data by accounting for environmental factors including the weather and a tide. Artificial bubbles were then generated after deploying the measurement devices. A drone was used to avoid interference from other acoustic signals. The drone can perfectly drop our designed BGMs for generating artificial bubbles in a wide area without any interferences. The BGMs were dropped near the sea surface to artificially generate a bubble cluster, after which the backscattered acoustic signals reflected and scattered from the bubbles were recorded with the two measurement devices.
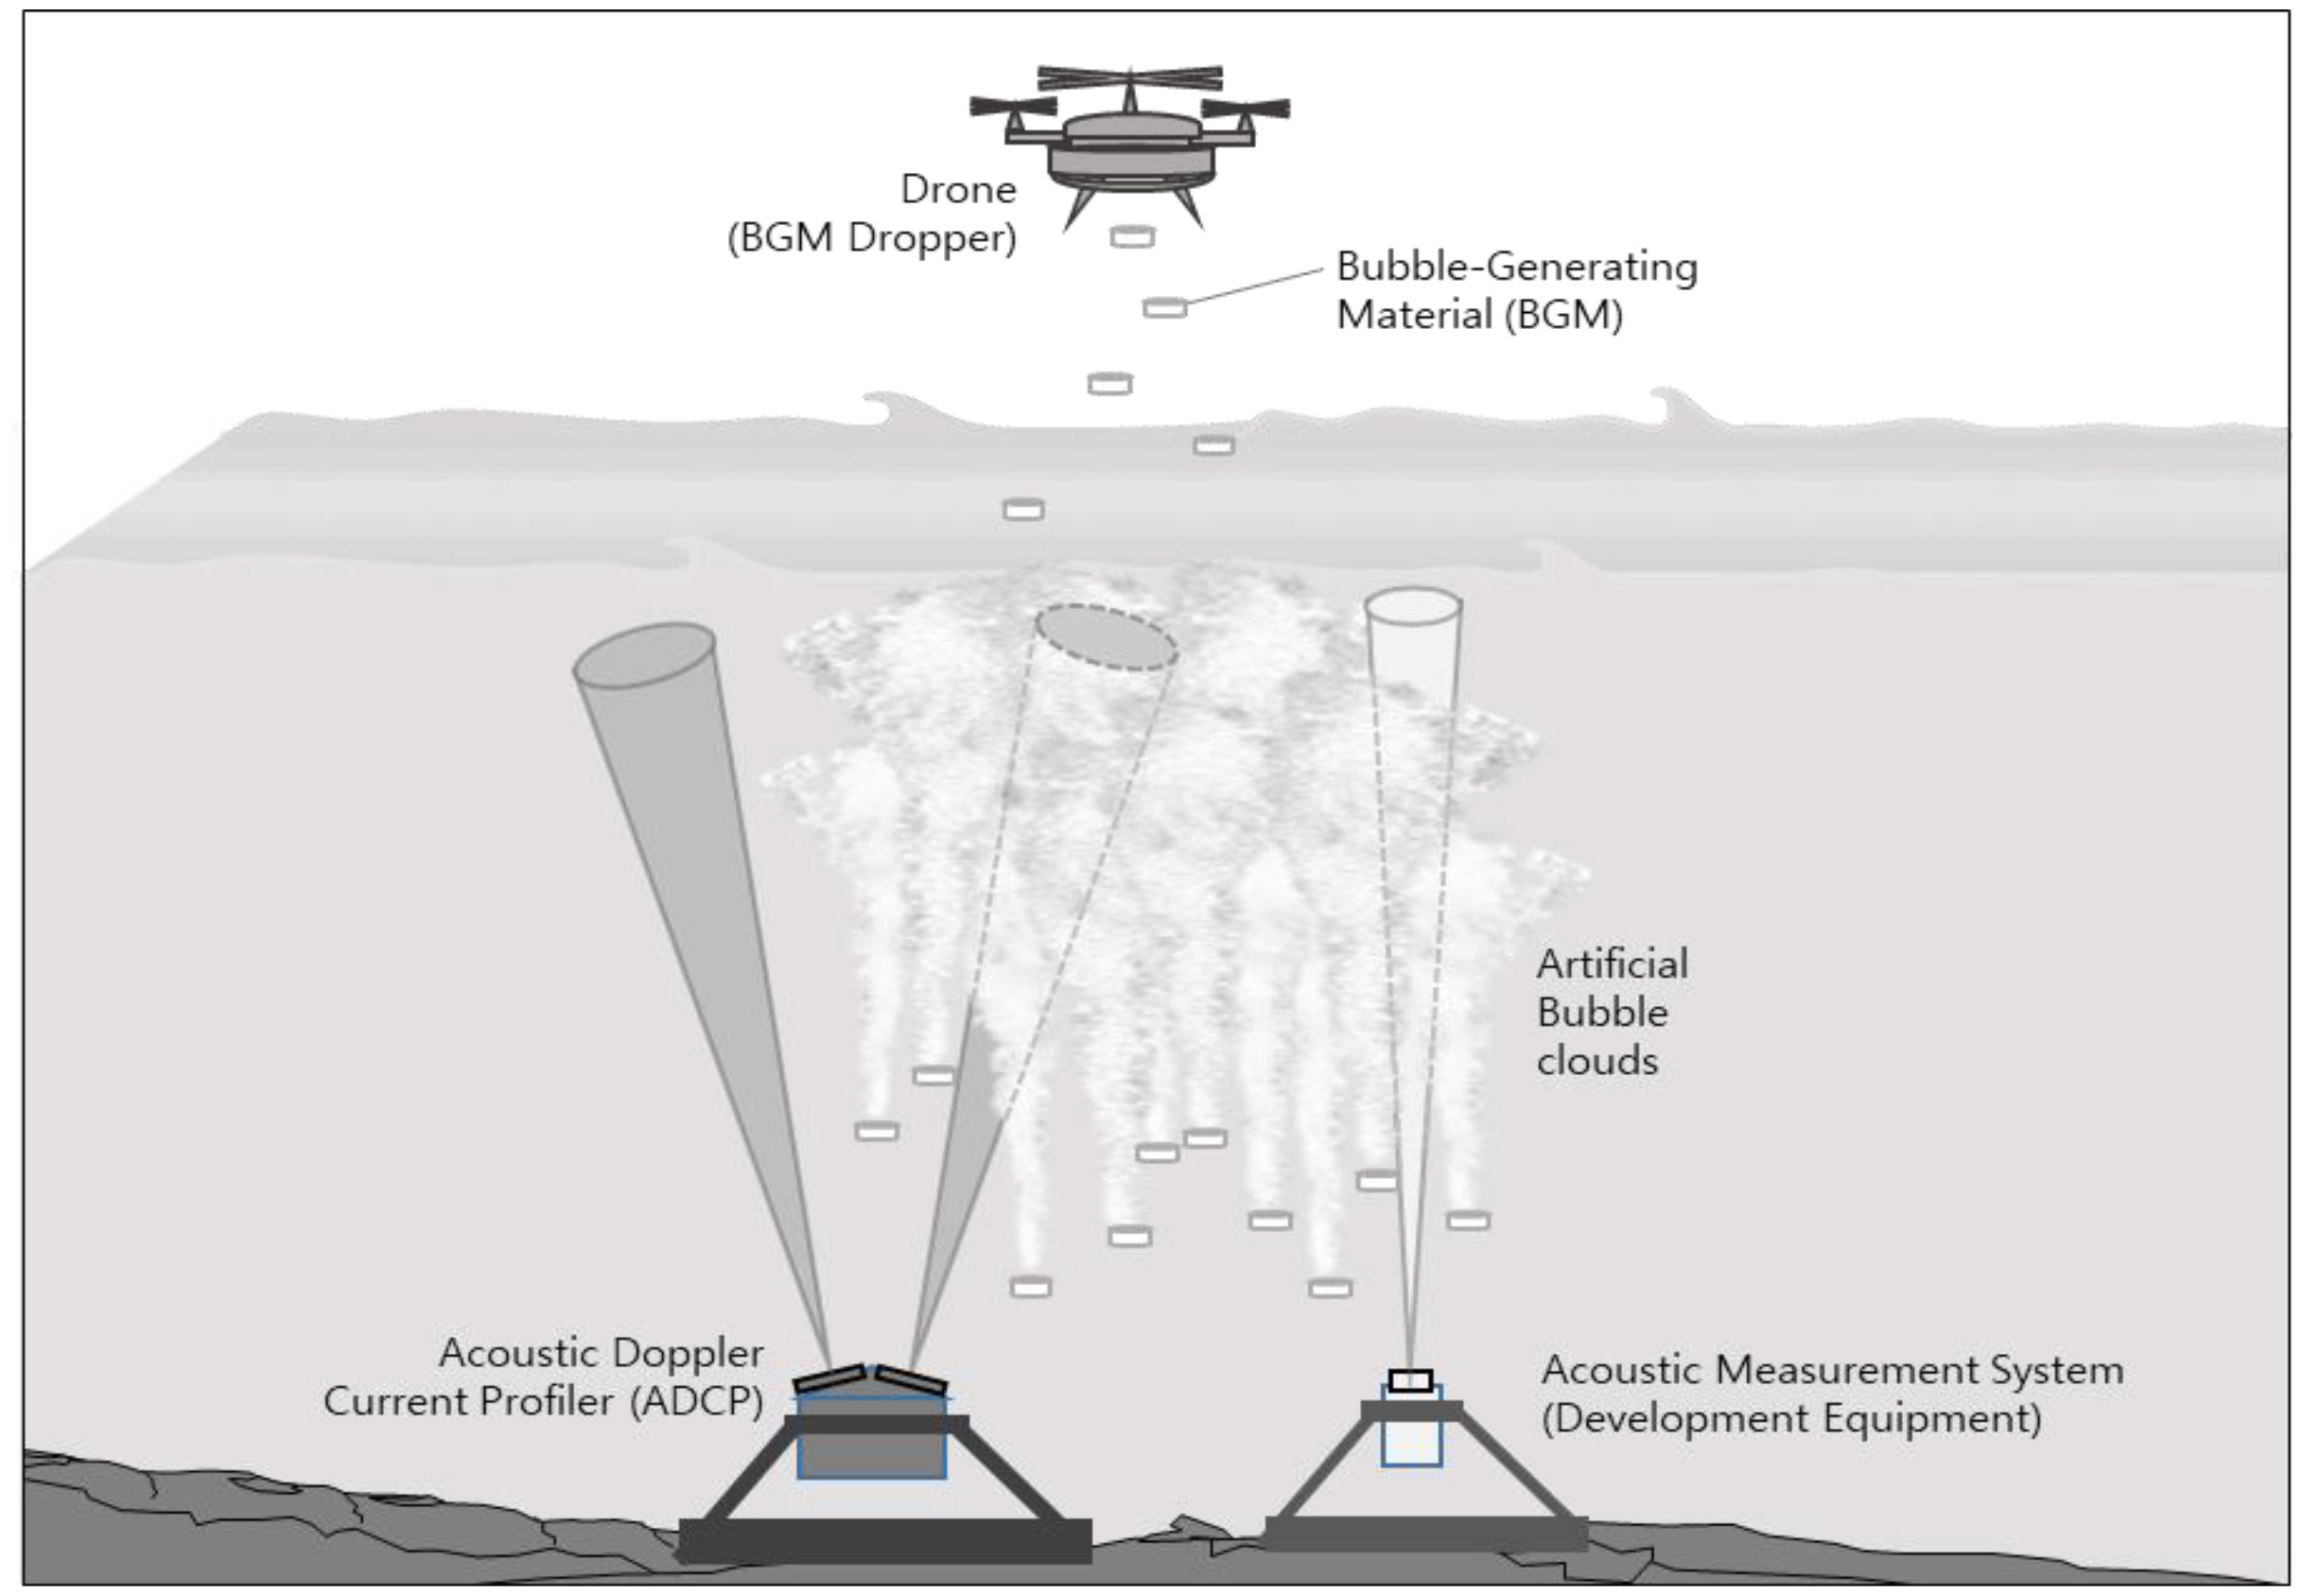
Figure 2 Schematic of the sea experiment.
The main purpose of this measurement was to obtain acoustic characteristics related exclusively to the artificial bubbles. Therefore, mock-up models with the same shape, size, and density as the BGMs were first dropped to obtain reference data in the absence of bubbles. Afterward, the acoustic characteristics of the bubbles were measured by dropping the BGMs with the drone.
Various factors affect the conditions of marine environments, including water depth, water current and tide, fisheries and harbors, and the presence of restricted zones. Therefore, to identify the optimal conditions for our experiments, potential interference factors must be identified and addressed in advance. Among the aforementioned factors, water current and tide are the most influential. Therefore, potential areas were identified using numerical methods and an electrical marine chart. Water depth and bottom properties were examined using the marine database, and information on fisheries and harbor and water current speeds were obtained from the Korea Hydrographic and Oceanographic Agency (KHOA). Additionally, other limitations such as drone flight restriction zones and no-flight zones were verified using the spatial information open platform provided by the Ministry of Land, Infrastructure, and Transport of Korea (MLIT). After visually identifying the interference factors such as actual ship traffic and fishing nets, the experimental area was finally decided (Figure 3). The selected area was located in the southern part of the Korean Peninsula, which is characterized by its complex coastline and the presence of several small islands that act as a natural barrier against wind currents. Additionally, there is a wave-absorbing revetment in the area and the water current during neap tide is relatively slow compared to other candidate sites that were considered. These environmental conditions were favorable to successfully conduct our experiments.

Figure 3 Location and photograph of the sea experiment.
The bubbles to be measured were generated with a BGM, which generates artificial bubbles through a chemical reaction with water while sinking slowly from the sea surface. The BGM was shaped as pellets to ensure stable sinking to the desired depth. Additionally, precautions were taken to ensure that the formulation of the BGM did not adversely affect the ecosystem or human health.
The main concern in determining how to drop the BGMs was to avoid physical interference with other objects such as a boat. Therefore, a drone was adapted for this purpose. As shown in Figure 4, a medium-size drone was selected to minimize the effects of meteorological factors such as the wind. To evenly distribute the BGM pellets on the sea surface, an additional rotation plate was mounted under the drone body so that when the pellets passed through it when they were ejected. The rotation rate of the rotation plate and open angle of the gate were adjusted by conducting land experiments in advance. Another consideration of drone operation is related to the operation environment. For example, landing coordinates change because the drone is operated on the ship deck.
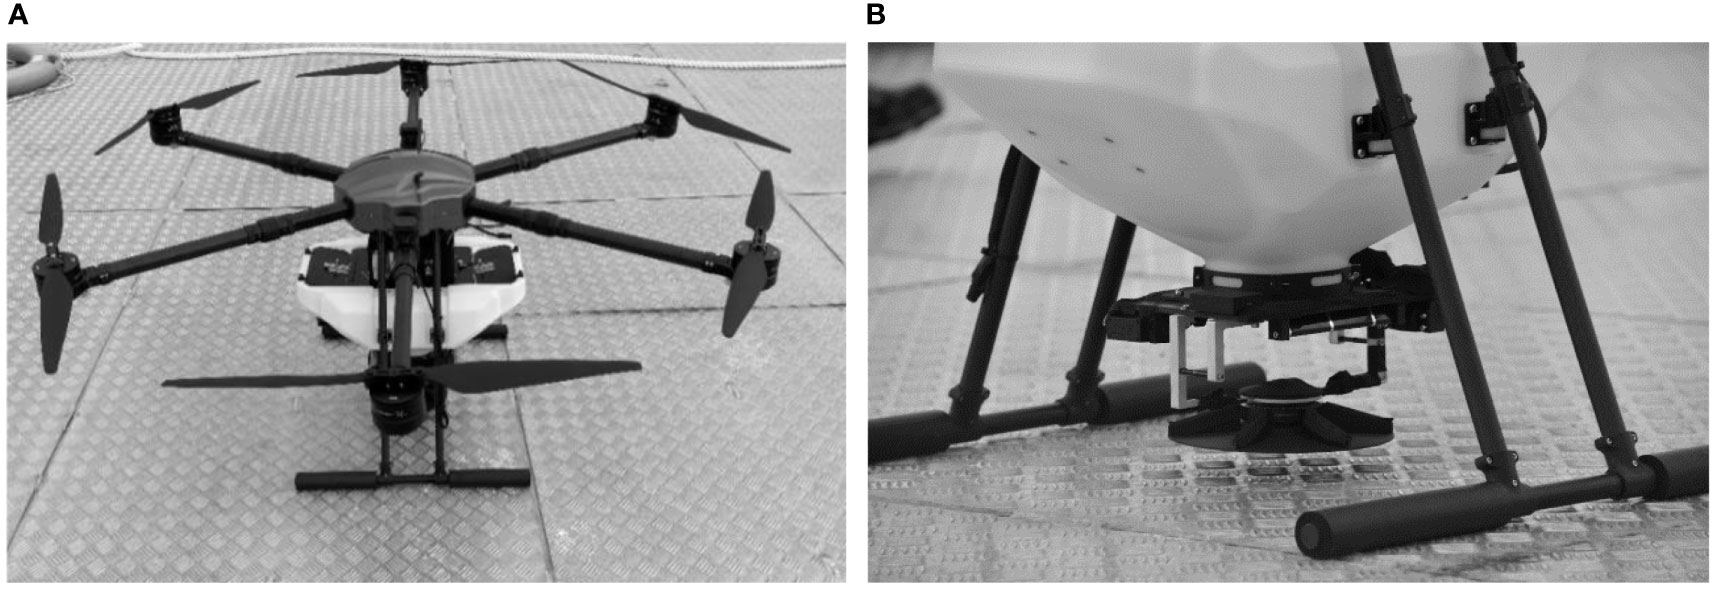
Figure 4 (A) Drone and (B) mounted rotation plate.
Figure 5 shows the BGM pellets distributed on the sea surface using the drone. Figure 5A is the top view at the moment of dropping the BGM and Figure 5B shows the artificial bubble cluster on the sea surface after dropping the pellets.
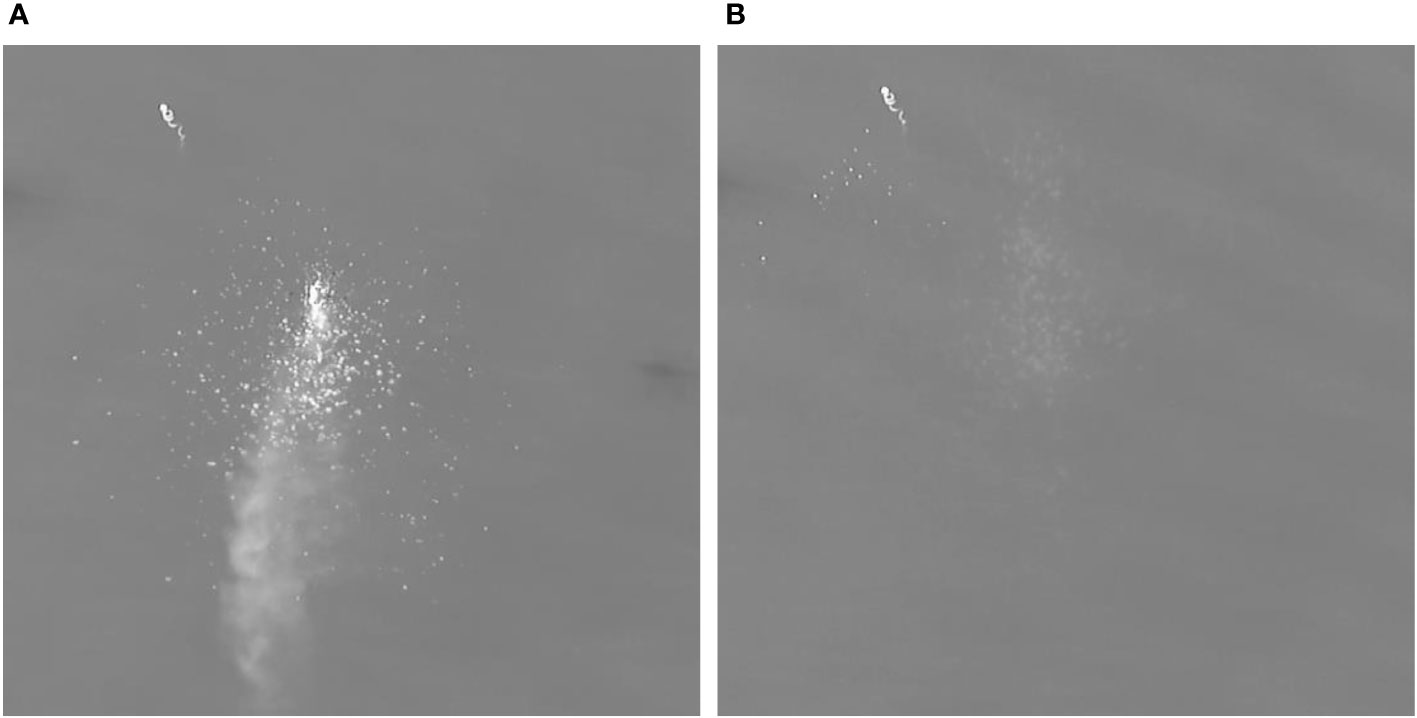
Figure 5 Top views of distributed results of the BGM: (A) at the moment of dropping the BGM; (B) distributed bubble cluster after dropping.
To measure the backscattering strength of the artificial bubbles, the ADCP was settled on the sea bottom, after which water current speed data were acquired using its operating software. The acquisition bin size was set to 1 m, which is directly related to its spatial resolution. The distribution of bubbles in the water varies in time and space, and therefore an acoustic ping was transmitted and received at 1-second intervals to characterize the variation of backscattering strength in more detail. Finally, the depth-dependent echo intensities of the four transmitted pings toward different directions were obtained for every second during the experiment.
Measurement parameters of the SSMS can set up more suitable for the experiemnt compared to ADCP. The frequency band was set to 470.0 kHz to avoid acoustic interference and to enhance the resolution relative to that of ADCP (307.2 kHz). To increase the time resolution, the transmission interval was set to 0.1 seconds with a 1.0 ms pulse length to acquire 10 times more pings than the ADCP system. To improve the spatial resolution, the sample rate was set to 64 kHz, which is sampling numer per second, which is the sampling unit. Both measurement devices were mounted horizontally on the sea bottom using a gimbal (Figure 1).
The main measurement was conducted for 90 minutes from 10:00 a.m. to 11:30 a.m., and the CTD (conductivity, temperature, and depth) sensor was operated for 30 minutes before the main measurement to obtain marine environmental changes. Figure 6 shows the observed water temperature, salinity, and sound speed. From 09:35 to 11:35, the profiles of the water temperature and salinity remained largely constant at 15.3°C and 33.6 PSU (Figures 6A, B). In Figure 6C, the sound speed profiles derived from the observed CTD data were also within a relatively constant range of 1,506.2 to 1,506.7 m/s. These constant features are characteristic of the areas surrounding the Korean Peninsula in winter, which is attributed to the coverage of the entire surface layer by the water mass of the Tsushima Warm Current (Lim, 1976). These conditions are very favorable for the acquisition of acoustic data for quantitative analysis.
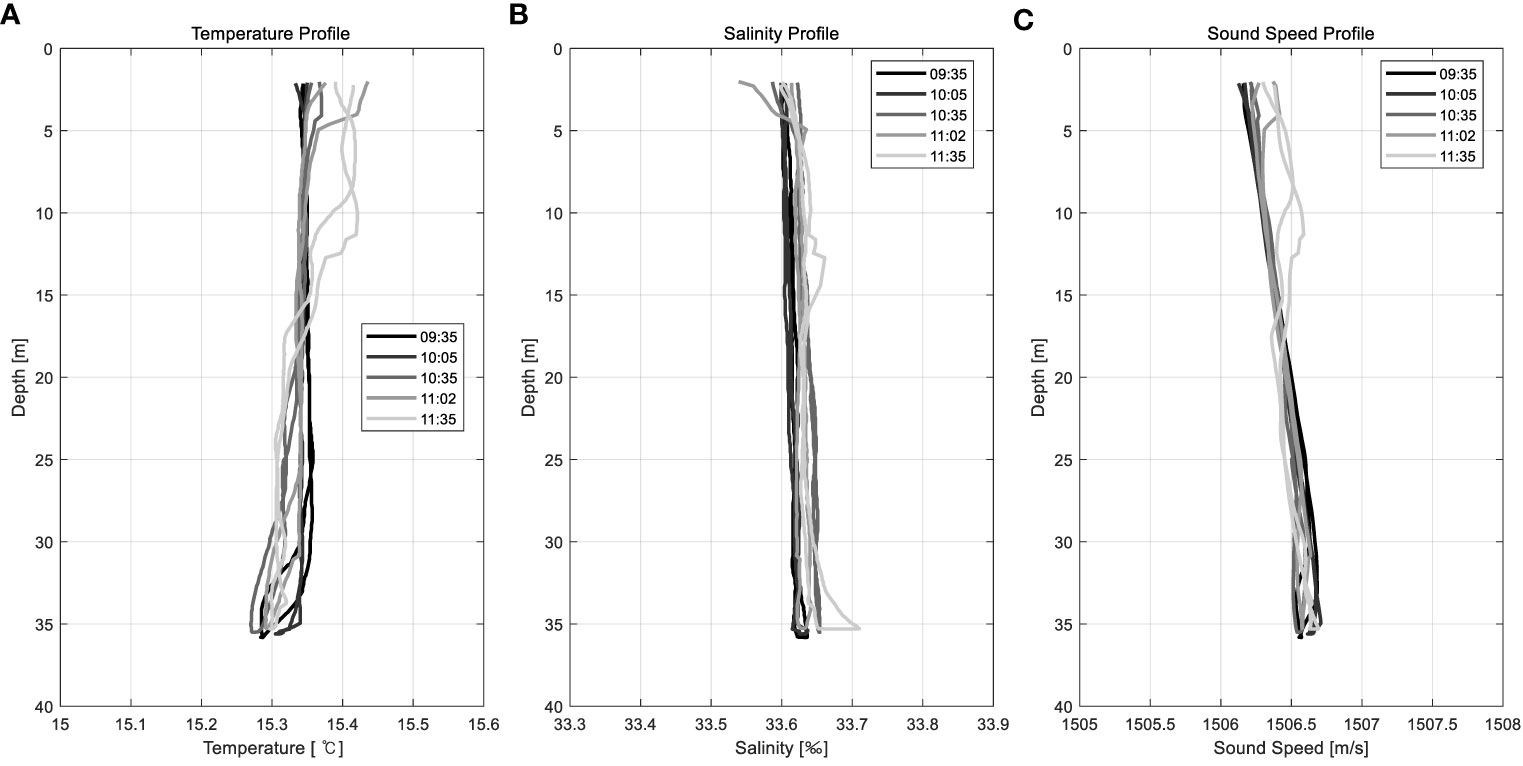
Figure 6 CTD measurement results: (A) water temperature, (B) salinity, and (C) sound speed.
Figure 7 shows the water currents in the experiment site using the Aanderaa RCM Blue 5450 (gray arrow) and Aanderaa Seaguard II DCP (black arrow) instruments, both of which are water current measurement sonars. The RCM was deployed at 3.4 m and 8.4 m depths with 1 minutes intervals, and the DCP system was moored at depths of 6.0 to 24.5 m with a depth interval of 0.5 m and a time interval of 10 minutes. In Figure 7, the lengths of the arrows represent the current speed and the arrow directions represent the direction of the current. Comparing the data of the RCM system installed at a depth of 8.4 m with the data of the DCP system moored at a depth of 8.5 m, the overall speed and direction of the water current were largely equal.
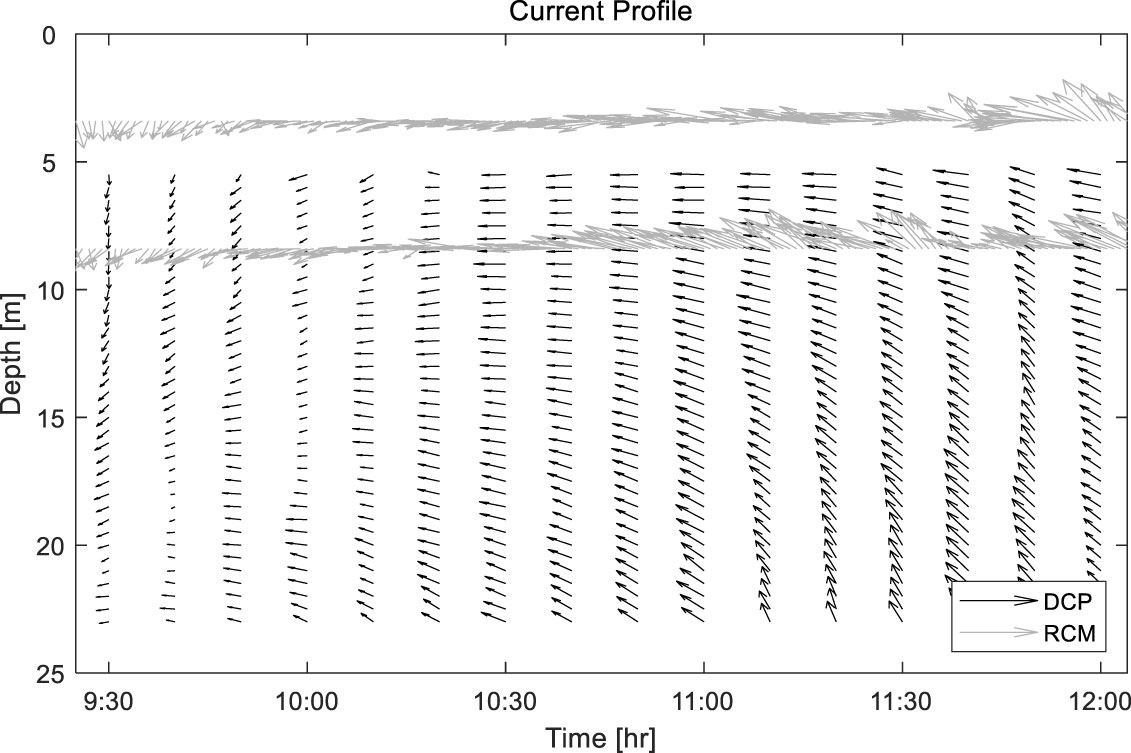
Figure 7 Measurement results of the water/tidal current.
From 10:00 a.m. to 11:30 a.m., the direction of the water current according to the RCM changed from a southwest direction (240°) to a west direction (280°) at a depth of 3.4 m with an average speed of 4.5 cm/s. At a depth of 8.4 m, the direction of the water current changed from a southwest direction (240°) to a northwest direction (300°) with an average speed of 5.2 cm/s. The water current measured by DCP showed a directional change from 250° to 320° with an average speed of 4.9 cm/s. Therefore, the observed water current changes determined using the two instruments were almost identical to each other. Although the depth-dependent speed changes of the water current measured using the DCP system were not significant, the waters appeared to rotate clockwise as depth increased. Particularly, the rotation of the water current increased with depth at 11:00. The rotation angles at 6 m and 23.5 m depths were 274° and 329°, respectively.
Upon analyzing the variability of the water current with depth and time, the current speed during the measurement was approximately 4.9 cm/s, meaning that the BGM pellets did not move substantially from the experiment site. As time goes by and the depth increases, the water current rotated from southwest to northwest (i.e., clockwise) but the difference in the direction of the current was small (within 60°). These findings suggested that the BGM pellets may have moved in an almost constant direction while they sank into the water column. Therefore, the measured results were highly reliable because the marine environment was ideal, similar to the indoor watertank.
In this sea experiment, the backscattering stength of the bubble cluster was obtained using ADCP. The measured acoustic signal from ADCP was converted to backscattering stength based on the equation described in Section 2.
Figure 8 shows two-dimensional (2-D) sections for the backscattering strength converted from the echo intensity recorded using the ADCP for 4,500 seconds. In the figure, the x-axis represents time (or ping number) and the y-axis indicates the distance from the sea bottom. Figures 8A-D correspond to beam 1 and beam 4, respectively. The backscattering strength shown in Figure 8C was the strongest, meaning that the BGMs were mainly distributed near the direction of beam 3. From these results, it is possible to identify the distribution characteristics of BGM that are difficult to directly confirm in sea experiments. Based on the results of this analysis, we mainly used data from beam #3.
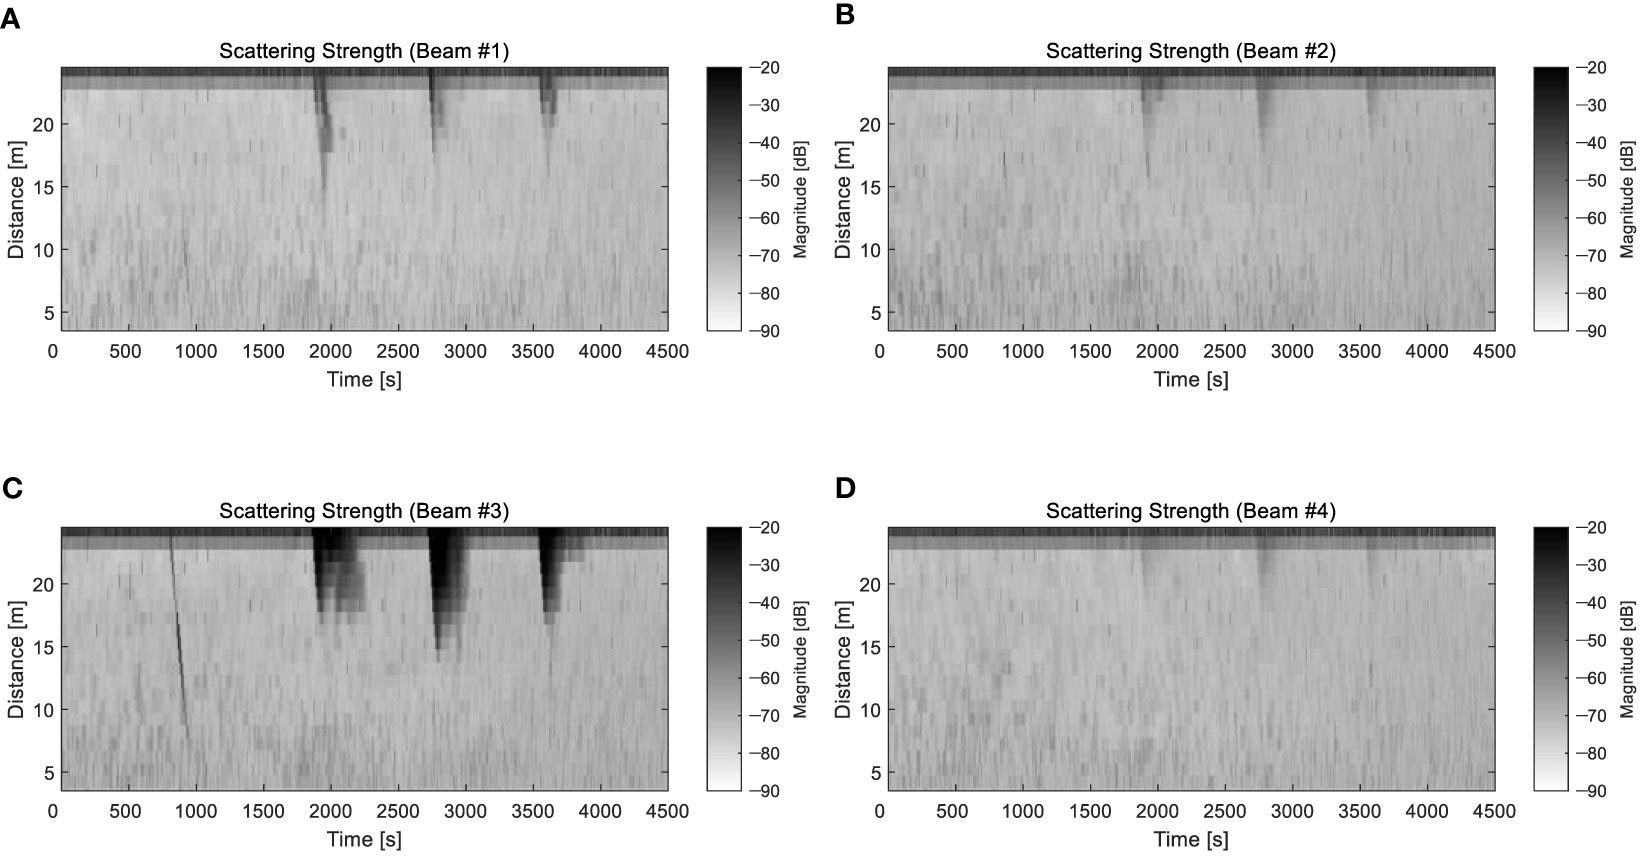
Figure 8 Backscattering strength derived from ADCP data: beams (A) #1, (B) #2, (C) #3, and (D) #4 of the ADCP.
Artificial bubbles are continuously created as the BGM sinks. Therefore, to understand the distribution characteristics of bubble clusters, it is necessary to understand the sinking characteristics of the BGM. In this experiment, we attempted to understand the characteristics of the bubble cluster created as the BGM sinks by comparing it with the sea experimental results using the BGM Mock-up model. Figure 9 shows 2-D sections of the backscattering strength of the reference experiment (mock-up model) and the artificial bubble (BGM) experiments derived using beam #3 of the ADCP, which is the direction in which the recorded backscattering strength was the strongest, as shown in Figure 8C. Figure 9A shows the result when mock-up models that do not generate artificial bubbles were dropped as a reference. Figures 9B-D show the backscattering strengths of the artificial bubbles of the different BGM dropping experiments with a white contour line indicating –50 dB. When the mock-up model was dropped, only the reflected signal by the models could be identified, and it was confirmed that the sinking speed was approximately 13 cm/s based on the change in water depth over time, which was in good agreement with our desired value. In the figure, the backscattering signals by the mock-up models were identified only to a depth of approximately 15 m from the sea surface. This indicates that the available observation depth in the steering direction using ADCP was approximately 15 m from the surface. Our experiments also confirmed the generation of artificial bubbles as the BGM pellets sank (Figures 9B-D). The backscattering signal was weakened due to a gradual dissipation of bubbles in the lower part of the bubble cluster. Therefore, our results not only allowed for the estimation of the sinking speed of the BGM pellets but also demonstrated that the artificial bubbles occurred at depths of up to 8–10 m from the surface. Additionally, our observations confirmed that the generated bubbles persisted for more than a few minutes. Figure 10 shows the depth-dependent backscattering strength of the reference data at the time indicated by the vertical white dashed line in Figure 9A. Figure 10A shows the individual backscattering strength of the four steering beams. In beam #3, the backscattering strength by the mock-up models reached –25.0 to –30.0 dB, whereas the scattering strength at other depths (except near the sea surface) was approximately –65.0 and –70.0 dB and remained mostly constant. In general, the backscattering strength increases as it reaches the sea surface due to the presence of floating particles moved by the wind, waves, and tidal currents, and these characteristics are shown in Figure 10A. Our results were generally 15.0 dB higher than the backscattering strength of –80.0 and –85.0 dB observed in our previous watertank study (Bae et al., 2022). Figure 10B compares the backscattering strength derived from the sonar equation in Equation (1) with the result obtained using the method described in the previous study, which was provided by the manufacturer. Both methods exhibited similar trends, but some quantitative bias errors were observed. We estimated that these biases derived from some differences between the approaches. Specifically, the transmission loss for the manufacturer’s method does not account for the characteristics of the area including the absorption. Furthermore, parameter correction for water temperature is also required for the manufacturer’s approach, but this was not taken into account.
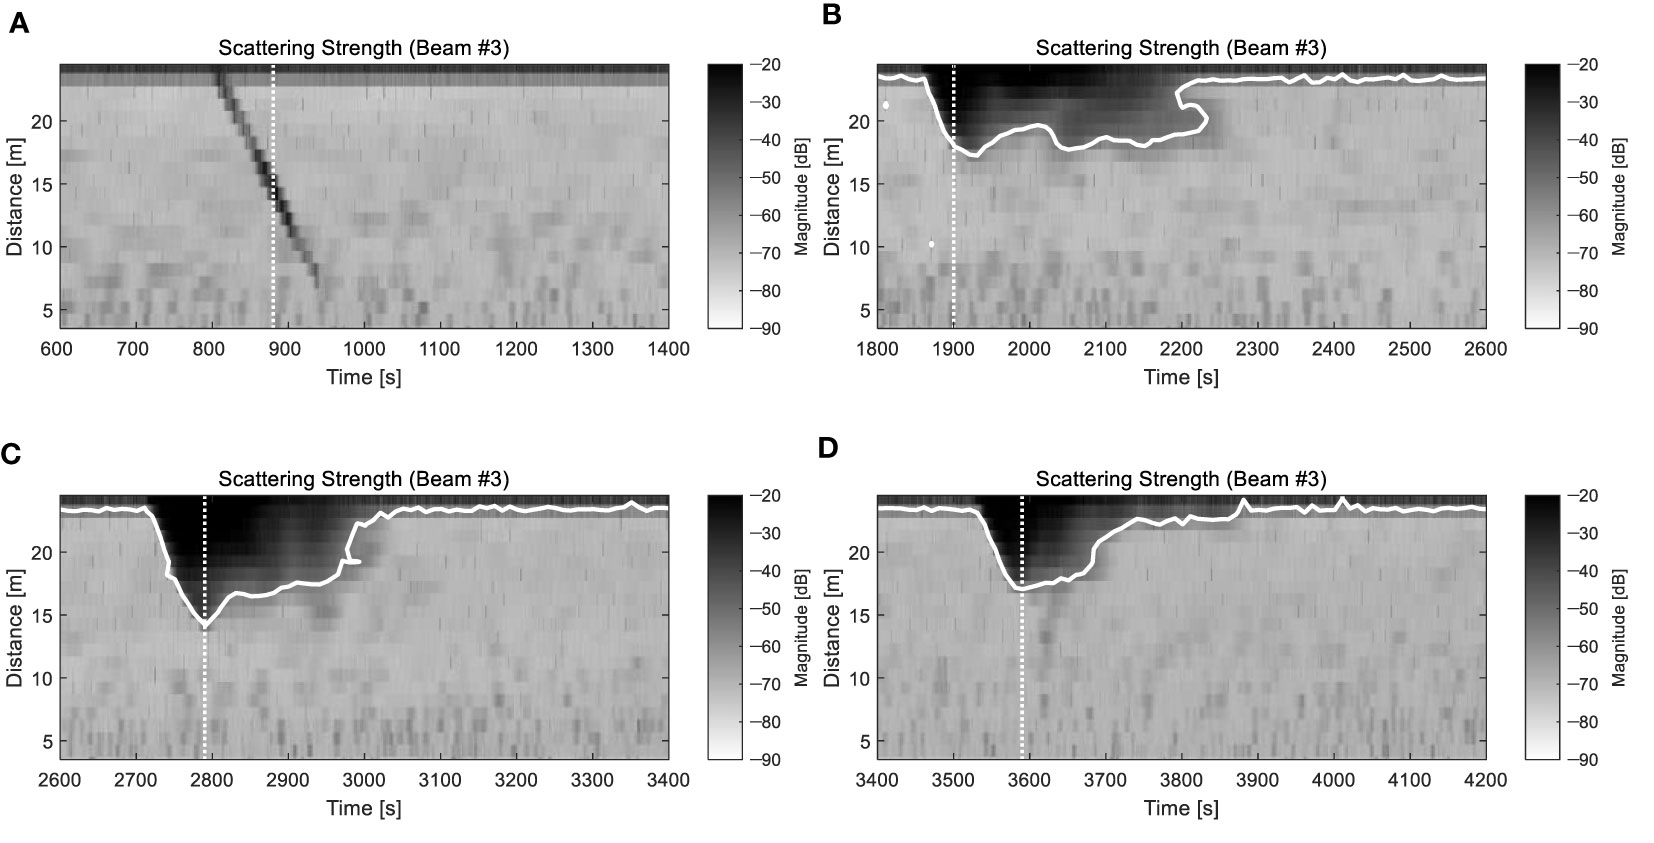
Figure 9 (A) Reference backscattering strength and (B-D) backscattering strengths of the bubble cluster for different BGM dropping experiments.
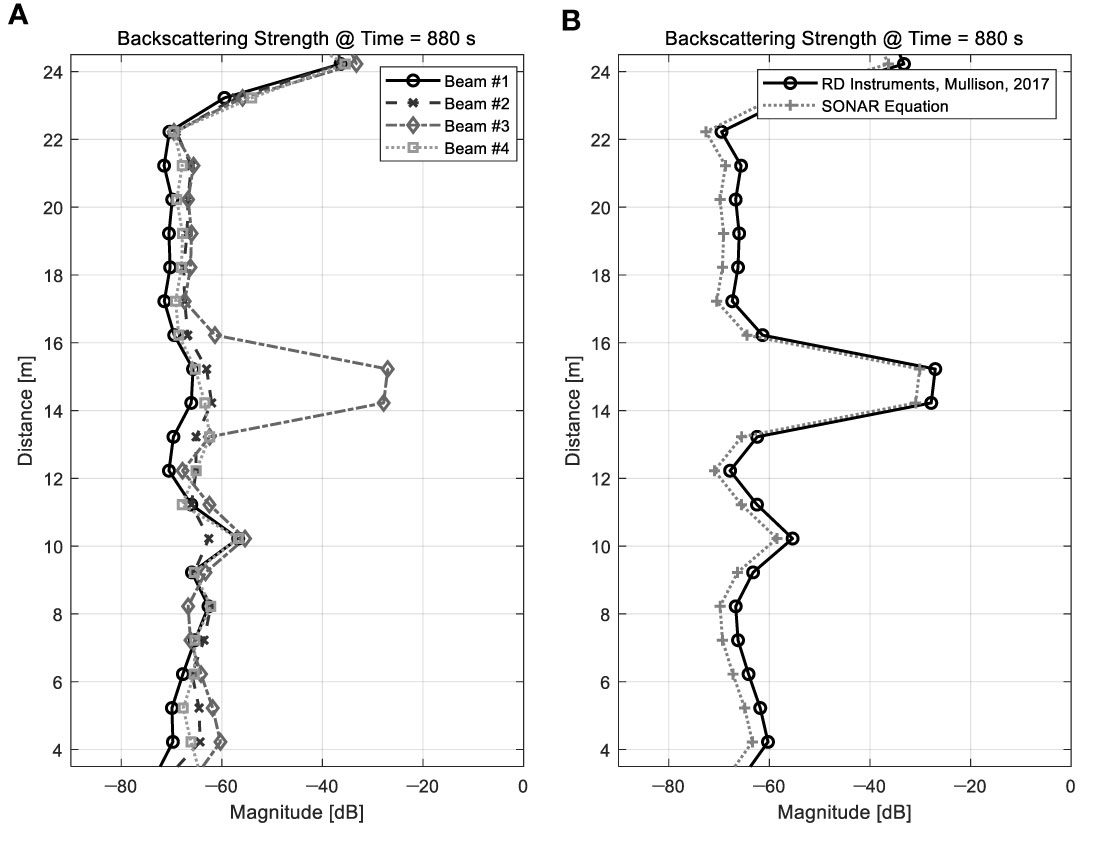
Figure 10 Backscattering strength profiles for the mock-up models: (A) each beam responses and (B) converted results with different equations.
Figure 11 shows the magnitude of the backscattering strength for each depth at the time indicated by the vertical white dashed line in the presence of the artificial bubbles depicted in Figures 10B-D. The results for the four steering beams are shown together. Although there were slight differences in the results of the three experiments due to the spatiotemporal variations of the marine environment, the magnitude of the backscattering strength by the bubble cluster increased up to 50.0 dB compared to when there were no bubbles. These results are also consistent with those of our previous watertank experiments (Bae et al., 2022). In the vicinity of the sea surface, the maximum backscattering strength was calculated at approximately –10.0 dB, and assuming –50.0 dB as the bubble boundary, the distribution depth of the artificial bubbles used in the experiment was estimated to range from 8.0 to 10.0 m. These results indicate that the backscattering strength of artificial bubbles can be effectively measured through sea experiments using ADCP.
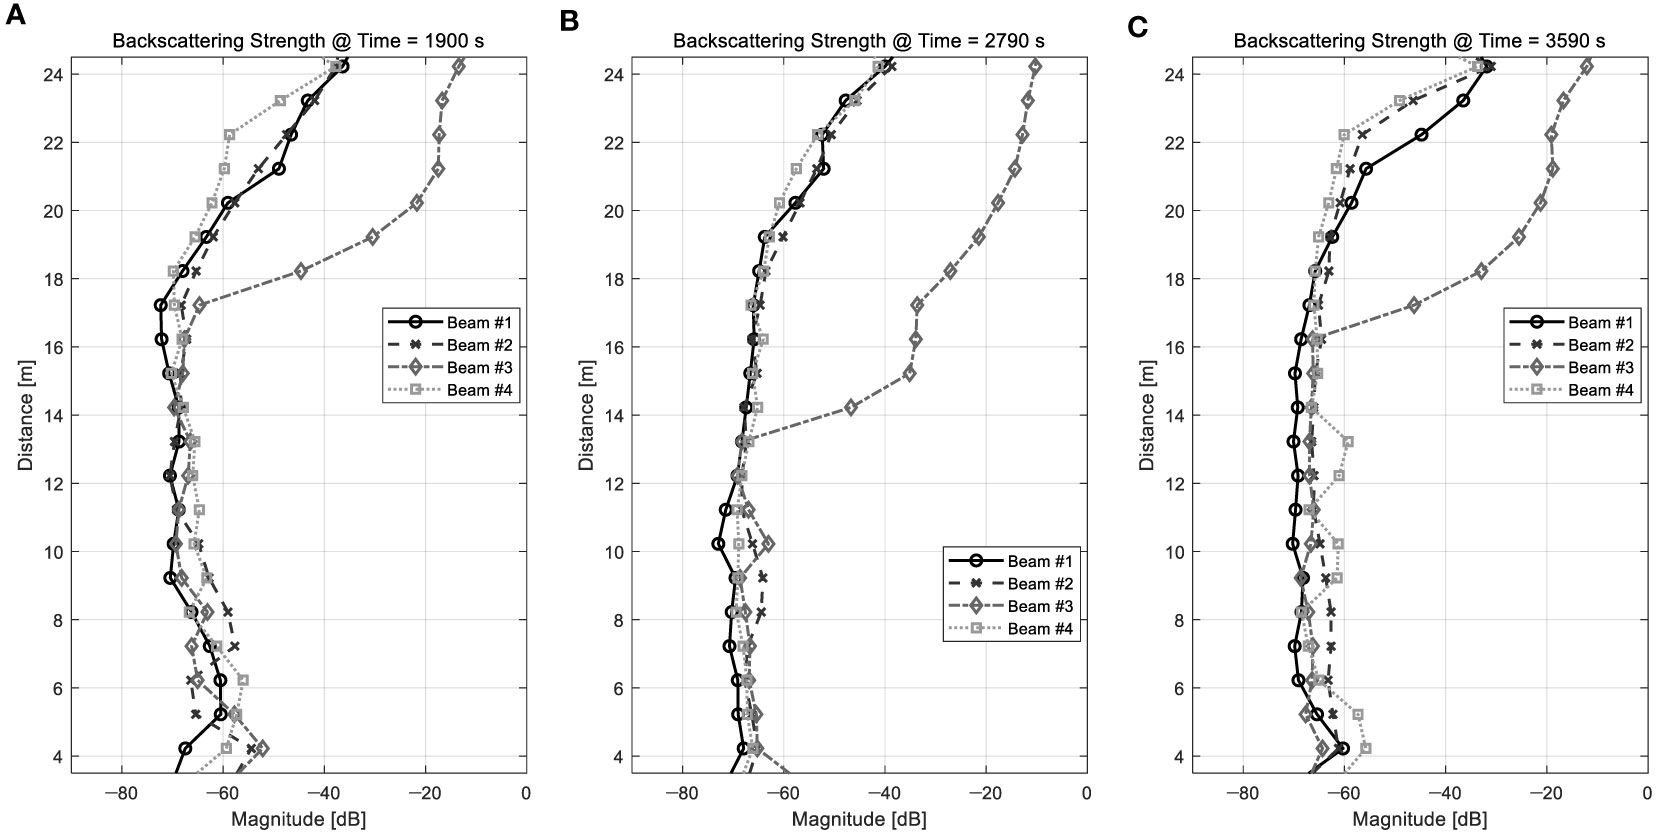
Figure 11 Backscattering strength profiles for the bubble cluster obtained by ADCP: (A) 1,900 s, (B) 2,790 s, and (C) 3,590 s.
Using ADCP, we were able to effectively measure the backscattering strength of the artificial bubbles. However, ADCP is a device that steers a beam with a specific frequency in a specific direction. Therefore, some verifications are needed because unwanted distortions may occur. For this reason, we developed SSMS with high resolution and vertical beam steering, and attempted to compare the results of maritime experiments using SSMS with the results obtained through ADCP for verification.
Figure 12A shows the calculated backscattering strength of the mock-up model (i.e., without artificial bubbles) and corresponds to the case illustrated in Figure 9A. The constructed SSMS allowed for the acquisition of data with higher temporal and spatial resolutions than the ADCP. Moreover, the ADCP results could not be observed at a depth of ≥15 m from the sea surface due to the tilted steering beam angle. In contrast, the beam of the SSMS was toward the sea surface directly and therefore the acquired data could be observed for all depths. Figure 12B shows the results of the backscattering strength acquired by the SSMS for the same experiment illustrated in Figure 9C, which corresponds to the ADCP data obtained in the presence of artificial bubbles. The calculated backscattering strength was very similar to that of our ADCP experiments. Furthermore, the identified characteristics in the ADCP data were also observed with very high resolution.
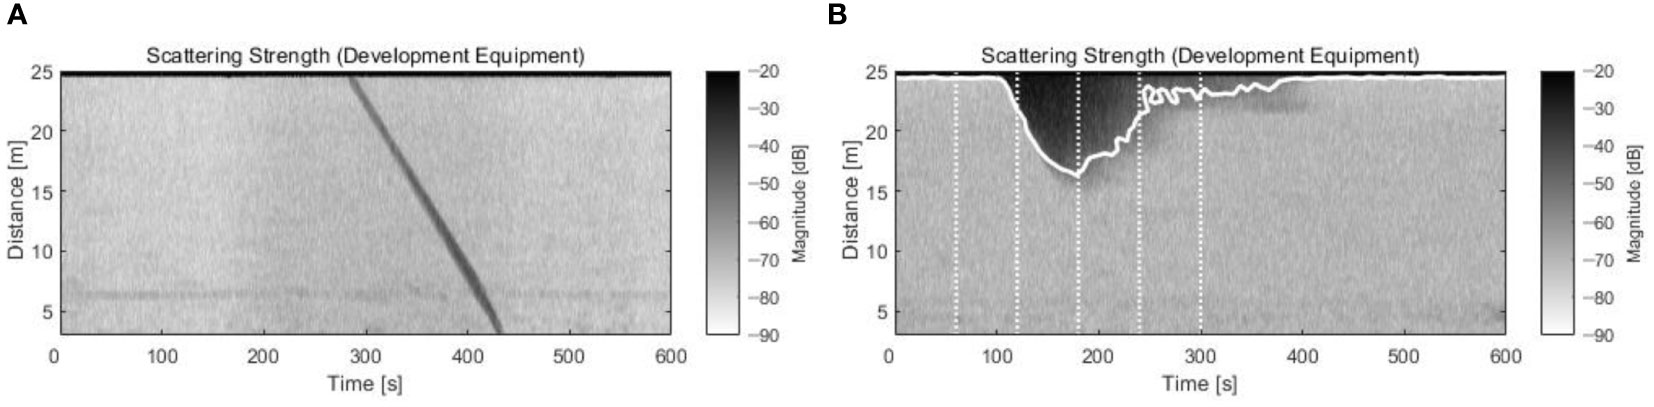
Figure 12 Backscattering strength obtained from the SSMS: (A) mock-up model and (B) bubble cluster data.
Figure 13A shows the backscattering strength profiles at 180 seconds, when the bubbles reached their maximum depth in the water column (Figure 12B). In the figure, the dashed lines represent the raw data, whereas the solid line represents the results after applying a moving average. The processed results exhibited similar trends and magnitudes compared to the ADCP #3 beam data in Figure 11B, and therefore our results validated the ADCP data. Figure 13B shows the backscattering strengths of the artificial bubbles at different times with 60-second intervals (vertical dotted white lines in Figure 12B). According to our results, the backscattering strength increases from the vicinity of the sea surface to the bottom as the bubble cluster extended. Additionally, the backscattering strength at a depth of less than 10 m from surface increased gradually from its original magnitude at 60 seconds to the magnitude at 180 seconds, which values is the strongest magnitude, and decreased gradually.
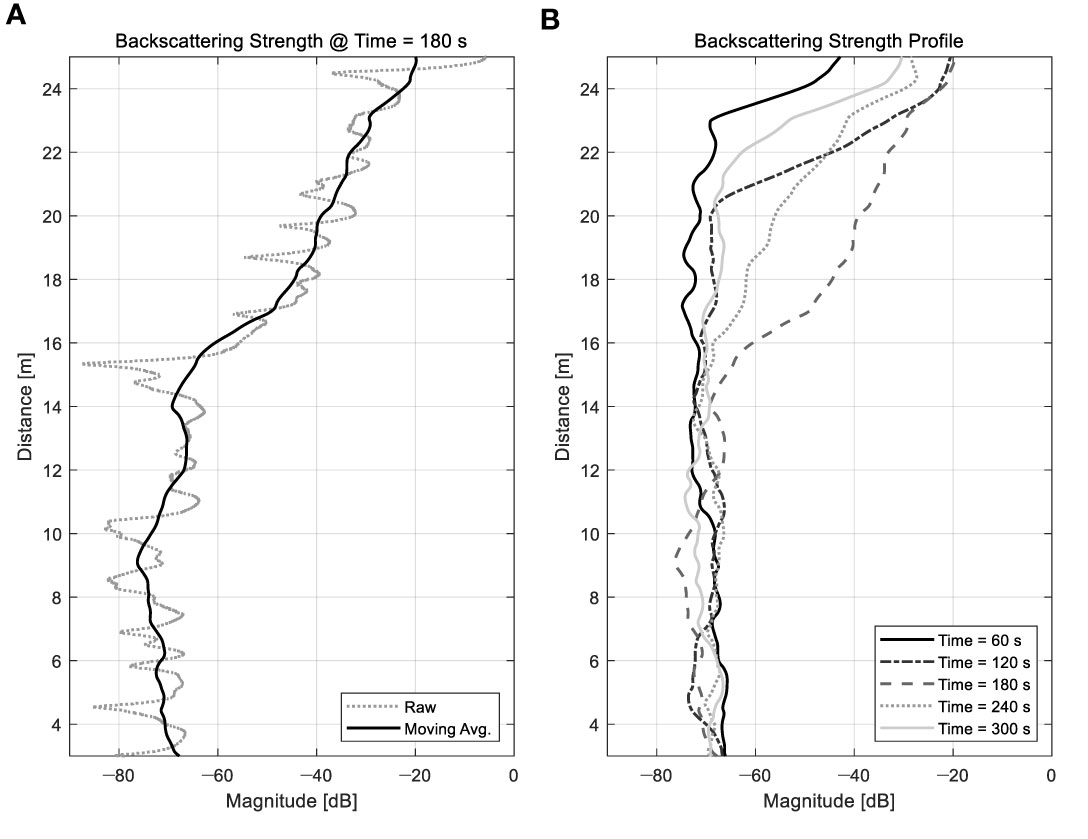
Figure 13 Backscattering strength profiles for the bubble cluster obtained by the SSMS: (A) raw and moving average example and (B) result profiles with different time represented in Figure 12B.
The study of bubble characteristics in water is not only important in the field of natural sciences but also provides a basis for the development of military technology. Particularly, measuring the acoustic characteristics of artificial bubbles is the first step toward their military application. In our previous study, we measured the acoustic characteristics of artificial bubble clusters generated by BGM pellets in an ideal watertank environment. In this study, we measured the acoustic characteristics of artificial bubbles in a real marine environment where, unlike in controlled laboratory conditions, the water temperature, salinity, and concentrations of organic and inorganic compounds change in a time- and space-dependent manner.
To quantitatively measure the acoustic properties of artificial bubbles in a real ocean environment, a sea site suitable for our experimental purposes was selected in the southern sea of the Korean Peninsula. Additionally, to avoid any interference between the bubbles generated by the BGM pellets and other materials during the dropping, the BGMs were remotely dropped using a drone.
During the measurements, water temperature and salinity were largely constant throughout the entire layer, thus mimicking the ideal conditions of a watertank. Because the measurement was carried out during a neap tide, the observed current speed was approximately 4.9 cm/s, thus providing ideal conditions to conduct our experiments.
To obtain the backscattering strength of the artificial bubbles, echo intensities were acquired using an ADCP. Moreover, the ADCP approach was validated by comparing its measurement results with those obtained with the SSMS. The measured results for each BGM dropping experiment showed similar trends. Specifically, artificial bubbles were generated as the BGM sank and backscattering strength weakened as bubbles began to dissipate from the lower part of the cluster. In addition to observing the acoustic characteristics of the artificial bubbles, physical properties were also evaluated, such as the sinking speed of the BGM pellets.
Our experimental design had some inherent limitations because real marine environments change considerably in a time- and space-dependent manner. However, the measurement method proposed herein is expected to be highly applicable because it provides a simple way to measure the acoustic signatures of bubbles in water. Collectively, our findings demonstrated that our proposed approach could be applied not only for the exploration of basic science concepts but also for the development of military applications.
The datasets presented in this article are not readily available because of national security issues. Requests to access the datasets should be directed to corresponding author Won-Ki Kim, a29uZWtlZUBjaHVuZ2J1ay5hYy5rcg==.
HB: Investigation, Resources, Software, Visualization, Writing – original draft. W-KK: Conceptualization, Investigation, Validation, Writing – review & editing.
The author(s) declare financial support was received for the research, authorship, and/or publication of this article. This work was supported by the Agency for Defense Development by the Korean Government (912763101).
The authors declare that the research was conducted in the absence of any commercial or financial relationships that could be construed as a potential conflict of interest.
All claims expressed in this article are solely those of the authors and do not necessarily represent those of their affiliated organizations, or those of the publisher, the editors and the reviewers. Any product that may be evaluated in this article, or claim that may be made by its manufacturer, is not guaranteed or endorsed by the publisher.
Bae H. S., Kim W.-K., Son S.-U., Kim W.-S., Park J.-S. (2022). An estimation of the backscattering strength of artificial bubbles using an acoustic Doppler current profiler. Sensors 22, 1812. doi: 10.3390/s22051812
Caruthers J. W., Stanic S. J., Elmore P. A., Goodman R. R. (1999). Acoustic attenuation in very shallow water due to the presence of bubbles in rip currents. J. Acoust. Soc Am. 106, 617–625. doi: 10.1121/1.427030
Culver R. L., Trujillo M. F. (2007). “Measuring and modeling bubbles in ship wakes, and their effect on acoustic propagation,” in Proceedings of the 2nd International Conference on Underwater Acoustic Measurements: Technologies and results. (Greece: FORTH, Crete), 25–29 June.
Dahl P. H. (2003). The contribution of bubbles to high-frequency sea surface backscatter: A 24-h time series of field measurements. J. Acoust. Soc Am. 113, 769–780. doi: 10.1121/1.1532029
Deines K. L. (1999). “Backscatter estimation using broadband acoustic Doppler current profilers,” in Proceedings of the IEEE Sixth Working Conference on Current Measurement (Cat. No. 99CH36331), San Diego, CA, USA, 13 March 1999 (Piscataway, NJ, USA: IEEE), 249–253.
Guelou Y., Mourry P., Gillot C. (2002). EP Patent 00942865. Muret (FR): Etienne Lacroix Tous Artifices S.A.
Guelou Y., Mourry P., Gillot C. (2005). US Patent 06889590. Muret (FR): Etienne Lacroix Tous Artifices S.A.
Gulf of Mexico Expedition (2011). Available at: https://oceanexplorer.noaa.gov/okeanos/explorations/ex1105/welcome.html (Accessed 17 March 2022).
Ji Y.-H., Lee J.-H., Kim J.-S., Kim J.-H., Kim W.-S., Choi S.-M. (2009). Modeling of scattered signal from ship wake and experimental verification. J. Acoust. Soc Korea. 28, 10–18.
Jurng M. S. (1996). Estimation of zooplankton biomass by volume scattering strength in coastal waters (Seoul, Korea: Ph.D. Thesis, Seoul National University).
Karoui I., Quidu I., Legris M. (2015). Automatic sea-surface obstacle detection and tracking in forward-looking sonar image sequences. IEEE Trans. Geosci. Remote Sens. 53, 4661–4669. doi: 10.1109/TGRS.2015.2405672
Keiffer R. S., Novarini J. C., Norton G. V. (1995). The impact of the background bubble layer on reverberation-derived scattering strengths in the low to moderate frequency range. J. Acoust. Soc Am. 97, 227–234. doi: 10.1121/1.412990
Leighton T. G., Finfer D. C., Chua G. H., White P. R. (2011). Clutter suppression and classification using twin inverted pulse sonar in ship wakes. J. Acoust. Soc Am. 130, 3431–3437. doi: 10.1121/1.3626131
Li H., Li S., Chen B., Xu C., Zhu J., Du W. (2014). Research on ship wake acoustic imaging based on multi-beam sonar (NL, Canada: 2014 Oceans – St. John’s).
Lim D. B. (1976). The movements of the waters off the south coast of Korea. J. Oceanol. Soc Korea. 11, 77–88.
Mullison J. (2017). “Backscatter estimation using broadband acoustic Doppler current profilers-updated,” in Proceedings of the ASCE Hydraulic Measurements & Experimental Methods Conference, (Durham, NH, USA: ASCE), 9–12 July.
Park C., Jeong S. W., Kim G. D., Park Y., Moon I., Yim G. (2021). An empirical model of air bubble size for the application to air masker. J. Acoust. Soc Korea. 40, 320–329. doi: 10.7776/ASK.2021.40.4.320
Rustemeier J., Griesmann T., Rolfes R. (2012). Underwater sound mitigation of bubble curtains with different bubble size distributions. In Proceedings of Meetings on Acoustics, 17, 070055 (Edinburgh, Scotland).
Schneider von Deimling J., Brockhoff J., Greinert J. (2007). Flare imaging with multibeam systems: Data processing for bubble detection at seeps. Geochem. Geophys. Geosyst. 8, Q06004. doi: 10.1029/2007GC001577
Schneider von Deimling J., Weinrebe W. (2014). Beyond bathymetry: Water column imaging with multibeam echo sounder systems. Hydrographische. Nachrichten. 31, 6–10.
Stanic S., Caruthers J. W., Goodman R. R., Kennedy E., Brown R. A. (2009). Attenuation measurements across surface-ship wakes and computed bubble distributions and void fractions. IEEE J. Ocean. Eng. 34, 83–92. doi: 10.1109/JOE.2008.2008411
Trevorrow M. V. (2003). Measurements of near-surface bubble plumes in the open ocean with implications for high-frequency sonar performance. J. Acoust. Soc Am. 114, 2672–2684. doi: 10.1121/1.1621008
United States Office of Scientific Research and Development. (1946). National Defense Research Committee, Issuing Body (The Physics of Sound in the Sea, Washington D.C.: Office of Scientific Research and Development, National Defense Research Committee, Division 6).
Urban P., Koser K., Greinert J. (2017). Processing of multibeam water column image data for automated bubble/seep detection and repeated mapping. Limnol. Oceanogr.: Methods 15, 1–21. doi: 10.1002/lom3.10138
Keywords: backscattering strength, artificial bubble, acoustic Doppler current profiler, sea experiment, military technology
Citation: Bae HS and Kim W-K (2024) Measurement of backscattering strength of artificial bubbles in the Southern Sea of the Korean Peninsula. Front. Mar. Sci. 10:1341989. doi: 10.3389/fmars.2023.1341989
Received: 21 November 2023; Accepted: 29 December 2023;
Published: 19 January 2024.
Edited by:
Xuebo Zhang, Northwest Normal University, ChinaReviewed by:
Guangming Li, PLA Academy of Military Sciences, ChinaCopyright © 2024 Bae and Kim. This is an open-access article distributed under the terms of the Creative Commons Attribution License (CC BY). The use, distribution or reproduction in other forums is permitted, provided the original author(s) and the copyright owner(s) are credited and that the original publication in this journal is cited, in accordance with accepted academic practice. No use, distribution or reproduction is permitted which does not comply with these terms.
*Correspondence: Won-Ki Kim, a29uZWtlZUBjaHVuZ2J1ay5hYy5rcg==
Disclaimer: All claims expressed in this article are solely those of the authors and do not necessarily represent those of their affiliated organizations, or those of the publisher, the editors and the reviewers. Any product that may be evaluated in this article or claim that may be made by its manufacturer is not guaranteed or endorsed by the publisher.
Research integrity at Frontiers
Learn more about the work of our research integrity team to safeguard the quality of each article we publish.