 Wei Guo
 Juan Liu
 Guojun Xu1
 Guangming Li
 Pan Xu
94% of researchers rate our articles as excellent or good
Learn more about the work of our research integrity team to safeguard the quality of each article we publish.
Find out more
ORIGINAL RESEARCH article
Front. Mar. Sci., 17 January 2024
Sec. Ocean Observation
Volume 10 - 2023 | https://doi.org/10.3389/fmars.2023.1341198
This article is part of the Research TopicOcean Observation based on Underwater Acoustic Technology, volume IIView all 23 articles
Research on ocean ambient noise is highly important for environment monitoring, marine mammal protection, underwater communication and navigation. In this paper, we present the long-term statistics and wind dependence of near-bottom and deep-sea ambient noise in the northwest South China Sea, at a depth of 1240 m. The data were collected from 11th July 2022 to 31st December 2022 together with local wind speeds ranging from 1 to 58 knots (two typhoons involved), and the processing frequency band is between 20 and 2000 Hz. The long-term mean noise level is calculated along with its skewness, kurtosis and percentile distributions. Diurnal and monthly average of noise levels are analyzed, and the large fluctuations in lower (≤100 Hz) and higher (≥400 Hz) frequencies are respectively caused by the variation of the number of nearby and distant ships and the diverse distributions of the windspeeds in individual months. We find that the noise level in winter (Dec.) is 10~11 dB higher than that in summer (Jul.) at higher frequencies. The probability densities of noise levels in the situation of a fixed wind speed are likely to obey the Burr distributions in low frequencies (50 and 100 Hz) and the Weibull distributions in high frequencies (400 and 1000 Hz). In addition, the mean noise levels for different Beaufort scales match well with the 5-dB-addtion Wenz curves, and a mathematic relationship is acquired between the noise level and wind speed in the experimental site. The results are of great representativeness, and are significant to data-driven noise modelling, evaluation and improvement of sonar performance in the region of South China Sea with an incomplete deep-water sound channel.
Ocean ambient noise has been studied and measured for several decades, and a considerable amount of research has been performed to analyze the statistics and characteristics of ambient noise. Most notable is the approximate empirical law proposed by (Wenz, 1962) that ambient noise is a composite of multiple components, generated by distinct types of sources. These noise sources vary in origin, frequency and time period (Hildebrand, 2009). In general, earthquake activity and surface wave interactions dominate ocean ambient noise at the frequencies less than 10 Hz, anthropogenic noise from ships and natural noise driven by wind compete in the frequency band from 50 to 500 Hz. Wind-driven noise dominates between 500 Hz to 25 kHz, and its generation is due to the interaction of the wind with the sea surface (Deane and Stokes, 2002). Earlier studies have pointed out that the level of wind-driven noise is locally dependent on the wind speed in the vicinity of the receiver (Wenz, 1962; Urick, 1983). Additionally, marine animals (Širović et al., 2013; Romagosa et al., 2017) and rainfall events (Medwin et al., 1992) are also contributors of ocean ambient noise, and the generated noise possesses seasonal and occurrent features.
Long-term statistics of ocean ambient noise have been investigated at plenty of locations in the global ocean, ranging from tropical/subtropical Pacific region (Farrokhrooz et al., 2017; Niu et al., 2021; Yang et al., 2023) and South China Sea (Da et al., 2014; Jiang et al., 2017; Shi et al., 2019), and temperate North Pacific region (McDonald et al., 2006; Seger et al., 2015; Schwock and Abadi, 2021), to polar region (Chen and Schmidt, 2017; Bonnel et al., 2021; Mo et al., 2023). The motivation of these previous works is to acquire the diel, monthly or seasonal variations of ambient noise in different areas, and describe the relationship between noise and meteorological data at the recording locations. It has been proven that the environmental conditions and regions in the global ocean can both affect the results of ambient noise level and corresponding spectral characteristics, e.g., diverse wind speeds in regions with different bathymetry profiles and sound speed distributions lead to deviation of wind-driven noise (Barclay and Lin, 2019). As a consequence, it becomes necessary to choose a representative region to analyze the characteristics of ambient noise. The northwest South China Sea is a typical region in which there are significant shipping lanes, incomplete sound channels in deep water (usually indicating a deep-water environment having a sound channel axis and meanwhile the sound speed at water-seabed interface is lower than that at water-air interface), dramatically varying bathymetry profiles and frequent oceanic/atmospheric dynamic processes. But up to the present, there are few studies on long-term statistics and characteristics of ambient noise in this region. The existing long-term observations in South China Sea concerns mostly the noise recorded by hydrophones deployed at the depths above or near the sound channel axis (Jiang et al., 2017; Shi et al., 2019). The near-bottom noise is studied yet in the shallow water region (water depth<200 m) (Da et al., 2014). It is thus valuable to acquire the data and analyze the characteristics of near-bottom ambient noise in the deep-water region of South China Sea having an incomplete deep-water sound channel, since it could provide extra valuable information for subaqueous activities that rely on sound for detection, communication, navigation and echolocation.
In this paper, we investigate the long-term statistics and wind-dependent characteristics of ambient noise using data collected from a noise measurement experiment conducted at a near-bottom deep-water site in the northwest South China Sea. The autonomous, bottom-mounted acoustic recording system was deployed at the deep-water site in the northwest South China Sea at with water depth of 1240 m (marked as the red solid circle in Figure 1). The recorder (hydrophone) was moored near sea bottom with sampling frequency at 4000 Hz and effective bandwidth from 20 to 2000 Hz. The ambient noise data was collected for 5 min every one hour from 11th July 2022 to 31st December 2022. With anomalous, incomplete and pile-driving noise data excluded, the selected dataset consists of 19090 time samples, each of 1 min. The synchronous 10-m wind speed data was provided by Ventusky1 at 7 km resolution in the observing area and at 3h intervals throughout the experimental time period. Monthly variations of noise levels are analyzed. Additionally, distributions of noise levels at a fixed wind speed are discussed, and average noise levels for different wind speed groups (Beaufort scales) are presented, along with the comparison with Wenz curves. The mathematic expression of wind dependence on noise level is acquired, which can be used to predict wind-driven noise levels near the experimental area in South China Sea. The paper’s main contributions are twofold. First, we take the lead in measuring and analyzing the statistics of near-bottom ambient noise in the region of South China Sea with an incomplete deep-water sound channel, giving the detailed results about the spectrogram, diurnal and monthly averages of noise levels. Further, we provide the expression of wind-driven noise levels in the experimental area through regression. These results have representativeness for other incomplete deep-water areas in South China Sea, and can provide guidance on analysis of seasonal and yearly variations of ocean ambient noise in South China Sea, data-driven noise modelling, communications, sonar designing and ocean tomography.
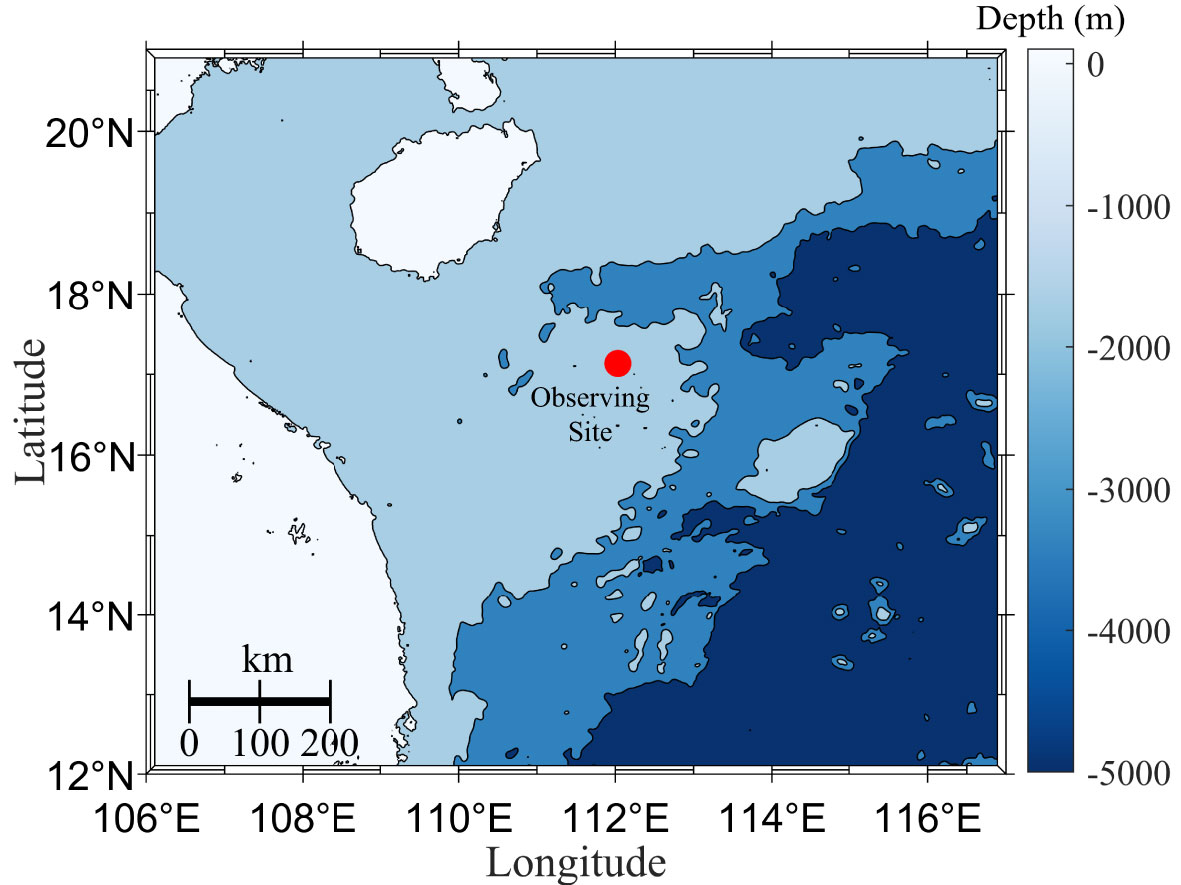
Figure 1 The experimental site in the northwest South China Sea. The red solid circle gives the observing site.
Figure 2 is the spectrogram of the dataset. The processed frequency band is from 20 to 2000 Hz. The raw data for any one hour (5 min) is processed using the Welch’s method with a 10s-Hamming window, and a 50%-overlapping FFT algorithm is introduced, leading to 59 periodograms with frequency resolution given by 0.1 Hz. These resulting periodograms are then averaged and converted to decibels (dB) in the 1/3-octave bandwidth. Here the 1/3-octave frequency band from 20 to 2000 Hz is divided into 21 1/3-octave frequency bands with center frequencies of 20, 25, 31.5, 40, 50, 63, 80, 100, 125, 160, 200, 250, 315, 400, 500, 630, 800, 1000, 1250, 1600 and 2000 Hz. Figure 2 is acquired when repeating the process mentioned above for every 1h data segment until the entire dataset is processed. The 10-m wind speeds (in red solid line, knots) during the experimental period, ranging from 1 to 58 knots, are also overlaid to show the correlation with noise levels. In addition, Figure 2 indicates clearly the effect of the typhoon ‘Nesat’ and ‘Nalgae’ occurred from 16th Oct. to 19th Oct. and from 29th Oct. to 2nd Nov., resp., together with that of a series of strong and rapidly varied wind speeds occurred from 14th Dec. to 18th Dec. It can be roughly seen in Figure 2 that wind speeds and ambient noise levels are very well correlated in the higher frequency band Hz, i.e., higher wind speed correlates with higher noise intensity. Figure 3A shows the detailed spectrogram during the typhoons ‘Nesat’ and ‘Nalgae’, and Figures 3B, C give respectively the relevant variations of ambient noise levels at 100 Hz, 400 Hz and 1000 Hz versus wind speeds. We can see that except for some coincidently abnormal peaks for all the three frequencies, trends of the noise levels at 400 Hz and 1000 Hz basically coincide with wind speeds. Figures 2, 3 indicate there is no obvious correlation between wind speeds and ambient noise levels in the lower frequency band Hz. The specific correlation coefficient between ambient noise and wind speeds will be demonstrated in Sec. 3. By the way, it is noticed that the ambient noise levels during November are much higher than other months in the frequency band from 20 to 200 Hz. It is possibly due to higher shipping noise during that period. Considering that shipping noise depends mainly on the kinds, number, distribution, speeds and tracks of nearby ships and sound propagation, analysis on shipping noise is quite challenging and complicated. Since we focus on the characteristics and wind-dependence of ocean ambient noise, we will not discuss the effect of shipping noise in this paper. More details about shipping noise to interpret the features of low-frequency noise will be studied in future work.
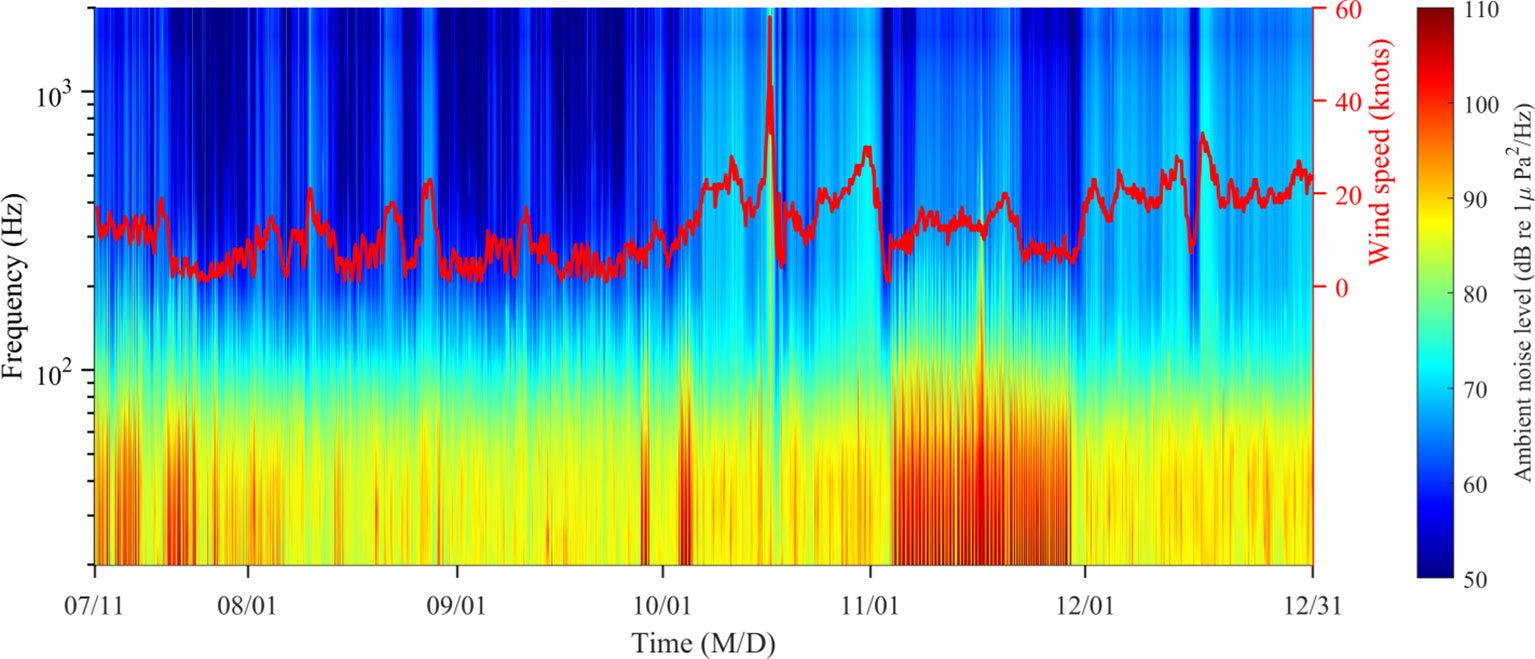
Figure 2 Spectrogram of the ambient noise from 11/07/2022 to 31/12/2022 with wind speed (red solid line, in knots). The frequencies range from 20 to 2000 Hz, and the color bar value represents the noise level in dB re 1 μPa2/Hz. M/D: Month/Day.
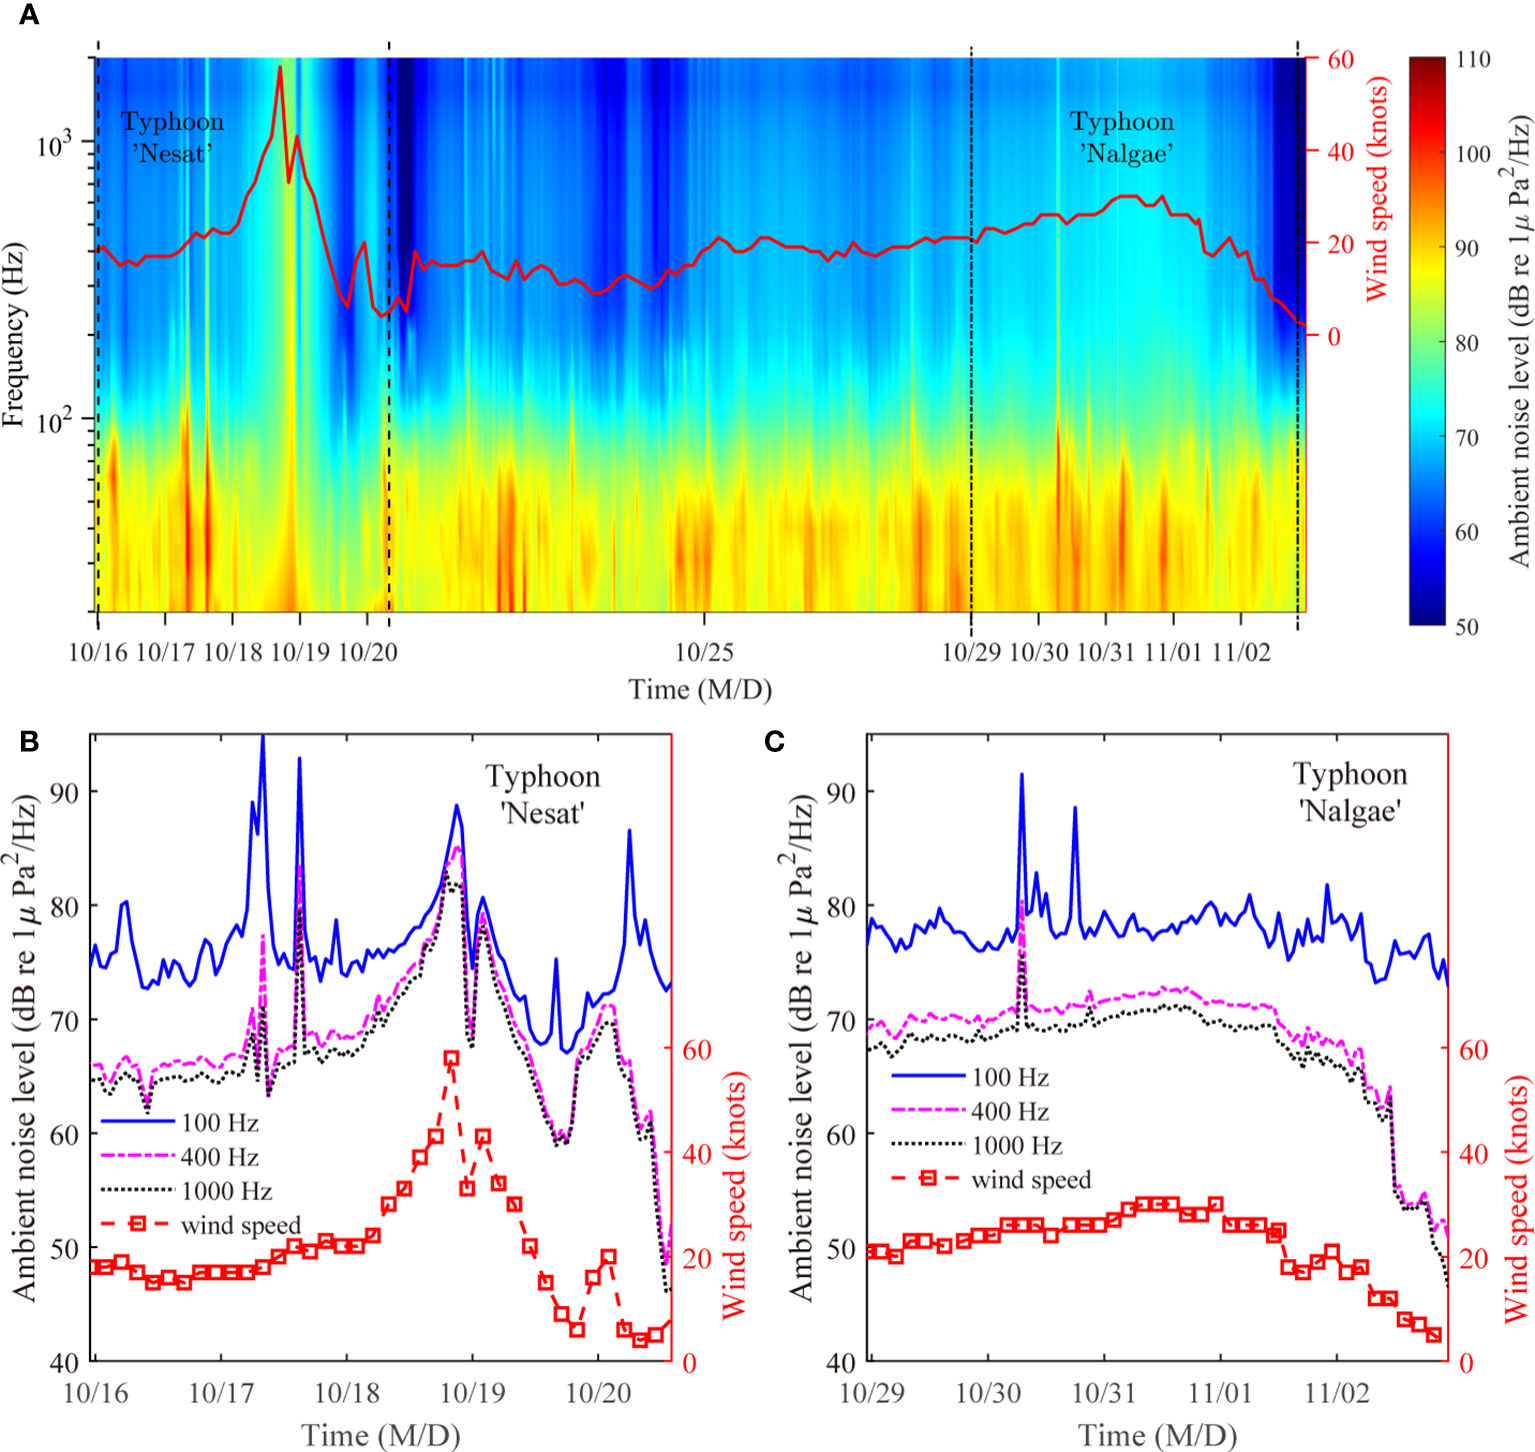
Figure 3 (A) Spectrogram of the ambient noise during the typhoons ‘Nesat’ and ‘Nalgae’ with wind speed (red solid line, in knots). Ambient noise levels at 100 Hz (blue solid line), 400 Hz (magenta dash-dotted line) and 1000 Hz (black dotted line) during the typhoons: (B) ‘Nesat’ and (C) ‘Nalgae’ with wind speed (red squares). M/D: Month/Day.
The long-term statistics of the ambient noise levels are shown in Figure 4. The mean, standard deviation (STD), 5%, 50% (median) and 95% percentiles, which describe the average value and heterogeneity of the data, are shown in Figure 4A. The maximum and minimum of the mean ambient noise level are 88.5 and 57.9 dB re 1 μPa2/Hz occurring at 31.5 Hz and 1600 Hz, resp. The mean value is larger than the median value in the frequency band Hz, while the median value prevails from 160 to 2000 Hz. The absolute differences between the mean values and median values are not greater than 1.3 dB re 1 μPa2/Hz. The 5% and 95% percentiles represent the lower- and upper-limits of the overwhelming majority of the data. Figure 4B shows skewness, kurtosis and standard deviation for the entire noise levels. Skewness represents tailedness of the distribution and kurtosis represents peakedness giving information about outliers. Distant shipping leads to positive skewness ( Hz) while wind-generated noise leads to negative skewness ( Hz). In general, it shows that the higher mean values are accompanied by higher skewness and kurtosis. But abnormities emerge in the frequency band Hz, in which the mean values decrease steadily while the values of skewness and kurtosis show abrupt peaks. The abnormal higher skewness and kurtosis suggest that much of the variance is the result of the competition between wind-generated noise and shiping noise with a wide fluctuation range of windspeeds and number of ships. Considering that the STD exhibits local minima (3.3 to 3.6 dB re 1 μPa2/Hz) in this frequency band, we deduce that the probability density of the noise levels obeys a centralized and non-normal distribution.
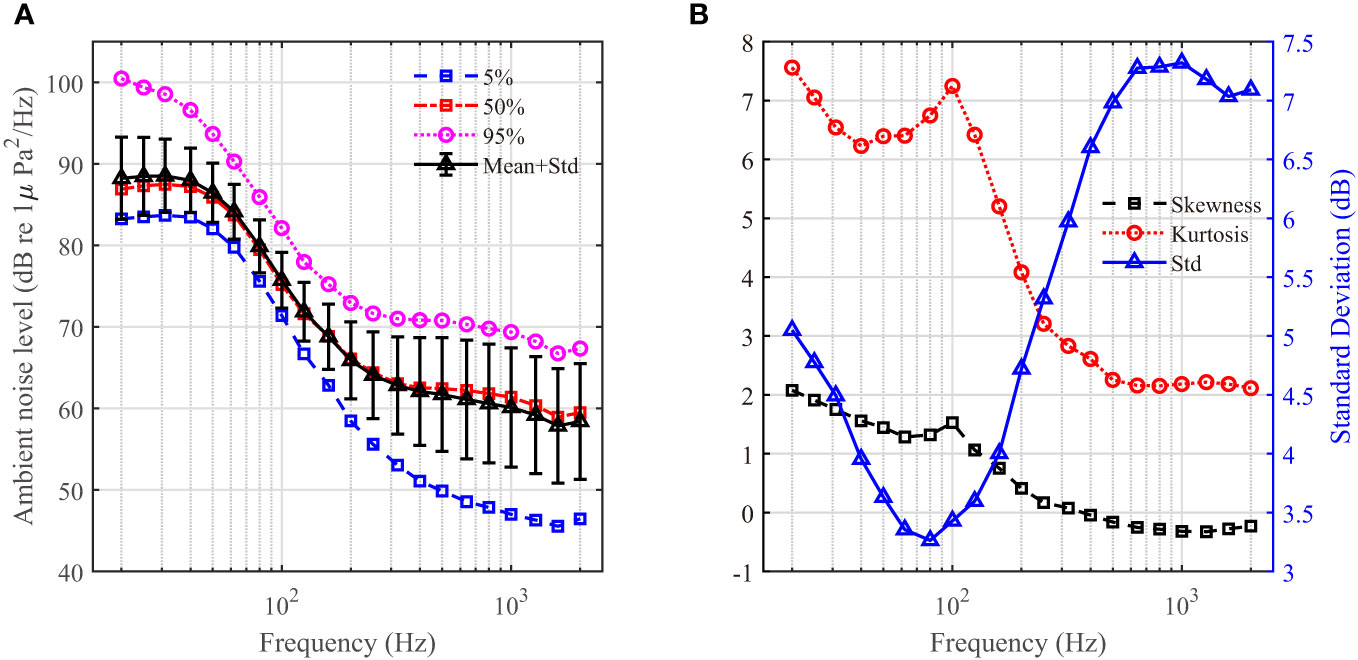
Figure 4 The long-term statistics of ambient noise levels: (A) 5th, 50th and 95th percentiles, mean and standard deviation. (B) Skewness, kurtosis, and standard deviation.
In certain area, ocean ambient noise has significant diurnal variability (Klusek and Lisimenka, 2016). Here we focus on the diurnal variation of ambient noise in the experimental area. Figure 5 shows the day and night comparison of ambient noise level. There is only a small difference between the mean day and mean night values in the frequency band from 20 to 2000 Hz. The maximum deviation is 0.72 dB re 1 μPa2/Hz (at 1600 Hz). At the frequency band between 20 and 500 Hz, the deviation is not more than 0.23 dB re 1 μPa2/Hz. The STD during the day is larger from 80 to 2000 Hz, and is less in the remaining frequency band. There is thus no remarkable difference between the mean day and mean night noise levels.
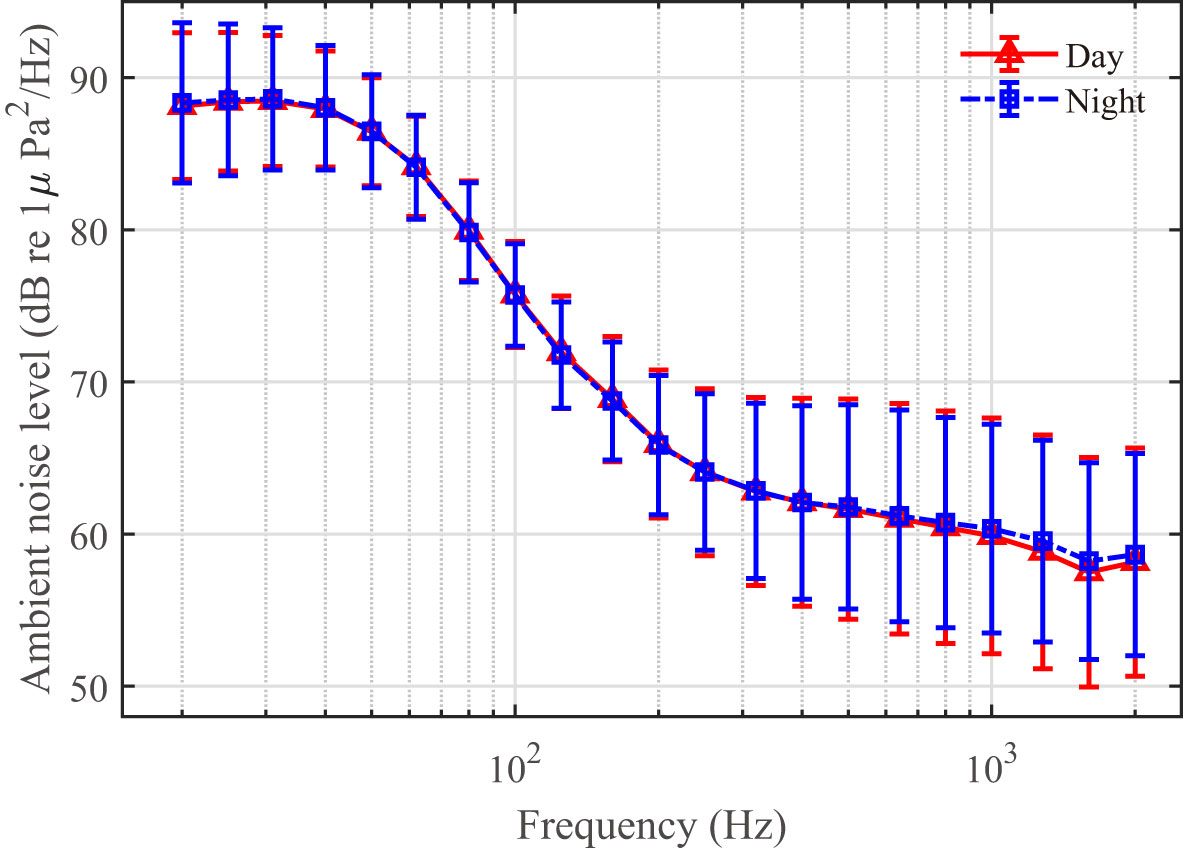
Figure 5 Day and night comparison of mean value and standard deviation of ambient noise levels.
Figure 6 shows the monthly average ambient noise levels varied over time. The monthly variation is relatively large (approximately 6 dB re 1 μPa2/Hz at 200 Hz and 12 dB re 1 μPa2/Hz at 20 and 2000 Hz). Due to the noises of distant shipping, the levels at frequencies below 100 Hz are higher in all months, and meanwhile, the average level for November is 7~12 dB re 1 μPa2/Hz greater than those for other months, which is shown in Figure 2 as well. In this case nearby ships play a nonnegligible role in the noise level. Noise levels at frequencies above 200 Hz are relatively lower (<70 dB re 1 μPa2/Hz), which are dominated mainly by wind and waves. The spread of noise levels in this frequency band is nearly 11 dB re 1 μPa2/Hz, which is principally caused by the diverse distributions of the wind speeds in individual months. The monthly average wind speeds are given in Figure 6 as well, which indicates clearly that the higher monthly average wind speed corresponds to the higher monthly average noise level at frequencies above 400 Hz. In addition, it can be seen that at higher frequencies (≥400 Hz), the noise level during December (in winter) is highest, and is 10~11 dB higher than that during July (in summer). This phenomenon coincides with the conclusion drawn in (Niu et al., 2021), and the reason is that wind speeds are higher in winter, which is consistent with the variation in wind speeds in the experimental area (see Figure 2).
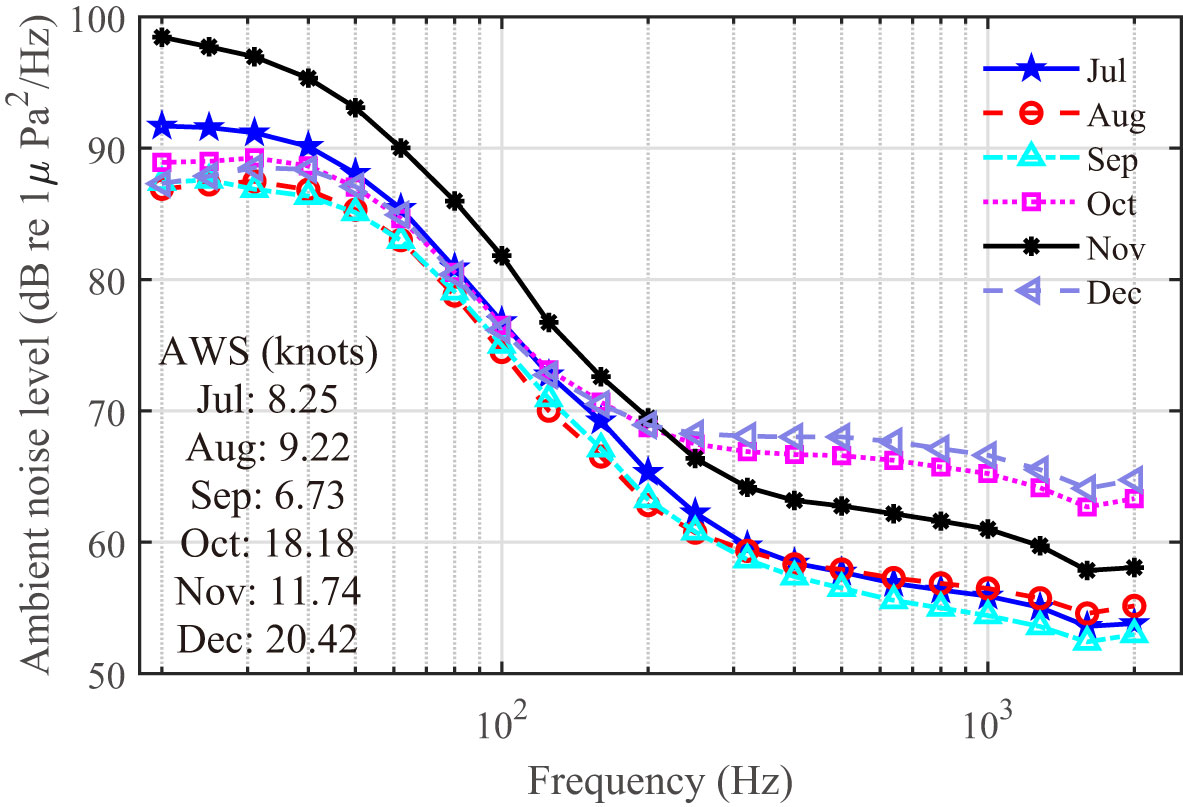
Figure 6 Average monthly ambient noise levels from 20 Hz to 2000 Hz together with the monthly average wind speeds (AWS) in knots. Different colors indicate individual months.
In this section, we investigate the dependence of the ambient noise in the experimental site on wind speeds. Figure 7 shows the probability histogram of 10-m wind speeds during the entire period of acoustic recordings. The wind speeds are given in units of knots and with 3h intervals. It can be seen that over half of the wind speeds are within the interval from 7 to 21 knots, corresponding to Beaufort scales from 3 to 5. We then analyze the distribution of ambient noise levels when the wind speed is fixed. Figure 8 show the probability histograms of noise levels at 50Hz, 100 Hz, 400 Hz and 1000 Hz, reps., when the wind speed is 12 knots. The red solid lines and black dashed lines represent respectively the Burr distributions and Weibull distributions fitted to the noise levels at four frequencies. For the cases of 50 Hz and 100 Hz, the noise levels are dominated by ships rather than the wind speed. It is shown in Figures 8A, B that the spreads of the noise levels are approximately 23~24 dB re 1 μPa2/Hz. The large spreads of the noise levels result from the variation of the number of nearby and distant ships. Besides, the probability density distributions appear to match the Burr distribution better. While for the cases of 400 Hz and 1000 Hz, wind speeds play a dominant role in noise levels, Figures 8C, D show that the spreads of the noise levels are approximately 12~14 dB re 1 μPa2/Hz, and the probability density distribution is likely to match the Weibull distribution better. The distributions of noise levels at different frequencies can be applied to simulating non-Gaussian and non-white spectra and time series of ambient noise, and provide effective assistance for accurately predicting the capacity of underwater communications or performance of detection.
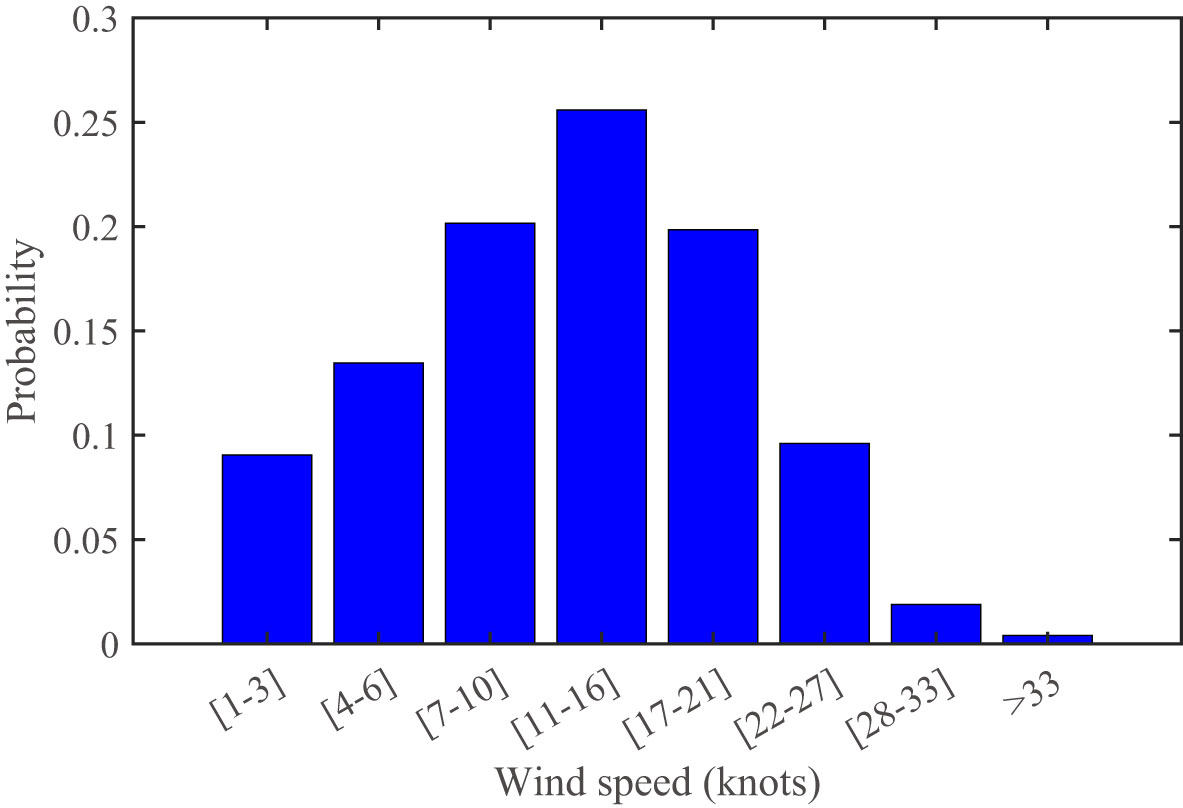
Figure 7 Probability distribution of wind speeds during the entire period of acoustic recordings.
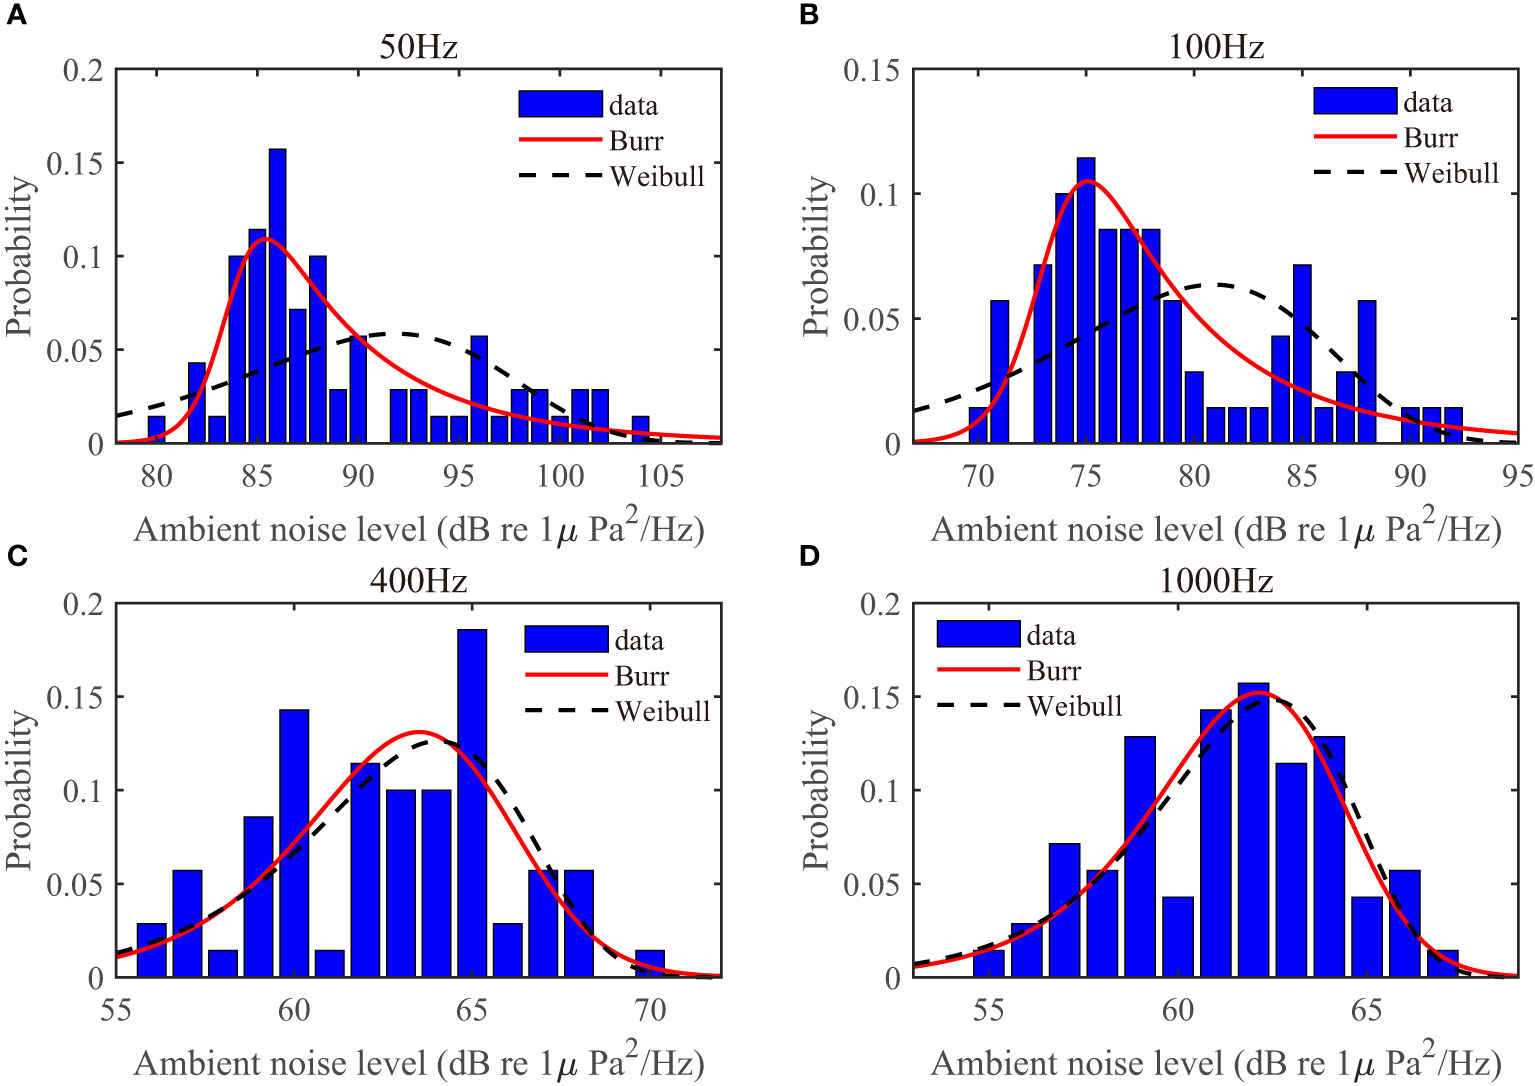
Figure 8 Probability distribution of ambient noise levels at (A) 50Hz, (B) 100 Hz, (C) 400 Hz and (D) 1000 Hz with fixed wind speed at 12 knots.
Figure 9 shows the mean ambient noise levels for multiple Beaufort scales from 2 to 8. It can be seen that the wind dependence of the noise level is weak in the lower frequency region (≤100 Hz), and tends to be noticeable at frequencies larger than 200 Hz, where the noise level increases with the Beaufort scale. The increments of noise levels between adjacent Beaufort scales are nearly 2 dB re 1 μPa2/Hz at 200 Hz and 3.5 dB re 1 μPa2/Hz at 1000 Hz. A comparison of data from (Wenz, 1962) and this work is also presented. The case of comparison here is specified as in Figure 2B of (Wenz, 1962), representing noise levels in deep ocean. The Wenz curves are converted to the units used throughout this paper, and are exhibited as the green dashed lines with circles (Beaufort 2) and with squares (Beaufort 8) with an extra 5 dB re 1 μPa2/Hz added on the original noise levels. It is known that the received level of wind-driven noise is determined by two factors. One is the noise source spectral level which should be only dependent on wind speeds. The other is the environmental conditions, i.e., sound speed profiles, bathymetry, etc., which influence the propagation of wave generated by noise sources. Thus, in different observing regions there should be diverse differences between the observing noise levels and Wenz curve. Recent work has revealed that the mean noise levels acquired at 6 locations of the Pacific Ocean at different Beaufort scales are 7-dB higher than Wenz curve(Yang et al., 2023). Here the additional 5 dB re 1 μPa2/Hz can be regarded as the correction caused by the difference of environmental conditions between two observing areas. It is apparent that the presented data and the 5-dB-added Wenz curves are in excellent agreement.
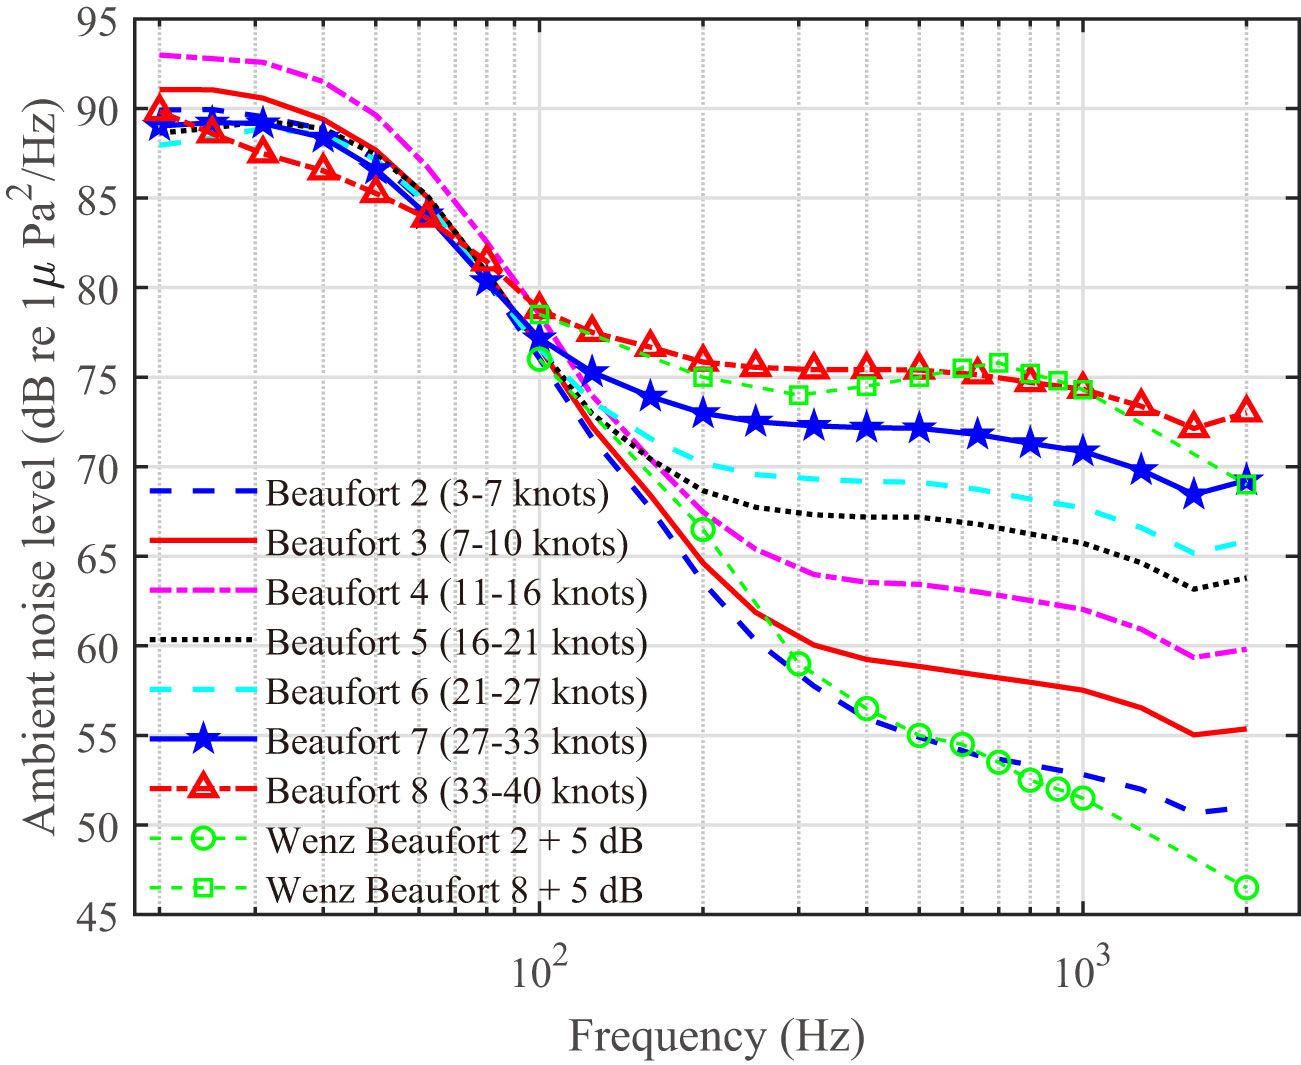
Figure 9 Average noise levels from 20 Hz to 2000 Hz for the Beaufort scales ranging from 2 to 8 compared with the 5-dB-addition Wenz curves (green marked lines).
It has been found by many authors (Crouch and Burt, 2005; Klusek and Lisimenka, 2016) that the noise level and wind speed can be linked by the following expression
where NL is the measured noise level at the central frequency of the 1/3-octave frequency band in dB re 1 μPa2/Hz, U is the 10-m wind speed in knots, and f represents the central frequency in the 1/3-octave frequency band. n and M are the wind-dependence coefficient and offset, resp., and they are both dependent on the frequency.
The correlation coefficients of the noise levels and 10-m wind speeds of the presented dataset are analyzed here to inspect the dependence. The Pearson correlation coefficients r(f) are written as
where cov (,) and σ represent the covariance and STD, resp. represents the mean value. Figure 10 shows the errorbar of r(f) in the frequency band from 20 to 2000 Hz, which is computed from Equation (2). For the frequency between 20 and 160 Hz, ambient noise is dominated by shiping noise, the correlation coefficient is less than 0.4. The noise level is weakly correlated with the (logarithm of) wind speed. In the frequency band from 200 to 315 Hz, the correlation coefficient increases gradually, , indicating that the impact of 10-m wind speed on the noise level are non-negligible. In the frequency band from 400 to 2000 Hz, the correlation coefficient is above 0.8, indicating a strong correlation between the noise level and wind speed. It means that the noise level is dominantly determined by the wind speed in this frequency band, which can be verified in Figure 2 as well. The STD ranges from 0.020 to 0.033, which is quite small and corroborates the previous conclusion that wind dominates the ocean ambient noise between 400 and 2000 Hz. The wind-dependence coefficient n and the offset M are then computed in the frequency band from 400 to 2000 Hz using a LMSE regression. These results are listed in Table 1 together with the correlation coefficients. These correlation coefficients r(f) are identical with the mean values in Figure 10. Since the correlation coefficients are relatively small from 20 to 315 Hz, it is not necessary to analyze the wind-dependence coefficient and the offset. We observe an approximately quadratic wind dependence in the frequency band from 500 to 2000 Hz. These results can be adopted to predict the noise level in the area surrounding the experimental site employing Equation (1).
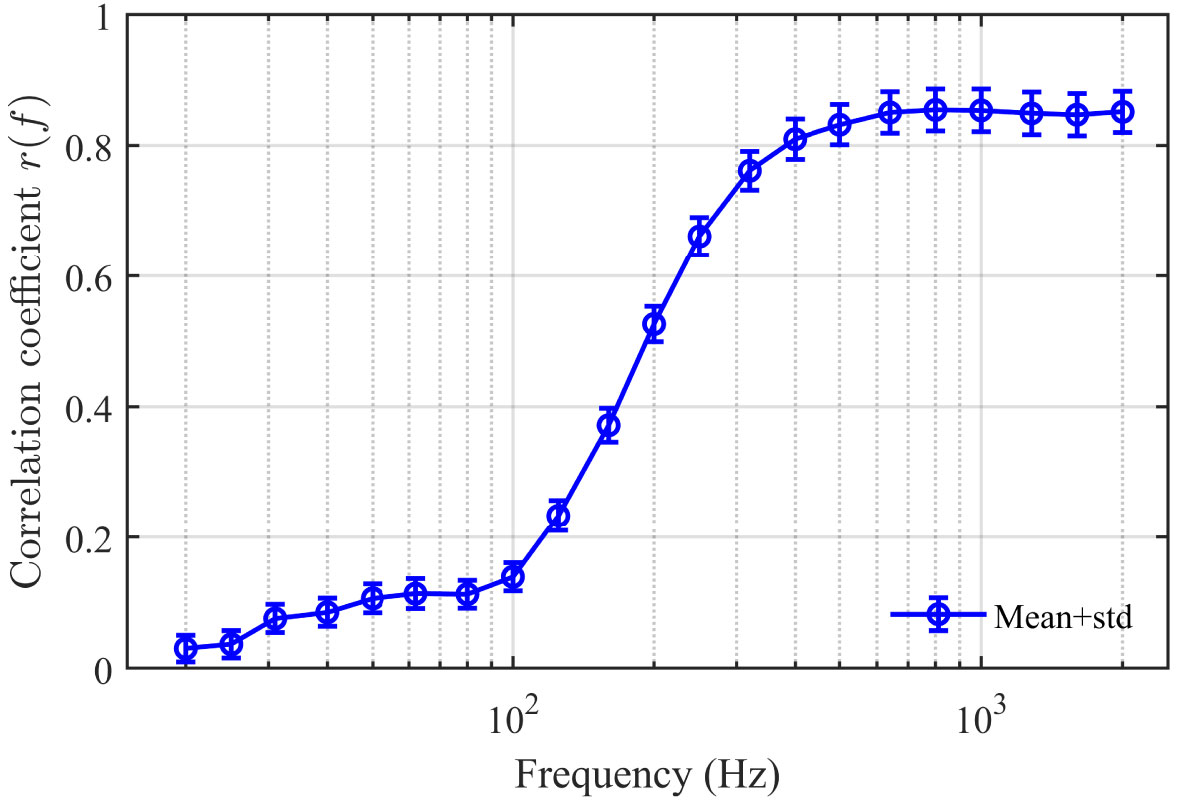
Figure 10 Errorbar (mean and standard deviation) of correlation coefficients between noise levels and wind speeds. The frequency band ranges from 20 Hz to 2000 Hz.
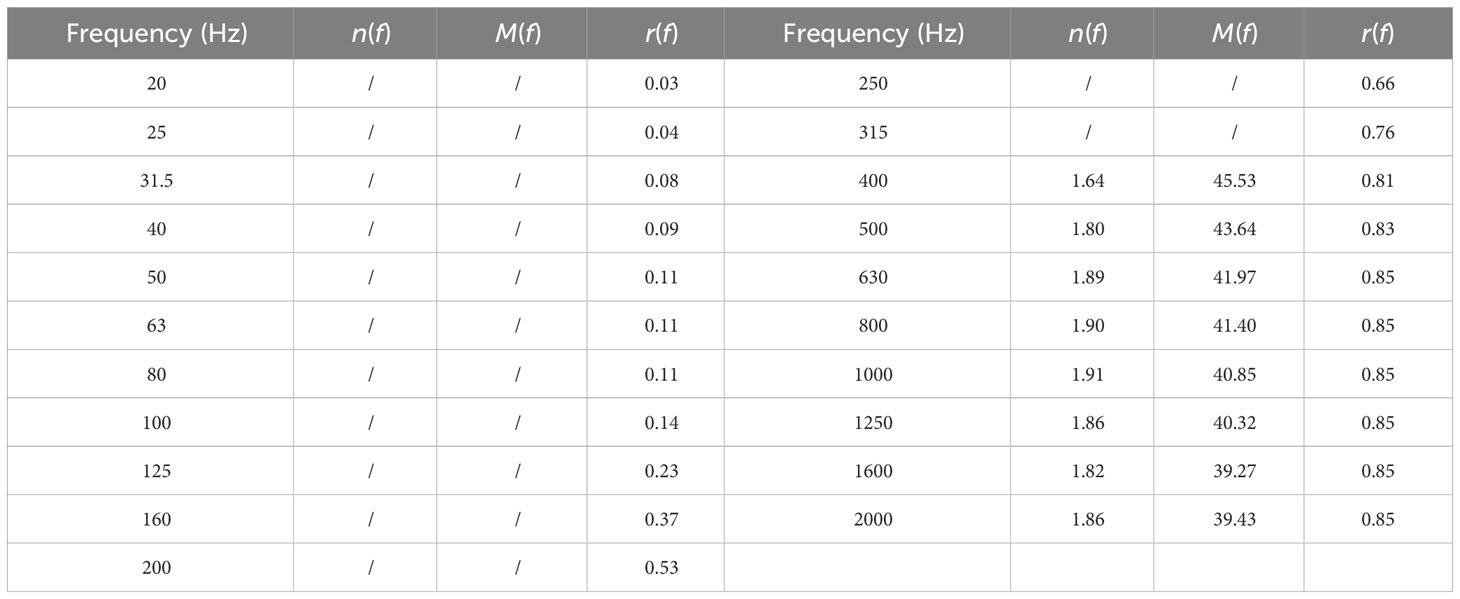
Table 1 Noise-wind speed dependence coefficients and correlation coefficients as a function of the center frequencies in 1/3-octave frequency from 20 to 2000 Hz.
This paper reports on the ambient noise measured by a near-bottom acoustic recording system deployed at the deep-water site in the northwest South China Sea, together with the synchronous 10-m wind speeds ranging from 1 to 58 knots, covering the effect of two typhoons passing by the experiment site, during the latter half of 2022. To our knowledge, this study was the first to report on the near-bottom ambient noise properties in the region of South China Sea with an incomplete deep-sea sound channel. The collected noise data provides significant information about the long-term statistics of ambient noise in this area. In the absence of transient events, the noise levels at low frequencies range between 58~100 dB re 1 μPa2/Hz (20 to 200 Hz) and 51~72 dB re 1 μPa2/Hz (200 to 400 Hz). In the high frequency range (400 to 2000 Hz), which is typically dominated by wind, the noise levels range from 45 to 70 dB re 1 μPa2/Hz. No significant difference is observed between mean day and mean night noise levels, but there are great monthly variations (7~12 dB re 1 μPa2/Hz) in the mean levels from 20 to 200 Hz, revealing a wide varying range of the number of nearby and distant ships. At the frequencies larger than 400 Hz, the monthly variations in the mean levels are mainly caused by the differences among the average wind speeds in individual months, and the noise is 10~11 dB higher in winter (December) than in summer (July). Besides, in the situation of fixed wind speed (12 knots), we have observed that the probability densities of noise levels obey the Burr distribution at lower frequencies (50 and 100 Hz), and are likely to obey Weibull distribution at higher frequencies (400 and 1000 Hz). These distributions of noise levels can be employed to simulate the spectra and time series of the non-Gaussian and non-white ambient noise. Ambient noise levels exhibit continual increase with increasing wind speed group or Beaufort scale for frequencies between 200 to 2000 Hz, and the noise levels for different Beaufort scales are in excellent agreement with the Wenz curves with a 5-dB addition. We analyze the wind-dependence coefficient and offset of noise levels, and acquire a mathematic expression of wind dependence from 400 to 2000 Hz. The present observing site is at a depth of over 1200 m, corresponding to the deep ocean with an incomplete sound channel. In the northwest South China Sea, most of areas except coastal regions are at the depth between 1000 and 3000 m, thus the present data can at least cover most of the northwest part of South China Sea, and the results can be employed to predict noise levels in the experimental area. We hope the presented results could be utilized to discuss the trends in the ambient noise statistics and characteristics in relation to changes in ocean traffic and meteorological condition in South China Sea.
The raw data supporting the conclusions of this article will be made available by the authors, without undue reservation.
WG: Conceptualization, Formal analysis, Methodology, Software, Visualization, Writing – original draft. JL: Formal analysis, Funding acquisition, Supervision, Validation, Writing – review & editing. GX: Data curation, Formal analysis, Funding acquisition, Supervision, Validation, Writing – review & editing. GL: Formal Analysis, Writing – review & editing. PX: Conceptualization, Data curation, Formal analysis, Funding acquisition, Writing – review & editing.
The author(s) declare financial support was received for the research, authorship, and/or publication of this article. This research was funded by the China Postdoctoral Science Foundation (Grant No. 2023M734311); and National Key Research and Development Program of China (Grant No. 2022YFC3103404).
The authors declare that the research was conducted in the absence of any commercial or financial relationships that could be construed as a potential conflict of interest.
All claims expressed in this article are solely those of the authors and do not necessarily represent those of their affiliated organizations, or those of the publisher, the editors and the reviewers. Any product that may be evaluated in this article, or claim that may be made by its manufacturer, is not guaranteed or endorsed by the publisher.
Barclay D. R., Lin Y.-T. (2019). Three-dimensional ambient noise modeling in a submarine canyon. J. Acoust. Soc Am. 146 (3), 1956–1967. doi: 10.1121/1.5125589
Bonnel J., Kinda G. B., Zitterbart D. P. (2021). Low-frequency ocean ambient noise on the Chukchi Shelf in the changing Arctica. J. Acoust. Soc Am. 149 (6), 4061–4072. doi: 10.1121/10.0005135
Chen R., Schmidt H. (2017). Characterization of arctic ambient noise environment. J. Acoust. Soc Am. 141, 3532–3532. doi: 10.1121/1.4987457
Crouch W. W., Burt P. J. (2005). The logarithmic dependence of surface-generated ambient-sea-noise spectrum level on wind speed. J. Acoust. Soc Am. 51 (3B), 1066–1072. doi: 10.1121/1.1912926
Da L., Wang C., Han M., Zhang L. (2014). Ambient noise spectral properties in the north area of Xisha. Acta Oceanol. Sin. 33 (12), 206–211. doi: 10.1007/s13131-014-0569-4
Deane G. B., Stokes M. D. (2002). Scale dependence of bubble creation mechanisms in breaking waves. Nature 418 (6900), 839–844. doi: 10.1038/nature00967
Farrokhrooz M., Wage K. E., Dzieciuch M. A., Worcester P. F. (2017). Vertical line array measurements of ambient noise in the North Pacific. J. Acoust. Soc Am. 141 (3), 1571–1581. doi: 10.1121/1.4976706
Hildebrand J. A. (2009). Anthropogenic and natural sources of ambient noise in the ocean. Mar. Ecol. Prog. Ser. 395, 5–20. doi: 10.3354/meps08353
Jiang D., Li Z., Qin J., Peng Z., Shao H. (2017). Characterization and modeling of wind-dominated ambient noise in South China Sea. Sci. China Phys. Mech. Astron. 60 (12), 124321. doi: 10.1007/s11433-017-9088-5
Klusek Z., Lisimenka A. (2016). Seasonal and diel variability of the underwater noise in the Baltic Sea. J. Acoust. Soc Am. 139 (4), 1537–1547. doi: 10.1121/1.4944875
McDonald M. A., Hildebrand J. A., Wiggins S. M. (2006). Increases in deep ocean ambient noise in the Northeast Pacific west of San Nicolas Island, California. J. Acoust. Soc Am. 120 (2), 711–718. doi: 10.1121/1.2216565
Medwin H., Nystuen J. A., Jacobus P. W., Ostwald L. H., Snyder D. E. (1992). The anatomy of underwater rain noise. J. Acoust. Soc Am. 92 (3), 1613–1623. doi: 10.1121/1.403902
Mo X., Wen H., Yang Y., Zhou H., Yin J., Han X., et al. (2023). Ocean ambient noise on the Chukchi Plateau and its environmental correlates. Mar. Environ. Res. 188, 106024. doi: 10.1016/j.marenvres.2023.106024
Niu F., Xue R., Yang Y., Chen B., Ruan H., Luo (2021). Baseline assessment of ocean ambient noise in the western Clarion Clipperton Zone, Pacific Ocean. Mar. Pollut. Bull. 173, 113057. doi: 10.1016/j.marpolbul.2021.113057
Romagosa M., Cascão I., Merchant N. D., Lammers M. O., Giacomello E., et al. (2017). Underwater ambient noise in a baleen whale migratory habitat off the azores. Front. Mar. Sci. 4. doi: 10.3389/fmars.2017.00109
Schwock F., Abadi S. (2021). Statistical analysis and modeling of underwater wind noise at the northeast pacific continental margin. J. Acoust. Soc Am. 150 (6), 4166–4177. doi: 10.1121/10.0007463
Seger K. D., Thode A. M., Swartz S. L., Urbán R. J. (2015). The ambient acoustic environment in Laguna San Ignacio, Baja California Sur, Mexico. J. Acoust. Soc Am. 138 (5), 3397–3410. doi: 10.1121/1.4935397
Shi Y., Yang Y., Tian J., Sun C., Zhao W., et al. (2019). Long-term ambient noise statistics in the northeast South China Sea. J. Acoust. Soc Am. 145 (6), EL501–EL507. doi: 10.1121/1.5110740
Širović A., Wiggins S. M., Oleson E. M. (2013). Ocean noise in the tropical and subtropical Pacific Ocean. J. Acoust. Soc Am. 134 (4), 2681–2689. doi: 10.1121/1.4820884
Wenz G. M. (1962). Acoustic ambient noise in the ocean: spectra and sources. J. Acoust. Soc Am. 34, 1936–1956. doi: 10.1121/1.1909155
Keywords: Northwest South China Sea, near-bottom and deep-sea ambient noise observation, long-term statistics, monthly variations, wind dependence
Citation: Guo W, Liu J, Xu G, Li G and Xu P (2024) Long-term statistics and wind dependence of near-bottom and deep-sea ambient noise in the northwest South China Sea. Front. Mar. Sci. 10:1341198. doi: 10.3389/fmars.2023.1341198
Received: 20 November 2023; Accepted: 29 December 2023;
Published: 17 January 2024.
Edited by:
Arata Kaneko, Hiroshima University, JapanReviewed by:
Xiao-Hua Zhu, Ministry of Natural Resources, ChinaCopyright © 2024 Guo, Liu, Xu, Li and Xu. This is an open-access article distributed under the terms of the Creative Commons Attribution License (CC BY). The use, distribution or reproduction in other forums is permitted, provided the original author(s) and the copyright owner(s) are credited and that the original publication in this journal is cited, in accordance with accepted academic practice. No use, distribution or reproduction is permitted which does not comply with these terms.
*Correspondence: Juan Liu, bGl1anVhbjIyQG51ZHQuZWR1LmNu
Disclaimer: All claims expressed in this article are solely those of the authors and do not necessarily represent those of their affiliated organizations, or those of the publisher, the editors and the reviewers. Any product that may be evaluated in this article or claim that may be made by its manufacturer is not guaranteed or endorsed by the publisher.
Research integrity at Frontiers
Learn more about the work of our research integrity team to safeguard the quality of each article we publish.