 Mingyang Lu
 Dajun Sun1,2,3
 Yunfei Lv
- 1National Key Laboratory of Underwater Acoustic Technology, Harbin Engineering University, Harbin, China
- 2Key Laboratory of Marine Information Acquisition and Security (Harbin Engineering University), Ministry of Industry and Information Technology, Harbin, China
- 3College of Underwater Acoustic Engineering, Harbin Engineering University, Harbin, China
- 4Department of Electrical and Computer Engineering, University of Victoria, Victoria, BC, Canada
Traditional direction of arrival (DOA) estimation algorithms typically have poor spatial resolution and robustness. In this paper, we propose a broadband high-resolution DOA estimation method based on the generalized weighted Radon transform (GWRT). The array signal can be converted into the frequency-wavenumber (f-k) domain using the conditional wavenumber spectrum function (CWSF). Then, a linear integral mathematical model for high-resolution DOA estimation is derived by transforming the f-k domain into the azimuth-energy domain using the GWRT. Computer simulation and sea trials were conducted to validate the feasibility and performance of the proposed method. The results obtained indicate that the proposed method yields a lower sidelobe level and can more effectively suppress the output energy in the non-target direction when compared to the conventional beamforming (CBF), steered minimum variance (STMV), and deconvolution (DCV) methods. Further, the proposed method provides improved spatial resolution and robustness in a multi-target environment.
1 Introduction
Target azimuth is an important parameter for the identification, detection, positioning, and tracking of underwater targets (Luo and Shen, 2021; Chen et al., 2023; Xie et al., 2023; Zhao et al., 2023). Array signal processing has been shown to be effective for the direction of arrival (DOA) estimation. The methods can be classified as traditional beamforming, subspace-based, deconvolution (DCV), and transform domain.
The most commonly employed traditional beamforming method is the conventional beamforming (CBF). However, CBF has the disadvantages of wide beamwidths and poor spatial resolution due to the Rayleigh limit. Several high-resolution methods have been proposed to overcome these such as the maximum entropy algorithm (Burg, 1975) and the minimum variance distortionless response (MVDR) algorithm (Capon, 1969). These methods improve the spatial resolution but suffer from poor performance when used to detect broadband signals in actual ocean environments. This is because they are sensitive to signal mismatch and cannot estimate the DOA of coherent sound sources (Somasundaram, 2012). The steered minimum variance (STMV) algorithm was proposed to overcome these problems (Krolik and Swingler, 1989). STMV has better spatial resolution for coherent acoustic sources and fast convergence, but poor robustness (Somasundaram et al., 2015). The Rayleigh limit was overcome with the subspace-based algorithm multiple signal classification (MUSIC) (Schmidt, 1986). Subsequent subspace-based algorithms such as estimation of signal parameters via rotational invariance techniques (ESPRIT) (Roy and Kailath, 1989), root-multiple signal classification (RMUSIC) (Rao and Hari, 1989), maximum likelihood (ML) (Stoica and Nehorai, 1989), and weighted subspace fitting (WSF) (Bengtsson and Ottersten, 2001) provide improved performance but have sensitivity and snapshot deficiency problems when used in practical applications (Baggeroer and Cox, 1999). Another issue is that the number of acoustic sources is usually unknown and this makes it difficult to estimate the signal and noise subspaces. Further, existing algorithms can only be used to estimate DOA for incoherent or weak-coherent acoustic sources, making detection of coherent signals difficult in the actual ocean environments.
The above algorithms are either sensitive to array element errors or limited to array aperture. Various studies on the formation structure have been introduced to improve the performance of the algorithms (Zhang et al., 2021; Zhou et al., 2022; Yang, 2023; Ye et al., 2023). Additionally, in recent years, there has been a growing focus on researching robust high-resolution beamforming algorithms. Deconvolution (DCV) algorithms have attracted widespread attention for underwater acoustic applications. DCV was initially considered with both uniform linear arrays and circular arrays (Yang, 2017; Yang, 2018). It was shown that the performance is better than CBF. The super-directivity performance of DCV with a small-sized array was verified using the SwellEx96 horizontal array (Yang, 2019). However, these DCV methods are only suitable for arrays with a shift-invariant point spread function (PSF) beam pattern, such as a horizontal line array or circular array. Therefore, new DCV methods were developed for shift-variant PSF beam patterns. A DCV method based on non-negative least squares (NNLS) and an improved NNLS method called extended Richardson-Lucy (Ex-RL) were presented which provide high resolution, robustness, and excellent array gain (Sun et al., 2019; Sun et al., 2020).
Transform domain methods were originally developed to estimate seismic wave velocity and azimuth (Cheng et al., 2018). More specifically, the frequency-wavenumber (f-k) power spectrum can be obtained using the space-time two-dimensional Fourier transform of the seismic signal. Then, the f-k power spectrum can be converted into the transform domain to extract the velocity and azimuth of the waves. While transform domain methods have been widely used in seismic exploration (Zywicki and Rix, 1999), there have been few DOA estimation applications. The least squares line fitting (LSLF) algorithm was employed to obtain the slope of the local peak-energy line in the f-k domain and then the sum of the points on this line was used as an estimate of the energy output of the azimuth spectrum (Li et al., 2019). However, this method is sensitive to outliers in the image since it minimizes the sum of the squares of the distances from the points to the line. Thus, the performance can be degraded significantly, particularly in low signal-to-noise ratio (SNR) environments or when there are multiple adjacent targets. In this paper, a broadband high-resolution DOA estimation method based on the generalized weighted Radon transform (GWRT) is proposed. The array signal is converted into the f-k domain by solving the conditional wavenumber spectrum function (CWSF) and then the mathematical relationship between the spatial distribution of broadband signal energy in the f-k domain and target azimuth is obtained. To improve performance, image gradient information is utilized as weights for the GWRT, and a linear integral mathematical model is derived by the GWRT processing in the f-k domain. The resulting model contains the complete image information in the f-k domain. This is then converted into the azimuth-energy domain to realize high-resolution DOA estimation. The proposed method does not require prior knowledge of the number of sources or signal pre-estimation. In addition, it is not sensitive to outliers in the image and the results in the f-k domain provide higher transform gain and better robustness. Both simulation and sea-trial experiments are conducted to validate the proposed method. The results obtained indicate that the proposed method has better performance and offers several advantages compared with existing approaches as follows.
1. The proposed method produces a narrow mainlobe width similar to, or better than, many commonly used high-resolution methods such as STMV and DCV.
2. The proposed method produces lower sidelobe levels than the CBF, STMV, and DCV methods.
3. The proposed method has better robustness to position errors compared to the STMV and DCV methods.
4. The proposed method exhibits good performance when there are multiple targets and when the target signal is weak.
The remainder of this paper is organized as follows. Section 2 introduces the broadband signal model and DOA estimation using the CWSF is presented. In Section 3, we derive the expression of the mathematical model for DOA estimation using GWRT. The performance of the proposed method is evaluated via simulation and compared with other DOA methods in Section 4. The results of the sea-trial experiments are given in Section 5. Finally, Section 6 provides a summary of the paper.
2 Signal modeling
We consider a linear sensor array with M receivers uniformly spaced at a distance d. The signal is assumed to be from a broadband source located at the far field of the array. This signal has a look direction and arrives at the array as a plane wave. Then, is the azimuth angle of the target, which is defined as the anticlockwise angle between the horizontal array and the target as shown in Figure 1. Therefore, the signal received by element m at time t can be expressed as
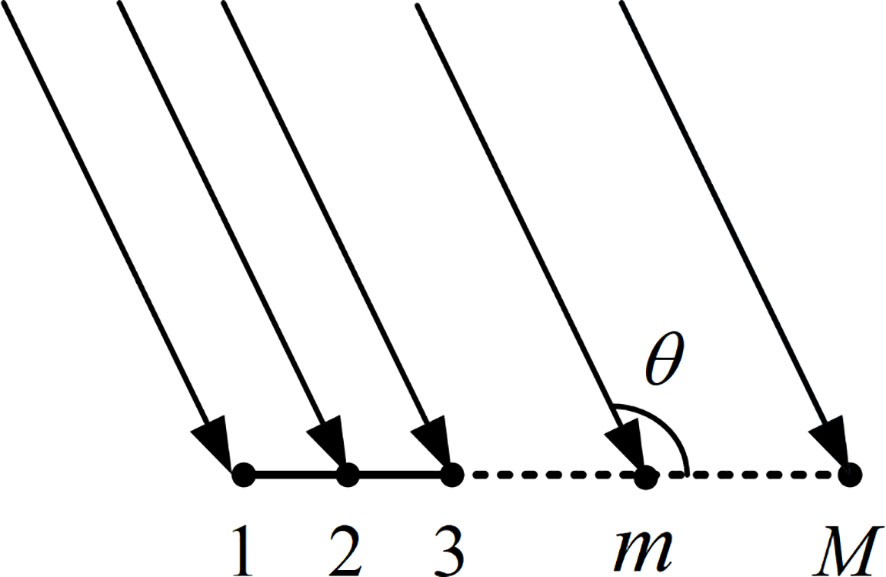
Figure 1 Uniform linear array geometry.
where , is the incident signal, is the noise received by element m, which is uncorrelated with , is the array manifold factor of element m which is equal to , and and are frequency and the speed of sound, respectively.
As the actual data processing is based on a discrete-time model, the received signal should be sampled at . Therefore, the signal received by element m can be expressed as
where L is the number of samples which is an integer. The discrete Fourier transform (DFT) of gives the corresponding frequency spectrum
Then, the frequency-wavenumber spectrum of the received signal can be obtained by applying the DFT to with Q points in the spatial domain as
where k is the wavenumber which is an integer in the range , Q is an integer with , is the frequency spectrum of , is the frequency spectrum of .
From Equation (4), the frequency-wavenumber power spectral density can be expressed as
where denotes expectation, superscript H denotes conjugate transpose, and is the noise power. The frequency power spectra can be expressed as
To mitigate the impact of high-frequency attenuation and enhance the outcomes of high-frequency components within , the CWSF (Beall et al., 1982) is employed to derive the conditional wavenumber spectral density from Equations (5) and Equations (6). can be expressed as
where is a periodic function with period 1. It is symmetric about , and has its maximum value when . The first zero points of are , hence the mainlobe width is .
In this paper, we only consider for a single cycle. From Equation (7), has its maximum value when , and mainlobe width . Figure 2 gives for a broadband signal. This shows that the target energy is concentrated in the mainlobe, and the peak-energy points in the mainlobe are on a straight line passing through the origin. The slope of the line can be expressed as . Therefore, is a linear function of .
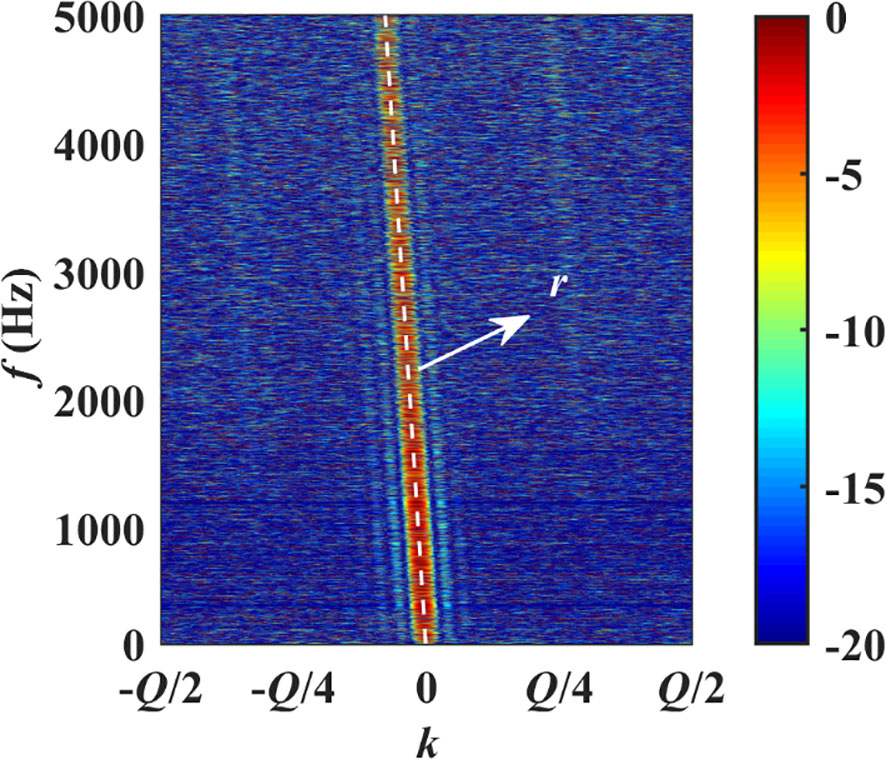
Figure 2 for a broadband signal.
3 DOA estimation method based on GWRT
As mentioned above, can be accurately estimated using the slope of the line in , thus realizing high-resolution DOA estimation. However, there will be sidelobels and perhaps outliers in due to the windowing effect of the DFT and the random fluctuation noise which makes determining difficult. To solve these issues, morphological grayscale reconstruction is used to extract regional maxima in and obtain the reconstructed matrix (Vincent, 1992; Vincent, 1993). This method utilizes erosion and dilation operations based on a structuring element to reconstruct or eliminate specific regions in an image, which removes most of the outliers and significantly reduces the sidelobes.
The generalized Radon transform (GRT) is commonly used to extract information from images (Radon, 1986; Hansen and Toft, 1996; Ramm and Katsevich, 2020; Sun et al., 2021). However, it only considers amplitude information and ignores gradient information, which is not ideal. Image gradients provide the rates and directions of change for the pixels, which is useful information. Therefore, we propose a method based on the GWRT to achieve the integration of a multivariate function over a given path. Compared with the GRT, the GWRT makes full use of the image gradient information as its weights, thus providing better results. For a two-dimensional Euclidean space, the GWRT can be defined for a continuous image as (Alpatov et al., 2015)
where is a vector containing the parameters of the line, and,, and are, respectively, a known line, space coordinates, and the intensity of points on a line in the two-dimensional image.,〈 〉, and in Equation (8) are, respectively, the gradient operator, scalar product operation, and the unit normal vector which is perpendicular to the line . As the transform will be obtained from discrete-time data, the GWRT in discrete form is used rather than the integral form. The GWRT of in discrete form can be expressed as
where and are the lower and upper limits of frequency employed, respectively, with . Equation (9) converts into a one-dimensional matrix which reflects the energy distribution related to the parameter . The position of the maximum value of is the DOA estimation.
As mentioned above, the slope of the peak-energy line in is a function of the signal direction . Therefore, the lines in must be discernible so targets from different directions can be distinguished. In other words, the difference in coordinates on the k-axis for must be equal to or greater than the mainlobe width of which means
where and represent the directions of two targets. Then, the difference in directions should satisfy
Equation (11) is a function of , so this frequency should be large to obtain high-resolution performance. Note that the mainlobe of will be much narrower than that of due to the morphological grayscale reconstruction operation. Therefore, the resolution of the GWRT will be less than , which confirms that the proposed method has high-resolution performance.
The steps of the proposed method are as follows.
1) Obtain using Equtaions (1–7).
2) Perform morphological grayscale reconstruction to obtain the matrix .
3) Compute the GWRT of to convert the image information in the f-k domain into the azimuth-energy domain to realize high-resolution DOA estimation.
4 Simulation analysis
The performance of the proposed method is evaluated for a scalar towed array measurement system. Consider a line array of 32 receivers uniformly spaced at a distance d=0.25 m. The proposed method is compared with three commonly used DOA estimation methods, namely CBF, STMV, and DCV.
4.1 Single source
Consider a broadband target located in the direction of the array with . The target signal is a broadband noise and is assumed to have random amplitude and phase. The broadband spectrum is between 1500 Hz and 3000 Hz, and 20 kHz. The direction scanning range is , the scanning interval is 1/1800 rad, and =256. The SNR is 10 dB, and the noise is assumed to be isotropic and uncorrelated at the receivers. and obtained using Steps 1 and 2 in Section 3 are shown in Figures 3A, B, respectively.
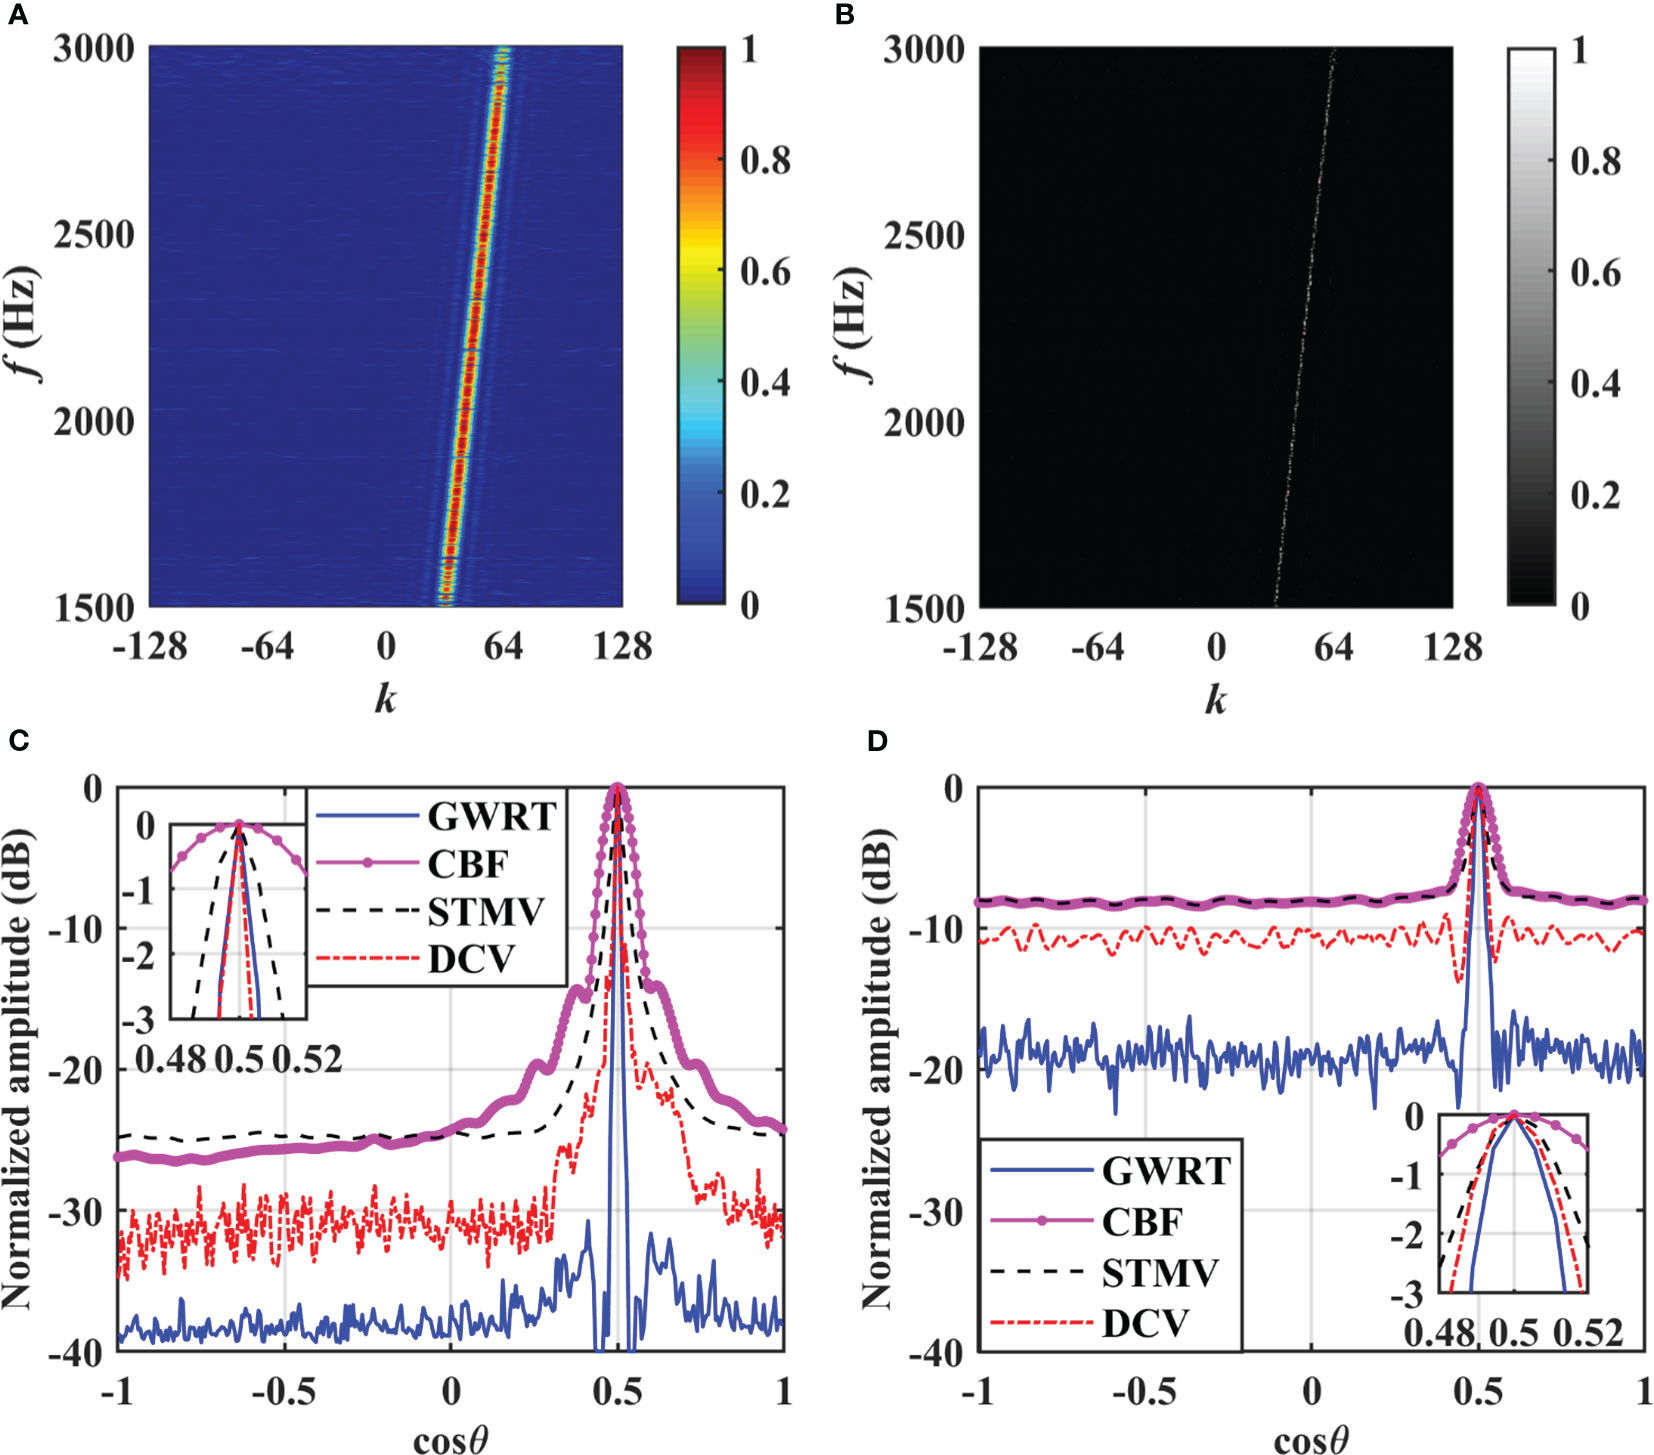
Figure 3 DOA estimation results for a single source. (A) . (B) . (C) SNR=10 dB. (D) SNR= -10 dB.
Comparing Figures 3A, B reveals that is more prominent and the mainlobe width is narrower. This confirms the improvement due to morphological grayscale reconstruction. The DOA estimation results obtained from the GWRT of are given in Figures 3C, D for SNRs 10 dB and -10 dB, respectively. These results show that all methods can accurately estimate the direction of the target for both SNR values. The sidelobe levels increase as the SNR decreases, but the proposed method still exhibits the lowest sidelobe levels. The GWRT method also has a narrower mainlobe width than the CBF and STMV methods, and it is similar to that of the DCV method. Therefore, the GWRT method has the advantages of lower sidelobe levels and narrower mainlobe which will result in better performance.
4.2 Sensitivity to position errors
Sensitivity to signal mismatch is an important consideration for DOA estimation methods. In this section, the performance degradation due to signal mismatch is evaluated with random position errors for the receivers. Figure 4A gives the actual receiver positions in the line array (denoted by *) and the erroneous positions (denoted by o). The position errors have a mean of 0.04 m which can be considered worst case. It is assumed that these errors are unknown and DOA estimation is conducted assuming a straight line array. The other simulation conditions are the same as above. The corresponding DOA estimation results are given in Figure 4B for an SNR of 10 dB.
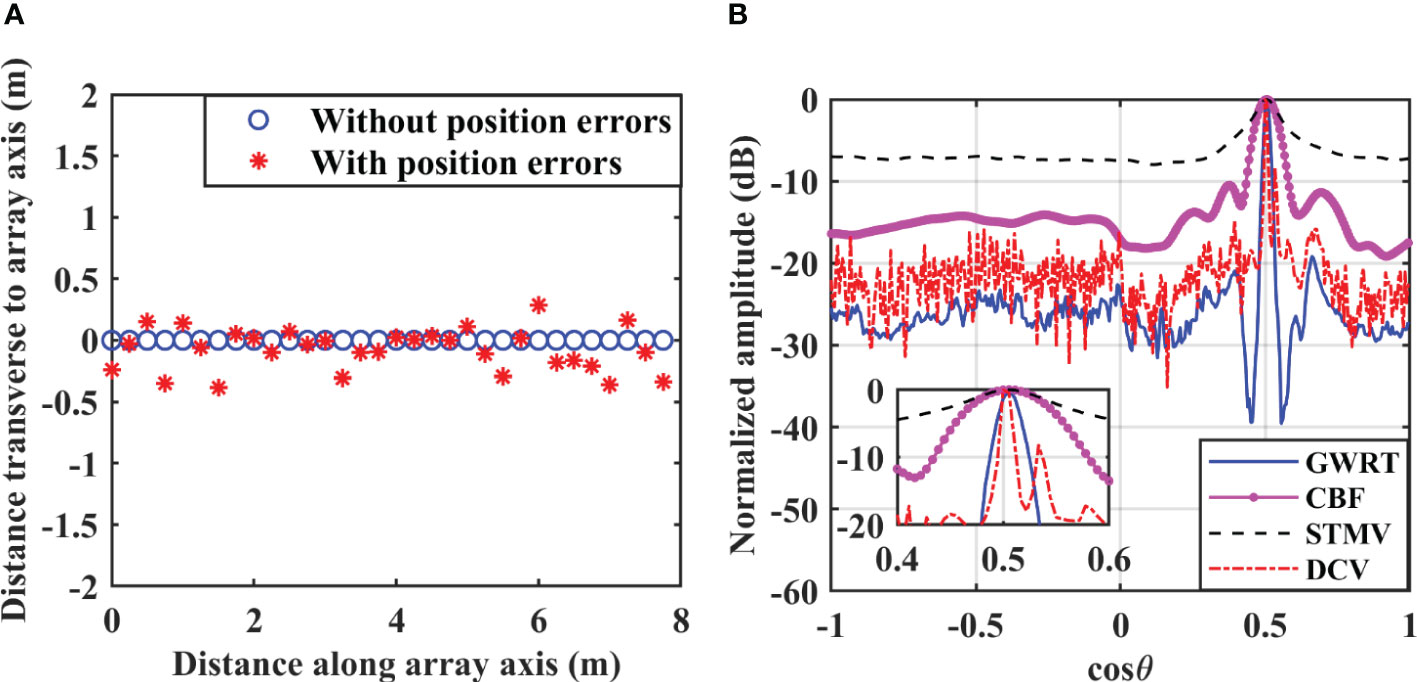
Figure 4 DOA estimation results for four methods with position errors. (A) Top view of the array configuration. (B) SNR=10 dB.
Compared to Figure 3C, these results show that the sidelobe levels increase with position errors. The STMV method has the greatest performance degradation, and the DCV method has false peaks which may significantly affect the estimation accuracy. The GWRT method still has the lowest sidelobe levels and so has good robustness even with position errors.
4.3 Multiple sources
To further evaluate the proposed method, the performance with three targets is now obtained. The three broadband targets are located at the far field of the array with directions , , and . The SNRs of these targets are -5dB, 10dB and -5dB, respectively. The other simulation conditions are the same as above. Figure 5A presents and the DOA estimation results are shown in Figure 5B.
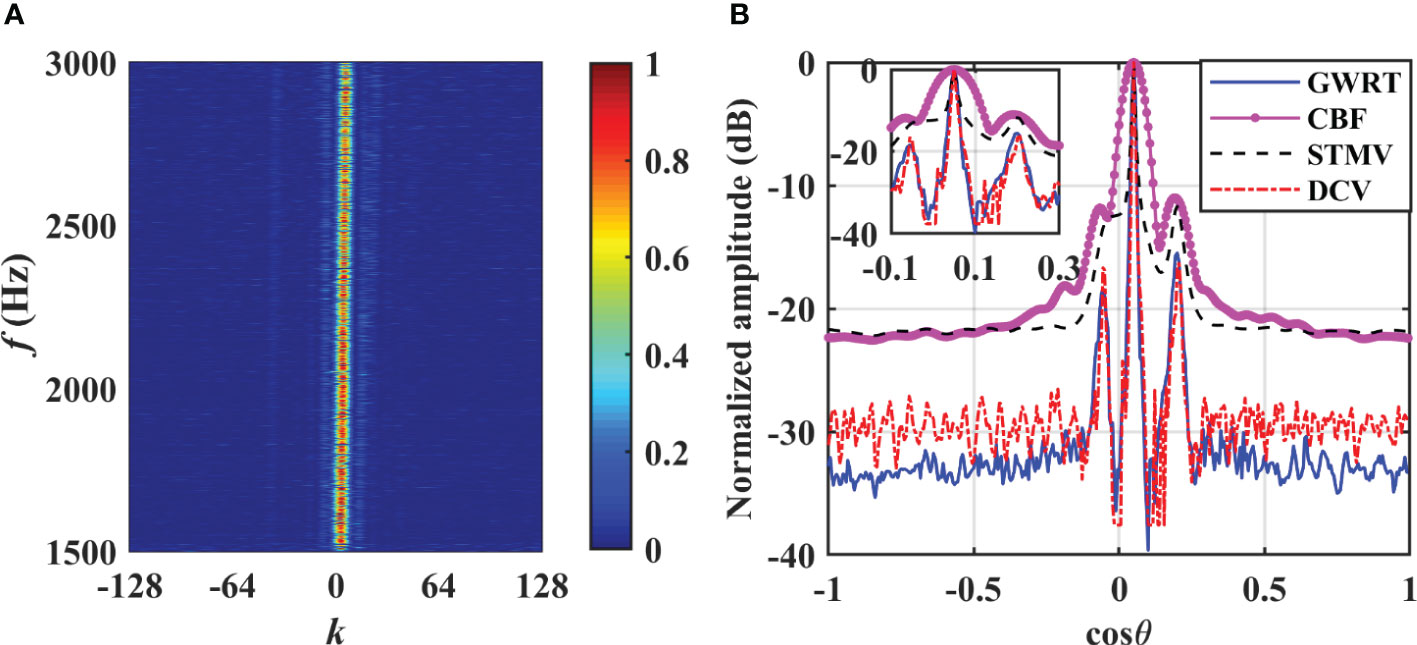
Figure 5 DOA estimation results for multiple sources. (A) . (B) Azimuth spectrum.
These results indicate the CBF and STMV methods only identify the second and third targets. This is because the directions of the first and second targets are close and the energy difference is large. The DCV and GWRT methods are able to distinguish all three targets. Although these methods have similar mainlobe widths, the former method produces false peaks and has higher sidelobe levels, making it easy for weak targets to be missed. The peak-energy lines in Figure 5A corresponding to the first and third targets are barely distinguishable due to the strong interference from the second target. However, the proposed method uses information in the azimuth-energy domain which confirms the advantages of the GWRT. Therefore, the proposed method herein has excellent anti-jamming capability and high-resolution performance even with multiple targets having different SNRs.
4.4 DOA estimation versus SNR and array size
The performance of the proposed method is now evaluated for different SNRs and numbers of array elements. The other simulation conditions are the same as in Section 4.1.
4.4.1 Effect of SNR
An increase in noise and/or interference affects the sidelobe levels and so can degrade performance as noise suppression and interference discrimination are determined by these levels (Ma et al., 2021). In this section, the highest sidelobe level in the azimuth spectrum and the root mean square error (RMSE) of the estimated azimuth are considered as the SNR varies from -10 dB to 10 dB. The RMSE of the estimated azimuth is calculated as
where is the number of Monte Carlo trials, and and are the estimated azimuth for the th independent experiment and the true orientation of the target, respectively. The scanning interval is 1/18000 rad herein. The average results for 100 Monte Carlo trials are given in Figure 6. Figure 6A shows that the highest sidelobe level decreases with increasing SNR for all four methods. For SNR>5dB, the highest sidelobe level with the CBF method is around -13 dB, and the performance of the STMV method is slightly worse than with the DCV method. The sidelobe levels with the GWRT method are lower than the other methods for all SNR values, and at least 4 dB less than with the DCV method which is the second best. The SNR in underwater acoustic applications is often low so the proposed method is preferable. Additionally, the Cramér-Rao bound (CRB) (Feng and Huang, 2007) is included as a reference for DOA estimation performance, as shown in Figure 6B. The RMSE of the GWRT method is smaller in comparison to the DCV and STMV methods, with only a slight increase relative to the CBF method.
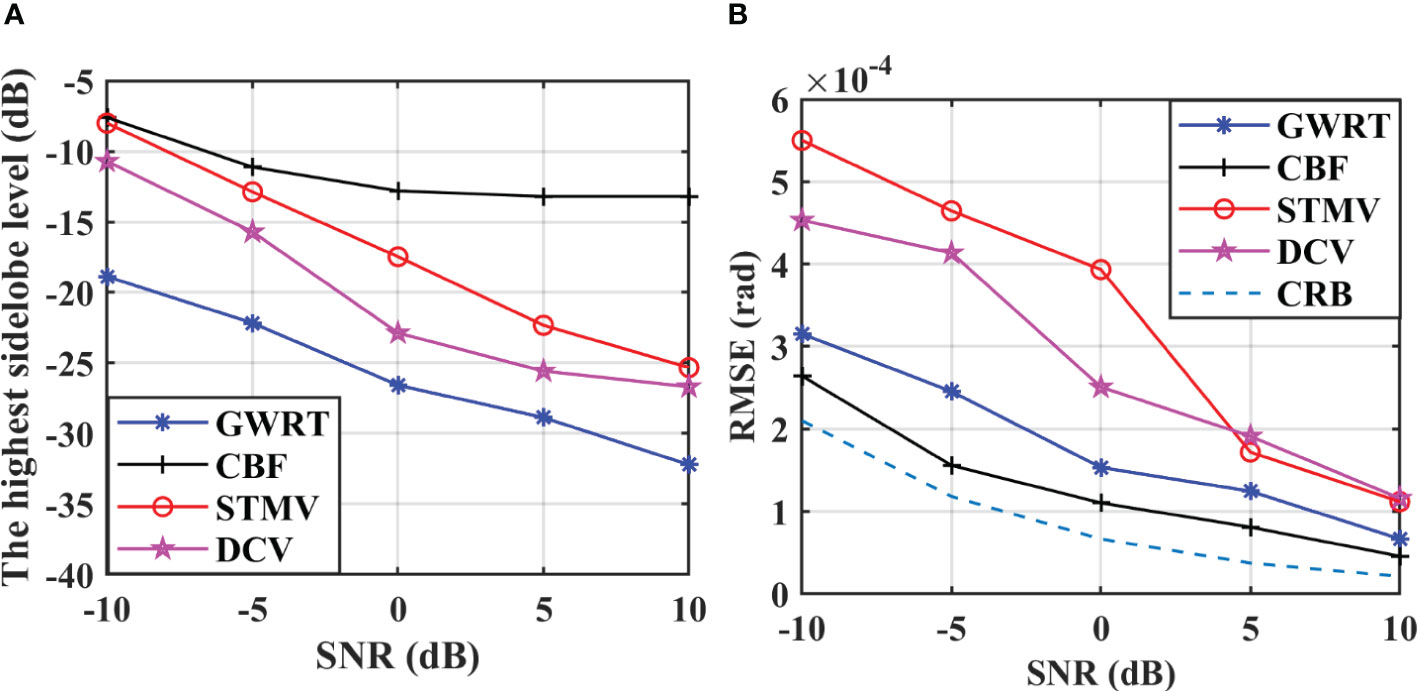
Figure 6 The performance versus SNR for four methods. (A) The highest sidelobe level versus SNR for four methods. (B) The RMSE versus SNR for four methods.
4.4.2 Effect of the number of array elements
Angle resolution is the smallest angle difference between the directions of two targets and is an important criterion in evaluating DOA estimation methods. The angle resolution of the four algorithms was evaluated for different numbers of array elements and frequency bands. The number of elements varies from 12 to 36, and the frequency bands are 2500 Hz to 3000 Hz and 1500 Hz to 3000 Hz, respectively. The average angle resolution for 100 Monte Carlo trials for an SNR of 10 dB is given in Figure 7. This shows that the angle resolution improves with an increase in the number of elements with all four methods. The DCV method exhibits the highest resolution, followed by the GWRT method and the STMV, all of which outperform the CBF. Comparing Figures 7A, B indicates that the performance of the STMV method is severely degraded with a wider frequency band. The main reason is that the covariance matrix is obtained by averaging the covariance matrices for each frequency point, and increasing the number of frequency points decreases the accuracy of this matrix and thus the angle resolution. However, the GWRT method has better robustness with broadband signals. Furthermore, as discussed in Section 3, the resolution of the GWRT can be less than , which is consistent with these results.
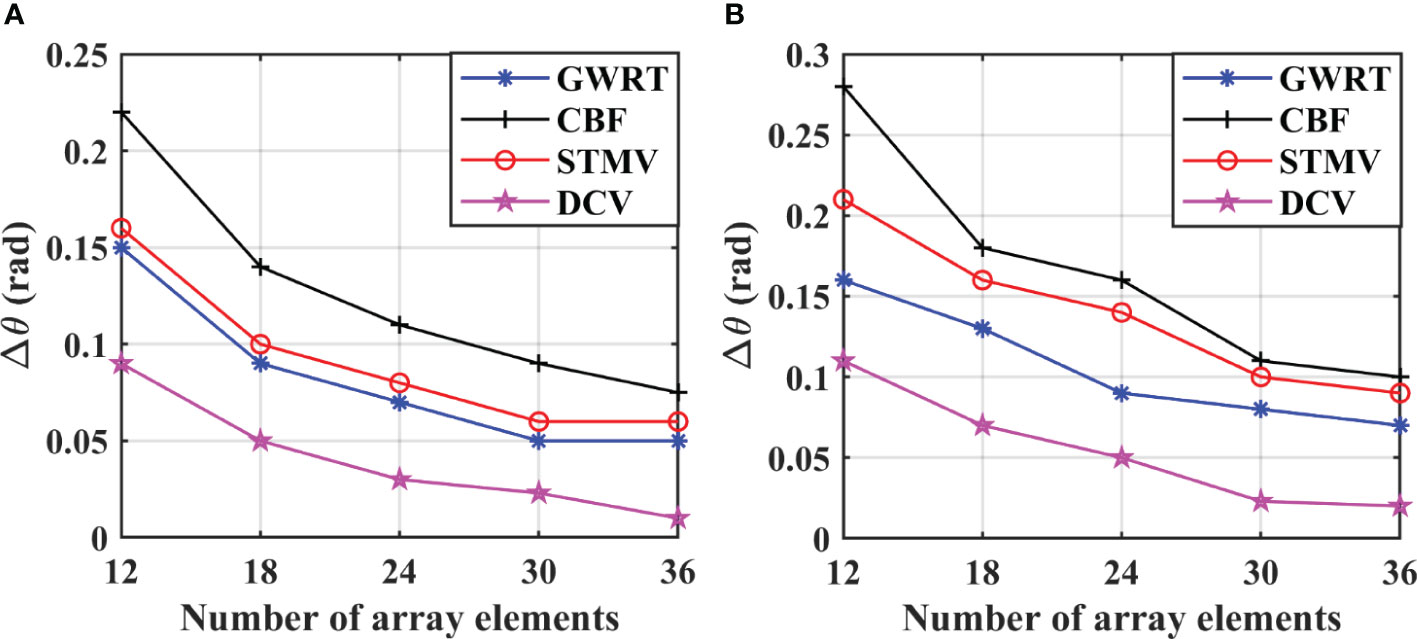
Figure 7 The angle resolution versus the number of array elements for two frequency bands and four methods. (A) 2500~3000Hz. (B) 1500~3000Hz.
5 Sea-trial results
To evaluate the performance of the proposed method in practical applications, DOA estimation results were obtained for a towed line array with 32 elements uniformly spaced at 2 m. The experiments were conducted in Huanghai Sea, China in the summer of 2014. The water depth was approximately 40 m and the towed array was about 20 m above the sea floor. The recorded data suggests that the received signals include signals from passing vessels, experimental vessels, and the broadband pulses transmitted by the experimental vessels. The sampling frequency was equal to 8 kHz, with a total of 120 data frames, each comprising 4096 samples. The data within the frequency range of 1500 to 3000 Hz was processed using the CBF, STMV, DCV, and GWRT methods and the bearing time records (BTRs) are given in Figure 8. Additionally, the low-frequency analysis and recording (LOFAR) for the data from one element is shown in Figure 9.
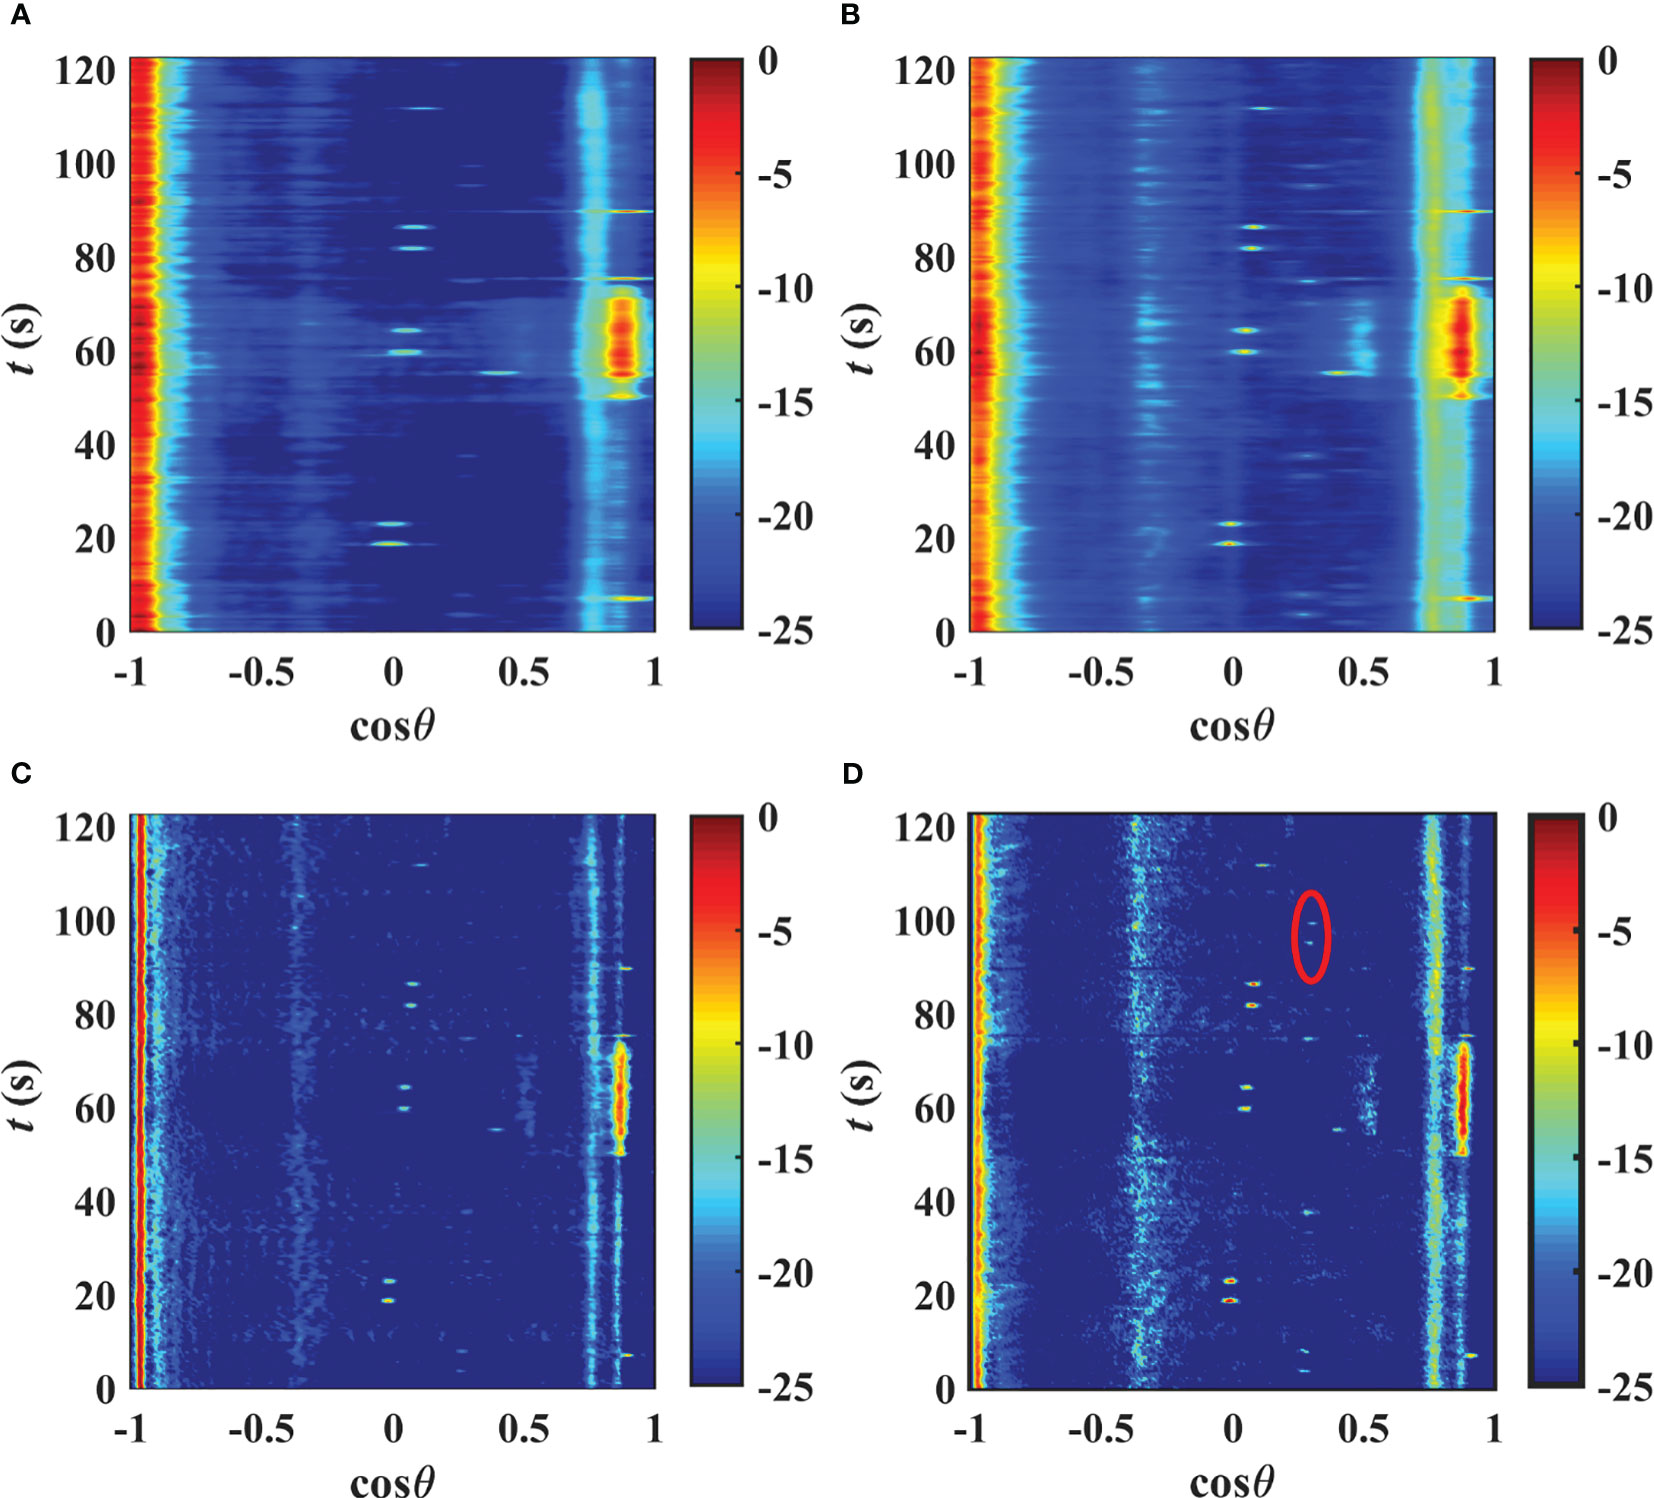
Figure 8 BTRs for four methods. (A) CBF. (B) STMV. (C) DCV. (D) GWRT.
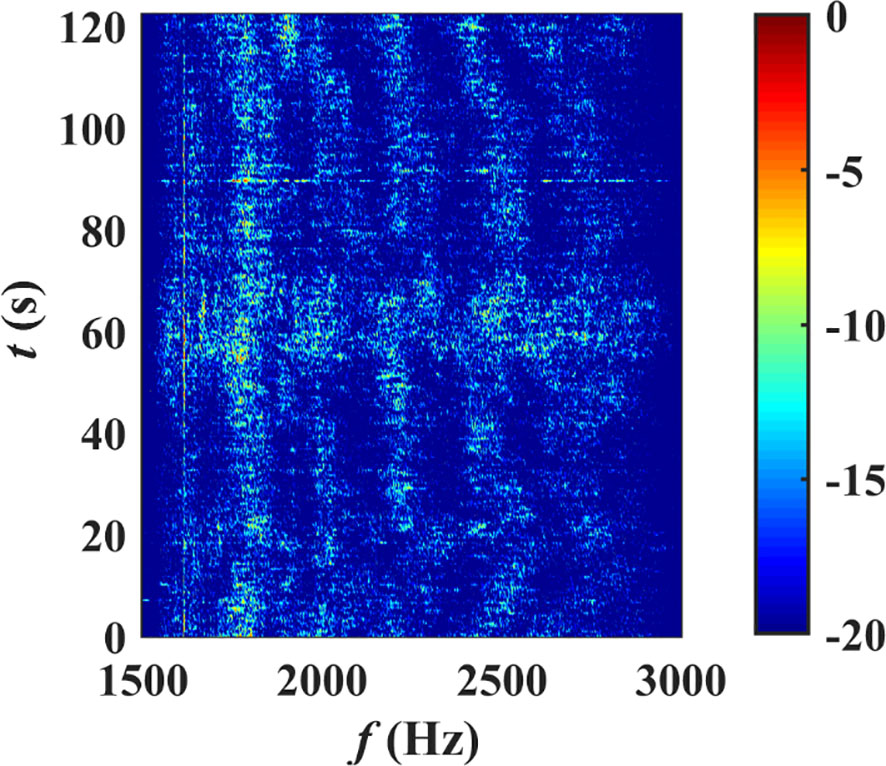
Figure 9 LOFAR for the data from one element.
The BTRs for the CBF method in Figure 8A show that due to the Rayleigh limit and the ambient ocean noise, the mainlobe width for each target is relatively wide so it is not possible to distinguish the targets located in the directions around and cosθ=0.88. Figure 8B indicates that the STMV method has a narrower mainwidth but still fails to distinguish the two targets. The BTRs for the DCV and GWRT methods in Figures 8C, D, respectively, have much clearer backgrounds than with the CBF and STMV methods. The target trajectories are clearly distinguishable with a much narrower mainlobe width for each target. Figure 8 also shows a set of broadband pulse signals in the direction of around . There are two clear focused points in the red circle in Figure 8D which are not as well distinguished by other methods. This indicates that the GWRT method has a lower background noise level and thus better weak target detection and anti-interference capability.
Figure 10 gives the BTRs for the four methods at 60 s. These results indicate that the target located in the direction of around cannot be distinguished by the CBF and STMV methods due to the strong inference from the target located in the direction of around . Conversely, both the DCV and GWRT methods clearly distinguish these targets. The GWRT method has a mainlobe width similar to that of the DCV method but the sidelobe levels are lower. Thus, it is better able to suppress the interference due to strong targets and noise which makes it easier to detect weak targets. Therefore, the proposed method provides better high-resolution performance in multiple target environments.
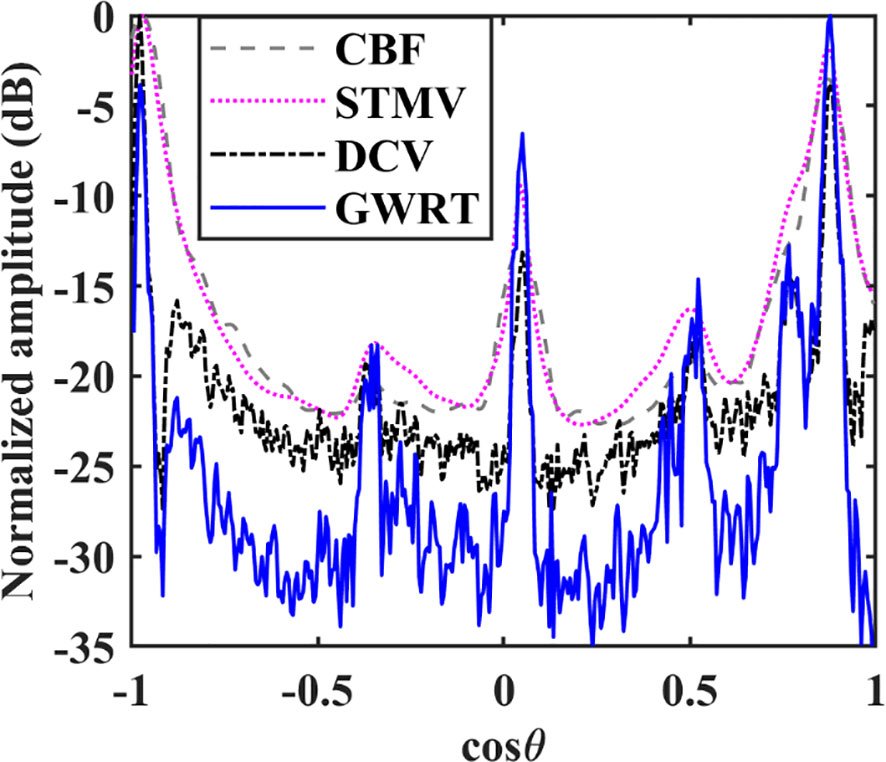
Figure 10 BTRs for four methods at 60 s.
6 Conclusion
A generalized weighted Radon transform to estimate the DOA for broadband targets was proposed. The GWRT was used on the conditional wavenumber spectrum density to convert image information in the f-k domain to the azimuth-energy domain for high-resolution DOA estimation. Simulation and sea-trial results were presented which show that the proposed method is simple and effective and does not require a priori information. It is not sensitive to the outliers and thus provides good robustness even with position errors. Furthermore, it produces a narrow mainlobe with low sidelobe levels which results in good performance when there are multiple targets and the target SNR is low. However, the proposed method is only applicable for broadband signals and it is not suitable for real-time applications. Therefore, a short-time model for DOA estimation with narrow-band signals will be considered as future work.
Data availability statement
The raw data supporting the conclusions of this article will be made available by the authors, without undue reservation.
Author contributions
ML: Conceptualization, Validation, Writing – original draft, Methodology. DS: Supervision, Writing – review & editing, Funding acquisition, Project administration. TG: Supervision, Writing – review & editing, Validation. YL: Supervision, Writing – review & editing, Data curation, Validation. JM: Data curation, Supervision, Validation, Writing – review & editing.
Funding
The author(s) declare financial support was received for the research, authorship, and/or publication of this article. This work was supported by the National Natural Science Foundation of China Grant No. 61871144.
Conflict of interest
The authors declare that the research was conducted in the absence of any commercial or financial relationships that could be construed as a potential conflict of interest.
Publisher’s note
All claims expressed in this article are solely those of the authors and do not necessarily represent those of their affiliated organizations, or those of the publisher, the editors and the reviewers. Any product that may be evaluated in this article, or claim that may be made by its manufacturer, is not guaranteed or endorsed by the publisher.
References
Alpatov B. A., Babayan P. V., Shubin N. Y. (2015). Weighted Radon transform for line detection in noisy images. J. Electronic Imaging. 24 (2), 23023. doi: 10.1117/1.JEI.24.2.023023
Baggeroer A. B., Cox H. (1999). “Passive sonar limits upon nulling multiple moving ships with large aperture arrays,” in Conference record of the thirty-third asilomar conference on signals, systems, and computers (USA: IEEE), 103–108. doi: 10.1109/ACSSC.1999.832304
Beall J. M., Kim Y. C., Powers E. J. (1982). Estimation of wavenumber and frequency spectra using fixed probe pairs. J. Appl. Physics. 53 (6), 3933–3940. doi: 10.1063/1.331279
Bengtsson M., Ottersten B. (2001). A generalization of weighted subspace fitting to full-rank models. IEEE Trans. Signal Processing. 49 (5), 1002–1012. doi: 10.1109/78.917804
Burg J. P. (1975). Maximum entropy spectral analysis (California, United States: Stanford University).
Capon J. (1969). High-resolution frequency-wavenumber spectrum analysis. Proc. IEEE. 57 (8), 1408–1418. doi: 10.1109/PROC.1969.7278
Chen X., Zhang H., Gao Y., Wang Z. (2023). DOA estimation of underwater acoustic co-frequency sources for the coprime vector sensor array. Front. Mar. Science. 10. doi: 10.3389/fmars.2023.1211234
Cheng F., Xia J., Xu Z., Hu Y., Mi B. (2018). Frequency–wavenumber (FK)-based data selection in high-frequency passive surface wave survey. Surveys Geophysics. 39, 661–682. doi: 10.1007/s10712-018-9473-3
Feng X., Huang J. (2007). Cramer-Rao bound of DOA estimation for underwater wide band sources. Acta Armamentarii. 28 (3), 291–295. doi: 10.3321/j.issn:1000-1093.2007.03.008
Hansen K. V., Toft P. A. (1996). Fast curve estimation using preconditioned generalized Radon transform. IEEE Trans. Image Process. 5(12), 1651–1661. doi: 10.1109/83.544572
Krolik J., Swingler D. (1989). Multiple broad-band source location using steered covariance matrices. IEEE Trans. Acoustics Speech Signal Processing. 37 (10), 1481–1494. doi: 10.1109/29.35386
Li X., Huang H., Li Y., Ye Q., Zhang Y. (2019). A broadband high resolution direction of arrival estimation algorithm based on conditional wavenumber spectral density. Chin. J. Acoustics. 44 (4), 585–594. doi: 10.15949/j.cnki.0371-0025.2019.04.019
Luo X., Shen Z. (2021). A space-frequency joint detection and tracking method for line-spectrum components of underwater acoustic signals. Appl. Acoustics. 172, 107609. doi: 10.1016/j.apacoust.2020.107609
Ma C., Sun D., Mei J., Teng T. (2021). Spatiotemporal two-dimensional deconvolution beam imaging technology. Appl. Acoustics. 183, 108310. doi: 10.1016/j.apacoust.2021.108310
Radon J. (1986). On the determination of functions from their integral values along certain manifolds. IEEE Trans. Med. Imaging. 5 (4), 170–176. doi: 10.1109/TMI.1986.4307775
Rao B. D., Hari K. S. (1989). Performance analysis of root-MUSIC. IEEE Trans. Acoustics Speech Signal Processing. 37 (12), 1939–1949. doi: 10.1109/29.45540
Roy R., Kailath T. (1989). ESPRIT-estimation of signal parameters via rotational invariance techniques. IEEE Trans. Acoustics Speech Signal Processing. 37 (7), 984–995. doi: 10.1109/29.32276
Schmidt R. (1986). Multiple emitter location and signal parameter estimation. IEEE Trans. Antennas Propagation. 34 (3), 276–280. doi: 10.1109/TAP.1986.1143830
Somasundaram S. D. (2012). Wideband robust capon beamforming for passive sonar. IEEE J. Oceanic Engineering. 38 (2), 308–322. doi: 10.1109/JOE.2012.2223560
Somasundaram S. D., Butt N. R., Jakobsson A., Hart L. (2015). Low-complexity uncertainty-set-based robust adaptive beamforming for passive sonar. IEEE J. Oceanic Engineering. 99, 1–17. doi: 10.1109/JOE.2015.2474495
Stoica P., Nehorai A. (1989). MUSIC, maximum likelihood, and Cramer-Rao bound. IEEE Trans. Acoustics Speech Signal processing. 37 (5), 720–741. doi: 10.1109/29.17564
Sun D., Lu M., Mei J., Wang S., Pei Y. (2021). Generalized Radon transform approach to target motion parameter estimation using a stationary underwater vector hydrophone. J. Acoustical Soc. America. 150 (2), 952–968. doi: 10.1121/10.0005813
Sun D., Ma C., Mei J., Shi W. (2020). Improving the resolution of underwater acoustic image measurement by deconvolution. Appl. Acoustics. 165, 107292. doi: 10.1016/j.apacoust.2020.107292
Sun D., Ma C., Yang T. C., Mei J., Shi W. (2019). Improving the performance of a vector sensor line array by deconvolution. IEEE J. Oceanic Engineering. 45 (3), 1063–1077. doi: 10.1109/JOE.2019.2912586
Vincent L. (1992). “Morphological grayscale reconstruction: definition, efficient algorithm and applications in image analysis,” in Proceedings of the IEEE computer society conference on computer vision and pattern recognition (USA: IEEE), 633–635.
Vincent L. (1993). Morphological grayscale reconstruction in image analysis: applications and efficient algorithms. IEEE Trans. Image Processing. 2 (2), 176–201. doi: 10.1109/83.217222
Xie Z., Lin R., Wang L., Zhang A., Lin J., Tang X. (2023). Data augmentation and deep neural network classification based on ship radiated noise. Front. Mar. Science. 10. doi: 10.3389/fmars.2023.1113224
Yang P. (2023). An imaging algorithm for high-resolution imaging sonar system. Multimedia Tools Applications., 1–17. doi: 10.1007/s11042-023-16757-0
Yang T. C. (2017). Deconvolved conventional beamforming for a horizontal line array. IEEE J. Oceanic Engineering. 43 (1), 160–172. doi: 10.1109/JOE.2017.2680818
Yang T. C. (2018). Performance analysis of superdirectivity of circular arrays and implications for sonar systems. IEEE J. Oceanic Engineering. 44 (1), 156–166. doi: 10.1109/JOE.2018.2801144
Yang T. C. (2019). Superdirective beamforming applied to SWellEx96 horizontal arrays data for source localization. J. Acoustical Soc. America. 145 (3), 179–184. doi: 10.1121/1.5092580
Ye K., Cai Y., Hong S., Sun H. (2023). Direction-of-arrival estimation based on difference-sum co-array of a special coprime array. Electron. Letters. 59 (2), e12701. doi: 10.1049/ell2.12701
Zhang X., Wu H., Sun H., Ying W. (2021). Multireceiver SAS imagery based on monostatic conversion. IEEE J. Selected Topics Appl. Earth Observations Remote Sensing. 14, 10835–10853. doi: 10.1109/JSTARS.2021.3121405
Zhao M., Wang W., Ren Q., Ni H., Xiao X., Ma L. (2023). Modified you-only-look-once model for joint source detection and azimuth estimation in a multi-interfering underwater acoustic environment. J. Acoustical Soc. America. 153 (4), 2393–2393. doi: 10.1121/10.0017828
Zhou L., Ye K., Qi J., Sun H. (2022). DOA estimation based on pseudo-noise subspace for relocating enhanced nested array. IEEE Signal Process. Letters. 29, 1858–1862. doi: 10.1109/LSP.2022.3199149
Keywords: direction of arrival estimation, generalized weighted Radon transform, broadband signal, high-resolution, low sidelobe levels
Citation: Lu M, Sun D, Gulliver TA, Lv Y and Mei J (2024) Broadband high-resolution direction of arrival estimation using the generalized weighted Radon transform. Front. Mar. Sci. 10:1329898. doi: 10.3389/fmars.2023.1329898
Received: 30 October 2023; Accepted: 18 December 2023;
Published: 08 January 2024.
Edited by:
Xuebo Zhang, Northwest Normal University, ChinaReviewed by:
Yanqun Wu, National University of Defense Technology, ChinaWei Guo, National University of Defense Technology, China
Kun Ye, Xiamen University, China
Copyright © 2024 Lu, Sun, Gulliver, Lv and Mei. This is an open-access article distributed under the terms of the Creative Commons Attribution License (CC BY). The use, distribution or reproduction in other forums is permitted, provided the original author(s) and the copyright owner(s) are credited and that the original publication in this journal is cited, in accordance with accepted academic practice. No use, distribution or reproduction is permitted which does not comply with these terms.
*Correspondence: Yunfei Lv, bHZ5dW5mZWlAaHJiZXUuZWR1LmNu; Jidan Mei, bWVpamlkYW5AaHJiZXUuZWR1LmNu