 Yebao Wang
 Peipei Du
 Jingyi Wang1
- 1School of Ocean, Yantai University, Yantai, China
- 2Weifang University, Weifang, China
- 3Yantai Marine Environment Monitoring Center Station, State Oceanic Administration, Yantai, China
- 4Yantai Research Institute of Harbin Engineering, Yantai, China
- 5Key Laboratory of Space Ocean Remote Sensing and Application (LORA), Ministry of Natural Resources, Qingdao, China
Coastal fishery systems are vital for both the environment and the economy, and at present, they face heightened vulnerability due to global climate change and natural disasters. A clearer understanding of the challenges that the system presents can be obtained by examining the vulnerabilities of fishery systems. This study employed a vulnerability scoping diagram framework and a multi-indicator approach combined with the entropy weight method for assigning weights to systematically evaluate the vulnerabilities of fishery systems in China’s coastal provinces. The spatiotemporal variation characteristics of vulnerability were analyzed and characterized, and the primary obstacles that affect vulnerability are discussed. The findings suggest that China’s coastal provinces’ fishery systems display vulnerability in terms of both time and space. From a temporal perspective, Liaoning, Hebei, and Shandong provinces exhibited an increasing trend in vulnerability, while Tianjin, Jiangsu, Zhejiang, Shanghai, Fujian, Guangdong, Guangxi, and Hainan showed decreasing trends. From a spatial perspective, Hainan and Liaoning’s fishery systems exhibited extremely high vulnerability in most years. In contrast, Tianjin consistently experienced extremely low vulnerability in most years. From the perspective of obstacles, the main factor was the funding for the extension of aquaculture technology, and this remained the primary obstacle factor across all years. The findings are significant for enhancing our understanding of vulnerability in fishery systems and for strengthening disaster prevention and mitigation measures. The results provide robust support for the improvement of management and the protection of fishery systems.
1 Introduction
Fisheries constitute one of humanity’s earliest production endeavors, and thus boast a rich historical legacy. Coastal fishery systems, as a vital convergence of the ecological environment and economic development, have increasingly revealed their vulnerability under the influence of well-known factors such as global climate change and natural disasters (Drury O’Neill et al., 2019; Ho et al., 2020). Affected fisheries could pose a challenge to meeting the demand for food in developing countries, while developed countries could encounter economic setbacks. As global climate change and natural disasters continue to intensify, their impacts on fish inhabiting natural or man-made environments will become more critical (Ficke et al., 2007). Therefore, conducting an in-depth assessment of these vulnerabilities not only will enhance our understanding of the threats fisheries face, but can also guide effective mitigation and management strategies.
In China, the rapid expansion of the fisheries industry commenced during the late 1970s. With a focus on attaining food self-sufficiency, the government placed increasing emphasis on augmenting the availability of animal protein. As a pivotal component of agriculture, fisheries have catalyzed the emergence of various ancillary sectors, including construction, logistics, and services (Zhao and Jia, 2020). The advancement of fisheries has not only substantially elevated rural income, but also has had a significant impact on both local and national economies. After years of continuous development, in 2022 the overall economic production value of China’s fisheries amounted to 3.0873 trillion Chinese yuan (CNY), constituting 21% of the agricultural sector (14.7 trillion CNY), and the workforce engaged in fishery-related activities numbered 16.1945 million (China Fishery Statistical Yearbook, 2023). Globally, China remains the dominant force in global aquaculture production, contributing more than 60% of the total output. This continued preeminence extends to both the inland and marine aquaculture sectors (Hu et al., 2021). China possesses a coastline that is 32,000 km in length, and various types of marine disasters occur along it frequently (Wang et al., 2023). Therefore, there is a pressing need for a thorough understanding of the vulnerability of the fishery system in China.
Geographically, the entire Chinese mainland encompasses 11 coastal provincial-level administrative divisions. In the year 2022, the total fishery production value of these coastal provinces amounted to 2.2047 trillion CNY, constituting 71.4% of the overall fishery production value across China (3.0873 trillion CNY) (China Fishery Statistical Yearbook, 2023). Hence, in coastal provinces where freshwater and marine aquaculture coexist, the vulnerability of the fishing systems deserves greater attention.
To comprehensively assess the vulnerability of coastal provinces’ fishery systems and thereby gain a deeper understanding of the vulnerabilities and challenges that fishery systems face, this study employed a vulnerability scoping diagram (VSD) framework along with a multi-indicator comprehensive assessment method to systematically analyze the vulnerability of coastal provinces’ fishery systems. We separately considered the exposure, sensitivity, and adaptability of the systems and characterized their vulnerability features through both quantitative and qualitative means. Through the vulnerability assessment conducted in this study, we anticipate providing scientific support for the management and decision-making of coastal provinces’ fishery systems. The research findings will shed light on the vulnerabilities present, thereby serving as a reference for governmental bodies and stakeholders in formulating sustainable development strategies. Furthermore, this study will contribute insights and experiences for vulnerability assessments in similar regions, promoting sustainable development and the ecological conservation of fishery systems.
The remainder of this paper is organized as follows: the data and methods used in this study are described in the second section, while the third section provides the analysis results, the fourth section analyzes the obstacle degree, the fifth section discusses the implications of the results, and the sixth section summarizes the study’s major conclusions.
2 Data and methods
2.1 Study area
The dataset furnishes crucial information concerning fishery system variables and is thus instrumental for conducting a thorough vulnerability analysis. This research specifically centered on the coastal provinces of mainland China; these provinces are strategically situated, including several important municipalities from the northernmost to the southernmost regions. To aid in comprehension, all the locations included in the study have been visually depicted using a map (Figure 1).
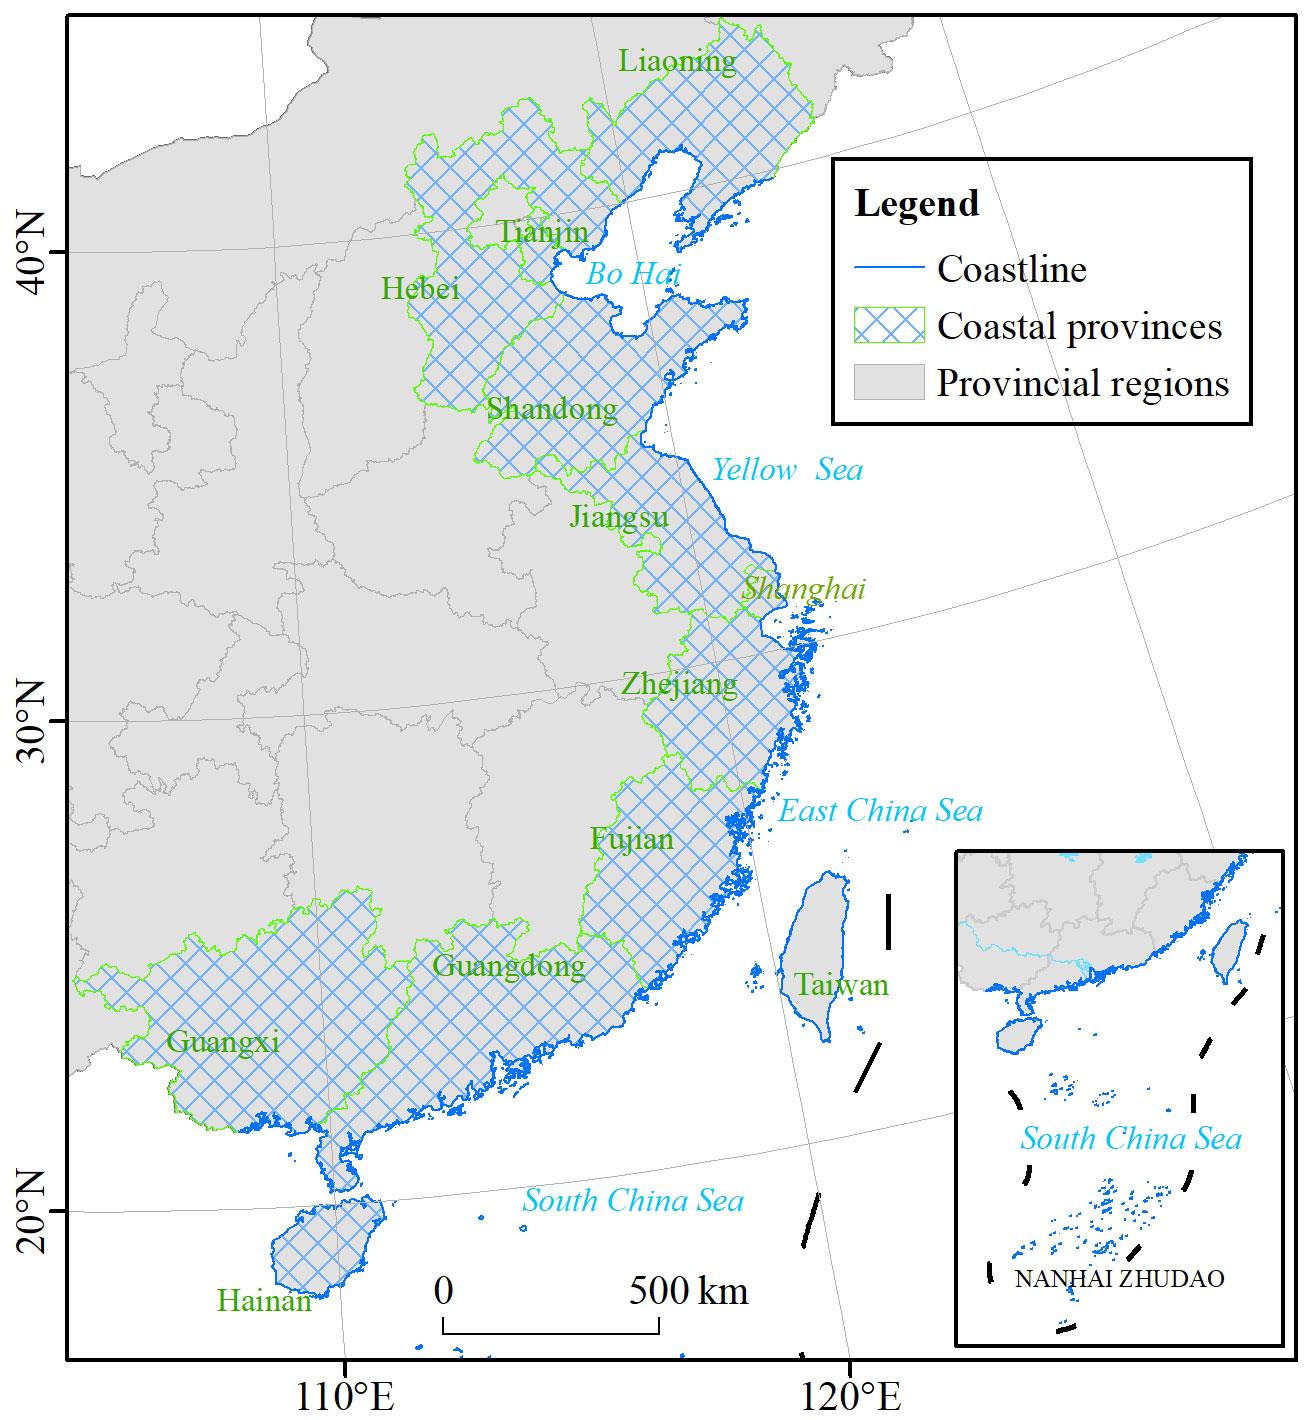
Figure 1 The study area.
The research area for this study only includes the coastal provinces of mainland China, and so does not encompass the Hong Kong, Macau, and Taiwan regions. From north to south, the included provinces are Liaoning Province, Hebei Province, Tianjin Municipality, Shandong Province, Jiangsu Province, Shanghai Municipality, Zhejiang Province, Fujian Province, Guangdong Province, the Guangxi Autonomous Region, and Hainan Province. Of these, Tianjin and Shanghai are municipalities that also function as provincial-level administrative regions.
Geographically, the offshore waters of China are segmented into the Bohai Sea, the Yellow Sea, the East China Sea, and the South China Sea, progressing from the northernmost to the southernmost regions.
2.2 Vulnerability assessment framework
When conducting vulnerability assessments, the VSD stands out as a widely utilized framework, being especially renowned for its application in the analysis of the vulnerabilities of coupled systems (Gong et al., 2022). Originally developed by Polsky, the VSD framework dissects vulnerability into three distinct dimensions: exposure, sensitivity, and adaptability (Polsky et al., 2007). Its primary utility lies in providing a foundation for comparing outcomes across various independent vulnerability assessments. Leveraging the VSD approach, the vulnerability assessment indicators for fishery systems will be methodically broken down into the components of exposure, sensitivity, and adaptability.
2.3 Data sources and indicators
To assess the vulnerability of the fishery system in China, this study gathered official statistical data from credible governmental sources, including the China Statistical Yearbook (CSY) (2000–2020), the Statistical Bulletin of China’s Marine Economy (SBCME) (2000–2020), and the China Fishery Statistics Yearbooks (2000–2020). To ensure the comprehensiveness and representativeness of the vulnerability analysis, this study referred to previous research (Li et al., 2019a; Li and Jin, 2019b) when selecting indicators; we chose 18 representative indicators (Table 1). The selected indicators may have either positive or negative impacts on vulnerability. A positive effect (+) suggests that vulnerability increases with higher values of the assessment index, while a negative effect (-) suggests that vulnerability intensifies as the assessment index value decreases.
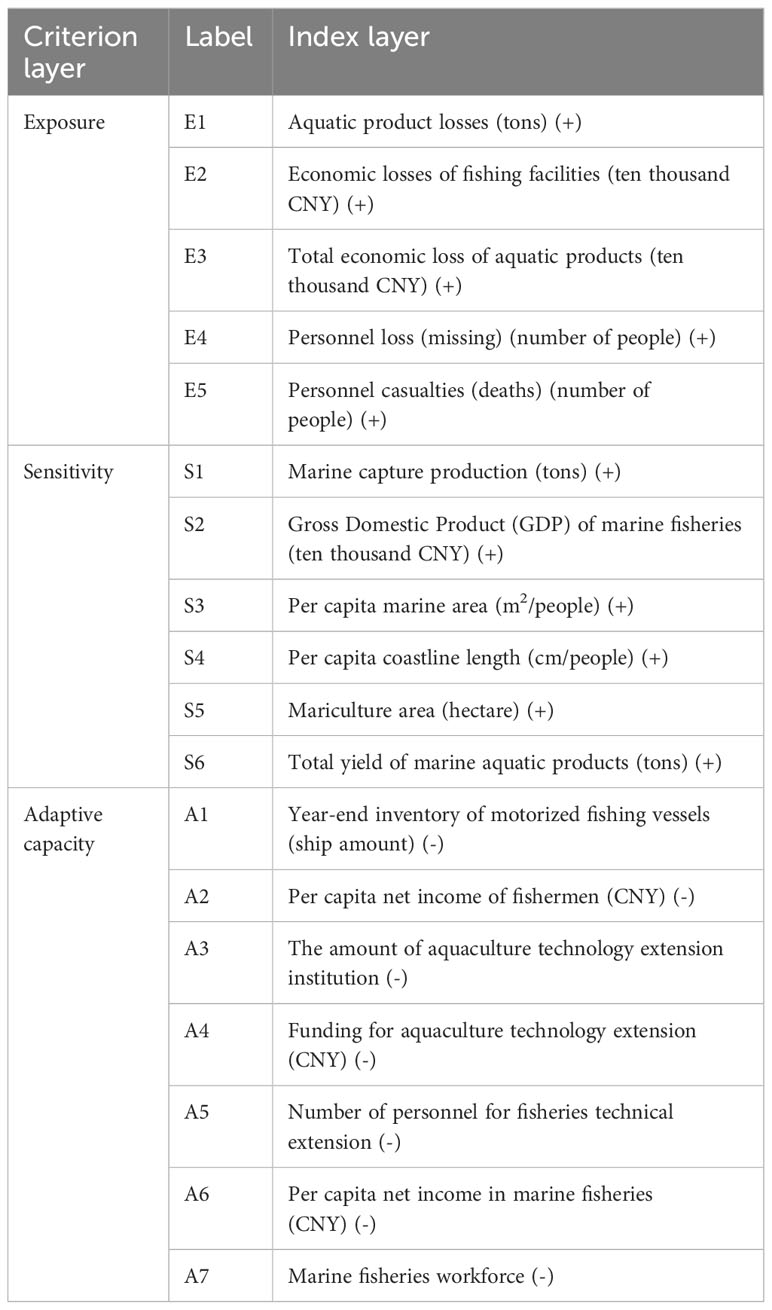
Table 1 Exposure, sensitivity, and adaptive capacity indicators.
2.4 Data processing
2.4.1 Recalculating GDP
To account for the effects of inflation and enable a comparison of economic data across different years, a consumer price index (CPI) adjustment was applied to the economic data starting from the year 2000. This adjustment converted the economic data to recalculated values using the following formula [(Equation 1)]:
In the above formula, “Recalculated GDP for year (i-2022)” represents the GDP values adjusted to reflect the year i based on the prices of 2022, GDPi represents the published GDP value for year i according to the CSY, CPI₂₀₂₂ represents the CPI index based on the year 2022, and CPIi represents the published CPI value for year i according to the CSY. This CPI adjustment helps eliminate the differences in economic statistical data caused by inflation, thus allowing for a more meaningful comparison of economic data across different years.
2.4.2 Constructing an evaluation matrix and preprocessing
We constructed a decision matrix for the data of each year from 2000 to 2020. The matrix contained m rows (the number of coastal provinces) and n columns (the number of indicators).
We first determined whether an indicator was positive. The negative indicators were converted to positive indicators by the following equation [(Equation 2)]:
where Max represents the maximum value for the indicator and is the value in the matrix that needs to be transformed into a positive indicator. The converted decision matrix is represented as follows [(Equation 3)]:
where m represents the number of coastal provinces (m = 11, in this study), and n represents the number of indicators (n = 18 in this study). The elements in the initial decision matrix, denoted as , represent the values of the j-th indicator for the i-th province.
Second, to eliminate the influence of different units of measurement for the indicators, it was necessary to normalize the evaluation matrix that had already been transformed into positive indicators. Each indicator j for each province i is normalized to be between 0 and 1.
2.5 Weight determination
Each indicator’s importance in determining the comprehensive vulnerability was determined by its weight. The entropy weight method (EWM) is a commonly used weighting technique that utilizes information entropy to calculate the entropy weight for each index based on its degree of variation. When compared with methods such as the analytic hierarchy process (AHP), the primary advantage of EWM lies in its objective empowerment process and ability to quantitatively measure uncertainty. In this study, we employed EWM to objectively assign weights to various oil spill source indicators, as they contained a substantial amount of information. The steps involved in the process were as follows, as described by Lu et al. (2017) and Bao et al. (2020):
Data standardization for matrix A [(Equation 5)]:
Calculating the standardized value of the jth indicator of the ith provinces [(Equation 6)]:
Calculating the information entropy of each indicator [(Equation 7)]:
After obtaining the information entropy for each indicator, the weights of the jth indicator can be calculated using the following formula [(Equation 8)]:
2.6 Calculation of the vulnerability index
In a specific year, for the ith province, its vulnerability index was calculated as follows [(Equation 9)]:
where VI represents the vulnerability index.
2.6 Calculation of obstacle degree
Obstacle degree was calculated based on (Equation 10) and (Equation 11), where represents the degree of deviation and represents obstacle degree of a certain indicator.
3 Results
3.1 Temporal evolution characteristics
By calculating the vulnerability indices of the fishery system for the 11 coastal provinces in China, the change trends of vulnerability for each province during the period of 2000–2020 were obtained separately. Overall, the vulnerability of each province has fluctuated over a 20-year time series, without showing a clear upward or downward trend (Figure 2A). To distinctly illustrate the specific trends of each province, the vulnerability change trends were plotted separately for each province (Figure 2B-L). From the graphs, it can be observed that among all 11 provinces, Liaoning, Hebei, and Shandong exhibited increasing trends in the vulnerability index, while the vulnerability indices of the other eight provinces (Tianjin, Jiangsu, Zhejiang, Shanghai, Fujian, Guangdong, Guangxi, and Hainan) showed decreasing trends.
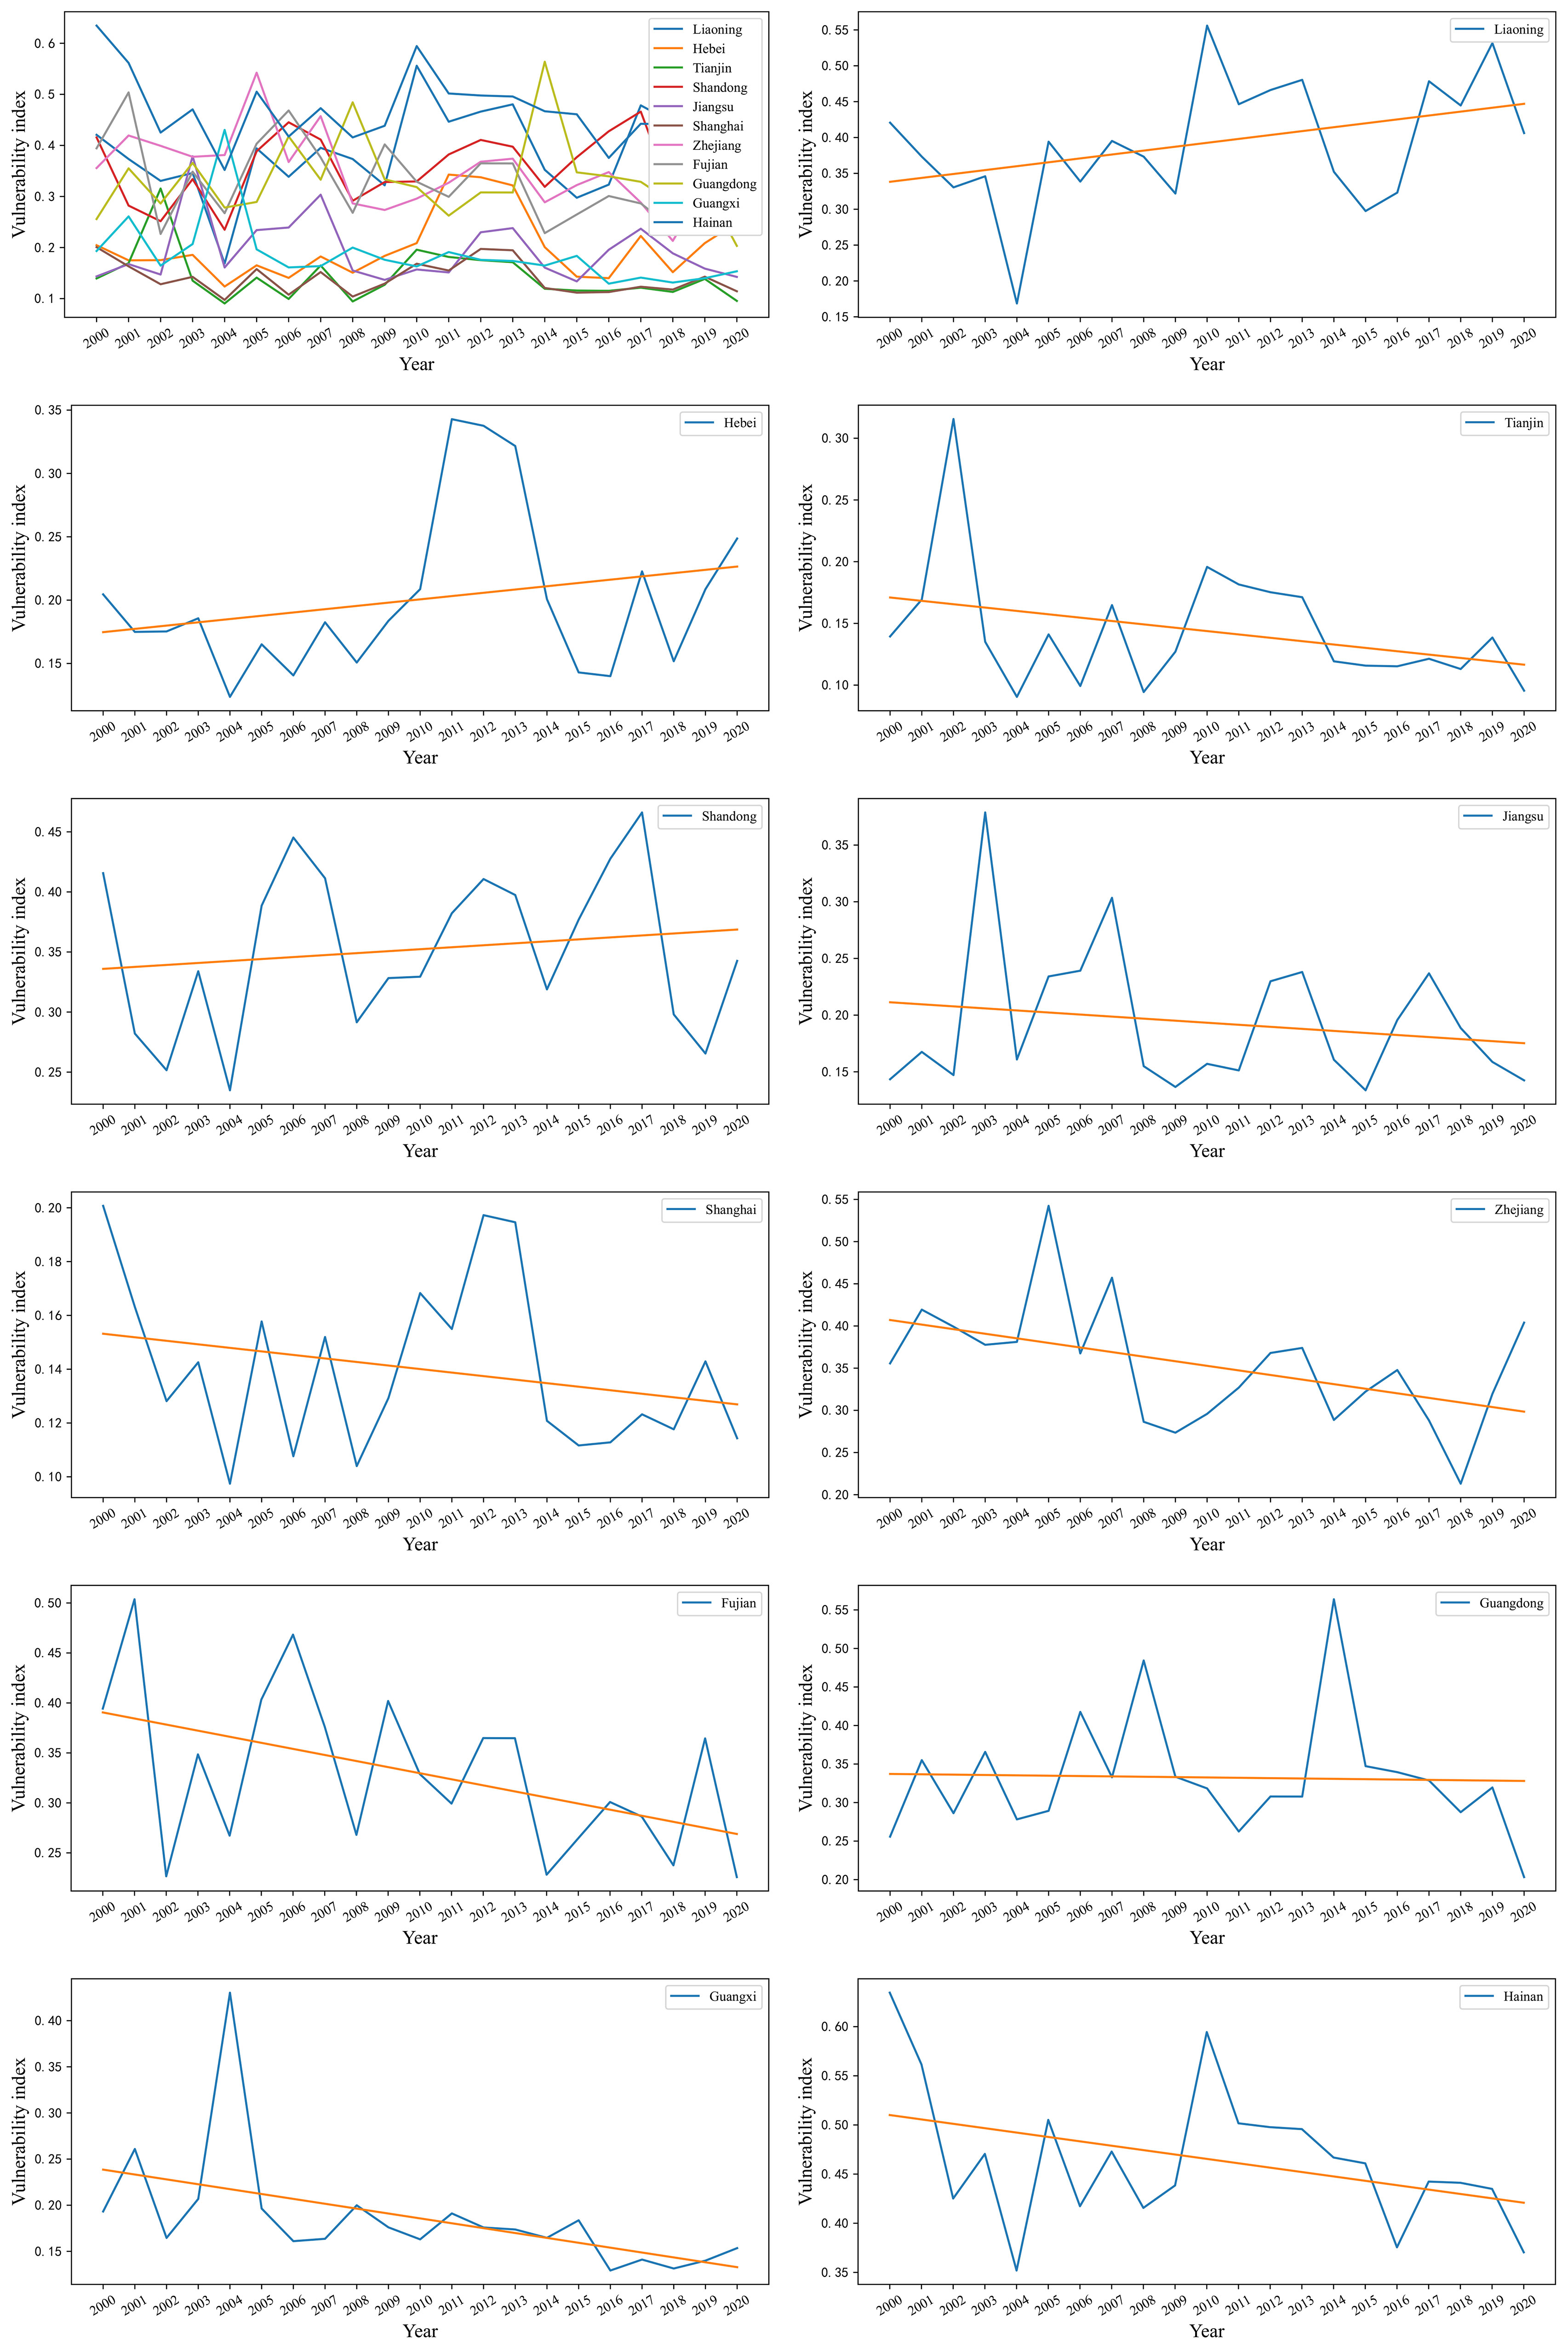
Figure 2 Vulnerability change trends from 2000 to 2020.
3.2 Spatial evolution characteristics
From Figure 2A, it can be observed that there was significant variation in vulnerability among different provinces from 2000 to 2020. To accurately describe these differences, this study selected vulnerability for the years 2000, 2005, 2010, 2015, and 2020 for analysis (Table 2). These vulnerability indices were categorized into five classes using the quantile method (extremely low, relatively low, medium, relatively high, and extremely high). These categories were then mapped onto a spatial diagram (Figure 3) to visually represent the degree of spatial heterogeneity.
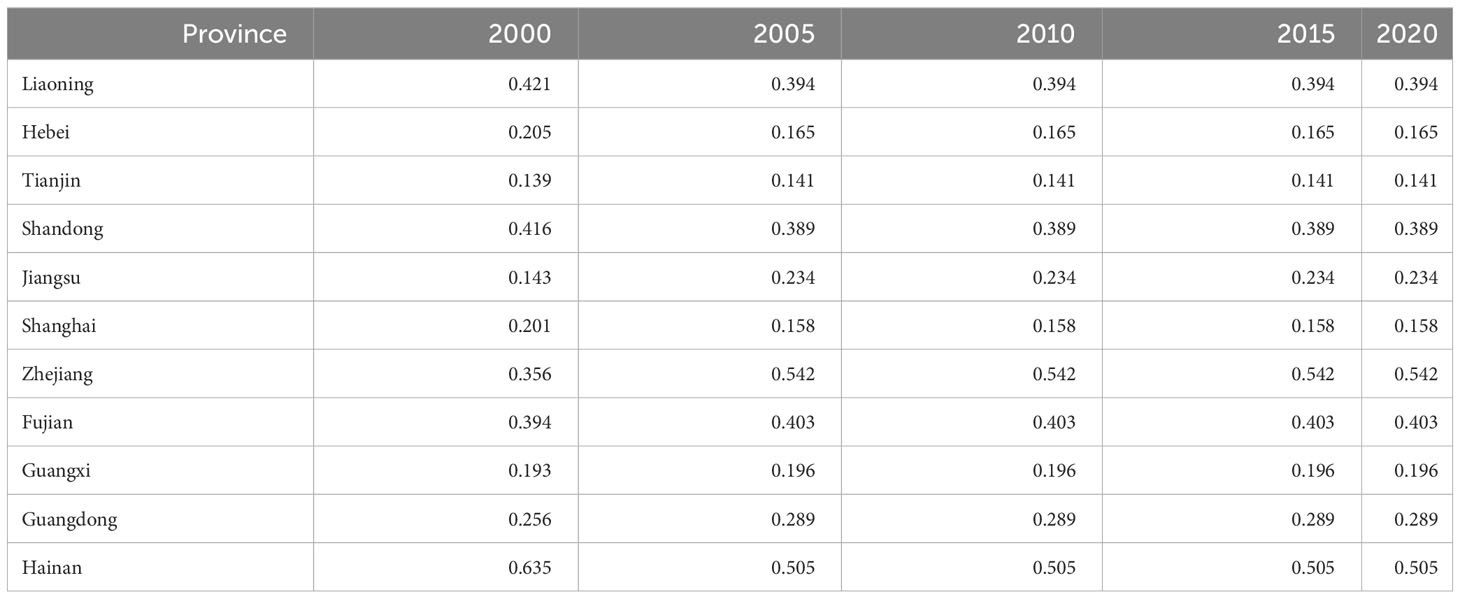
Table 2 Calculated vulnerability index (retaining three decimal places).
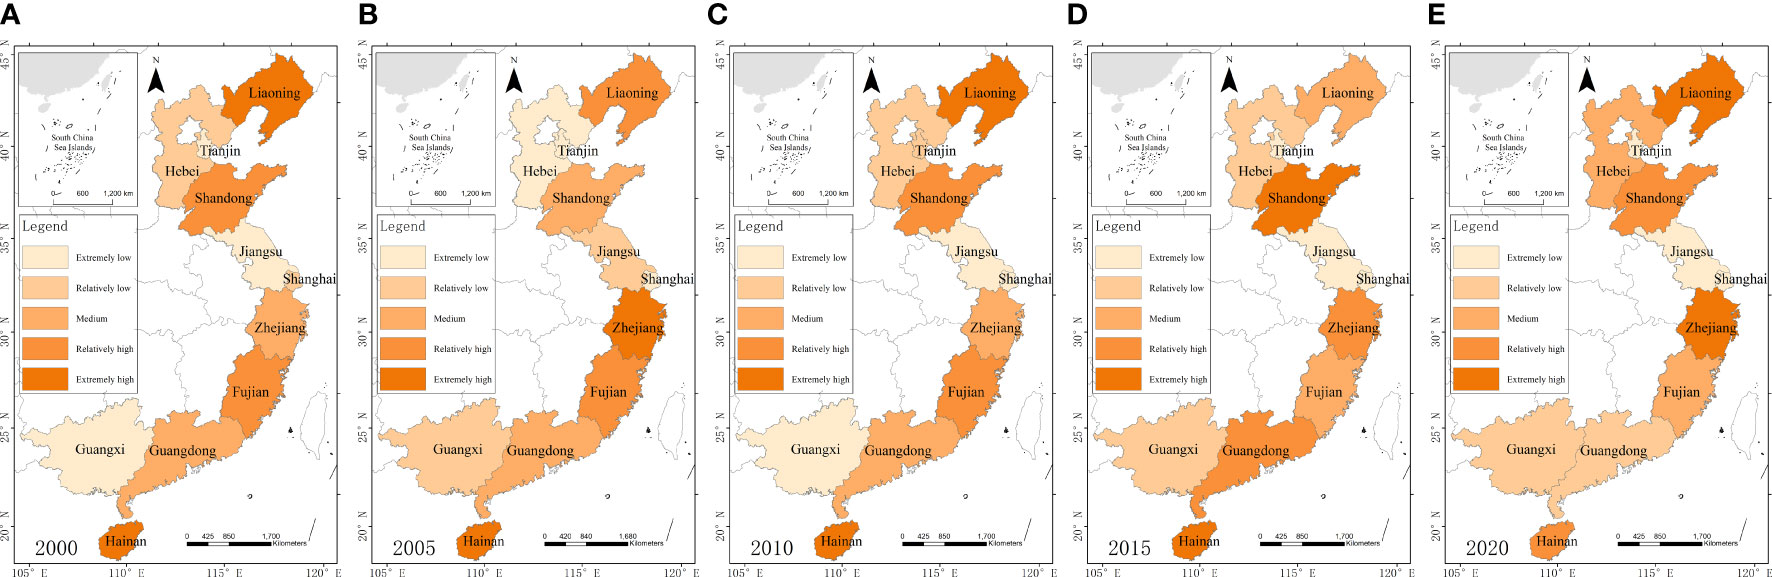
Figure 3 Space differentiation of vulnerability in 2000 (A), 2005 (B), 2010 (C), 2015 (D), and 2020 (E).
From the map, in 2000, Hainan and Liaoning were in the “extremely high” vulnerability category, while Guangxi, Jiangsu, and Tianjin were in the “extremely low” vulnerability class. In 2005, Hainan and Zhejiang were in the “extremely high” vulnerability class, while Hebei, Shanghai, and Tianjin were in the “extremely low” vulnerability class. In 2010, Hainan and Liaoning were in the “extremely high” vulnerability class, while Shanghai, Guangxi, and Jiangsu were in the “extremely low” vulnerability class. In 2015, Hainan and Shandong were in the “extremely high” vulnerability class, while Jiangsu, Tianjin, and Shanghai were in the “extremely low” vulnerability class. In 2020, Liaoning and Zhejiang were in the “extremely high” vulnerability class; Hainan was in the “relatively high” vulnerability category, and Jiangsu, Shanghai, and Tianjin were in the “extremely low” vulnerability class.
Except for 2020, where it was categorized as “relatively high,” Hainan’s fishery system exhibited “extremely high” vulnerability in most years, as did Liaoning. In contrast, Tianjin consistently experienced “extremely low” vulnerability in most years.
4 Obstacle degree analysis
This study considered the years 2000, 2005, 2010, 2015, and 2020 as representatives to analyze the obstacle degree affecting the vulnerability of the fishery system. As shown in Figure 4D, E for 2015 and 2020, overall, the indicators that had significant impacts on the vulnerability index (higher obstacle degree) were the total yield of marine aquatic products (S6), year-end inventory of motorized fishing vessels (A1), funding for aquaculture technology extension (A4), and per capita coastline length (S4). These factors served as indicators of the degree of severity of obstacles for most provinces. The main obstacles for Hebei, Tianjin, Shandong, Jiangsu, Zhejiang, Fujian, and Guangdong were the total yield of marine aquatic products (S6). The main obstacle for Liaoning was per capita coastline length (S4), while for Guangxi and Hainan, this was funding for aquaculture technology extension (A4). The main obstacles arise from sensitivity and adaptability indicators. By contrast, there were no obstacle indicators belonging to the exposure indicators (E1–E5), and thus their impact on vulnerability was relatively minor. In comparison, the indicators in 2000, 2005, and 2010 were more concentrated (Figure 4A-C), and funding for aquaculture technology extension (A4) was the main indicator. From 2000 to 2020, the obstacle degree indicators showed diverse trends.
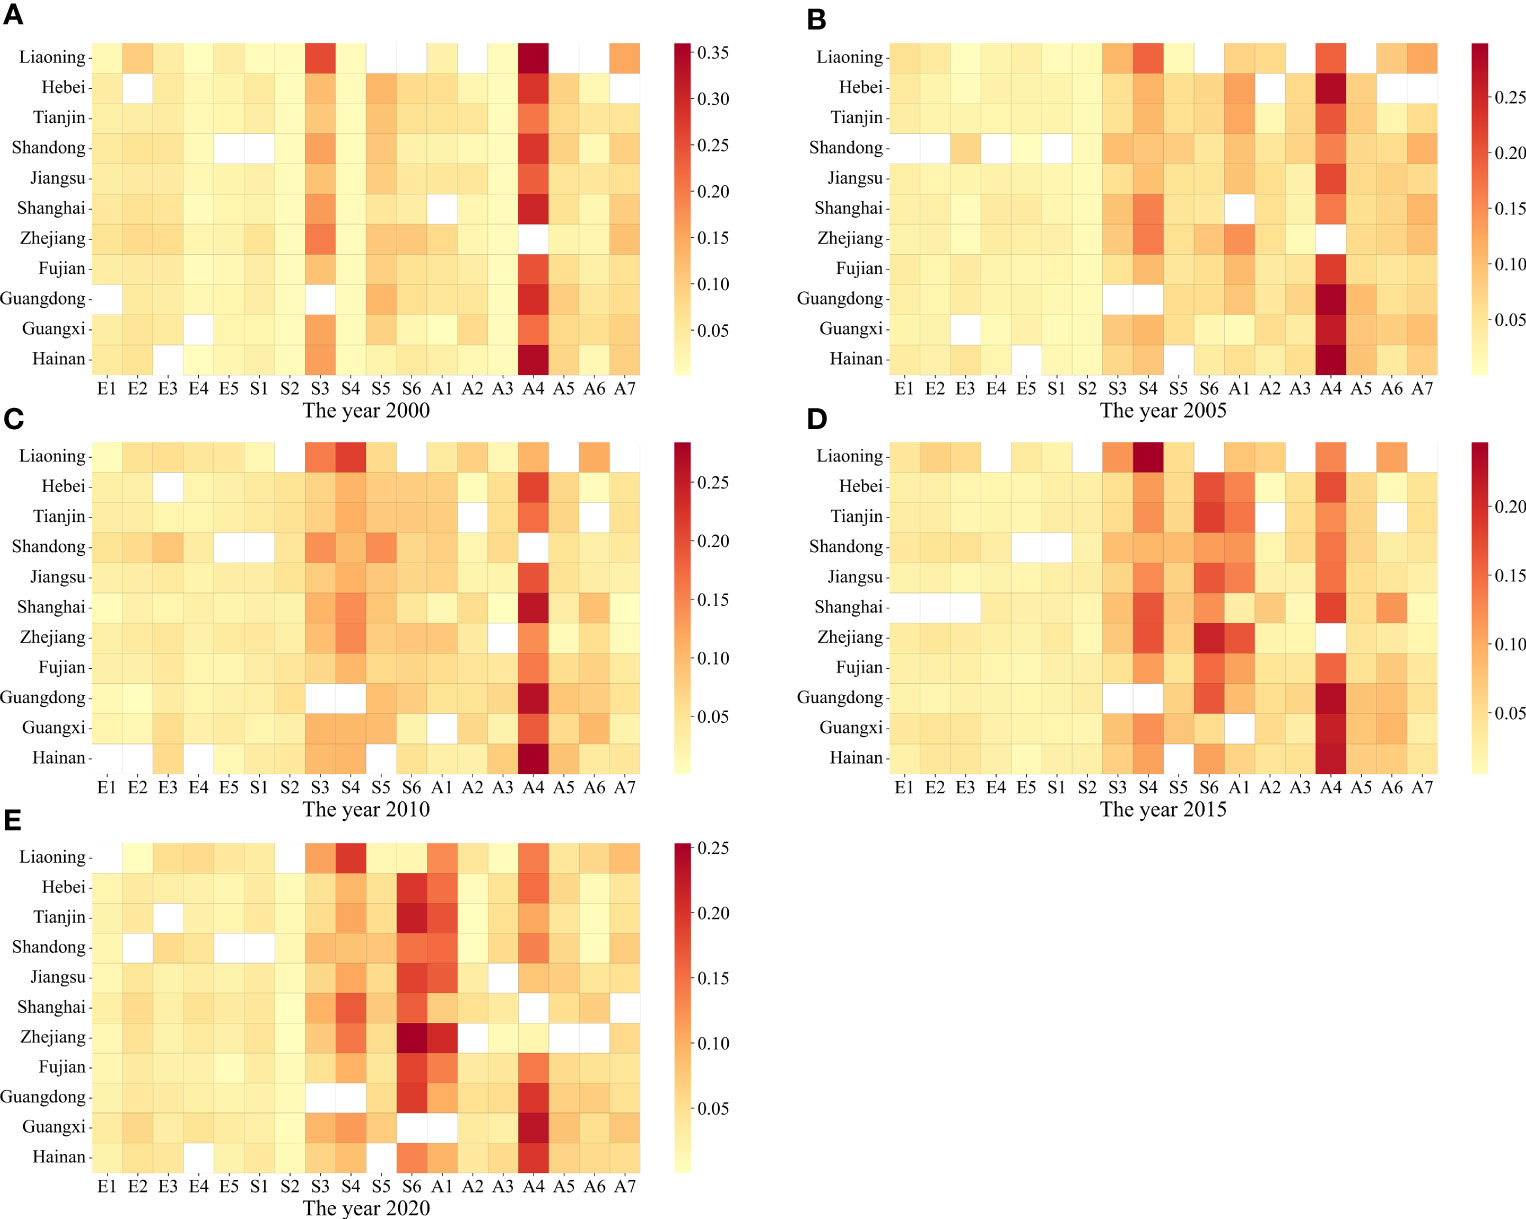
Figure 4 Obstacle degree for each province in 2000 (A), 2005 (B), 2010 (C), 2015 (D), and 2020 (E).
5 Discussion
5.1 The spatiotemporal characteristics of the vulnerability of the fishery system
Researchers have previously recognized that the fishery system in specific coastal regions of China exhibits significant spatiotemporal variation (Li and Jin, 2019b). This study similarly confirmed this observation. The findings suggest that China’s coastal fishery system displays vulnerability in terms of both time and space. Examining temporal vulnerability sheds light on the system’s difficulties and fluctuations experienced across various periods. In addition, scrutinizing spatial vulnerability emphasizes disparities in vulnerability across different geographic areas. Certain regions may prove to be more susceptible to human interventions, marine pollution, and ecological shifts, potentially leading to more pronounced adverse effects on local fisheries.
From a temporal perspective (Figure 2), the vulnerability of the fishery system in eight provinces, namely Tianjin, Jiangsu, Zhejiang, Shanghai, Fujian, Guangdong, Guangxi, and Hainan, has exhibited a decreasing trend over time. Conversely, the vulnerability of the fishery system in three provinces, namely Liaoning, Hebei, and Shandong, has shown an increasing trend over time. Therefore, the overall vulnerability index of the fishery system across the entire country has exhibited a noticeable downward trend since the beginning of the 21st century.
From a spatial perspective, based on the data from the 2021 China Fishery Statistical Yearbook, the total economic output of the fishery system in Tianjin, Jiangsu, Zhejiang, Shanghai, Fujian, Guangdong, Guangxi, and Hainan in 2020 was 1,459 billion RMB, while the total economic output of the fishery system in Liaoning, Hebei, and Shandong in 2020 was 575.5 billion RMB. The provinces where the vulnerability index was increasing accounted for 72% of the national total economic output of the fishery system, while the provinces where the vulnerability index was decreasing accounted for 28% of the national total output. Overall, there is clear spatial variation in vulnerability.
The differences among provinces are quite pronounced, with certain specific provinces such as Hainan and Liaoning consistently showing very high vulnerability in their fishery systems, while others, such as Tianjin, consistently exhibited very low vulnerability. Although the indicators used in this study overlap with those used in previous research to some extent (Li et al., 2019(a); Li and Jin, 2019b), and the technical approach is generally similar, these results do not completely align with published findings. For example, a study in 2018 suggested that Liaoning, Hebei, Fujian, and Hainan provinces appeared to be the most vulnerable, with Shanghai showing lower vulnerability (Chen et al., 2018). In 2020, another study indicated that Hainan, Guangxi, Zhejiang, and Fujian provinces had high or very high vulnerability, while Shanghai and Tianjin had low vulnerability (Ding et al., 2020).
5.2 Analysis of key obstacles
China is projected to experience a scenario in which seafood consumption exceeds domestic production by 2030. To address this seafood deficit, China is likely to pursue strategies such as expanding domestic freshwater and offshore aquaculture, boosting seafood imports, and potentially expanding the distant water fishing system (Crona et al., 2020). No matter what measures are taken, it is essential to first identify the factors that affect the vulnerability of the fishery system and then implement corresponding measures to reduce the impact of these factors on vulnerability. This can be done with the ultimate goal of decreasing vulnerability. In this study, the obstacle analysis assisted in identifying the critical factors influencing the vulnerability of the fisheries. We found that the total yield of marine aquatic products (S6), year-end inventory of motorized fishing vessels (A1), funding for aquaculture technology extension (A4), and per capita coastline length (S4) were the primary obstacles leading to the vulnerability of the fishery system. From this, it can be concluded that apart from funding for aquaculture technology extension (A4), there is limited space for improvement in other factors affecting vulnerability. Therefore, there is a need to focus efforts on funding for aquaculture technology extension to reduce vulnerability. Furthermore, external factors such as climate change and natural disasters were identified as significant factors affecting vulnerability, thus warranting increased attention and mitigation in fishery management (Seara et al., 2016).
5.3 Management and policy recommendations
The exposure indicators (all types of losses) used in this study are primarily due to various natural or man-made disasters, and climate change undoubtedly exacerbates the occurrence of events such as storm surges (Trenberth, 2018). Therefore, climate change is expected to cause changes in marine biota and ecosystems, thereby directly affecting fishery systems (Kim et al., 2023). Against the backdrop of frequent disasters triggered by climate change, the vulnerability of marine fisheries should logically increase. However, the results of this study indicate that the vulnerability of the Chinese fishery system is decreasing. One possible reason for this is that humans have altered the process of increasing vulnerability by enhancing adaptability.
For example, China formulates Five-Year Plans targeting economic development. In the fishery sector, there are corresponding Five-Year Development Plans. Each province also formulates its own Five-Year Plan that aligns with national policies and suits the specific characteristics of the region (Yu et al., 2023). While the plans and policies implemented by each province aim to facilitate the healthy development of the fishery system, quantifying and assessing their effectiveness is challenging. As a result, the vulnerability trends in different provinces manifest unique characteristics.
Based on the findings of this study, we propose the following management and policy recommendations to enhance the resilience of China’s coastal fishery system. First, reducing exposure is a crucial aspect of reducing vulnerability. Through measures such as disaster prevention and control, the impact of climate change-induced disasters on the fishery can be mitigated. Second, reducing sensitivity is also a key strategy. However, regarding the indicators used in this study, reducing sensitivity is a relatively challenging process. Finally, enhancing adaptability is another critical factor. Increasing investment in administrative resources and formulating more flexible policies and regulations that can adapt to change help enhance the fishery system’s ability to respond to uncertainty, thus reducing overall vulnerability. These measures collectively contribute to reducing the vulnerability of the fishery system, providing a solid foundation for the sustainable development of the coastal provinces’ fishery in China.
5.4 Limitations and future directions
(1) The concept of marine fisheries vulnerability should be made more explicit. Since the concept of vulnerability was first introduced, its definition and content have continued to evolve, with different fields offering different definitions and emphasizing different aspects (Beroya-Eitner, 2016). At present, some consensus on the content of vulnerability has been reached, and some common terms related to vulnerability elements have emerged in the conceptualization, including exposure, sensitivity, and adaptability. In the field of fisheries, some have borrowed from this framework for vulnerability assessment (Johnson and Welch, 2009). However, an exact definition of vulnerability in the fishery system has not yet been determined. This has also led to a lack of standardized criteria for assessing vulnerability in the fishery system.
(2) The methods for marine fishery vulnerability assessment require improvement. Although multi-indicator methods have been applied in the assessment of vulnerability in the fisheries ecosystems (Mamauag et al., 2013), the results of this study suggest that various factors, including indicator selection and different weighting methods, will collectively influence the research results. This directly indicates that vulnerability assessment involves a certain degree of subjectivity, which is also an issue that needs to be carefully addressed in future research. The current method generally involves the type of multi-indicator assessment that has been used in this study. Due to varying interpretations of the concept of marine fisheries vulnerability and differences in analytical frameworks, the assessment indicators tend to be diverse. The indicator dimensions, the number of indicators, and the proportions of socio-economic and ecological indicators can vary among studies. First, the assessment and analysis of fishery system vulnerability are constrained by data availability. In addition, determining the weights of factors in the obstacle analysis presents a challenge, and employing diverse methods to validate the stability of results is recommended. In Section 5.1, the fact that the results of this study are not entirely consistent with those of previous research is discussed. The further discussion above may provide an explanation for the reasons behind this inconsistency.
(3) There is insufficient research on the driving factors and mechanisms of marine fishery vulnerability. Most research on the vulnerability of marine fisheries is based on case studies, and the research outcomes generally focus on explaining the characteristics of vulnerability and vulnerability assessments, with a notable lack of research on driving factors and their mechanisms. Therefore, particular consideration of system dynamics is required in future work (Islam et al., 2014). In general, research on driving factors still predominantly consists of qualitative studies, lacking quantitative analyses of the extent, manner, and interaction of each driving factor’s impact on vulnerability.
6 Conclusion
In this study, an in-depth analysis of the vulnerability of China’s coastal fishery system was conducted, focusing on both temporal and spatial dimensions. Our findings suggest that Hainan and Liaoning’s fishery systems were extremely vulnerable in most years, and Tianjin consistently experienced extremely low vulnerability in most years. Otherwise, funding for aquaculture technology extension (A4) was identified as the main indicator of the severity of obstacles facing China’s fishery system. Further work is needed to move toward more objective methods for assessing vulnerability.
The findings of this research provide significant insights into the challenges and dynamics of the fishery system in the coastal provinces. By analyzing temporal and spatial vulnerabilities and identifying key obstacles, this study provides valuable insights for policymakers, researchers, and stakeholders.
Data availability statement
The original contributions presented in the study are included in the article/supplementary material,. further inquiries can be directed to the corresponding author/s.
Author contributions
YW: Writing – original draft, Writing – review & editing. PD: Writing – original draft, Writing – review & editing. JW: Writing – review & editing. YL: Writing – review & editing. ZX: Writing – review & editing. CC: Writing – review & editing.
Funding
The author(s) declare financial support was received for the research, authorship, and/or publication of this article. This work was financially supported by the Natural Science Foundation of Shandong Province (Youth Program ZR2023QD184), the Pilot National Laboratory for Marine Science and Technology (Qingdao) Laboratory’s Open Fund Project (2019B02), and the Key Laboratory of Space Ocean Remote Sensing and Application (LORA) Open Fund Project (202101002).
Conflict of interest
The authors declare that the research was conducted in the absence of any commercial or financial relationships that could be construed as a potential conflict of interest.
Publisher’s note
All claims expressed in this article are solely those of the authors and do not necessarily represent those of their affiliated organizations, or those of the publisher, the editors and the reviewers. Any product that may be evaluated in this article, or claim that may be made by its manufacturer, is not guaranteed or endorsed by the publisher.
References
Bao Q., Yuxin Z., Yuxiao W., Feng Y. (2020). Can entropy weight method correctly reflect the distinction of water quality indices? Water Resour. Manage. 34 (11), 3667–3674. doi: 10.1007/s11269-020-02641-1
Beroya-Eitner M. A. (2016). Ecological vulnerability indicators. Ecol. Indic. 60, 329–334. doi: 10.1016/j.ecolind.2015.07.001
Chen Q., Shen W., Yu B. (2018). Assessing the vulnerability of marine fisheries in China: towards an inter-provincial perspective. Sustainability 10 (11), 4302. doi: 10.3390/su10114302
China Fishery Statistical Yearbook (2023). Bureau of fisheries (Beijing: Chinese Ministry of Agriculture).
Crona B., Wassenius E., Troell M., Barclay K., Mallory T., Fabinyi M., et al. (2020). China at a crossroads: an analysis of China's changing seafood production and consumption. One Earth 3 (1), 32–44. doi: 10.1016/j.oneear.2020.06.013
Ding Q., Shan X., Jin X. (2020). Ecological footprint and vulnerability of marine capture fisheries in China. Acta Oceanologica Sin. 39, 100–109. doi: 10.1007/s13131-019-1468-y
Drury O’Neill E., Crona B., Ferrer A. J. G., Pomeroy R. (2019). From typhoons to traders: the role of patron-client relations in mediating fishery responses to natural disasters. Environ. Res. Lett. 14 (4), 045015. doi: 10.1088/1748-9326/ab0b57
Ficke A. D., Myrick C. A., Hansen L. J. (2007). Potential impacts of global climate change on freshwater fisheries. Rev. Fish Biol. Fisheries 17, 581–613. doi: 10.1007/s11160-007-9059-5
Gong J., Jin T., Cao E., Wang S., Yan L. (2022). Is ecological vulnerability assessment based on the VSD model and AHP-Entropy method useful for loessial forest landscape protection and adaptative management? A case study of Ziwuling Mountain Region, China. Ecol. Indic. 143, 109379. doi: 10.1016/j.ecolind.2022.109379
Ho C. H., Yagi N., Tian Y. (2020). An impact and adaptation assessment of changing coastal fishing grounds and fishery industry under global change. Mitigation Adaptation Strategies Global Change 25, 1073–1102. doi: 10.1007/s11027-020-09922-5
Hu F., Zhong H., Wu C., Wang S., Guo Z., Tao M., et al. (2021). Development of fisheries in China. Reprod. Breed. 1 (1), 64–79. doi: 10.1016/j.repbre.2021.03.003
Islam M. M., Sallu S., Hubacek K., Paavola J. (2014). Vulnerability of fishery-based livelihoods to the impacts of climate variability and change: insights from coastal Bangladesh. Regional Environ. Change 14, 281–294. doi: 10.1007/s10113-013-0487-6
Johnson J. E., Welch D. J. (2009). Marine fisheries management in a changing climate: a review of vulnerability and future options. Rev. Fisheries Sci. 18 (1), 106–124. doi: 10.1080/10641260903434557
Kim M. J., Hong J. B., Han I. S., Lee J. S., Kim D. H. (2023). Vulnerability assessment of Korean fisheries to climate change. Mar. Policy 155, 105735. doi: 10.1016/j.marpol.2023.105735
Li B., Jin X. (2019b). Spatio-temporal evolution of marine fishery industry ecosystem vulnerability in the Bohai rim region. Chin. Geographical Sci. 29, 1052–1064. doi: 10.1007/s11769-019-1076-5
Li Bo, Xiaoming J., Jun Y., Zenglin H., Fei Su (2019a). Spatio-temporal evolution and influencing factors for marine fisheries industry ecosvstem vulnerability in China. Acta Ecol. Sin. 39 (12), 4273–4283.
Lu J., Wang W., Zhang Y., Cheng S. (2017). Multi-objective optimal design of stand-alone hybrid energy system using entropy weight method based on HOMER. Energies 10 (10), 1664. doi: 10.3390/en10101664
Mamauag S. S., Aliño P. M., Martinez R. J. S., Muallil R. N., Doctor M. V. A., Dizon E. C., et al. (2013). A framework for vulnerability assessment of coastal fisheries ecosystems to climate change—Tool for understanding resilience of fisheries (VA–TURF). Fisheries Res. 147, 381–393. doi: 10.1016/j.fishres.2013.07.007
Polsky C., Neff R., Yarnal B. (2007). Building comparable global change vulnerability assessments: The vulnerability scoping diagram. Global Environ. Change 17 (3-4), 472–485. doi: 10.1016/j.gloenvcha.2007.01.005
Seara T., Clay P. M., Colburn L. L. (2016). Perceived adaptive capacity and natural disasters: A fisheries case study. Global Environ. Change 38, 49–57. doi: 10.1016/j.gloenvcha.2016.01.006
Trenberth K. E. (2018). Climate change caused by human activities is happening and it already has major consequences. J. Energy Natural Resour. Law 36 (4), 463–481. doi: 10.1080/02646811.2018.1450895
Wang Y., Ding Y., Geng R., Chen C. (2023). Risk characteristics of China’s marine disasters and trends since 2000. Front. Mar. Sci. 10. doi: 10.3389/fmars.2023.1152880
Yu W., Yu M., Ding L. (2023). Characteristics and evolution of hierarchical fishery policies in China–A textual analysis based on 5311 policies from 2003 to 2022. Mar. Policy 155, 105699. doi: 10.1016/j.marpol.2023.105699
Keywords: fishery systems, vulnerability assessment, coastal China, vulnerability scoping diagram, entropy weight method
Citation: Wang Y, Du P, Wang J, Liu Y, Xu Z and Chen C (2023) Vulnerability assessment of the fishery system in China’s coastal provinces since 2000. Front. Mar. Sci. 10:1323033. doi: 10.3389/fmars.2023.1323033
Received: 17 October 2023; Accepted: 28 November 2023;
Published: 28 December 2023.
Edited by:
Khor Waiho, University of Malaysia Terengganu, MalaysiaReviewed by:
Yen-Chiang Chang, Dalian Maritime University, ChinaKianann Tan, Beibu Gulf University, China
Copyright © 2023 Wang, Du, Wang, Liu, Xu and Chen. This is an open-access article distributed under the terms of the Creative Commons Attribution License (CC BY). The use, distribution or reproduction in other forums is permitted, provided the original author(s) and the copyright owner(s) are credited and that the original publication in this journal is cited, in accordance with accepted academic practice. No use, distribution or reproduction is permitted which does not comply with these terms.
*Correspondence: Peipei Du, cHBkdTE5ODlreUAxNjMuY29t