Abstract
Anthropogenic disturbances and climate change are projected to become leading drivers of biodiversity loss and ecological connectivity degradation in marine ecosystems. However, the lack of quantitative understanding for seascape connectivity modeling hinders our ability in providing large-scale marine conservation guidance. By applying well-established theories and tools in landscape connectivity study and marine-specific indicators, we proposed a framework to evaluate the resistance-based seascape connectivity among marine habitats and Marine Protected Areas (MPAs) across China’s coastal sea. The spatial vulnerability of marine habitats was further assessed to prioritize conservation effort. Our results showed that 82% of China’s coastal seas were covered with middle to high level of resistance for migratory marine species, mainly due to concentrated inshore anthropogenic disturbances such as ship traffic and ocean pollution. With the modeled migration distances of different species guilds from short-range (25 km) to long-range (100 km), the area percentage of connected corridors increased from 12.02% to 44.68% in the study area. Vulnerable areas were identified as high resistance (high exposure) and abundant threatened species (high sensitivity) but with small number of connected corridors (low adaptive capacity), primarily distributed in offshore regions of Yellow Sea and East China Sea. Collectively, inshore regions with high anthropogenic disturbances warrant regulation and mitigation in major coastal cities and ports. While the lack of interconnected networks for offshore regions prioritized efforts to enhance seascape connectivity through the establishment of MPA network. Sensitive species groups require more attention in future marine conservation, including threatened populations, climate refugees of marine species, and species with limited movement ranges. This study highlights the potential of developing seascape connectivity model based on landscape theories, and the importance of seascape connectivity study in guiding evidence-based marine conservation strategies.
1 Introduction
Global marine ecosystems have been threatened by intensified climate change and anthropogenic disturbances, exacerbating marine biodiversity loss in oceans (Duarte et al., 2020; Dai et al., 2023; Pigot et al., 2023; Saintilan et al., 2023). The IUCN Red List of Threatened Species maintained records of up to 630 endangered marine species by 2020, and 34 marine species were declared extinct (IUCN, 2020). Recognizing the pressing need for marine biodiversity conservation, global initiatives such as the Sustainable Development Goal 14 highlights the significance of preserving marine habitats and biodiversity (Griggs et al., 2013), and the Post-2020 Global Biodiversity Framework emphasizes the imperative need of expanding ocean protection efforts (Erdelen, 2020). Consequently, there has been a growing awareness of the challenges surrounding the protection of global marine ecosystems with scientific guidance (Halpern et al., 2019).
To eliminate the gap between conservation goals and the current status of marine ecosystems, seascape connectivity studies have emerged as valuable tools for providing guidance for effective and scientific marine conservation and management (Virtanen et al., 2020). Seascape connectivity is defined as the spatial linkage across marine ecosystems, which measures potential ecological processes at a seascape scale, including species migration and larval dispersal throughout various seascape structures, and the likelihood of spatial pathways taken by organisms (Treml et al., 2008; Olds et al., 2016; Pittman, 2017). Seascape connectivity studies have been instrumental in informing marine conservation planning across different spatiotemporal scales because the metapopulation persistence of marine organisms is often determined by seascape connectivity through ontogenetic migration and larval dispersal (Olds et al., 2016; Weeks, 2017; Virtanen et al., 2020). Conservation prioritization facilitated by seascape connectivity models empowers decision makers to allocate resources strategically, enhancing the efficacy of marine spatial planning in attaining crucial conservation goals (McLeod et al., 2009; Engelhard et al., 2017). The vulnerability assessment framework, which incorporates exposure, sensitivity, and adaptive capacity, is often used as a comprehensive framework to identify conservation gaps with high ecological risk and to guide socio-ecological management (De Lange et al., 2010; Dudley et al., 2021). Although seascape connectivity quantifies the adaptive capacity and resilience of marine ecosystems, it has yet to be incorporated into the broader framework of vulnerability assessment to provide thorough and multifaceted insights into marine spatial conservation planning (He et al., 2018).
The connectivity of marine ecosystems faces substantial threats primarily driven by climate change and anthropogenic disturbances. Global warming has led to severe changes and anomalies in ultraviolet (UV) radiation, ocean acidification, and sea surface temperature, predominantly attributed to human influence (Abadie et al., 2018; Barneche et al., 2021). Specifically, in China’s coastal sea for the past 40 years, the sea surface temperature (SST) of offshore China has increased by 0.16 °C/decade and accelerate to 0.45 °C/decade (1.88%/decade) over the past decade, which is almost twice the warming rate of the global mean SST (Qi et al., 2019; Tang et al., 2020). These environmental stresses threaten a rich variety of key biogenic habitats (i.e., mangroves, seagrass, coral reefs, and salt marshes) distributed along and off the coast. In addition to climate change, 59% of global marine ecosystems are directly threatened by human activities, including fishing efforts, ship traffic, and land- or aquatic-sourced pollution (Halpern et al., 2019). In connectivity studies, these factors are listed as resistances that hinder the movement of marine organisms among ecosystems and increase the physiological costs associated with migration through a particular environment (Zeller et al., 2012). While landscape connectivity studies have widely applied the quantification of resistance as organisms move through landscape patches (Dickson et al., 2017; Hilty et al., 2020), these climatic or anthropogenic resistances may be interpreted with different sources and functions in the context of seascape connectivity modeling. This necessitates a thorough examination of migration resistance in marine ecosystems using resistance-based connectivity modeling to advance seascape connectivity-based conservation efforts.
Seascape core patches in marine conservation networks play a pivotal role in the ontogenetic migration of marine organisms (Kong et al., 2021). Marine Protected Areas (MPAs), as a type of core patch, are designed as specialized areas for the conservation of marine resources, environment, and biodiversity. MPAs contribute to seascape-scale conservation by safeguarding critical habitats within the local ecosystem and acting as effective components of the broader marine network (McLeod et al., 2009). MPAs have been widely recognized as effective tools to restore and preserve marine biodiversity, especially in coastal exclusive economic zones (EEZs), where invaluable biodiversity is heavily affected by anthropogenic disturbances (Sala et al., 2021). In addition, the key natural habitats of mangroves, salt marshes, seagrass, and coral reefs in marine systems also play critical roles as biofilters, nurseries, and foraging sites to improve species ontogenetic migration and seascape connectivity (Mumby et al., 2004; Olds et al., 2013; Olson et al., 2019). The larval dispersal of marine species may rely heavily on nursery habitats to supply juvenile populations, depending on the proximity and area of the connected network of MPAs and key habitats (Weeks, 2017). In addition to acting as potential core patches in connecting neighboring habitats, MPAs and key habitats maintain the function of mitigating resistance along migration corridors (Jacob et al., 2020), especially in filtering coastal pollution, providing alternative habitats near marine exploitation, and enhancing population resilience against fishing efforts (Wallentinus and Nyberg, 2007; Game et al., 2009; Ling et al., 2009). The interconnected networks of MPAs and key habitats are efficient in maintaining and restoring marine biodiversity and ecosystem resilience to disturbances (Swadling et al., 2019). Although previous research on connectivity modeling has acknowledged the positive impacts of MPAs and key habitats (Galpern et al., 2011; Zeller et al., 2012; Cecino et al., 2021), the contributions and responses of core marine habitats in framing seascape connectivity models are still not well addressed.
Here, we modeled resistance-based seascape connectivity based on landscape theories and tools and assessed the vulnerability of marine ecosystems to identify priorities in marine conservation planning. We integrated the positive effects of MPAs and key habitats as offset factors in resistance modeling in China’s coastal seas. The resistance-based seascape connectivity of marine species guilds with different migration distances was projected. Additionally, by integrating resistance and connectivity maps with the distribution of threatened marine species, we identified vulnerable areas following the vulnerability assessment framework. Areas with high levels of resistance (exposure) and threatened species distribution (sensitivity) but not well connected by corridors (low adaptive capacity) were identified as vulnerable areas in marine conservation, with critical implications for prioritizing marine conservation efforts.
2 Materials and methods
2.1 Study area
China’s coastal sea is of great significance for marine biodiversity preservation and serves as a critical zone for supporting the lifecycle of global marine species. This region consists of four parts: Bohai Sea, Yellow Sea, East China Sea, and South China Sea. However, this coastal region also experiences high levels of anthropogenic disturbance from both terrestrial pollution and marine human activities. According to the Ministry of Ecology Environment of China in 2018, 43% of the monitored land-sourced sewage outfalls failed to meet national standards, such as major pollutants of total phosphorus, ammonia nitrogen, and suspended matter. Extensive anthropogenic disturbance has become the major challenge in China’s coastal sea, including ship traffic, fishing efforts, and nearshore pollution, exacerbating the degradation of coastal ecosystems and the loss of seascape connectivity and resilience. In addition to human disturbances, climatic effects exert great pressure on marine species in the coastal seas of China. In this region, over 250 MPAs were established to provide additional protection to 9.3% of China’s coastal sea. In this study, we used the spatial extent of the Marine Function Zone (MFZ) of China’s coastal sea as our study area to model resistance-based seascape connectivity, which is the near-coast sea crucial to natural resources, biodiversity protection, and marine socio-economic development (Lu et al., 2015).
2.2 Mapping resistance and offset factors
With reference to well-established theories and methods of landscape connectivity, our methodology is provided in three parts (Figure 1): (1) estimating the resistance surface using anthropogenic and climatic disturbances, as well as offset effects of key habitats and MPAs based on patch sizes. The landscape change datasets were substituted with marine function zones to serve the essential function of regulating various seascape types within the marine environment. The proposed framework is the first to incorporate posititve influence of key habitats and MPAs in resistance modeling. Connectivity analysis was performed using the Linkage Mapper Tool, leveraging graph theory and least-cost theory to accurately measure the spatial arrangement of corridors and the degree of permeability within the landscape (McRae and Kavanagh, 2011; Mitchell et al., 2013); and (3) assessing spatial vulnerability from the three aspects of exposure (represented by resistance), sensitivity (threatened species distribution), and adaptive capacity (connected corridors) (Pacifici et al., 2015).
Figure 1

Framing seascape connectivity modeling and conservation analysis. The datasets used in the marine system were selected based on the landscape system into four categories. They were further transformed to calculate the disturbance and offset effects in marine ecosystems. Least-cost theory from landscape modeling was applied to seascape connectivity for species guilds with different migration distances (25 km, 50 km, and 100 km). Vulnerability assessments regarding resistance-based connectivity and threatened species were performed using modeling results to prioritize conservation efforts.
Based on landscape connectivity studies and the characteristics of marine ecosystems, we selected a series of indicators to model human disturbances and climate change (Table 1) and identified potential core patches in the connectivity network. Resembling land use and cover change in terrestrial connectivity modeling, the MFZ (Supplementary Figure 1) was used to specify the domain function of nearshore marine area for the usage and regulation based on environmental, biological, and social-economic conditions (Lu et al., 2015). The main types of MFZ included protected and reserved areas, recreation, tourism, fishing, industry, mining, shipping, and reclamation (Supplementary Table 1). The spatial extent of the MFZ and MPA of China’s coastal sea was extracted from spatial planning by the Ministry of Natural Resource of China in 2011, and we also included the updated reclamation zones from a previous study (Sajjad et al., 2018). Salt marsh, coral reef, and seagrass distributions were derived from the global dataset of the United Nations Environment Programme (UNEP, data.unep-wcmc.org/datasets). Mangrove distribution in China was interpreted on a finer scale from remote sensing images in a previous study in coastal East Asia (Zhang et al., 2022).
Table 1
| Types | Factor/Objectives | Resolution | Data Sources |
|---|---|---|---|
| Marine Protected Area | Marine Protected Areas in China | Vector | MNR, 2011 |
| Habitats | Distribution of Mangrove in China | Vector | Zhang et al. (2022) |
| Global Distribution of Saltmarsh | Vector | UNEP, 2015 | |
| Global Distribution of Seagrasses | Vector | UNEP, 2020 | |
| Global Distribution of Coral Reefs | Vector | UNEP, 2018 | |
| Species Distribution | IUCN Red List of Threatened Marine Species | Vector | Brooks et al. (2016) |
| Climate Change | Sea Surface Temperature Anomalies | 1 km | Halpern et al. (2015) |
| Ultraviolet Anomalies | 1 km | Halpern et al. (2015) | |
| Ocean Acidification | 1 km | Halpern et al. (2015) | |
| Human Disturbance | Ship Traffic | 0.05° | Shipfinder, 2020 |
| Fishing Effort | 0.05° | Shipfinder, 2020 | |
| Marine Function Zone in China | Vector | MNR, 2011 | |
| Reclamation | Vector | Sajjad et al. (2018) | |
| Ocean Pollution | 1 km | Halpern et al. (2015) | |
| Inorganic Pollution | 1 km | Halpern et al. (2015) | |
| Invasive Species | 1 km | Halpern et al. (2015) |
Spatial datasets used in seascape connectivity modeling.
MNR, Ministry of Natural Resource of China; UNEP, United Nations Environment Programme.
While road construction and population distribution are prominent factors influencing land ecosystem connectivity (Li et al., 2019), this study utilized ship traffic and fishing efforts to quantify human influences in marine ecosystems (Chen et al., 2022), which generate underwater noise, oil spills, and turbidity that hinder marine species movement and lifecycle (Jonsson et al., 2021). In addition, we included spatial datasets of marine- and land-based pollution potentially resulting from wastewater, which has detrimental effects on marine wildlife migration (Lott, 2022). The shipping density distribution was derived from Automatic Identification System datasets with a 1 km × 1 km resolution in Shipfinder (www.shipxy.com). Fishing effort is represented by the density of fishing ships, and ship traffic is represented by the total density of passenger ships, cargo ships, tankers, and high-speed crafts.
Climatic factors, such as ocean acidification, SST anomalies, and UV radiation anomalies, were also included, which could result in habitat loss and food web alteration in large-scale marine environments and negatively impact species migration and resilience (Berkström et al., 2020). These changes in environmental conditions may hinder marine species movement in local regions, resulting in a range shift in native species (Morelli et al., 2017; Pinsky et al., 2020).The preprocessed datasets (Table 1) were used as inputs to generate the resistance layers and core patches. Ocean pollution, land-sourced inorganic pollution, invasive species risk, and climate change indicators were derived from Halpern et al. (2015) at a resolution of 1 km × 1 km. All the geospatial datasets were scaled to a resolution of 1 km. Spatial analysis and preprocessing were performed using ArcMap 10.4.1.
Mapping resistance from anthropogenic disturbance and climate change is informative for understanding exposure to marine species, and it is the crucial first step in advancing Euclidean distance to resistance distance for functional connectivity modeling with detailed spatial information (Magris et al., 2014; Halpern et al., 2019; Keeley et al., 2021). Here, we adopted a resistance scoring system from landscape connectivity studies to normalize the resistance factors with equal weights, with higher scores representing greater resistance (Theobald, 2010; Li et al., 2019; Trew et al., 2019). Human-induced resistance factors, such as ocean pollution, risk of invasive species, ship traffic, and fishing effort, were divided into five levels based on their percentiles and assigned a resistance score from 1 to 5 (i.e., the highest 20% of the factor was assigned a value of 5, while the 20% lowest was assigned a value of 1) (Supplementary Table 2). Marine climate change factors, such as ultraviolet radiation anomalies, ocean acidification, and SST anomalies, were scored using the same statistical approach to evaluate the impact of climate change. We implemented a scoring system ranging from 1 to 5 for different types of areas within the MFZ. This scoring was derived from expert evaluations of the key functions of the areas, distinguishing between natural and unnatural attributes and assigning scores accordingly. The methodology involved referencing the expert assignment approach utilized in quantifying the effect of different land-use covers within landscape connectivity studies. (Theobald, 2010). As a destructive coastal redevelopment in China, the constructed reclamation area in the MFZ was considered to have the highest level of resistance to species (scored as 5), while aquaculture and fishing zones scored as 3 and tourism zones scored as 1 with the least impact (Supplementary Table 1). Although different species may exhibit varying responses to the aforementioned disturbances, the selected resistance indicators significantly impact a broad spectrum of marine species and imply a seascape-scale resistance spatial pattern (Doney et al., 2011; Pinsky et al., 2019). The overall resistance score ranged from 0 to 40, ranking from low (0–15), middle (16–29), to high resistance (30–40).
To reveal how resistance was offset by MPAs and key habitats, we calculated the difference in resistance with or without offset factors. Such mitigation effects of core patches on disturbances are positively correlated with their size (Bruno and Kennedy, 2000; Mitchell et al., 2013; Edgar et al., 2014; Shinomiya et al., 2017). Therefore, we assigned an offset score ranging from −1 to −5 (negative as in resistance score for mitigation) based on the level of patch size (with the largest 20% patches in this study scored as −5, while the smallest 20% patches scored as −1 in offsetting resistance, etc.). The overall resistance layer was the accumulation of the scored indicators of anthropogenic disturbance, climate change, and offset factors, with equal weights for each factor. Principal Component Analysis (PCA) was applied to illustrate the contribution and relationship of each indicator in the study area.
2.3 Modeling seascape connectivity
To account for variability in migration distances among marine species (Caldwell and Gergel, 2013), we mapped seascape connectivity at different migration distances based on species guilds with different traits. Resistance-based connectivity modeling developed in landscape ecology utilizes the least-cost path (LCP) to indicate the best possible migration corridors, which is calculated as the path with the least cumulative resistance connecting core patches (Carroll et al., 2012). By adjusting the longest LCP modeled as the migration distance, we were able to investigate how marine species guilds with different migration distances exhibit different spatial patterns of seascape connectivity. Core patches, including MPAs and key natural habitats, were used as connecting nodes in the modeled network to determine the pathways of marine species migration.
The migration distances of many common marine fishes, invertebrates, and their larvae generally range from 10 km to 100 km (Palumbi, 2004). Within this range, we conducted a series of connectivity modeling at different migration distances (Supplementary Figure 3) using the Linkage Mapper Tool (Kavanagh et al., 2012; Cecino et al., 2021). Among these, three representative species guilds were selected (25 km, 50 km, and 100 km) to present the spatial distribution of seascape connectivity. These three selected distances represent the major marine species guilds as short-range (25 km) and mid-range (50 km) species, including Rhynchobatus immaculatus, Odontaspis ferox, and Squatina formosa, and pelagic long-range (100 km) species, including whales, sharks, and tuna. In addition to the LCPs identified by the Linkage Mapper Tool, it also generates a map of rank-based connectivity metrics across the spatial extent, comprising the spatial aggregation of alternative migration pathways based on the prioritization of lower cumulative resistance. The connectivity metrics modeled in this study were derived from multiple habitat types and least-cost distances across a resistance map; specifically, lower connectivity metrics indicate a higher priority for species migration in such a path. These paths are characterized by lower cumulative resistance costs that species encounter when moving across seascape patches. The best paths were identified as LCPs with a connectivity metric value of 0 (i.e., the first path to choose with the least resistance). The actively connected areas, considered as connected corridors, were identified based on ranked connectivity metrics ranging from 0 to 200,000, representing the first 200,000 paths prioritized by species for migration among patches.
2.4 Identifying conservation priority areas based on vulnerability assessment
The identification of conservation priorities in marine ecosystems was based on the vulnerability assessment framework; the resistance map represents exposure magnitude, the spatial distribution of threatened marine species included in the IUCN Red List to represents sensitivity, and a layer of connected corridor numbers to indicates adaptive capacity. The conservation status of the threatened species was classified by IUCN using criteria such as decline rate, distribution area, population size, and distribution fragmentation (IUCN, 2020). These threatened marine species populations, including critically endangered (CR), endangered (EN), and vulnerable (VU) species, are particularly sensitive to both anthropogenic disturbances and climate change (Crozier et al., 2021; O’Hara et al., 2021), making it imperative to maintain a highly connected network for their resilience. The number of threatened species in each area was used as an indicator of the sensitivity and level of conservation demands in that region.
To specify seascape connectivity with different migration abilities, we quantified the spatial distribution of the number of connected corridors throughout the eight species guilds (Supplementary Figure 3), ranging from 0 to 8. Areas with low corridor numbers indicate that only species with long dispersal distances (usually 100 km–150 km) can reach those places, whereas these corridors are not accessible by short-range and mid-range species. Given the significant heterogeneity of biodiversity distribution and connectivity across the four seas in China, we classified the values of threatened species number and corridor number into three levels (low, mid, and high) according to the percentile intervals in each region. For instance, this categorization identified pixels with the highest 33.3% of species numbers in a giving sea as high number of threatened species.
Vulnerable areas were identified as regions characterized by high levels of human-induced and climatic disturbances, as well as the abundance of threatened marine species, but lacking sufficient connected corridors. Based on these three aspects of vulnerability, we categorized four categories with critical conservation implications: (1) highly vulnerable (mid-to-high exposure and sensitivity with low adaptability), (2) vulnerable (mid-to-high exposure and sensitivity with mid-level adaptability), (3) slightly vulnerable (high exposure, sensitivity, and adaptability), and (4) protected (low exposure and sensitivity with mid-to-high adaptability). We then calculated the percentage of area in each category across the four regions.
3 Results
3.1 Spatial distribution of resistance
Most of the study area was covered by low to middle resistance, and areas with high resistance were scattered with small patches (Figure 2). Approximately 78.18% of the study area was covered by middle resistance (between 16 and 30), 18.54% of the study area had low resistance (<15), and only 3.28% was covered by high resistance (between 31 and 40). Incorporating the offset effect of MPAs and key habitats into resistance quantification significantly lowered the total resistance within these core patches by an average decrease of 27.88% and a total resistance decrease of 2.14% in the whole study area (p <0.05). The resistance offset effect is especially significant in the East China Sea and South China Sea, where total resistance is high, but many MPAs and key habitats exist. This indicates the effectiveness of protected areas in mitigating anthropogenic or climatic disturbances. The reduced resistance prioritizes the connected pathways to be modeled within or close to these patches in regions such as the Yellow Sea, East China Sea, and South China Sea. The resistance score was distributed with a high-to-low gradient change from the inshore to offshore areas in China’s coastal sea. High resistance was mainly identified in the inshore area along the coastline, but the offshore regions of the Bohai Sea and South China Sea had relatively low resistance. The overall resistance varies spatially across the four seas, where the East China Sea and Yellow Sea are covered with higher resistance than the Bohai Sea and South China Sea.
Figure 2

Distribution of the overall resistance across China’s coastal seas. The high value of resistance in red represents a high level of disturbance to marine species’ migration. Four major economic zones were zoomed in to show more regional details: Bohai Rim (A); Yangtze River Delta (B); Megalopolis Minsanjiao (C); and Pearl River Delta (D).
Among all the resistance factors, ship traffic, fishing efforts, and ocean pollution were identified as the key factors. This result was substantiated by examining the relationships between the total resistance distribution on PCA, which revealed cosine similarities of 0.93, 0.95, and 0.96, respectively (Figure 3). The high values of these anthropogenic resistances are spread across the East China Sea and part of the Bohai Sea. Most anthropogenic disturbance indicators, including inorganic pollution and invasive species, are distributed along the coastline as point-source resistance. High resistance values were concentrated in major coastal cities (Shanghai and Yangtze River Delta; Shenzhen and Pearl River Delta) and ports (Tianjin Port and Bohai Rim; Xiamen Port and Megalopolis Minsanjiao), which are regions with intensive coastal development of industry and harbors in the inshore areas.
Figure 3

Contribution of different resistance factors in the study area (China’s coastal sea) based on Principal Component Analysis (PCA). Arrows of resistance distributed close to each other are positively correlated, whereas orthogonal arrows are not correlated. The length and color of each arrow represent the quality of this indicator for the first two key components (Dim1 and Dim2). The correlation between the two variables was stronger when the angle between the arrows was smaller.
Climate change indicators, on the other hand, were less related to the spatial patterns of overall resistance (Figure 3), although they showed a latitudinal gradient across China’s coastal sea (Supplementary Figure 2C). Ultraviolet anomalies had significant impacts on resistance at higher latitudes (Bohai Sea), whereas ocean acidification appeared to be more severe at lower latitudes (South China Sea).
3.2 Seascape connectivity in different migration distances
The number of LCPs and the area covered by connected corridors increased substantially with higher modeled distances for species migration ability (Figure 4, Supplementary Figure 3), indicating a changing pattern of seascape connectivity from local to broader scales corresponding to different marine species guilds. The number of LCPs in the study area increased from 504 at 25 km, 749 at 50 km, to 924 at 100 km. The percentage of connected corridor areas in the study area (with connectivity metrics ranging from 0 to 200,000) varied from 12% at 25 km, to 26% at 50 km, and reached 44% at 100 km (Figure 4).
Figure 4

Seascape connectivity of China’s coastal sea for species guilds with different migration distances, including short-range (25 km), mid-range (50 km), and long-range (100 km) species. With the least-cost path (rank-based connectivity metric of 0) in the center, the actively connected areas (rank-based connectivity metrics of 0 to 200,000) surrounded are the corridors prioritized by organisms while moving across patches with minimal cumulative resistance. Panels on the side of each map were detailed connectivity maps for major coastal economic zones, including Bohai Rim (A), Lianyungang Port (B), Yangtze River Delta (C), Megalopolis Minsanjiao (D), and Pearl River Delta (E).
Spatially, connectivity for short-range species (within a distance of 25 km), the actively connected networks were sparsely distributed in small fragmented areas. Linkages between inshore and offshore seas were not established, whereas connections mostly appeared among inshore habitats. The number and area of corridors for mid-range species (50 km) were higher than those for short-range species, especially in economic development zones with relatively higher human disturbances (Yangtze River Delta, Megalopolis Minsanjiao, and Pearl River Delta). However, only a part of the offshore core patches in these regions was incorporated into their connectivity network. Corridors for long-range species (100 km) covered the highest proportion of the coastline in both inshore and offshore areas, but the connectivity gaps in the Bohai Sea and Yellow Sea were apparent compared to those in the southern part of China’s coastal sea.
3.3 Vulnerability assessment
Across China’s coastal sea, our results showed that 18.5% of the total area was identified as highly vulnerable, while an additional 24.0% was categorized as vulnerable. These vulnerable areas are mainly distributed in the southern Bohai Sea and offshore areas of the Yellow Sea and East China Sea. In contrast, only 4.1% of the study area was categorized as protected, mainly in the inshore region of the northern Bohai Sea and western South China Sea. Among the four regions studied, the Bohai Sea had the highest percentage of highly vulnerable areas, accounting for 23.7% of its total area, where a large number of threatened marine species and high resistance scores were present, but a small number of corridors were shown to support such biodiversity. South China Sea has the largest area under protection, accounting for 9.4% of the region. The Yellow Sea has the smallest proportion of areas in all vulnerable categories combined, with 40.7% of the areas classified in the three vulnerable categories and 4.4% in the protected category. The East China Sea exhibited the largest areas in the three vulnerable categories combined, with 46.5% covering almost half of the region, primarily in offshore areas.
4 Discussion
4.1 Framing resistance-based seascape connectivity
Globally, marine ecosystems are facing increasing threats from both anthropogenic disturbances and climate change, endangering the invaluable biodiversity and lifecycles of marine species (Doney et al., 2011; Griggs et al., 2013; Hilborn, 2016; Halpern et al., 2017). There is a pressing need to assess resilience and vulnerability in marine ecosystems on a seascape scale to guide large-scale marine conservation efforts with ample scientific evidence (Chin et al., 2010; Pacifici et al., 2015). In this study, we framed a seascape connectivity model to provide implications for marine conservation implications. Connectivity modeling, coupled with marine species distribution, allows us to examine the spatial patterns of vulnerability in coastal regions (Wilson et al., 2020).
Threats to marine ecosystems are especially intense in coastal seas, where heavy human activities occur, including coastal urban pollution, ship traffic, and exploitation of marine resources (Montefalcone et al., 2010; Puritz and Toonen, 2011). In China’s coastal sea, marine biodiversity is exposed to high levels of anthropogenic disturbances and climate change impacts with the rapid coastal economic development of China (Jiao et al., 2015; Xu et al., 2016), raising concerns about regional seascape vulnerability. Human activities have challenged seascape resilience at a regional scale, with a concentrated distribution in major economic zones. Specifically, the inshore regions of major coastal metropolises and ports in China are exposed to concentrated and intensive human disturbances, such as the Bohai Rim, Yangtze River Delta, and Pearl River Delta (Figure 2). In 2019, four of the major ports in these coastal regions were listed in the top five global busiest ports according to data collected from Lloyd’s list, illustrating the high impact of the world’s most concentrated shipping business on coastal ecosystems. In addition, large-scale reclamation and ocean pollution along China’s coastline have also been identified as key factors contributing to the overall seascape resistance (Ma et al., 2014; Jiao et al., 2015). In contrast, climate change impacts are less concentrated and drastic compared to heavy human disturbances in China’s coastal seas. For instance, even with high levels of SST anomalies, the Yellow Sea has a rather low resistance value with lower anthropogenic disturbances (Figure 2) (Xu et al., 2018). As anthropogenic effects had the highest contribution to determining the spatial patterns of overall resistance (Figure 3), the key to reducing resistance to seascape connectivity is to restrict and mitigate concentrated human activity along China’s coastline, especially in inshore areas due to the development of major ports and coastal cities. Enlarging or proliferating connected core patches (key habitats and MPAs) are of great help in lowering the exposure to human impacts and enhancing the adaptive capacity to disturbances at the local scale, as shown in the mitigation effect provided by these core patches in our model (Figure 2). However, the gradual but large-scale impact of climate change should not be overlooked because it requires long-term commitment, particularly for high-emission countries, to battle the critical global impact and consequences even beyond current measurement (Chin et al., 2010; Beier, 2012; Magris et al., 2014).
Connectivity is often modeled as a practical way to quantify the adaptive capacity of ecosystems in the face of anthropogenic and climatic exposures (Grober-Dunsmore et al., 2009; Ortodossi et al., 2019; Virtanen et al., 2020). Marine species tend to migrate and adjust their distribution ranges in response to environmental stress or as part of their natural life cycle (Berkstrom et al., 2013). Climate refugee (or range-shifters) of marine species, which describe species forced to shift their ranges due to climate change impact, may significantly rely on connected corridors and habitat resources to maintain their population integrity (Ashcroft, 2010; Pimentel et al., 2014; Noll, 2018). Therefore, preserving connectivity on a seascape scale is critical for marine ecosystem resilience (Mellin et al., 2016; Li et al., 2019). Areas connected with corridors, especially for multiple species guilds, indicate a greater capacity for species with a variety of traits to access suitable and abundant marine habitats, shelters, and resources to migrate to complete lifecycle processes or avoid stress. We found that short- and mid-range marine species (including R. immaculatus, O. ferox, and S. formosa) showed connected corridors only in the inshore regions of China’s coastal sea (Figure 4), which are more likely to be restrained from offshore movement because of the lack of core patches and connected corridors for these species. Even with abundant habitat resources, the inshore region is highly concentrated with shipping and pollution (Figure 2), which serve both as environmental stress and resistance that impedes movement (Zeller et al., 2012). Therefore, the loss of inshore habitats under high stress levels could potentially have catastrophic effects on short- to mid-range species whose lifecycles are closely tied to these habitats, including reproduction, shelter, access to food (Hitt et al., 2011; Olds et al., 2013; Abadie et al., 2018), and lack of alternative corridors to migrate. In contrast, pelagic long-range species (≥100 km, e.g., whales, sharks, and tuna) can redistribute their movement pathways through offshore areas in an extended spatial range (Figure 4). Corridors for these species are distributed across the inshore and offshore coastal seas; thus, alternative pathways in such connectivity networks may ease the local losses of connectivity due to disturbances. Therefore, in addition to the mitigation and regulation of human impacts in the concentrated inshore region, it is important to highlight the need to ensure that short- and mid-range marine species have ample protection and support with an interconnected network for movement. Emphasis should be placed on offshore areas that may not be actively connected and utilized because of the lack of existing core patches, especially in the Bohai Sea and Yellow Sea with large corridor gaps. Ensuring the implementation of the critical attributes outlined by Edgar et al. (2014) for successful MPAs holds promise for restoring and conserving fish abundance and biomass, particularly in regions where MPAs are lacking. The establishment of a larger, interconnected network of MPAs can potentially enhance population sustainability not only within protected sites but also by creating a spillover effect on neighboring non-reserve areas (Kininmonth et al., 2011; Edgar et al., 2014). The design considerations for MPA locations and sizes based on connectivity principles should be tailored to site-specific conservation objectives and account for their relevant spatiotemporal scales (Balbar and Metaxas, 2019). At local or regional scales, establishing small but abundant patches may also effectively enhance connectivity and conserve the population if they are placed in proximity within the connected network (Weeks, 2017; Wintle et al., 2019). In essence, applying MPA networks as an effective tool to promote connectivity in offshore regions and to preserve critical inshore habitats is imperative to safeguard seascape connectivity and resilience, particularly under high exposure.
4.2 Prioritizing seascape conservation efforts through vulnerability assessment
Building on the modeling of resistance-based seascape connectivity, we further applied the vulnerability assessment framework to explicitly prioritize marine conservation efforts in China’s coastal seas (He et al., 2018). Vulnerable areas were identified as regions characterized by high levels of human-induced and climatic disturbances, as well as the abundance of threatened marine species but lacking sufficient connected corridors. The identified vulnerability may significantly increase the risk of a higher local extinction rate, loss of critical ecological functions, and reduced ecosystem resilience to disturbances (Etter et al., 2011; Kininmonth et al., 2011; Pacifici et al., 2015; Sajjad et al., 2018). The areas highlighted in red in Figure 5 are primarily located in offshore regions, particularly in the offshore Yellow Sea and East China Sea, where the absence of well-established MPAs and key habitats creates significant conservation gaps for locally threatened species. These regions overlap with the high risk of coastal natural hazards, which may continue to intensify under climate change scenarios (Sajjad et al., 2018). This risk underscores the crucial importance of conserving these vulnerable regions as they are susceptible to potential catastrophic events that could significantly disrupt marine populations (Dulvy et al., 2003). A small proportion of the study area (4.1%) was identified as protected areas, mainly situated within a connected network of core patches or contained within these patches. Only 10.1% of the study area is safeguarded by the current MPA and key habitats. The sustainable development goals and “30 × 30” target of the global biodiversity framework highlight the importance of effective conservation in halting biodiversity loss and conserving key habitats (Shen et al., 2023). This leads to a large gap of 19.9% in the coverage of biodiversity conservation targets in China’s coastal sea. The identified areas with high vulnerability in the four regions can be further prioritized as potential conservation zones to increase total coverage. The spatial conservation gaps identified in our study underscore the urgency to expand the MPA network and establish offshore support systems for the preservation of threatened marine species.
Figure 5
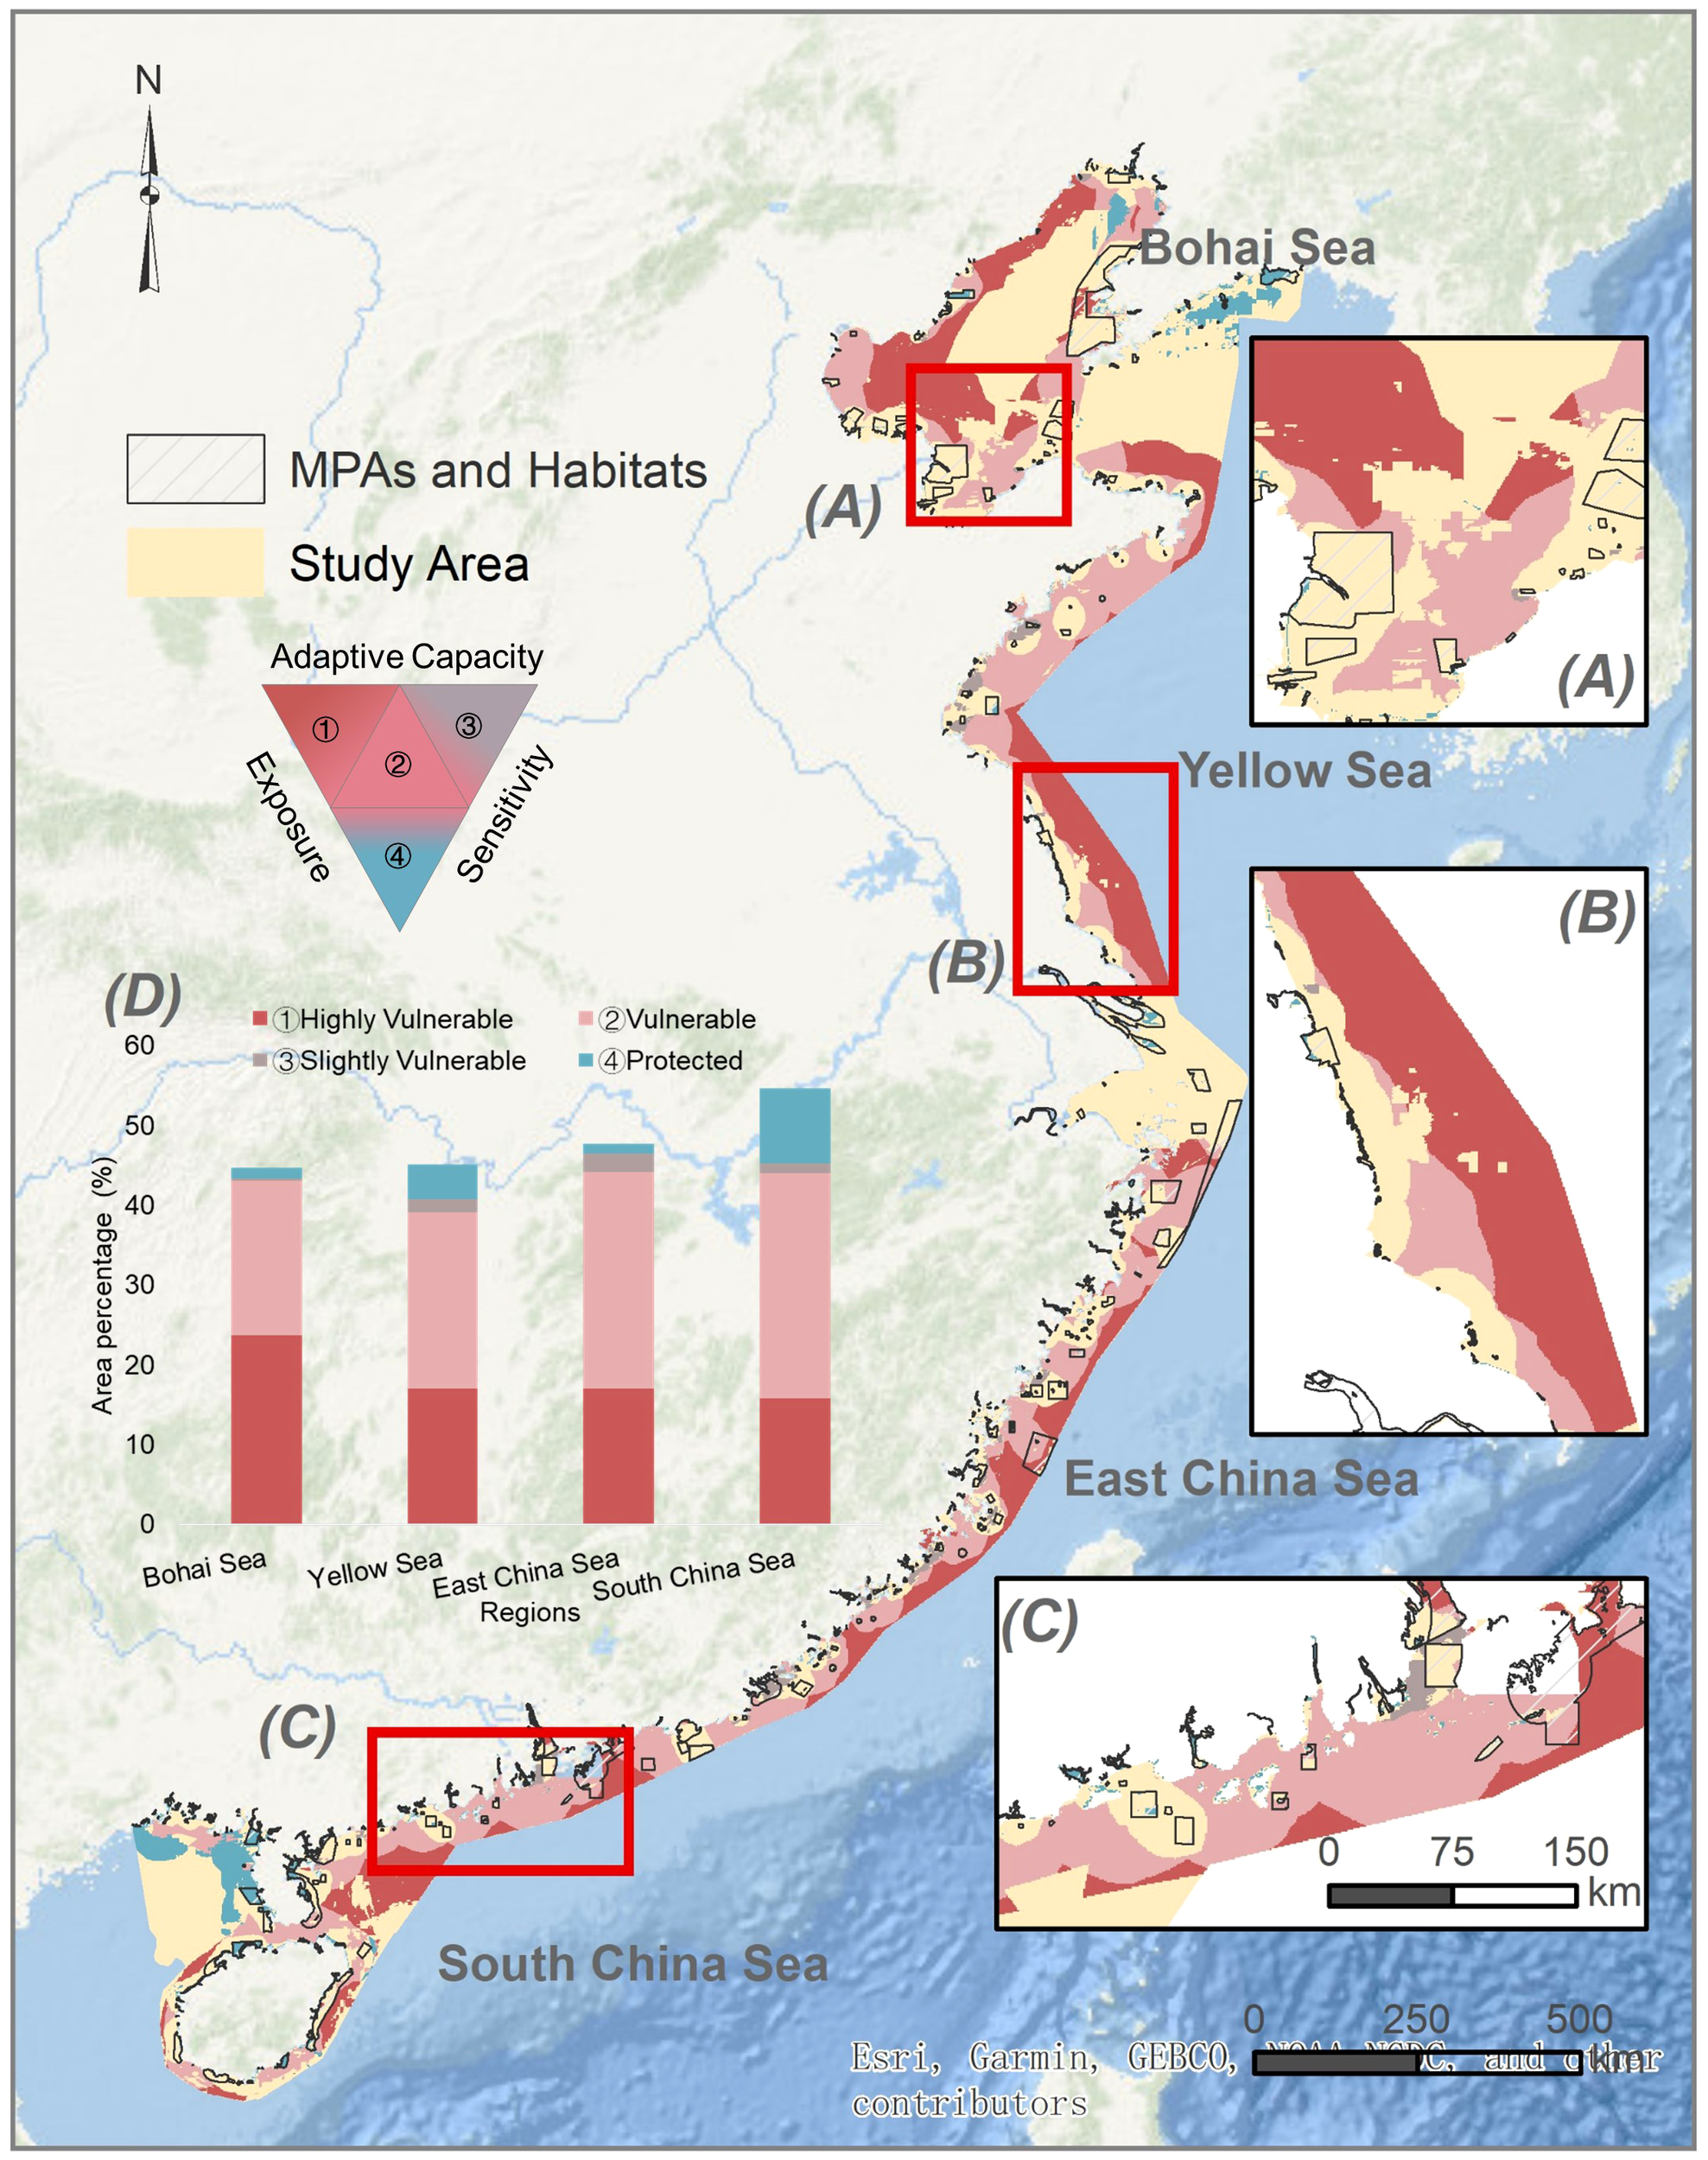
Vulnerability map of China’s coastal sea, assessed in terms of exposure (resistance), sensitivity (threatened marine species), and adaptive capacity (number of corridors). The right panels show a detailed view of the Bohai Rim (A), Yellow Sea (B), and Pearl River Delta (C). The left panel (D) show the area percentages of the four categories in the four seas: ①Highly Vulnerable, ②Vulnerable, ③Slightly Vulnerable, and ④Protected.
Notably, we found that the Yellow Sea suffered the greatest exposure to SST anomalies (Supplementary Figure 2), creating potential marine climate refugees seeking a suitable range shift. However, offshore regions with a high number of threatened species are left unconnected and unprotected because of insufficient MPA networks. Intensifying marine heat waves caused by climate change has substantially reduced the supporting capacity and resilience of marginal coral reefs, which act as thermal refugia in the South China Sea (Mo et al., 2022). Climate change-induced range shifts of species could significantly alter community structure, and such shifting may be much faster in marine environments due to fewer physical barriers than in terrestrial ecosystems (Wallingford et al., 2020). The tropicalization of foundation species, such as the poleward expansion of mangroves, could rapidly replace salt marsh habitats and critically impact coastal ecosystem structure and function (Osland et al., 2022). Sensitive marine species groups that can be disproportionately affected by conservation gaps include climate refugees outpaced by changes in native habitats, threatened species with vulnerable populations, and/or short-to-mid-range species with limited corridors for migration (Wilson et al., 2020; Hermoso et al., 2021). Climate refugee marine species have been shown to have significantly greater diversity in patches with greater connectivity and protection of climate change refugia (Morelli et al., 2017); therefore, prioritizing strategies to enhance seascape connectivity is crucial for climate-adaptive conservation efforts targeting these sensitive species groups (Littlefield et al., 2019). Strategies to support marine ecosystem connectivity and resilience may include the establishment of MPA networks, habitat restoration initiatives, and identification and improvement of key migration routes (McLeod et al., 2009; Wallace et al., 2010; Fraschetti et al., 2021).
We identified marine conservation priorities along the coastal sea of China by applying the proposed seascape connectivity framework and vulnerability assessments. Our results showed that inshore regions of China’s coastal sea concentrate on both high levels of anthropogenic disturbances and connected corridors, while offshore regions often lack sufficient interconnected networks to protect sensitive threatened species. Consequently, marine conservation efforts in inshore regions should prioritize the regulation and mitigation of human impact in major coastal cities and ports such as Bohai Rim, Xiamen Port, Lianyungang Port, and Pearl River Delta. Offshore conservation efforts should be directed toward enhancing seascape connectivity, providing connected corridors, and facilitating species movement. The combined strategy of conservation and marine spatial planning should prioritize species groups that are particularly sensitive to environmental stress, including threatened populations, climate refugees of marine species, and short-to-mid-range species. Collectively, this study underscores the potential of applying existing tools and theories from landscape connectivity studies and marine-specific indicators in functional connectivity modeling at a seascape scale. Furthermore, our results highlight the important role of seascape connectivity modeling in prioritizing spatial marine conservation strategies, thereby providing valuable insights for evidence-based marine conservation efforts. The proposed modeling framework introduces uncertainties regarding how the impact of resistance factors might change with varying water depths and how populations of marine species might respond to the identified potential corridors. Further research is necessary to address these uncertainties and enhance the understanding of their influence within the framework.
Statements
Data availability statement
The original contributions presented in the study are included in the article/Supplementary Material. Further inquiries can be directed to the corresponding author.
Author contributions
YK: Conceptualization, Data curation, Formal analysis, Investigation, Methodology, Software, Validation, Visualization, Writing – original draft, Writing – review & editing. YXL: Validation, Visualization, Writing – review & editing, Conceptualization. ZC: Validation, Visualization, Writing – review & editing. XZ: Formal analysis, Software. YL: Conceptualization, Funding acquisition, Investigation, Methodology, Project administration, Resources, Supervision, Validation, Visualization, Writing – review & editing, Software.
Funding
The author(s) declare financial support was received for the research, authorship, and/or publication of this article. This work was supported by the National Natural Science Foundation of China (Grant No.72394404) and National Natural Science Foundation of China (No.41701205).
Acknowledgments
We thank Q. Jin for his technological support, and also XZ for the data analysis regarding the comments from reviewers.
Conflict of interest
The authors declare that the research was conducted in the absence of any commercial or financial relationships that could be construed as a potential conflict of interest.
Publisher’s note
All claims expressed in this article are solely those of the authors and do not necessarily represent those of their affiliated organizations, or those of the publisher, the editors and the reviewers. Any product that may be evaluated in this article, or claim that may be made by its manufacturer, is not guaranteed or endorsed by the publisher.
Supplementary material
The Supplementary Material for this article can be found online at: https://www.frontiersin.org/articles/10.3389/fmars.2023.1322001/full#supplementary-material
References
1
Abadie A. Pace M. Gobert S. Borg J. A. (2018). Seascape ecology in Posidonia oceanica seagrass meadows: Linking structure and ecological processes for management. Ecol. Indic.87, 1–13. doi: 10.1016/j.ecolind.2017.12.029
2
Ashcroft M. B. (2010). Identifying refugia from climate change. J Biogeography37 (8), 1407–1413.
3
Balbar A. C. Metaxas A. (2019). The current application of ecological connectivity in the design of marine protected areas. Glob Ecol. Conserv.17, e00569. doi: 10.1016/j.gecco.2019.e00569
4
Barneche D. R. Hulatt C. J. Dossena M. Padfield D. Woodward G. Trimmer M. et al . (2021). Warming impairs trophic transfer efficiency in a long-term field experiment. Nature592, 76–79. doi: 10.1038/s41586-021-03352-2
5
Beier P. (2012). Conceptualizing and designing corridors for climate change. Ecol. Restor.30, 312–319. doi: 10.3368/er.30.4.312
6
Berkström C. Eggertsen L. Goodell W. Cordeiro C. Lucena M. Gustafsson R. et al . (2020). Thresholds in seascape connectivity: the spatial arrangement of nursery habitats structure fish communities on nearby reefs. Ecography43, 882–896. doi: 10.1111/ecog.04868
7
Berkstrom C. Lindborg R. Thyresson M. Gullstrom M. (2013). Assessing connectivity in a tropical embayment: Fish migrations and seascape ecology. Biol. Conserv.166, 43–53. doi: 10.1016/j.biocon.2013.06.013
8
Brooks T. M. Akçakaya H. R. Burgess N. D. Butchart S. H. Hilton-Taylor C. Hoffmann M. et al . (2016). Analysing biodiversity and conservation knowledge products to support regional environmental assessments. Scientific Data3, 1–14. doi: 10.1038/sdata.2016.7
9
Bruno J. F. Kennedy C. W. (2000). Patch-size dependent habitat modification and facilitation on New England cobble beaches by Spartina alterniflora. Oecologia122, 98–108. doi: 10.1007/PL00008841
10
Caldwell I. R. Gergel S. E. (2013). Thresholds in seascape connectivity: influence of mobility, habitat distribution, and current strength on fish movement. Landscape Ecol.28, 1937–1948. doi: 10.1007/s10980-013-9930-9
11
Carroll C. McRAE B. H. Brookes A. (2012). Use of linkage mapping and centrality analysis across habitat gradients to conserve connectivity of gray wolf populations in western North America. Conserv. Biol.26, 78–87. doi: 10.1111/j.1523-1739.2011.01753.x
12
Cecino G. Valavi R. Treml E. A. (2021). Testing the influence of seascape connectivity on marine-based species distribution models. Front. Mar. Sci.8, 766915. doi: 10.3389/fmars.2021.766915
13
Chen C. Jefferson T. A. Chen B. Wang Y. (2022). Geographic range size, water temperature, and extrinsic threats predict the extinction risk in global cetaceans. Global Change Biol.28, 6541–6555. doi: 10.1111/gcb.16385
14
Chin A. Kyne P. M. Walker T. I. McAuley R. B. (2010). An integrated risk assessment for climate change: analysing the vulnerability of sharks and rays on Australia’s Great Barrier Reef. Global Change Biol.16, 1936–1953. doi: 10.1111/j.1365-2486.2009.02128.x
15
Crozier L. G. Burke B. J. Chasco B. E. Widener D. L. Zabel R. W. (2021). Climate change threatens Chinook salmon throughout their life cycle. Commun. Biol.4, 222. doi: 10.1038/s42003-021-01734-w
16
Dai Y. Yang S. Zhao D. Hu C. Xu W. Anderson D. M. et al . (2023). Coastal phytoplankton blooms expand and intensify in the 21st century. Nature615, 280–284. doi: 10.1038/s41586-023-05760-y
17
De Lange H. Sala S. Vighi M. Faber J. H. (2010). Ecological vulnerability in risk assessment—A review and perspectives. Sci. total Environ.408, 3871–3879. doi: 10.1016/j.scitotenv.2009.11.009
18
Dickson B. G. Albano C. M. McRae B. H. Anderson J. J. Theobald D. M. Zachmann L. J. et al . (2017). Informing strategic efforts to expand and connect protected areas using a model of ecological flow, with application to the Western United States. Conserv. Lett.10, 564–571. doi: 10.1111/conl.12322
19
Doney S. C. Ruckelshaus M. Duffy J. E. Barry J. P. Chan F. English C. A. et al . (2011). Climate change impacts on marine ecosystems. Annual Rev. Mar. Sci.4, 11–37.
20
Duarte C. M. Agusti S. Barbier E. Britten G. L. Castilla J. C. Gattuso J.-P. et al . (2020). Rebuilding marine life. Nature580, 39–51. doi: 10.1038/s41586-020-2146-7
21
Dudley P. N. Rogers T. L. Morales M. M. Stoltz A. D. Sheridan C. J. Beulke A. K. et al . (2021). A more comprehensive climate vulnerability assessment framework for fisheries social-ecological systems. Front. Mar. Sci.8, 678099. doi: 10.3389/fmars.2021.678099
22
Dulvy N. K. Sadovy Y. Reynolds J. D. (2003). Extinction vulnerability in marine populations. Fish fisheries4, 25–64. doi: 10.1046/j.1467-2979.2003.00105.x
23
Edgar G. J. Stuart-Smith R. D. Willis T. J. Kininmonth S. Baker S. C. Banks S. et al . (2014). Global conservation outcomes depend on marine protected areas with five key features. Nature506, 216–220. doi: 10.1038/nature13022
24
Engelhard S. L. Huijbers C. M. Stewart-Koster B. Olds A. D. Schlacher T. A. Connolly R. M. (2017). Prioritising seascape connectivity in conservation using network analysis. J. Appl. Ecol.54, 1130–1141. doi: 10.1111/1365-2664.12824
25
Erdelen W. R. (2020). Shaping the fate of life on Earth: The post-2020 global biodiversity framework. Global Policy11, 347–359. doi: 10.1111/1758-5899.12773
26
Etter A. McAlpine C. A. Seabrook L. Wilson K. A. (2011). Incorporating temporality and biophysical vulnerability to quantify the human spatial footprint on ecosystems. Biol. Conserv.144, 1585–1594. doi: 10.1016/j.biocon.2011.02.004
27
Fraschetti S. McOwen C. Papa L. Papadopoulou N. Bilan M. Boström C. et al . (2021). Where is more important than how in coastal and marine ecosystems restoration. Front. Mar. Sci.8, 626843. doi: 10.3389/fmars.2021.626843
28
Galpern P. Manseau M. Fall A. (2011). Patch-based graphs of landscape connectivity: a guide to construction, analysis and application for conservation. Biol. Conserv.144, 44–55. doi: 10.1016/j.biocon.2010.09.002
29
Game E. T. Bode M. McDonald-Madden E. Grantham H. S. Possingham H. P. (2009). Dynamic marine protected areas can improve the resilience of coral reef systems. Ecol. Lett.12, 1336–1346. doi: 10.1111/j.1461-0248.2009.01384.x
30
Griggs D. Stafford-Smith M. Gaffney O. Rockström J. Öhman M. C. Shyamsundar P. et al . (2013). Policy: Sustainable development goals for people and planet. Nature495, 305. doi: 10.1038/495305a
31
Grober-Dunsmore R. Pittman S. J. Caldow C. Kendall M. S. Frazer T. K. (2009). “A landscape ecology approach for the study of ecological connectivity across tropical marine seascapes,” in Ecological connectivity among tropical coastal ecosystems, 493–530. (Heidelberg: Springer).
32
Halpern B. S. Frazier M. Afflerbach J. Lowndes J. S. Micheli F. O’Hara C. et al . (2019). Recent pace of change in human impact on the world’s ocean. Scientific Reports9, 1–8. doi: 10.1038/s41598-019-47201-9
33
Halpern B. S. Frazier M. Afflerbach J. O’Hara C. Katona S. Lowndes J. S. S. et al . (2017). Drivers and implications of change in global ocean health over the past five years. PLoS One12 (7), e0178267. doi: 10.1371/journal.pone.0178267
34
Halpern B. S. Frazier M. Potapenko J. Casey K. S. Koenig K. Longo C. et al . (2015). Spatial and temporal changes in cumulative human impacts on the world’s ocean. Nat. Commun.6, 7615. doi: 10.1038/ncomms8615
35
He L. Shen J. Zhang Y. (2018). Ecological vulnerability assessment for ecological conservation and environmental management. J. Environ. Manage.206, 1115–1125. doi: 10.1016/j.jenvman.2017.11.059
36
Hermoso V. Vasconcelos R. P. Henriques S. Filipe A. F. Carvalho S. B. (2021). Conservation planning across realms: Enhancing connectivity for multi-realm species. J. Appl. Ecol.58, 644–654. doi: 10.1111/1365-2664.13796
37
Hilborn R. (2016). Marine biodiversity needs more than protection. Nature535, 224–226. doi: 10.1038/535224a
38
Hilty J. Worboys G. L. Keeley A. Woodley S. Lausche B. Locke H. et al . (2020). Guidelines for conserving connectivity through ecological networks and corridors. Best Pract. protected area Guidelines Ser.30, 122. doi: 10.2305/IUCN.CH.2020.PAG.30.en
39
Hitt S. Pittman S. J. Nemeth R. S. (2011). Diel movements of fishes linked to benthic seascape structure in a Caribbean coral reef ecosystem. Mar. Ecol.-Prog. Ser.427, 275–291. doi: 10.3354/meps09093
40
IUCN . (2020). The IUCN red list of threatened species. Available at: http://www.iucnredlist.org.
41
Jacob C. van Bochove J. W. Livingstone S. White T. Pilgrim J. Bennun L. (2020). Marine biodiversity offsets: Pragmatic approaches toward better conservation outcomes. Conserv. Lett.13, e12711. doi: 10.1111/conl.12711
42
Jiao N.-Z. Chen D.-K. Luo Y.-M. Huang X.-P. Zhang R. Zhang H.-B. et al . (2015). Climate change and anthropogenic impacts on marine ecosystems and countermeasures in China. Adv. Climate Change Res.6, 118–125. doi: 10.1016/j.accre.2015.09.010
43
Jonsson P. R. Hammar L. Wåhlström I. Pålsson J. Hume D. Almroth-Rosell E. et al . (2021). Combining seascape connectivity with cumulative impact assessment in support of ecosystem-based marine spatial planning. J. Appl. Ecol.58, 576–586. doi: 10.1111/1365-2664.13813
44
Kavanagh D. Nuñez T. McRae B. (2012). Climate linkage mapper connectivity analysis software (Seattle: Adze Informatics Seattle).
45
Keeley A. T. H. Beier P. Jenness J. S. (2021). Connectivity metrics for conservation planning and monitoring. Biol. Conserv.255, 109008. doi: 10.1016/j.biocon.2021.109008
46
Kininmonth S. Beger M. Bode M. Peterson E. Adams V. M. Dorfman D. et al . (2011). Dispersal connectivity and reserve selection for marine conservation. Ecol. Model.222, 1272–1282. doi: 10.1016/j.ecolmodel.2011.01.012
47
Kong F. Wang D. Yin H. Dronova I. Fei F. Chen J. et al . (2021). Coupling urban 3-D information and circuit theory to advance the development of urban ecological networks. Conserv. Biol.35, 1140–1150. doi: 10.1111/cobi.13682
48
Li Y. Yin B. Li Y. (2019). Early warning signals for landscape connectivity and resilient conservation solutions. Land degradation Dev.30, 73–83. doi: 10.1002/ldr.3206
49
Ling S. Johnson C. Frusher S. Ridgway K. (2009). Overfishing reduces resilience of kelp beds to climate-driven catastrophic phase shift. Proc. Natl. Acad. Sci.106, 22341–22345. doi: 10.1073/pnas.0907529106
50
Littlefield C. E. Krosby M. Michalak J. L. Lawler J. J. (2019). Connectivity for species on the move: supporting climate-driven range shifts. Front. Ecol. Environ.17, 270–278. doi: 10.1002/fee.2043
51
Lott A. (2022). Barriers to wildlife movement in straits: Problematizing habitat connectivity across marine ecosystems. Mar. Policy141, 105107. doi: 10.1016/j.marpol.2022.105107
52
Lu W.-H. Liu J. Xiang X.-Q. Song W.-L. McIlgorm A. (2015). A comparison of marine spatial planning approaches in China: Marine functional zoning and the marine ecological red line. Mar. Policy62, 94–101. doi: 10.1016/j.marpol.2015.09.004
53
Ma Z. Melville D. S. Liu J. Chen Y. Yang H. Ren W. et al . (2014). Rethinking China’s new great wall. Science346, 912–914. doi: 10.1126/science.1257258
54
Magris R. A. Pressey R. L. Weeks R. Ban N. C. (2014). Integrating connectivity and climate change into marine conservation planning. Biol. Conserv.170, 207–221. doi: 10.1016/j.biocon.2013.12.032
55
McLeod E. Salm R. Green A. Almany J. (2009). Designing marine protected area networks to address the impacts of climate change. Front. Ecol. Environ.7, 362–370. doi: 10.1890/070211
56
McRae B. H. Kavanagh D. M. (2011). Linkage mapper connectivity analysis software (Seattle: The Nature Conservancy).
57
Mellin C. MacNeil M. A. Cheal A. J. Emslie M. J. Caley M. J. (2016). Marine protected areas increase resilience among coral reef communities. Ecol. Lett.19, 629–637. doi: 10.1111/ele.12598
58
Mitchell M. G. Bennett E. M. Gonzalez A. (2013). Linking landscape connectivity and ecosystem service provision: current knowledge and research gaps. Ecosystems16, 894–908. doi: 10.1007/s10021-013-9647-2
59
MNR . (2011). The National Marine Function Zone (2011~2020). Available at: http://f.mnr.gov.cn/201806/t20180621_1830454.html.
60
Mo S. Chen T. Chen Z. Zhang W. Li S. (2022). Marine heatwaves impair the thermal refugia potential of marginal reefs in the northern South China Sea. Sci. Total Environ.825, 154100. doi: 10.1016/j.scitotenv.2022.154100
61
Montefalcone M. Parravicini V. Vacchi M. Albertelli G. Ferrari M. Morri C. et al . (2010). Human influence on seagrass habitat fragmentation in NW Mediterranean Sea. Estuar. Coast. Shelf Sci.86, 292–298. doi: 10.1016/j.ecss.2009.11.018
62
Morelli T. L. Maher S. P. Lim M. C. Kastely C. Eastman L. M. Flint L. E. et al . (2017). Climate change refugia and habitat connectivity promote species persistence. Climate Change Responses4, 1–12. doi: 10.1186/s40665-017-0036-5
63
Mumby P. J. Edwards A. J. Arias-Gonzalez J. E. Lindeman K. C. Blackwell P. G. Gall A. et al . (2004). Mangroves enhance the biomass of coral reef fish communities in the Caribbean. Nature427, 533–536. doi: 10.1038/nature02286
64
Noll S. (2018). Nonhuman climate refugees: The role that urban communities should play in ensuring ecological resilience. Environ. Ethics40, 119–134. doi: 10.5840/enviroethics201840213
65
O’Hara C. C. Frazier M. Halpern B. S. (2021). At-risk marine biodiversity faces extensive, expanding, and intensifying human impacts. Science372, 84–87. doi: 10.1126/science.abe6731
66
Olds A. D. Albert S. Maxwell P. S. Pitt K. A. Connolly R. M. (2013). Mangrove-reef connectivity promotes the effectiveness of marine reserves across the western Pacific. Global Ecol. Biogeography22, 1040–1049. doi: 10.1111/geb.12072
67
Olds A. D. Connolly R. M. Pitt K. A. Pittman S. J. Maxwell P. S. Huijbers C. M. et al . (2016). Quantifying the conservation value of seascape connectivity: a global synthesis. Global Ecol. Biogeography25, 3–15. doi: 10.1111/geb.12388
68
Olson A. M. Hessing-Lewis M. Haggarty D. Juanes F. (2019). Nearshore seascape connectivity enhances seagrass meadow nursery function. Ecol. Appl.29 (5), e01897. doi: 10.1002/eap.1897
69
Ortodossi N. L. Gilby B. L. Schlacher T. A. Connolly R. M. Yabsley N. A. Henderson C. J. et al . (2019). Effects of seascape connectivity on reserve performance along exposed coastlines. Conserv. Biol.33, 580–589. doi: 10.1111/cobi.13237
70
Osland M. J. Hughes A. R. Armitage A. R. Scyphers S. B. Cebrian J. Swinea S. H. et al . (2022). The impacts of mangrove range expansion on wetland ecosystem services in the southeastern United States: current understanding, knowledge gaps, and emerging research needs. Global Change Biol.28, 3163–3187. doi: 10.1111/gcb.16111
71
Pacifici M. Foden W. B. Visconti P. Watson J. E. M. Butchart S. H. M. Kovacs K. M. et al . (2015). Assessing species vulnerability to climate change. Nat. Climate Change5, 215–225. doi: 10.1038/nclimate2448
72
Palumbi S. R. (2004). Marine reserves and ocean neighborhoods: The spatial scale of marine populations and their management. Annu. Rev. Environ. Resour.29, 31–68. doi: 10.1146/annurev.energy.29.062403.102254
73
Pigot A. L. Merow C. Wilson A. Trisos C. H. (2023). Abrupt expansion of climate change risks for species globally. Nat. Ecol. Evol.7, 1060–1071. doi: 10.1038/s41559-023-02070-4
74
Pimentel M. Pegado M. Repolho T. Rosa R. (2014). Impact of ocean acidification in the metabolism and swimming behavior of the dolphinfish (Coryphaena hippurus) early larvae. Mar. Biol.161, 725–729. doi: 10.1007/s00227-013-2365-7
75
Pinsky M. L. Eikeset A. M. McCauley D. J. Payne J. L. Sunday J. M. (2019). Greater vulnerability to warming of marine versus terrestrial ectotherms. Nature569, 108–111. doi: 10.1038/s41586-019-1132-4
76
Pinsky M. L. Selden R. L. Kitchel Z. J. (2020). Climate-driven shifts in marine species ranges: Scaling from organisms to communities. Annu. Rev. Mar. Sci.12, 153–179. doi: 10.1146/annurev-marine-010419-010916
77
Pittman S. J. (2017). Seascape ecology (Hoboken: John Wiley & Sons).
78
Puritz J. B. Toonen R. J. (2011). Coastal pollution limits pelagic larval dispersal. Nat. Commun.2, 8. doi: 10.1038/ncomms1238
79
Qi Q.-h. Cai R.-s. Yan X.-h. (2019). Discussion on climate change and marine disaster risk governance in the coastal China seas. Mar. Sci. Bull. (Beijing)38, 361–367.
80
Saintilan N. Horton B. Törnqvist T. E. Ashe E. L. Khan N. S. Schuerch M. et al . (2023). Widespread retreat of coastal habitat is likely at warming levels above 1.5 °C. Nature621 (7977), 112–119. doi: 10.1038/s41586-023-06448-z
81
Sajjad M. Li Y. Tang Z. Cao L. Liu X. (2018). Assessing hazard vulnerability, habitat conservation, and restoration for the enhancement of Mainland China’s coastal resilience. Earths Future6, 326–338. doi: 10.1002/2017EF000676
82
Sala E. Mayorga J. Bradley D. Cabral R. B. Atwood T. B. Auber A. et al . (2021). Protecting the global ocean for biodiversity, food and climate. Nature592, 397–402. doi: 10.1038/s41586-021-03371-z
83
Shen X. Liu M. Hanson J. O. Wang J. Locke H. Watson J. E. et al . (2023). Countries’ differentiated responsibilities to fulfill area-based conservation targets of the Kunming-Montreal Global Biodiversity Framework. One Earth6, 548–559. doi: 10.1016/j.oneear.2023.04.007
84
Shinomiya Y. Chiba S. Kanamori M. Hashizume S. Yoshino K. Goshima S. (2017). Importance of patch size variation for the population persistence of a decapod crustacean in seagrass beds. Mar. Ecol.-Prog. Ser.570, 157–171. doi: 10.3354/meps12126
85
Shipfinder . (2020). The Live Marine Traffic Tracking App. Available at: https://www.shipfinder.com/.
86
Swadling D. S. Knott N. A. Rees M. J. Davis A. R. (2019). Temperate zone coastal seascapes: seascape patterning and adjacent seagrass habitat shape the distribution of rocky reef fish assemblages. Landscape Ecol.34, 2337–2352. doi: 10.1007/s10980-019-00892-x
87
Tang Y. Huangfu J. Huang R. Chen W. (2020). Surface warming reacceleration in offshore China and its interdecadal effects on the East Asia–Pacific climate. Sci. Rep.10, 1–10. doi: 10.1038/s41598-020-71862-6
88
Theobald D. M. (2010). Estimating natural landscape changes from 1992 to 2030 in the conterminous US. Landscape Ecol.25, 999–1011. doi: 10.1007/s10980-010-9484-z
89
Treml E. A. Halpin P. N. Urban D. L. Pratson L. F. (2008). Modeling population connectivity by ocean currents, a graph-theoretic approach for marine conservation. Landscape Ecol.23, 19–36. doi: 10.1007/s10980-007-9138-y
90
Trew B. T. Grantham H. S. Barrientos C. Collins T. Doherty P. D. Formia A. et al . (2019). Using cumulative impact mapping to prioritize marine conservation efforts in Equatorial Guinea. Front. Mar. Sci.6, 717. doi: 10.3389/fmars.2019.00717
91
UNEP . (2015). Global Distribution of Saltmarshes. Available at: https://data.unepwcmc.org/datasets/43.
92
UNEP . (2018). Global Distribution of Coral Reefs. Available at: https://data.unepwcmc.org/datasets/1.
93
UNEP . (2020). Global Distribution of Seagrasses. Available at: https://data.unepwcmc.org/datasets/7.
94
Virtanen E. A. Moilanen A. Viitasalo M. (2020). Marine connectivity in spatial conservation planning: analogues from the terrestrial realm. Landscape Ecol.35, 1021–1034. doi: 10.1007/s10980-020-00997-8
95
Wallace B. P. DiMatteo A. D. Hurley B. J. Finkbeiner E. M. Bolten A. B. Chaloupka M. Y. et al . (2010). Regional management units for marine turtles: a novel framework for prioritizing conservation and research across multiple scales. PloS One5, e15465. doi: 10.1371/journal.pone.0015465
96
Wallentinus I. Nyberg C. D. (2007). Introduced marine organisms as habitat modifiers. Mar. pollut. Bull.55, 323–332. doi: 10.1016/j.marpolbul.2006.11.010
97
Wallingford P. D. Morelli T. L. Allen J. M. Beaury E. M. Blumenthal D. M. Bradley B. A. et al . (2020). Adjusting the lens of invasion biology to focus on the impacts of climate-driven range shifts. Nat. Climate Change10, 398–405. doi: 10.1038/s41558-020-0768-2
98
Weeks R. (2017). Incorporating seascape connectivity in conservation prioritisation. PloS One12, e0182396. doi: 10.1371/journal.pone.0182396
99
Wilson K. L. Tittensor D. P. Worm B. Lotze H. K. (2020). Incorporating climate change adaptation into marine protected area planning. Global Change Biol.26, 3251–3267. doi: 10.1111/gcb.15094
100
Wintle B. A. Kujala H. Whitehead A. Cameron A. Veloz S. Kukkala A. et al . (2019). Global synthesis of conservation studies reveals the importance of small habitat patches for biodiversity. Proc. Natl. Acad. Sci.116, 909–914. doi: 10.1073/pnas.1813051115
101
Xu W. Dong Y.-e. Teng X. Zhang P.-p. (2018). Evaluation of the development intensity of China’s coastal area. Ocean Coast. Manage.157, 124–129. doi: 10.1016/j.ocecoaman.2018.02.022
102
Xu X. Li X. Chen M. Li X. Duan X. Zhu G. et al . (2016). Land-ocean-human interactions in intensively developing coastal zone: Demonstration of case studies. Ocean Coast. Manage.133, 28–36. doi: 10.1016/j.ocecoaman.2016.09.006
103
Zeller K. A. McGarigal K. Whiteley A. R. (2012). Estimating landscape resistance to movement: a review. Landscape Ecol.27, 777–797. doi: 10.1007/s10980-012-9737-0
104
Zhang Z. Xu N. Li Y. Li Y. (2022). Sub-continental-scale mapping of tidal wetland composition for East Asia: A novel algorithm integrating satellite tide-level and phenological features. Remote Sens. Environ.269, 112799. doi: 10.1016/j.rse.2021.112799
Summary
Keywords
conservation priority, coastal area, dispersal distance, marine function zone, marine spatial planning, vulnerability assessment, migration
Citation
Kang Y, Lin Y, Chen Z, Zhang X and Li Y (2024) Framing seascape connectivity modeling to prioritize marine conservation effort in China’s coastal sea. Front. Mar. Sci. 10:1322001. doi: 10.3389/fmars.2023.1322001
Received
15 October 2023
Accepted
18 December 2023
Published
11 January 2024
Volume
10 - 2023
Edited by
Elena Gissi, National Research Council (CNR), Italy
Reviewed by
Wenjia Hu, Third Institute of Oceanography, State Oceanic Administration, China
Miguel Angel Ahumada-Sempoal, University of the Sea, Mexico
Stuart James Kininmonth, The University of Queensland, Australia
Updates
Copyright
© 2024 Kang, Lin, Chen, Zhang and Li.
This is an open-access article distributed under the terms of the Creative Commons Attribution License (CC BY). The use, distribution or reproduction in other forums is permitted, provided the original author(s) and the copyright owner(s) are credited and that the original publication in this journal is cited, in accordance with accepted academic practice. No use, distribution or reproduction is permitted which does not comply with these terms.
*Correspondence: Yi Li, yili@xmu.edu.cn
Disclaimer
All claims expressed in this article are solely those of the authors and do not necessarily represent those of their affiliated organizations, or those of the publisher, the editors and the reviewers. Any product that may be evaluated in this article or claim that may be made by its manufacturer is not guaranteed or endorsed by the publisher.