 Yunhai Fang
 Jiazhong Qian
 Lei Ma
 Huan Wang2*
94% of researchers rate our articles as excellent or good
Learn more about the work of our research integrity team to safeguard the quality of each article we publish.
Find out more
ORIGINAL RESEARCH article
Front. Mar. Sci., 04 December 2023
Sec. Coastal Ocean Processes
Volume 10 - 2023 | https://doi.org/10.3389/fmars.2023.1319751
This article is part of the Research TopicImpact of Ocean Forcing on the Coastal Hydrology, Environment and Freshwater ResourcesView all 12 articles
At aquifer-sea interfaces, submarine groundwater discharge (SGD) and related chemical loads are closely related to groundwater environment in the intertidal zone of coastal aquifers. Although unstable salinity distribution in the intertidal zone associated with salt-fingering flow has been known as a natural phenomenon for some coastal aquifers, a quantitative understanding of groundwater dynamics in the intertidal zone during salt-fingering flow is still lacking. This study investigated the movement features of salt fingers and the response laws of freshwater discharge zone (FDZ) in the intertidal zone, considering the fixed and seasonal inland conditions. The results revealed that during salt-fingering flow, the finger was repeatedly generated and detached from the intertidal zone. Horizontally, the finger moved toward the sea, and the finger speed first increased at the development stage, then remained unchanged at the separation stage, and finally decreased at the mergence stage. The movement speed of salt fingers was closely related to ambient freshwater flow in the FDZ. In the vertical direction, the finger first permeated downward with a decreasing speed, and then the upward discharge of fresh groundwater in the FDZ region with an increased flow velocity pushed the finger upwards with an increasing speed. In contrast to the results in a stable intertidal regime, the width of FDZ at the aquifer-sea interface fluctuated over time, and the variation trends possessed a well agreement with the flux of fresh groundwater discharge. This suggested that the width of FDZ at the aquifer-sea interface can be used as an indicator of fresh groundwater discharge, even in an unstable regime, to provide a basis for field monitoring. The intensity of salt-fingering flow varied over time under the condition of seasonal freshwater inflow. The mean duration of salt fingers decreased slightly with the increase of seasonal freshwater periods due to a decrease in the interface perturbation for the intertidal environment. These findings lay the foundation for gaining a better understanding of the potential implications of salt-fingering flow on SGD and related solute transports.
Water exchange across the aquifer-sea interface is the result of groundwater-seawater interactions. Generally, groundwater discharged from coastal aquifers into the ocean, termed as submarine groundwater discharge (SGD), is an important part of the global water cycle (Rodellas et al., 2015). It has been estimated that SGD fluxes may exceed river inflows on a global scale (Kwon et al., 2014). SGD has been identified as an important channel of widespread attention for terrestrial freshwater, nutrients, metals, and carbon to enter the ocean, affecting coastal water quality and ecosystems (Andrisoa et al., 2019; Starke et al., 2020; Kim et al., 2022). At the aquifer-sea interface, SGD fluxes, related chemical loads, and discharge locations are closely related to the groundwater environment in the intertidal zone of the aquifer (Robinson et al., 2018; Santos et al., 2021). Previous studies suggest that ocean forces (i.e., tides and waves) induce an upper saline plume (USP) in the intertidal zone, in addition to the known saltwater wedge (SW) formed by seawater intrusion in the lower aquifer (Figure 1A). Fresh groundwater bypasses the USP and carries inland solutes into the ocean, and the discharge hotspot is concentrated near the low-tide mark (Lebbe, 1981; Kuan et al., 2019). Moreover, the difference in the composition of freshwater and seawater generates geochemical (salinity, pH, and redox) gradients at the edge of the USP, which is an active reaction region and affects the fate of inland solutes and chemical loads discharged into the ocean (Heiss et al., 2017; Heiss et al., 2020). Therefore, it is essential to study groundwater dynamics in the intertidal zone for accurately estimating SGD and associated solute transports.
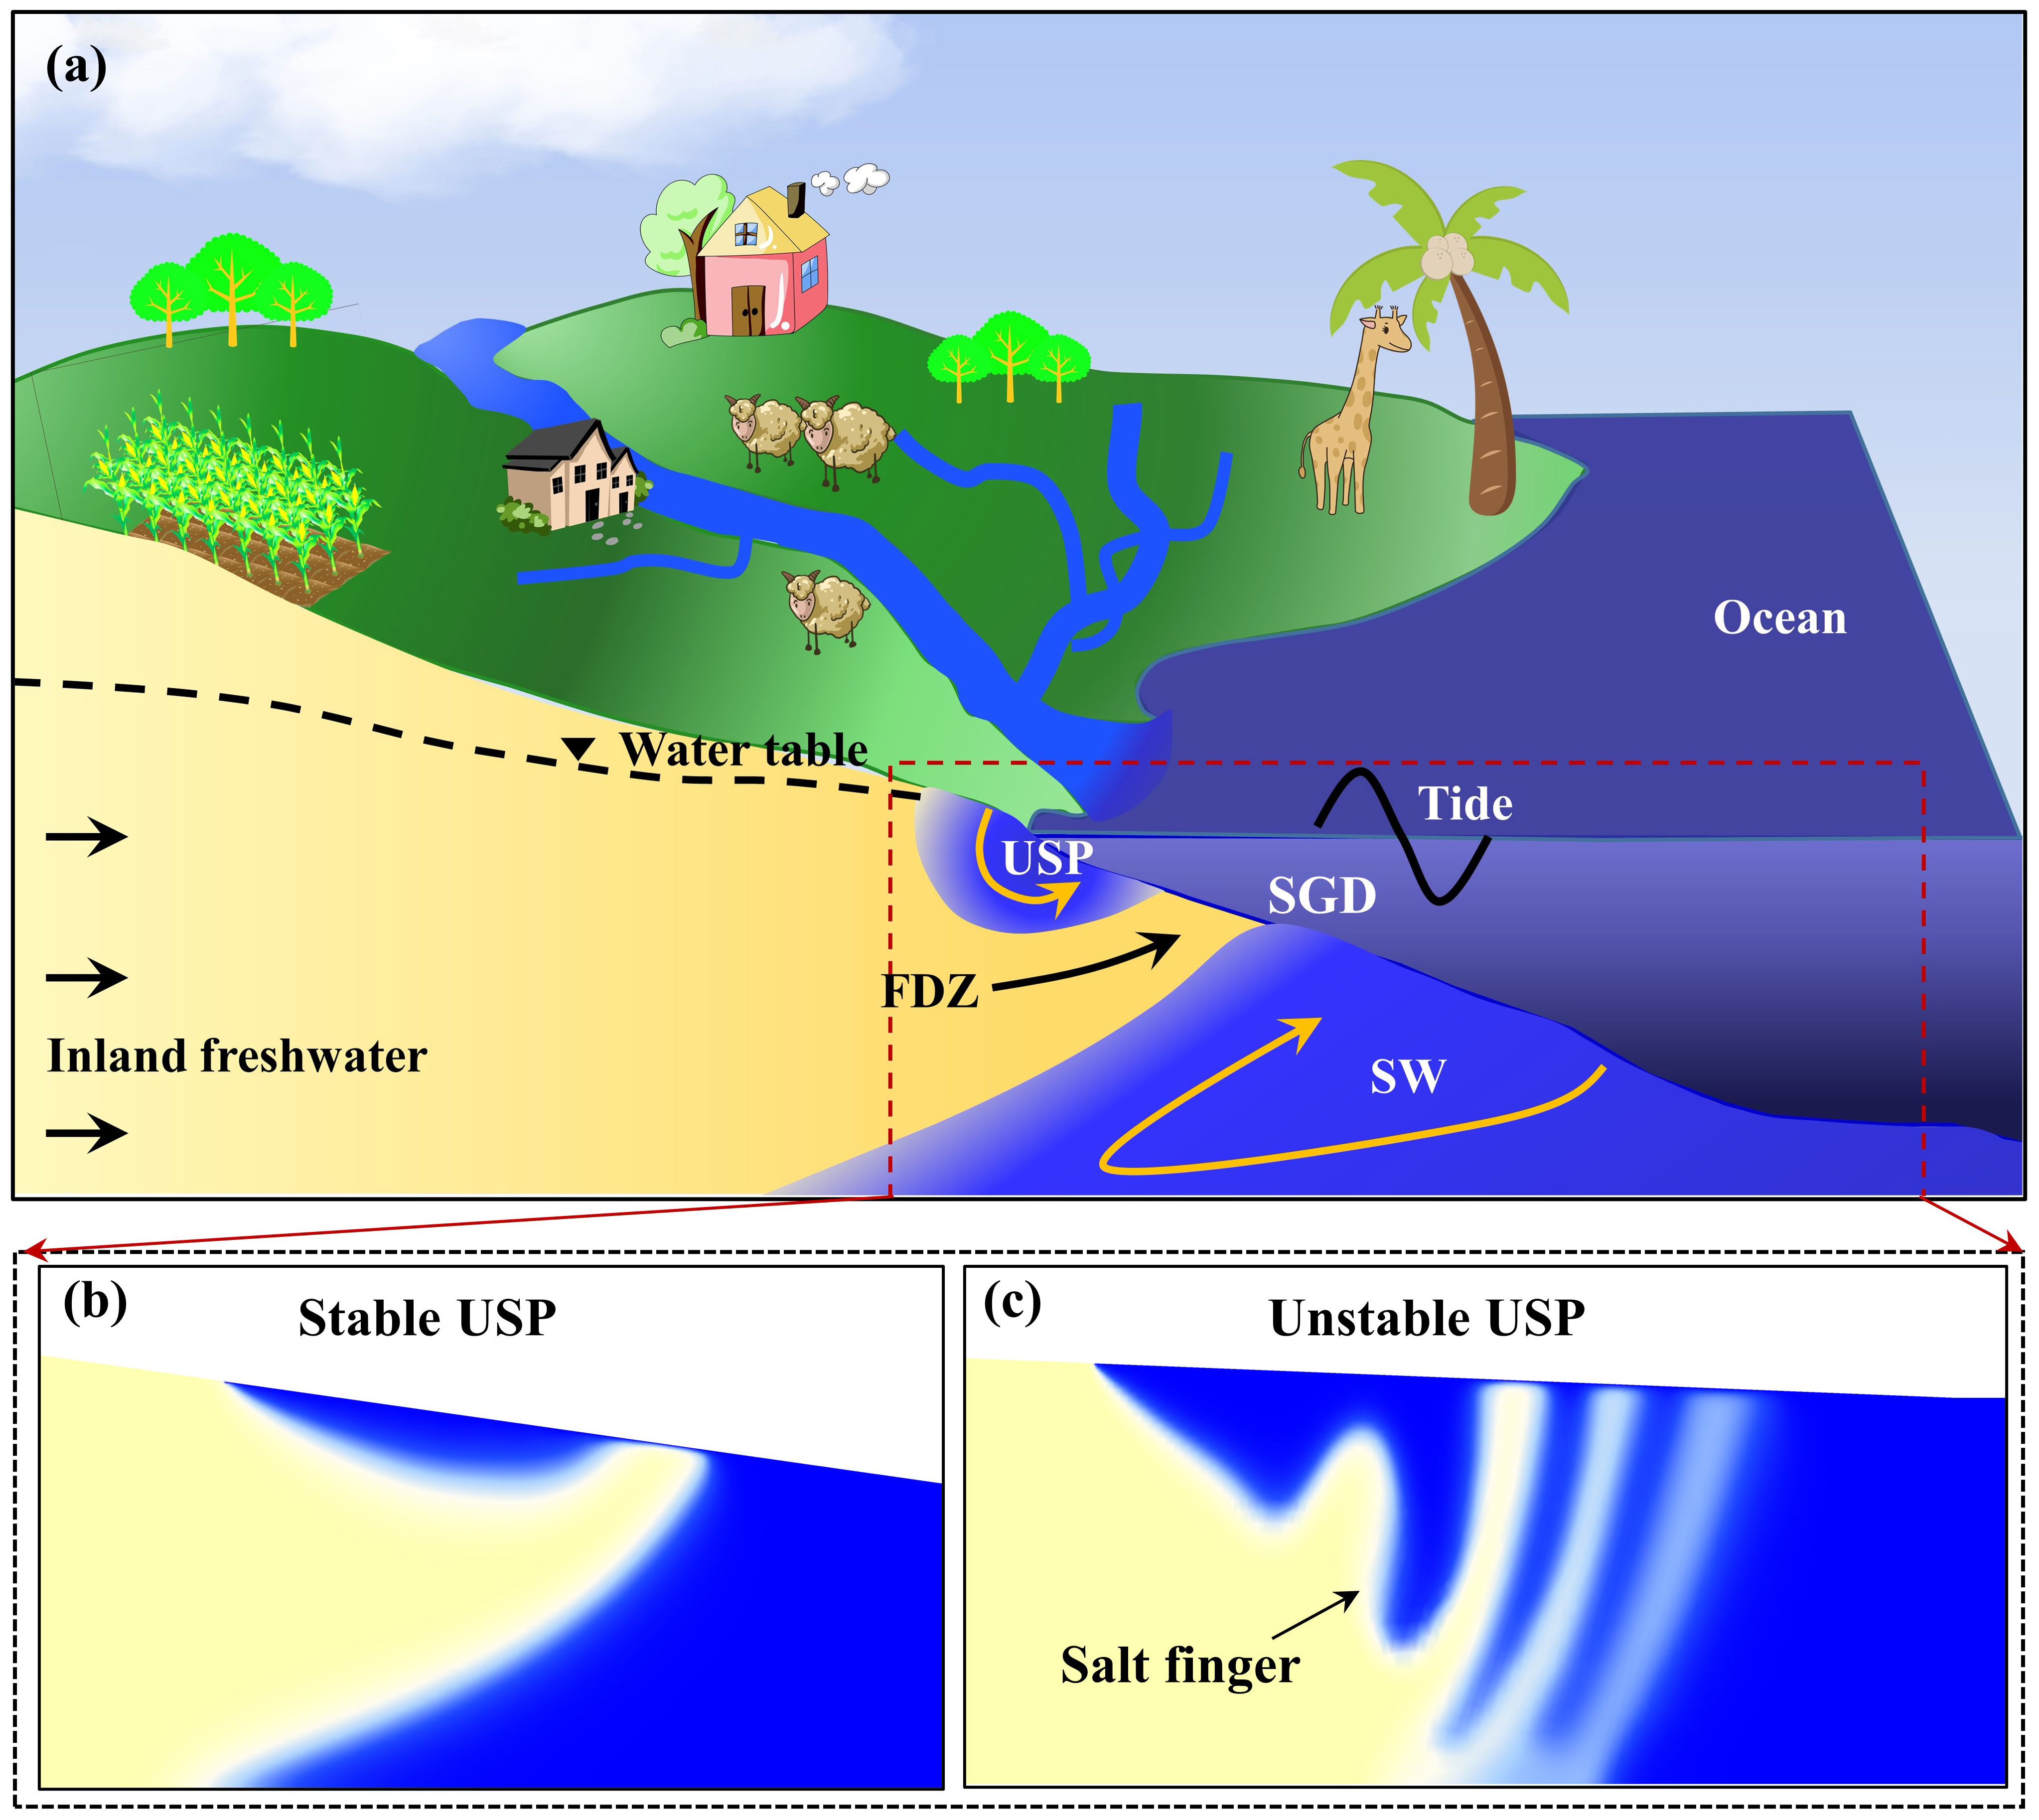
Figure 1 Schematic diagram of salinity distribution in a two-dimensional (2D) cross-shore profile of a coastal unconfined aquifer (A) with a stable (B) and unstable (C) intertidal regime. USP, upper saline plume; SW, saltwater wedge; FDZ, freshwater discharge zone.
Groundwater dynamics in the intertidal zone are governed by the hydrodynamic conditions of coastal aquifers, e.g., head difference, salinity difference, temperature difference, tide, and wave (Lu and Werner, 2013; Nguyen et al., 2020; Wu et al., 2023). Previous studies have understood the salinity distribution in the intertidal zone as a layered and stable structure, with the USP, freshwater discharge zone (FDZ), and SW followed below the tidal flats (Heiss and Michael, 2014; Zheng et al., 2022). As the hydrodynamic conditions change, the USP expands or contracts in the intertidal zone with an approximate “U” shape (Yu et al., 2019). Thus, the USP morphology and the intertidal salinity distribution are stable (Figure 1B). Certainly, there are some conditions (e.g., a high fresh groundwater flux) where the USP may not form in the intertidal zone (Evans and Wilson, 2017). The saltwater in the USP region flows above fresh groundwater, generating a reverse salinity (density) gradient. Gravity causes this structure to tend to be unstable. Greskowiak (2014); Shen et al. (2019), and Geng et al. (2020) proposed and confirmed the phenomenon of unstable USP using numerical simulations, and found that in coastal aquifers with gentle beach slopes, the unstable USP continues to generate salt fingers that subsequently possess a finger-like vertical seepage, termed as salt-fingering flow (Figure 1C). Experimental studies of Fang et al. (2021, 2022a) and Röper et al. (2015) also photographed the flow instability of salt fingers in the intertidal zone via a lab-scale sand tank. In the sandy tidal flat of Shilaoren, Jiaozhou Bay, Zhang Y. et al. (2021) and Xing et al. (2023) used electrical resistivity tomography and hydrological monitoring to successfully capture the process of unstable USP and subsequent salt-fingering flow. Therefore, the unstable USP associated with salt-fingering flow is a natural phenomenon for some coastal aquifers, which updates the conventional understanding of the salinity distribution in the intertidal zone.
Flow instability of salt fingers has a significant impact on SGD. During salt-fingering flow, the FDZ is separated by salt fingers, thus forming multiple freshwater discharge routes that changed over time. As a result, the discharge hotspot at the aquifer-sea interface is not limited to the low-tide mark (Zhang J. et al., 2021). Fang et al. (2021; 2022b) further demonstrated that the phase-averaged SGD fluxes fluctuated irregularly over time, and the fluctuation was positively correlated with the intensity of salt-fingering flow. These characteristics differ significantly from the results under the stable USP regime that the water exchanges across the aquifer-sea interface are constant with continuous tide cycles (Greskowiak, 2014). Although a growing number of studies have revealed the effect of unstable USP on the SGD fluxes, the current understanding of the movement of salt fingers remains at the stage of qualitative description and lacks quantitative characterization. Previous studies have qualitatively described the movement of salt fingers between the USP and the SW. There is little published data on the movement route and speed of salt fingers and the response of FDZ. In other words, a quantitative understanding of groundwater dynamics in the intertidal zone during salt-fingering flow is still lacking. While quantifying groundwater dynamics in the intertidal zone is a prerequisite for accurately predicting and explaining the spatiotemporal evolution of SGD fluxes. In addition, due to the timescale changes in external forcing conditions (e.g., seasonality in subsurface inflow or hydraulic gradient), the USP regime is not always stable or unstable, but experiences a dynamic transformation of stability over time (Fang et al., 2022a). However, under the dynamically stable-unstable regime, the quantitative characteristics of salt finger movement also remain unclear.
To address these issues, we conducted numerical simulations to investigate groundwater dynamics in the intertidal zone during salt-fingering flow. Specifically, the numerical model presented herein has been verified in our previous experimental study in a laboratory beach aquifer. Based on laboratory-scale simulation results, three key objectives were addressed in this study: (a) quantify the movement features of salt fingers and the response laws of FDZ; (b) examine the influence of fixed subsurface inflow with an unstable USP regime on the intertidal groundwater dynamics; and (c) reveal the influence of seasonal subsurface inflow with a dynamically stable-unstable regime on the intertidal groundwater dynamics.
Our experimental studies of Fang et al. (2021; 2022a; 2022b) have successfully confirmed the stable, unstable, and dynamically stable-unstable USP phenomena in the intertidal zone of coastal aquifers. Laboratory experiments were conducted in a well-designed sand tank with a dimension of 172.9 cm (length) × 45.0 cm (height) × 8.0 cm (width) (Figure 2). The central chamber (gray section) was filled with white quartz sand, which represents a quasi two-dimensional profile of an unconfined aquifer with a beach slope of 1/10.5. After sieving, the particle size of the quartz sand was relatively uniform (d50 = 0.6 mm; d90/d10 = 2.4), and the average hydraulic conductivity and porosity were 4.8 × 10⁻³ m/s and 0.4, respectively. The sea level fluctuated over time via a tidal generator (VHO) with a tidal amplitude of 2.2 cm and a period of 1 min. Artificial seawater was prepared by dissolving 34.5 g sodium chloride (NaCl, AR grade) and 1.5 g red food dye (Sinopharm Chemical Reagent, Co., Ltd) per liter of deionized water. Food dyes are often used in seawater tracing in the studies of groundwater-seawater interactions due to their inert relationship (adsorption and reaction) with quartz sand (Goswami and Clement, 2007).
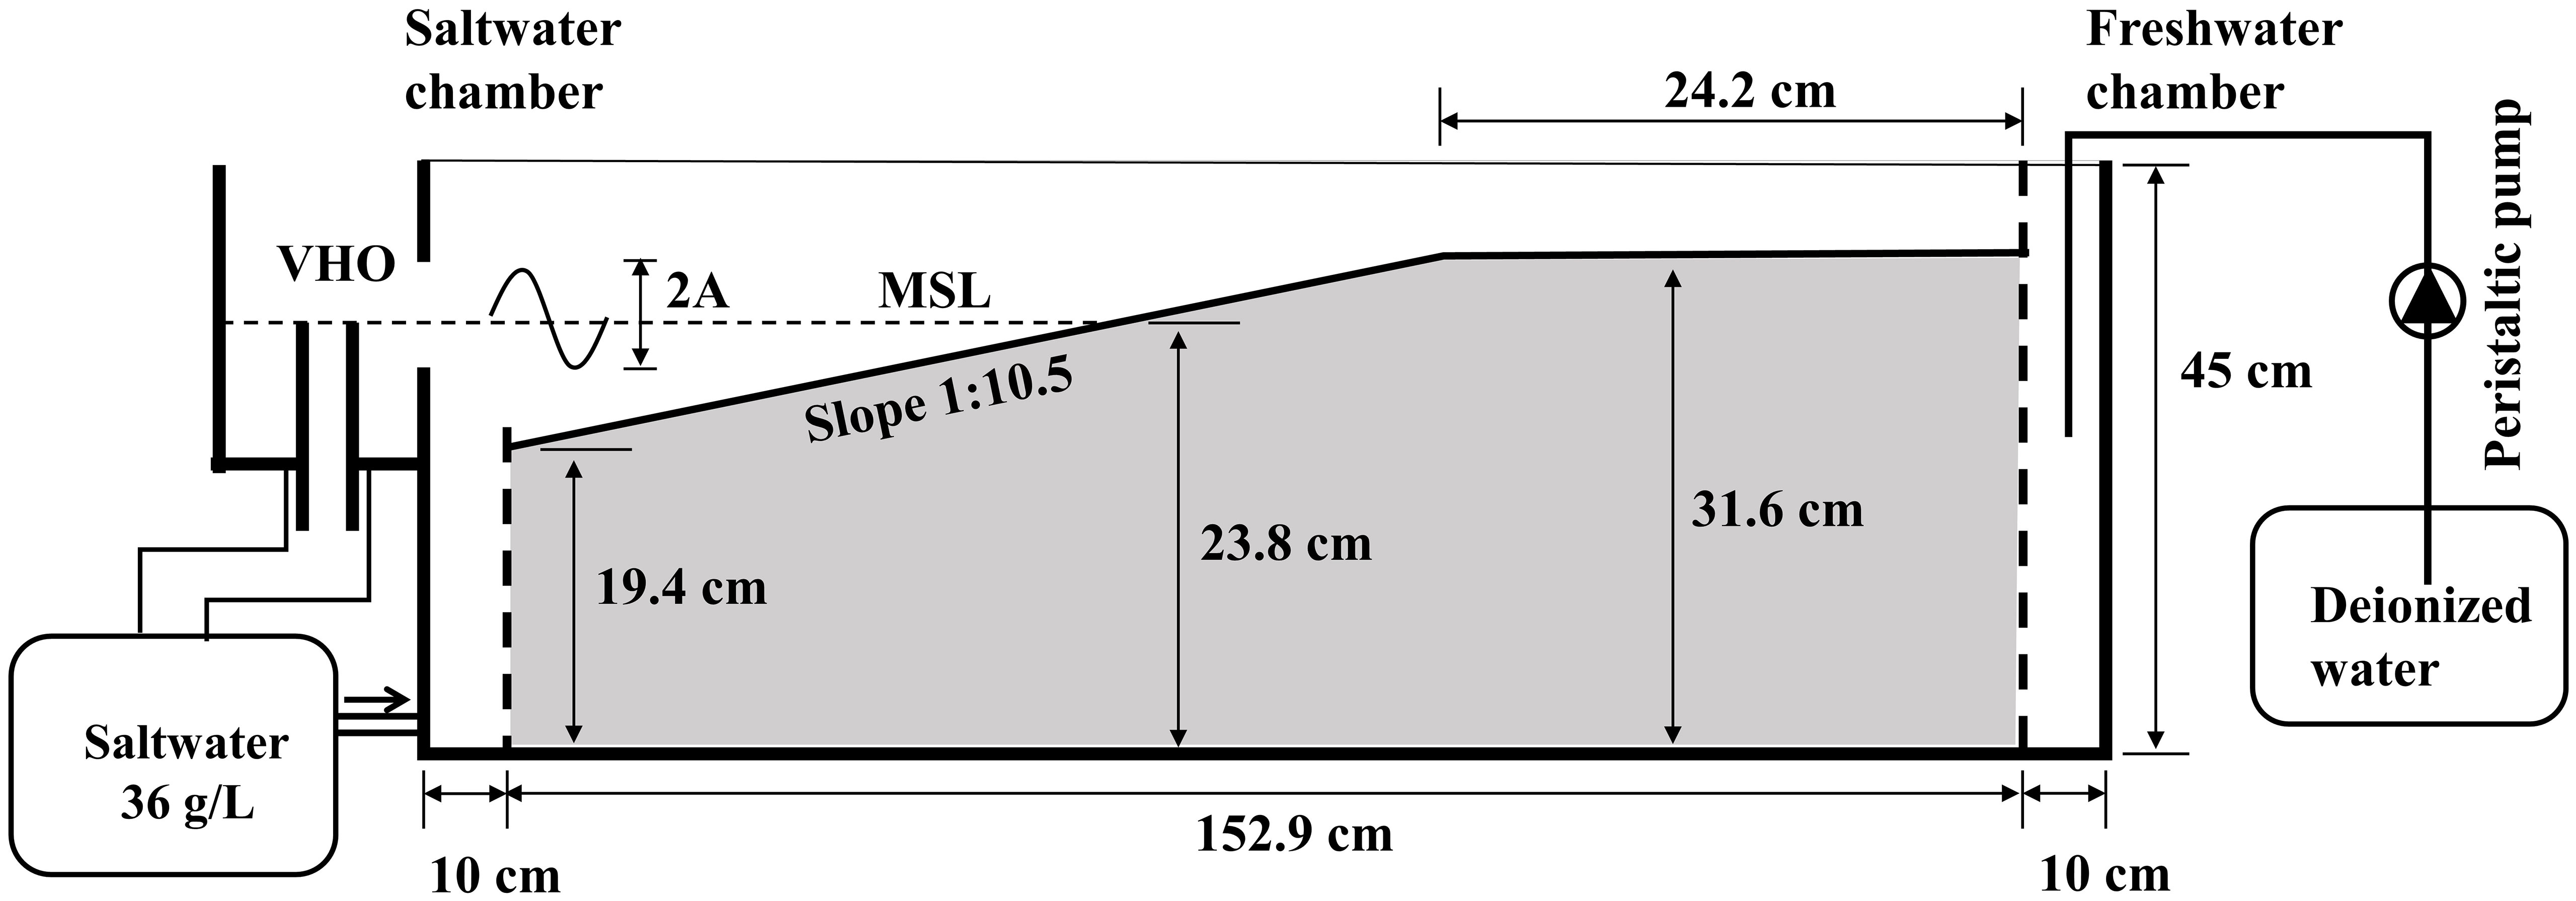
Figure 2 Schematic diagram of the experimental setup. The gray section is filled with quartz sand and represents the domain of the lab-scale numerical model. This figure is revised from Fang et al. (2022a). MSL, mean sea level.
In order to quantify groundwater dynamics in the intertidal zone, a density-dependent and variably saturated groundwater flow and solute transport program, FEFLOW, was used to numerically simulate the interactions of groundwater and seawater in the laboratory-scale aquifer. According to the setup of laboratory experiments, the following assumptions were adopted in the numerical model to simplify the problems: (a) the unconfined aquifer was homogeneous and isotropic; (b) both the fluid and the porous media were incompressible; and (c) the fluid density was only related to solute concentration. Based on these assumptions, we used the Richard’s equation and the advection-diffusion equation to govern the processes of density-dependent and variably saturated groundwater flow and solute transport (Diersch, 2014). The relationship between relative permeability, phase saturation, and capillary pressure was defined by the following functions (Van Genuchten, 1980):
where s and sr are the water saturation [-] and residual water saturation [-], respectively; a and n are the constants; ψ is the capillary pressure head [L]; kr is the relative hydraulic conductivity [-].
The domain of numerical model was designed based on the experiments, as highlighted by the gray section in Figure 2. The top and bottom boundaries of the numerical model were set to a no-flux condition. The freshwater boundary on the right was set to a given flux with the solute concentration of 0 g/L. The sea boundary on the left was defined as a tidal boundary that the sea level fluctuated over time obeying a sinusoidal function (Fang et al., 2022b). During tidal fluctuations, the model nodes above the sea level were set as a seepage face that allowed groundwater to discharge into the ocean, and the nodes below the sea level were defined as a head condition that changed with the tidal stage (Xin et al., 2015). The salt concentration at the sea boundary was 36 g/L.
The hydrogeological parameters used in the numerical simulations were consistent with those determined in laboratory experiments (Table 1). We adopted the finite element method for spatial discretization and refined the mesh in the intertidal zone. The model domain was discretized into 398136 triangles with a total number of nodes of 200165. This meshing met the criteria proposed by Kooi et al. (2000), which dedicated to free convection in groundwater environment.
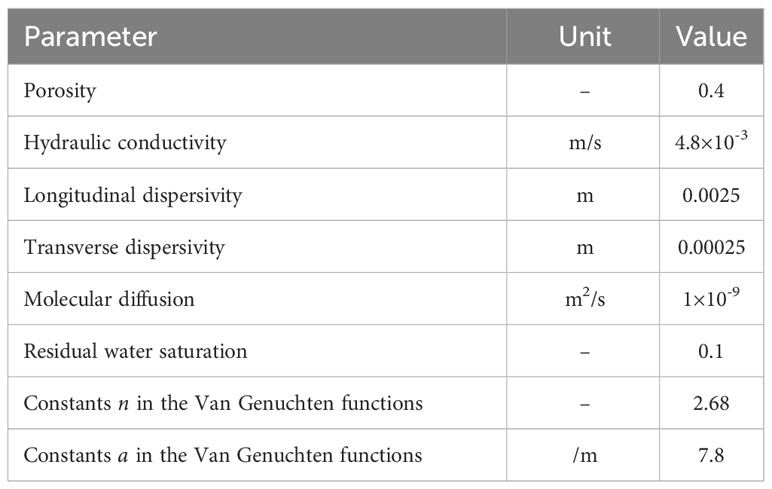
Table 1 Porous medium parameters used in the laboratory-scale numerical model.
The laboratory-scale numerical model has been verified in our previous study of Fang et al. (2022b) via a comparison of experimental and simulation results of salinity distribution under the stable, unstable, and dynamically stable-unstable regimes. In the present study, the verified model was used to quantify the characteristics of intertidal groundwater dynamics during salt-fingering flow. We first defined a base case (case F1) to reveal in detail the movement features of salt fingers and the response of FDZ and explain their internal mechanisms. The USP regime in case F1 was unstable by fixing a low freshwater influx of 0.271 m3/d/m. Next, the fixed freshwater influx was increased to 0.296 m3/d/m in case F2 under an unstable USP regime in order to examine the differences in the movement features of salt fingers. In the last trial, seasonal freshwater inflow with the same varying range of 0.323–0.271 m3/d/m was considered to generate a dynamically stable-unstable intertidal environment. As field observations by Heiss and Michael (2014) and Zhang B. et al. (2021) suggested that the monthly variation of inland groundwater level was similar to a sine or cosine cycle with a period of one year, seasonal freshwater inflow in the present study was treated as a cosine function over time. The period of seasonal influx was preset to 365 min in case S1 where intertidal groundwater dynamics under a dynamically stable-unstable regime could be quantified. In cases S2 and S3, the periods of seasonal influx were increased to 548 and 730 min, respectively, investigating the influence of the period of seasonal freshwater inflow.
The movement of salt fingers in the intertidal zone was measured by tracking transient changes in the position of the tip and middle endpoints of target finger. The trial-and-error results indicated that laboratory-scale fingers could be clearly outlined by the 0.3 isohalines for external morphology and the 0.8 isohalines for internal morphology. The deepest fronts of the external and internal profiles were defined as the tip and middle endpoints of target finger, respectively. Thus the horizontal (V_x) and vertical (V_z) speed of the finger endpoints can be expressed as:
where F (x, z) is the coordinate of finger endpoint [L] and t is the time [T]. For ease of understanding, we specified that salt finger moved toward the sea in the horizontal direction and down in the vertical direction with a positive speed, and a negative value was defined in the opposite direction. The measurement of finger speeds at the tip endpoint (TV_x and TV_z) and the middle endpoint (MV_x and MV_z) further investigated the speed differences at different positions during salt finger movement. The difference between the time when finger endpoints appeared and disappeared in the aquifer was defined as the duration time of a single salt finger. During salt-fingering flow, the salinity distribution in the intertidal zone would possess a responsive change. The change in the USP salt volume was measured by the USP salt mass, and the change in the FDZ was quantified by the indexes of the width of FDZ at the aquifer-sea interface and the flux of fresh groundwater discharge.
Numerical results of salinity distribution in case F1 with an unstable USP regime are shown in Figure 3A. The solid and dashed white lines represented the 0.3 and 0.8 isohalines, respectively, which clearly outlined the shape of the tip and middle of the salt finger. As observed in the study of Fang et al. (2021), salt fingers were repeatedly generated and detached from the USP region, which included the process of the development, separation, and mergence. Figure 3A shows a snippet of this cyclic process. Salt fingers occurred in the lower part of the USP, that is, between the mid-tide mark and the low-tide mark. To quantify the movement characteristics of salt fingers, a complete trajectory of the tip and middle endpoints of the finger is recorded in Figure 3B. The cross marks represented the position of the tip and middle endpoints of the salt finger at the moment of Figure 3A. A continuous animation of salt-fingering flow with slow motion is shown in Supplementary Material Video 1 as an auxiliary illustration. As shown in Figure 3B, salt finger movement was concentrated in the region between the mid-tide mark and the low-tide mark. The middle endpoints of the salt finger were closer to the low-tide mark at the same moment than the tip endpoints. The duration of a salt finger movement cycle was 28 min. The salt finger always moved horizontally toward the sea, but in the vertical direction, the salt finger first moved slightly downward and then continued upward. These caused the entire trajectory of the salt finger to move closer to the low-tide mark, and eventually the salt finger also disappeared near the low-tide mark. The reasons for the change in the movement direction of the salt finger were described in the next paragraph below.
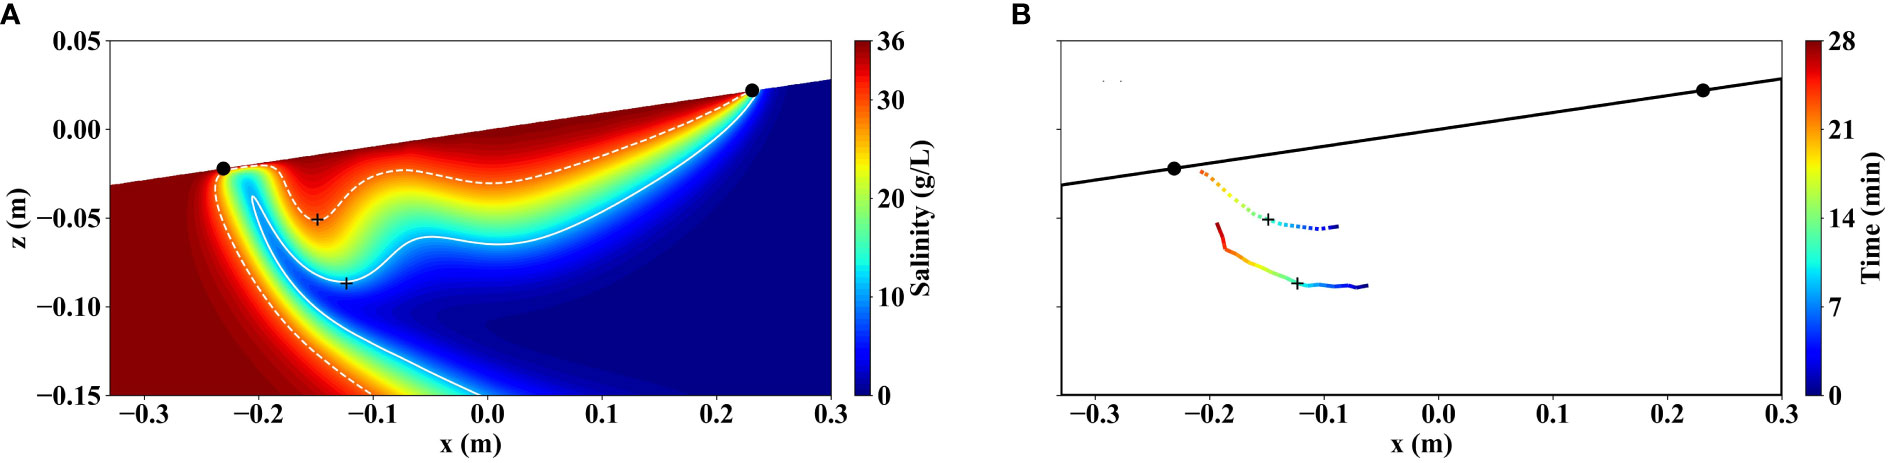
Figure 3 Simulated salinity distribution (A) and trajectory of salt finger movement (B) in case F1 with an unstable USP regime. The black circle indicates the range of the intertidal zone, and the plus sign represents the salt finger endpoint.
The movement speed of the finger middle and tip endpoints, including the horizontal and vertical components, is shown in Figure 4. It should be noted that in this study we defined the salt fingers moving toward the sea and downward at a positive speed. The speed of the middle and tip of the salt finger possessed a similar trend. Horizontally, the finger speed was positive, indicating the movement toward the sea, and the speed value first increased, then remained unchanged, and finally decreased. In the vertical direction, the positive speed of salt finger decreased first, indicating the movement downward. The finger speed was then negative and the absolute value increased, which revealed the upward movement of the finger with an increasing speed. In addition to the influence of the gravity, the movement of salt fingers was also affected by ambient freshwater flow in the FDZ (Fang et al., 2021). Figure 5 shows the salinity distribution and groundwater flow field in the intertidal zone at different times of Figure 4. The middle and right panels indicate the scalar magnitude of the horizontal and vertical components of flow velocity, respectively. Driven by the inland hydraulic gradient, fresh groundwater in the FDZ was discharged toward the sea, but there was an upward component of flow velocity of freshwater near the lower part of the USP. In this study, salt fingers formed below the middle-tide mark, and the initial infiltration direction of gravity-induced finger flow was also downward, which has been widely confirmed in the Elder problem (Xie et al., 2011; Xie et al., 2012). Thus, the salt finger first penetrated downward in the vertical direction in Figures 3, 4. The upward discharge of fresh groundwater in the FDZ region then pushed the finger upwards.
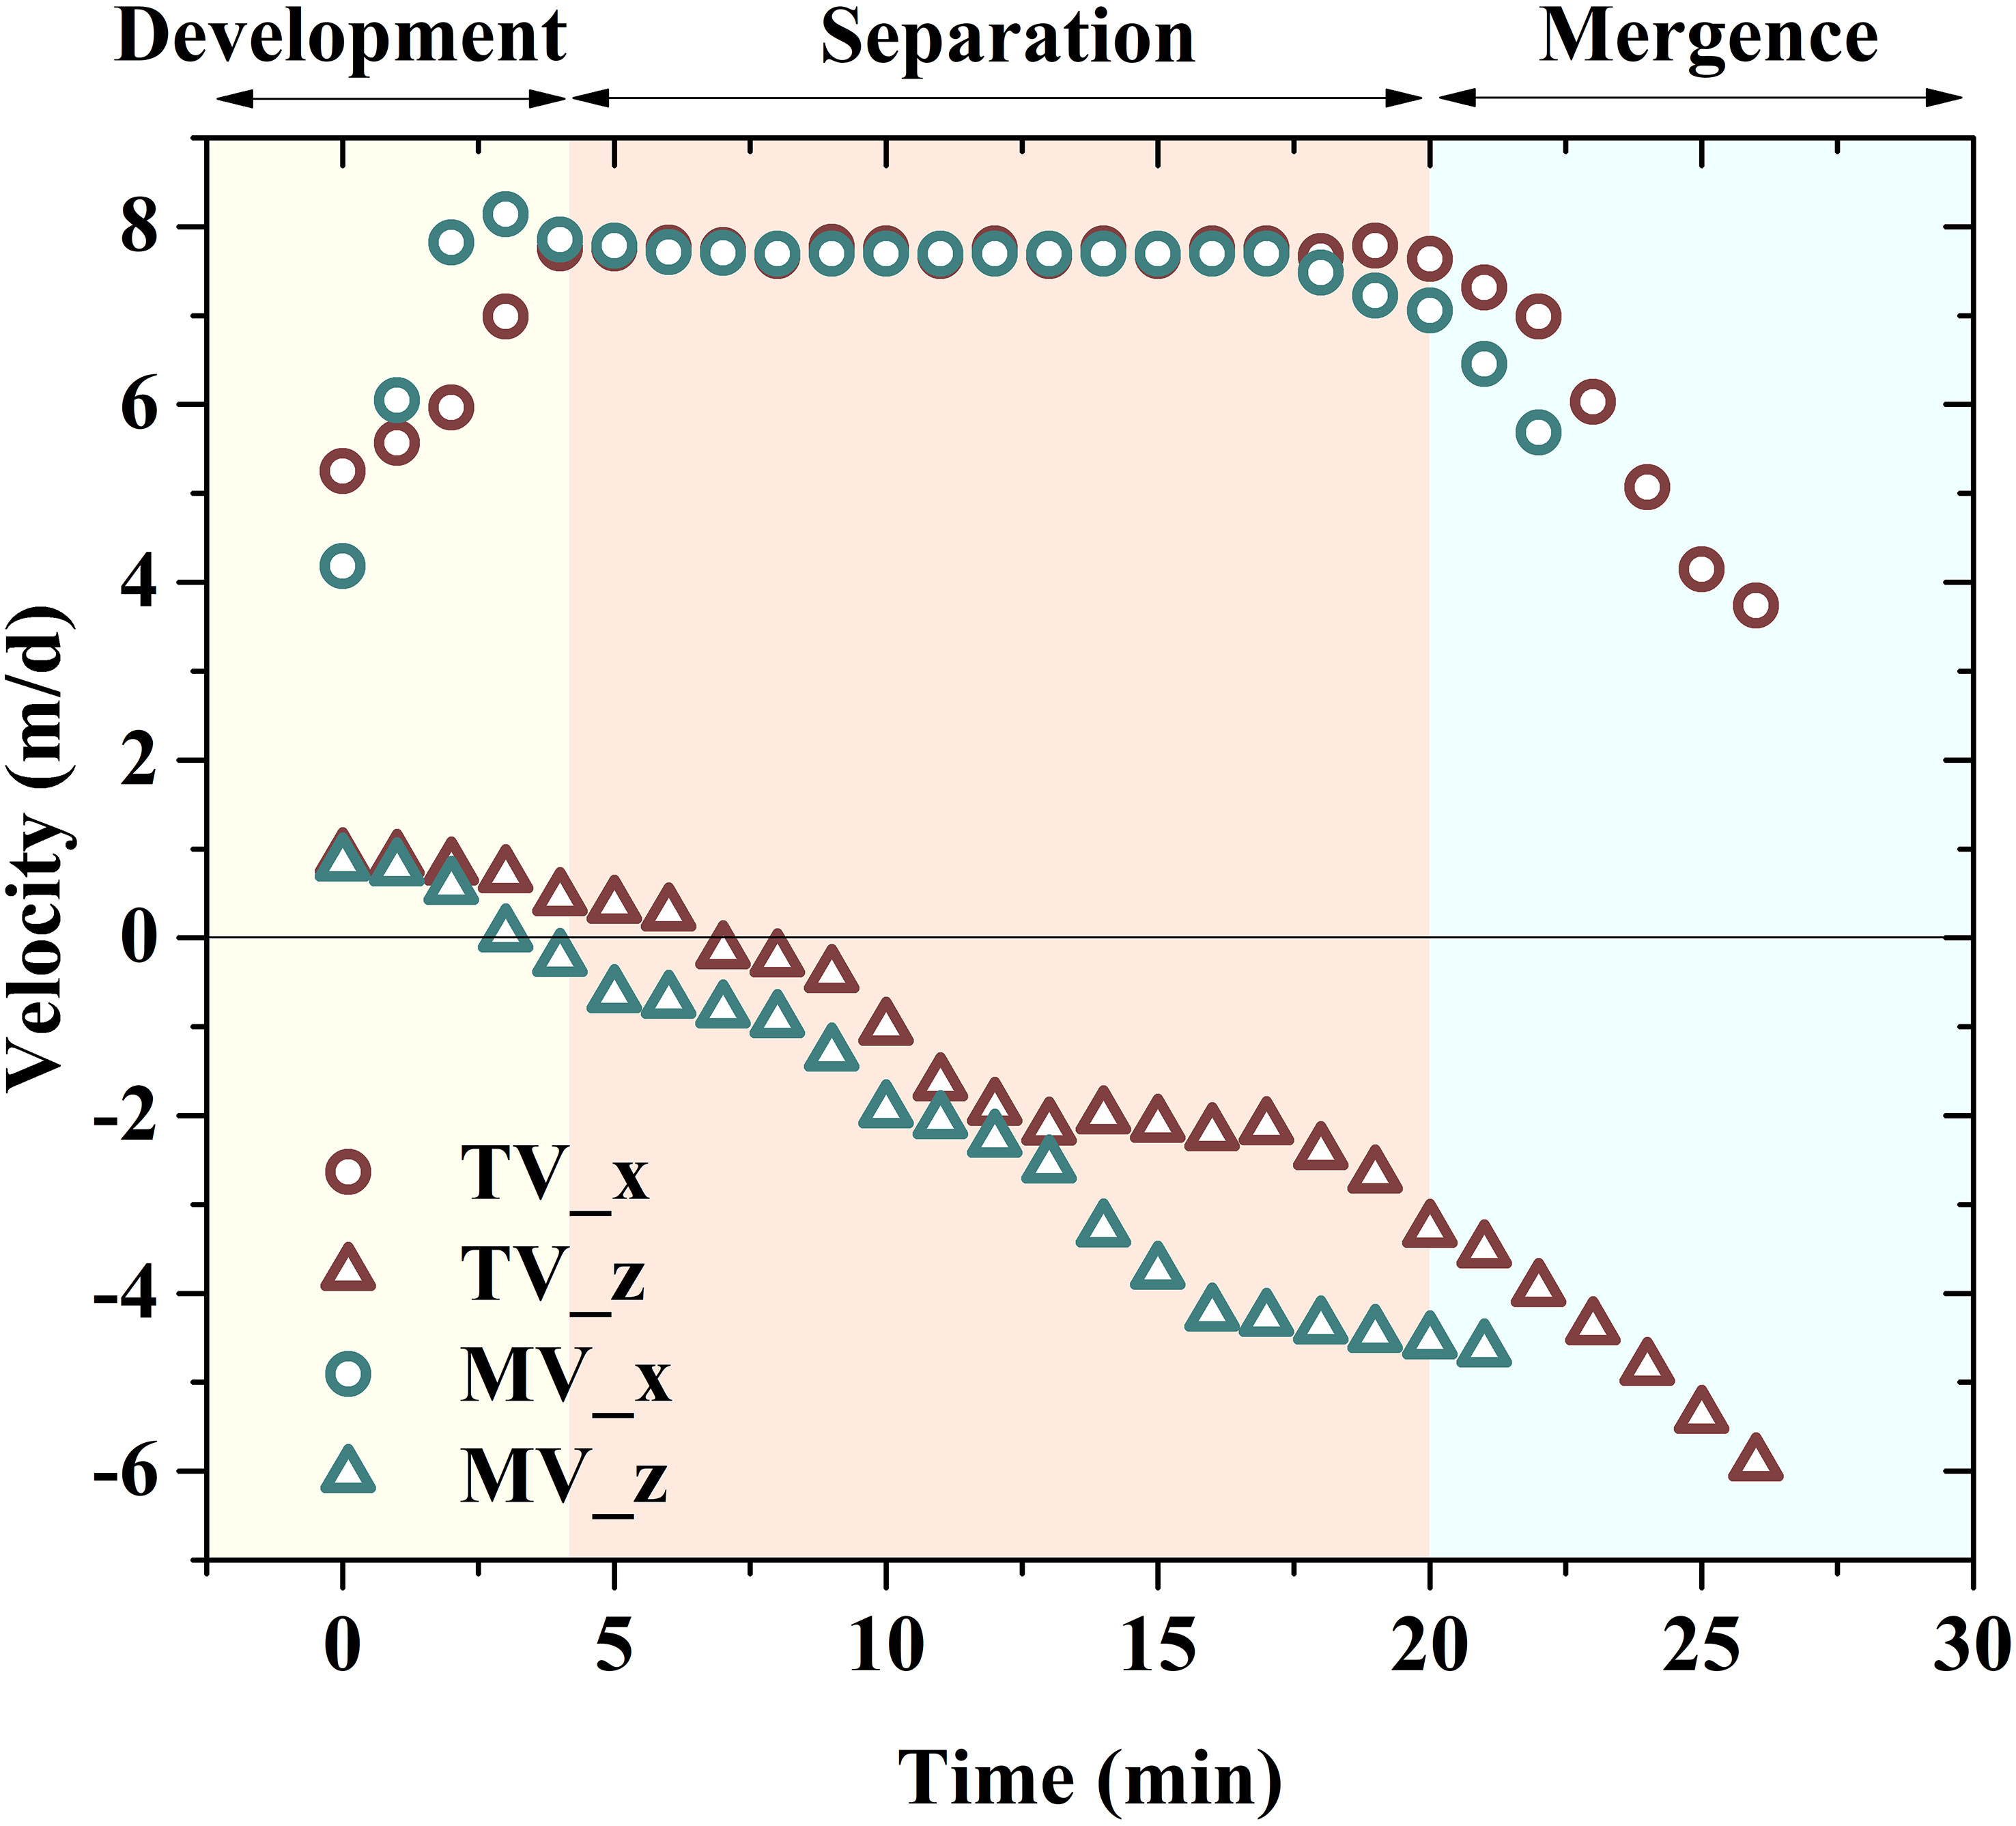
Figure 4 Movement speed of salt finger measured by the tip (TV) and middle (MV) endpoints, including the horizontal (x) and vertical (z) components. The movement process of salt finger consists of three stages: development, separation, and mergence.
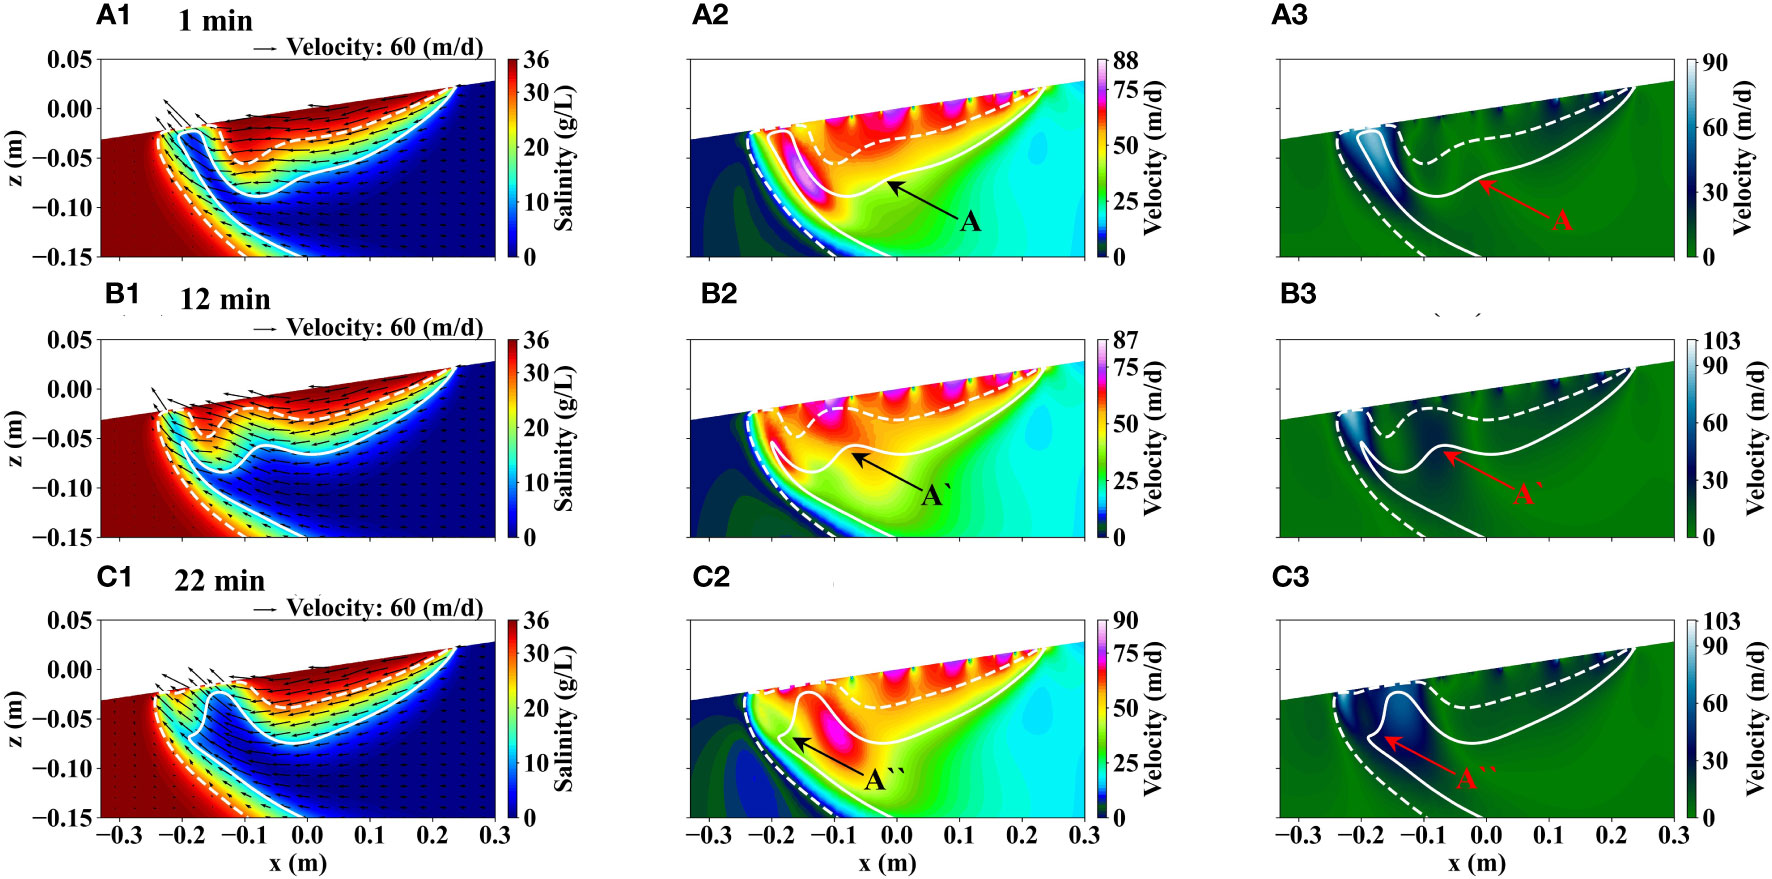
Figure 5 Salinity distribution and groundwater flow field in the intertidal zone during salt-fingering flow. The middle and right panels indicate the scalar magnitude of the horizontal and vertical components of flow velocity, respectively.
The movement speed of salt fingers was closely related to the ambient flow of fresh groundwater. The middle panel of Figure 5 indicates the horizontal flow velocity of inland freshwater driving the movement of the salt finger, highlighted by the “A” marker. At 12 min, the horizontal velocity in region A` was fast with a value of 50 m/d, while at the time of 1 min and 22 min, the horizontal velocity in region A and A`` decreased to about 30 m/d. This explained the trend of horizontal movement speed of the salt finger in Figure 4 (first increasing, then constant, and finally decreasing). At the development stage of salt fingers (0–5 min), the horizontal flow velocity of freshwater in region A was low, and thus, a small driving force resulted in a slow movement of salt fingers in the horizontal direction. The horizontal velocity of freshwater in region A` was high at the separation stage (5–20 min), and the increased driving force induced a rapid horizonal movement of salt fingers. At the mergence stage (20–28 min), individual salt finger merged with the SW, and the horizontal velocity of freshwater in region A`` near the residual finger was relatively small, which caused a slow movement of the finger in the horizontal direction. The vertical flow velocity of groundwater in the intertidal region is presented in the right panel of Figure 5. The vertical flow velocity of freshwater in region A increased over time (Figures 5A3–C3), and the increased driving force led to an accelerated upward movement of salt fingers (Figure 4).
Figure 6 records the changes in the USP salt mass (including separated salt fingers), the width of FDZ at the aquifer-sea interface, and the flux of fresh groundwater discharge during salt-fingering flow. For convenience, the time in Figure 6 is the relative time with the simulated time T1 as the reference. The shaded part is the corresponding time in Figures 3, 4. The width of FDZ and the flux of fresh groundwater discharge fluctuated over time, which was significantly different from the result (constant with continuous tidal cycles) in a stable USP regime (Kuan et al., 2012). The variation trends of the FDZ width and fresh groundwater discharge possessed a well agreement, suggesting that the width of FDZ at the aquifer-sea interface can be used as an indicator of fresh groundwater discharge, even in an unstable regime, to provide a basis for field monitoring. The salt mass in the USP also fluctuated over time, and the fluctuation trend was opposite to those of the FDZ width and fresh groundwater discharge with a time delay. There was a causal relationship between the USP salt mass, the movement of salt fingers, and the FDZ width. During the period of 0–a, the USP salt mass increased with an increased gravity, thus providing the potential for salt-fingering flow. This period corresponded to the development stage of salt fingers in Figure 4. The finger development compressed the space between the middle-tide mark and the low-tide mark, which led to a decrease in the width of FDZ. After the moment a, salt finger movement was in the separation stage, and the USP salt mass reduced. The separation of salt finger further compressed the FDZ region, and the width of FDZ decreased. The finger was located in the middle between the USP and SW (Figure 5B1) at the time b, and the width of FDZ was minimal. After the moment b, the finger continued to move toward the SW, and the FDZ region between the finger and the USP increased, resulting in an increase in the width of FDZ at the aquifer-sea interface. The salt finger began to enter the mergence stage (Figure 5C1) at the moment c, and the USP salt mass was minimal. After that, the total salt mass of the USP rose as the salt mass of the main part of the USP increased (laying the foundation for the development of the next salt finger). At the moment d, the salt finger disappeared in the intertidal zone, and the width of FDZ was maximum. After the d moment, the expansion of USP associated with an increase in salt mass provided a potential for the next finger, which caused the FDZ space to be compressed and decreased the width of FDZ at the aquifer-sea interface again.
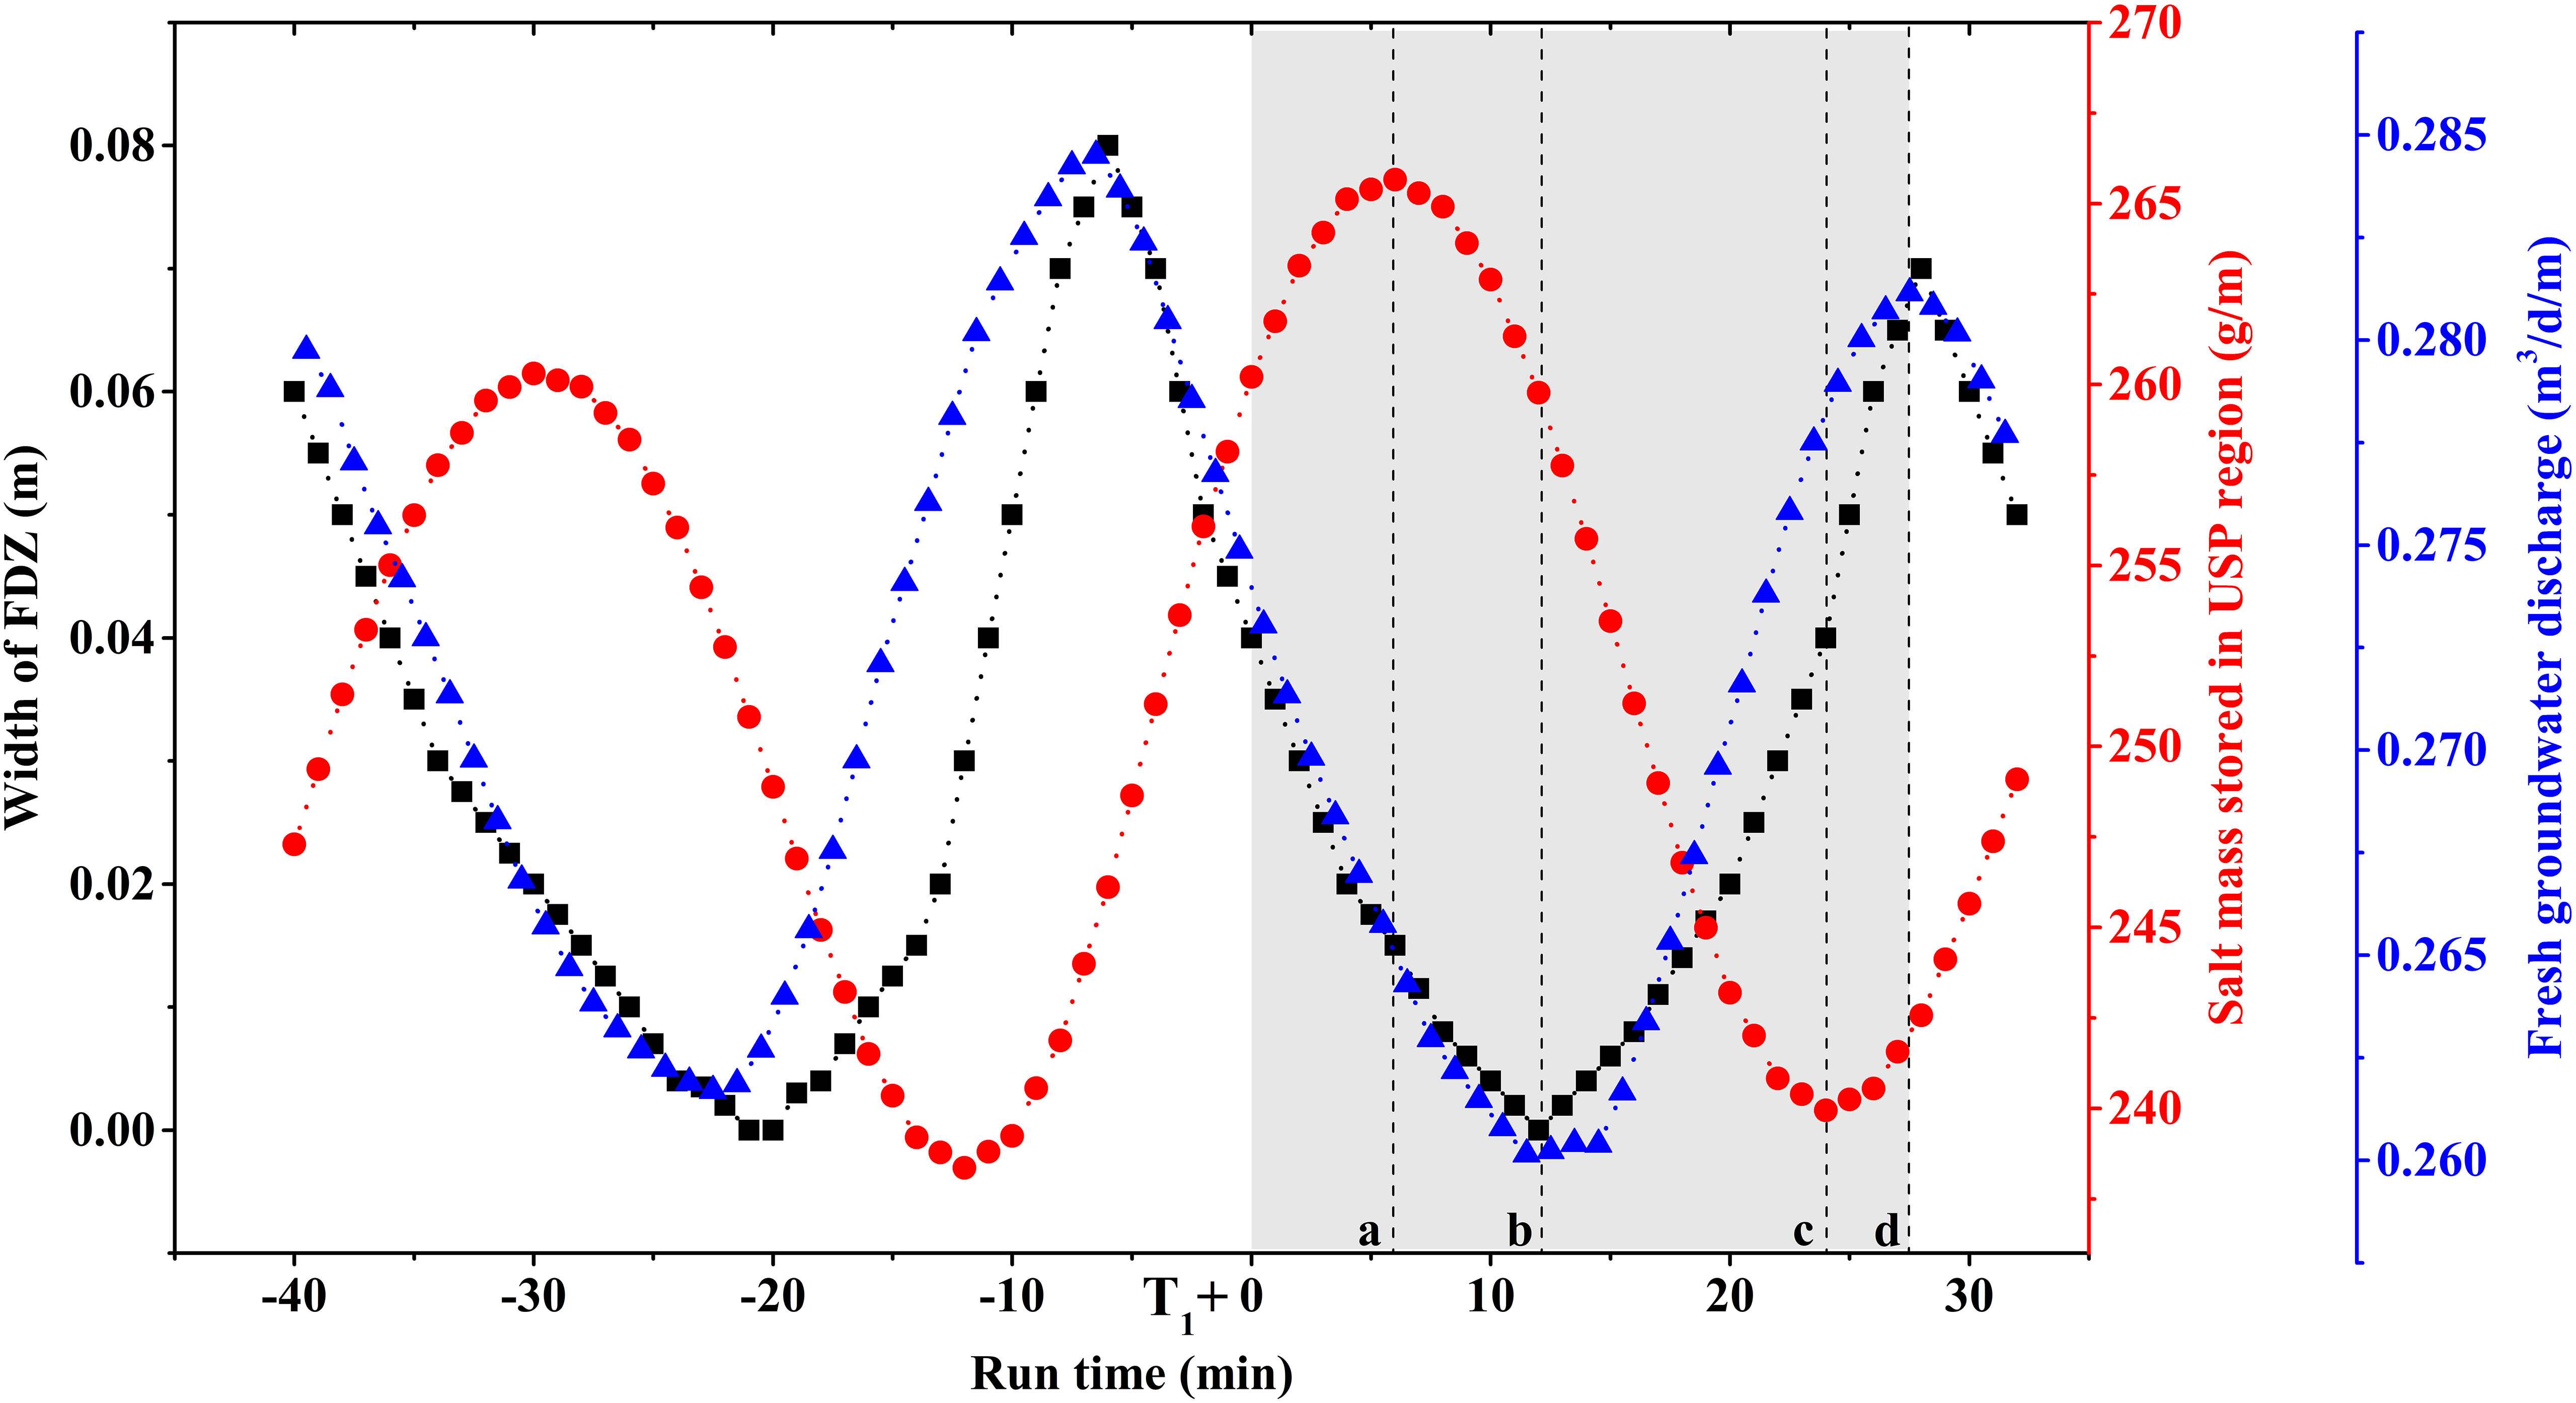
Figure 6 Temporal variation of the USP salt mass (including separated salt fingers), the width of FDZ at the aquifer-sea interface, and the flux of fresh groundwater discharge during salt-fingering flow. The shaded part is the corresponding time in Figures 3, 4.
The changes in subsurface freshwater inflow can break the balance between tidal forces and inland hydraulic gradients, and thus induce the expansion or constriction of the USP in the intertidal zone, altering the potential for salt-fingering flow (Fang et al., 2021). Figure 7 shows the temporal data of the movement trajectory and speed of salt finger under an increased freshwater influx in case F2. The trajectories of the finger tip and middle are indicated by B and B’, respectively. For comparison, the trajectory under a small freshwater influx in case F1 as shown in Figure 3B is also presented and represented by A and A’. As shown in Figure 7A, the vertical infiltration depth of the finger decreased with an increase in fixed freshwater inflows, due to the reduced potential of salt-fingering flow. This led to a shrinkage of the movement range of salt fingers in the intertidal zone under an increased freshwater influx condition, and the location where the finger disappeared at the aquifer-sea interface was far from the low-tide mark. In addition, the period of salt finger movement was 20 min in case F2, which is also less than 28 min in case F1 with a small freshwater inflow.
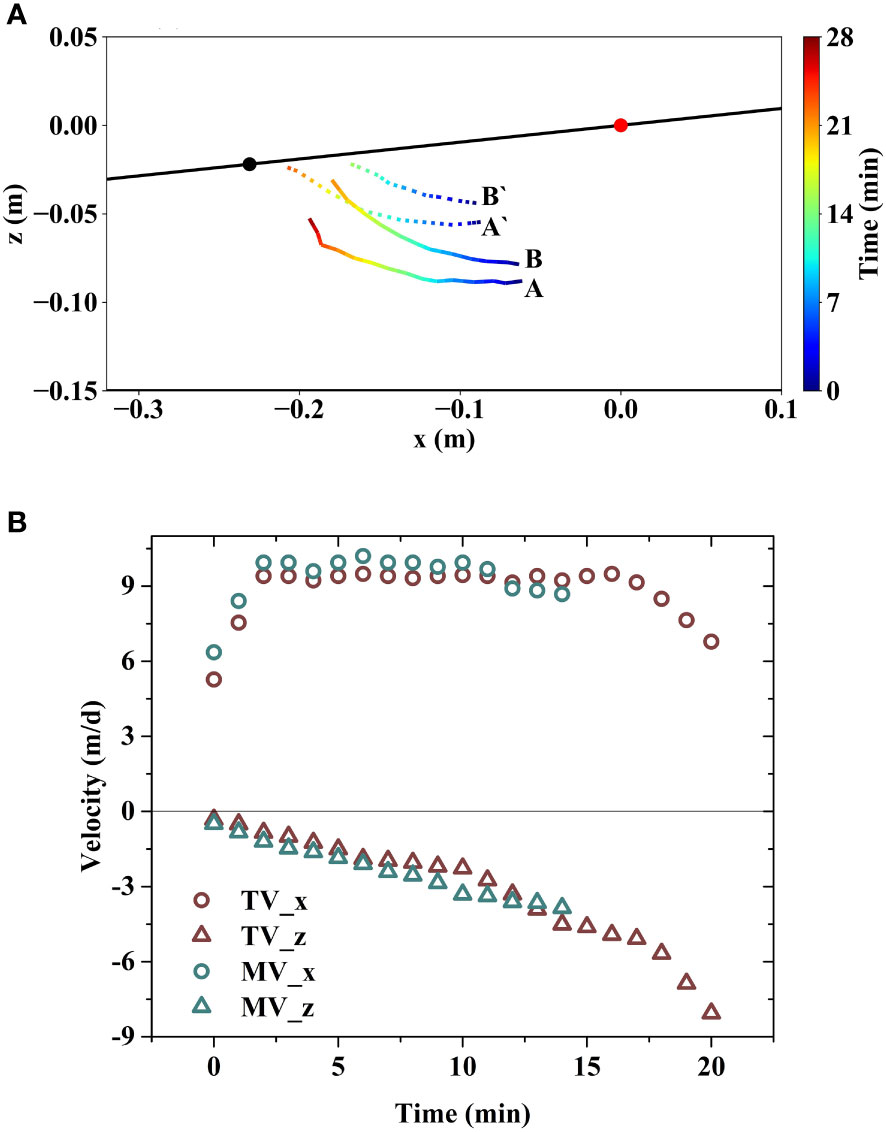
Figure 7 Movement trajectory (A) and speed (B) of salt finger under an increased freshwater influx of 0.296 m3/d/m. The trajectories of the finger tip and middle are indicated by B and B’, respectively. For comparison, the trajectory under a small freshwater influx of 0.271 m3/d/m is also presented and represented by A and A’. The black and red circles indicate the low and middle tide marks, respectively.
The variation trend of the movement speed of salt finger in case F2 (Figure 7B) was basically consistent with that in case F1 with a small freshwater inflow as shown in Figure 4. However, there were also some differences in the movement speed under different freshwater inflows. The horizontal speed of the salt finger was about 9.5 m/d at the separation stage, which was greater than 8.1 m/d in case F1. The maximum value of the vertical speed was 8.5 m/d, faster than the result of 6 m/d in case F1. In the vertical direction, the continuous upward movement of the finger was accompanied by a negative speed. The average results of groundwater dynamics in the intertidal zone under different freshwater inflows are listed in Table 2. As inland freshwater influxes increased, the mean width of FDZ and the mean flux of fresh groundwater discharge increased, and the mean salt mass of USP decreased. Since the freshwater velocity in the FDZ region near the low-tide mark was facing upward and seaward, the increased freshwater discharge not only limited the downward infiltration of the salt finger, but also accelerated the horizontal and vertical movement of the salt finger to disappear in the low-tide mark. So, in Table 2, the average speed of the finger tip and middle in case F2 increased compared to the results in case F1 with a small freshwater inflow. In general, increased freshwater inflows compressed the active space of the salt finger, accelerated its movement speed, and ultimately led to a decrease in the duration time in the intertidal zone. These findings highlighted the significant impact of fixed freshwater inflows on the movement characteristics (trajectory, speed, and residence time) of salt fingers. In real-world aquifers, both tidal amplitudes and inland freshwater inputs vary instantaneously over time, which continues to change the hydrodynamic conditions of the intertidal zone and the potential of subsequent salt-fingering flow. Under these transient hydrodynamic conditions, the movement characteristics of salt-fingering flow may differ from the above findings of the fixed cases.
Table 2 Average results of groundwater dynamics in the intertidal zone under different freshwater inflows.
Figure 8 measures the temporal results of the finger speed, width of FDZ at the aquifer-sea interface, fresh groundwater discharge, and USP salt mass under the condition of seasonal subsurface inflow. The seasonal influx varied between 0.323–0.271 m3/d/m with a period of 365 min, and it should be noted that the USP regime was stable when the freshwater inflow was fixed at 0.323 m3/d/m. As shown in Figure 8B, the evolution trend of the horizontal and vertical speeds of salt fingers in an individual finger cycle was basically consistent with that in the fixed cases. The duration time of salt finger movement in an individual cycle was relatively short, with an average value of 17.49 min. Except for the complete salt finger movement at the time of 250 min, the mergence stage was absent for other finger cycles. That is, before reaching the SW, the salt finger had already flowed out of the intertidal zone. The variation in the width of FDZ is also shown in Figure 8B. Consistent with the results of the fixed cases (Figure 6), the time of salt finger movement was around the time when the width of FDZ was minimal. The evolution trend of the width of FDZ was consistent with that of fresh groundwater discharge and opposite to that of the USP salt mass with a certain delay (Figure 8C).
Figure 8 Temporal characteristics of the finger speed, width of FDZ at the aquifer-sea interface (B), fresh groundwater discharge, and the USP salt mass (C) under the condition of seasonal subsurface inflow (A). In (A), the seasonal influx varies between 0.323–0.271 m3/d/m with a period of 365 min.
During the circulation of the variation in the USP salt mass and the width of FDZ, not every cycle possessed a salt-fingering flow as shown in Figure 8. For example, there was no salt finger movement at 60 min. In addition, the duration time of salt-fingering flow was also inconsistent in the cycles where salt finger occurred. For example, the duration time was 27 min at the run time of about 250 min, while the duration time was 9 min at the run time of about 210 min. This indicated that the intensity of salt-fingering flow varied over time under the condition of seasonal freshwater inflow.
In addition to gravity induced by the density difference, Fang et al. (2022b) found that the fluctuations of USP interface caused by seasonal freshwater inflow could generate interface perturbation and thus triggered the onset of salt-fingering flow. The effect of interface perturbation has been confirmed and identified as a critical driver in other free- and mixed-convection systems (Schincariol et al., 1997; Simmons and Narayan, 1997). In this section, we quantified the interface perturbation in each cycle by measuring the maximum difference in the USP salt mass, e.g., the difference between the time a and c in Figure 6. Similarly, the responsive change in the width of FDZ in each cycle was measured by its maximum difference, as calculated between the time b and d in Figure 6. The quantitative results of the duration time of salt fingers, the maximum difference in the width of FDZ, and the maximum difference in the USP salt mass in each cycle over one 365 min seasonal influxes are presented in Figure 9. In the cycle where salt-fingering flow occurs, the differences in the FDZ width and the USP salt mass are highlighted by the red color. The differences in the FDZ width during the finger cycles were greater than those in the no finger cycles. As the duration of salt finger movement increased with the enhanced salt-fingering flow, the difference in the FDZ width increased. Thus, the difference in the FDZ width in the cycle can be termed as a positive response to the intensity of salt-fingering flow. The duration of salt-fingering flow was related to subsurface freshwater inflow and the difference in the USP salt mass. At the time of 24 min, the seasonal influx of 0.320 m3/d/m was high with a strong resistance for salt-finger flow, and the fixed case with the same flux was stable for the intertidal environment. However, salt-fingering flow in the seasonal case was generated at this moment because of the powerful interface perturbation with the difference in the USP salt mass of 20 g/m (Figure 9). Although the seasonal influx was decreased with a decreasing resistance at the time of 60 min and 80 min, flow instability did not occur at these moments, due to a decreased in the difference in the USP salt mass illustrating a weak interface perturbation (Fang et al., 2022b). At the time of 200 min, notwithstanding the difference in the USP salt mass of 12 g/m was close to that at the time of 60 min, the reduction of seasonal influx associated with a decreasing resistance resulted in the onset of flow instability. The longest duration of salt fingers accompanied with the maximum intensity of flow instability was recorded at the time of 245 min due to the largest difference in the USP salt mass and a small seasonal influx, which led to a largest difference in the width of FDZ at the aquifer-sea interface.
Figure 9 Quantitative results of the duration time of salt fingers, the maximum difference in the width of FDZ, and the maximum difference in the USP salt mass in each cycle over one 365 min seasonal influxes. In the cycle where salt-fingering flow occurs, the differences in the FDZ width and the USP salt mass are highlighted by the red color. The seasonal variation of subsurface freshwater inflow is indicated by a solid blue line, corresponding to the right coordinate.
Temporal changes in seasonal freshwater inflow can cause additional interface perturbation and affect the occurrence of salt-fingering flow. The period of seasonal freshwater inflow determines the variation frequency of interface perturbation, thus affecting the movement characteristics of salt fingers. Under the same fluctuation range, the period of seasonal influx increased from 365 min to 548 min and 730 min, and the comparisons of the movement speed of salt fingers and the duration time are shown in Figure 10. Figure 10A counts the mean and range of the finger speed in the horizontal and vertical directions. Under different periods, the mean and extreme values of the finger speed were basically the same. The mean duration of salt fingers decreased slightly with the increase of freshwater periods (Figure 10B). Because the reduced frequency of freshwater inflow led to a decrease in interface perturbation for the intertidal environment, resulting in a decrease in the intensity of salt-fingering flow (Fang et al., 2022b). This contributed to a reduce in the proportion of the duration time of salt finger movement to the freshwater period as the period increased.
Figure 10 Comparisons of the movement speed (A) of salt fingers and the duration time (B) under different seasonal freshwater periods. In (A), the mean and range (extremum values) of the finger speed in the horizontal and vertical directions are displayed. In (B), the column chart corresponds to the left coordinate, and the scatter plot corresponds to the right coordinate.
Under the influence of salt-fingering flow, the FDZ in the intertidal zone and the discharge position at the aquifer-sea interface continue to change over time, which makes trouble for field monitoring of SGD. This study found that the variation trends of the FDZ width at the aquifer-sea interface and fresh SGD possessed a well agreement under the influence of salt-fingering flow (Figure 6). We suggested that the width of FDZ at the aquifer-sea interface can be used as an indicator of fresh SGD, even in an unstable regime, to provide a basis for field monitoring. Fang et al. (2021) reviewed the absence of field studies regarding salt-fingering flow and pointed out a critical reason that traditional monitoring strategies were not suitable for rapid changes in the intertidal salinity. Geophysical methods are fast and efficient, and can invert intertidal salinity evolutions by monitoring electromagnetic information (Huizer et al., 2017). In the sandy tidal flat of Shilaoren, Jiaozhou Bay, Zhang Y. et al. (2021; 2023) and Xing et al. (2023) capture the temporal movement of salt-fingering flow via electrical resistivity tomography. Therefore, for SGD field monitoring under the influence of salt-fingering flow, we can use geophysical methods to invert the intertidal salinity distribution, and then accurately capture the width and location of FDZ at the aquifer-sea interface, and finally estimate the temporal and spatial variation of fresh SGD.
The speed and duration of salt finger movement change significantly with external forces, which has important implications for field monitoring. The results in Figure 7 and Table 2 indicated that with the increase of subsurface freshwater inflow, the active space of salt fingers was compressed, and the movement speed increased, thus reducing the duration time of salt fingers in the intertidal zone. Field monitoring of salt-fingering flow is already difficult, but the weak flow instability with a fast movement speed and a short duration time due to increased subsurface inflow, may further increase the difficulty of field monitoring of salt-fingering flow. Therefore, increased caution must be taken in field measurements if a weak salt-fingering flow in the intertidal zone is expect under specific hydrogeological conditions.
Transient changes in the external forces of coastal aquifers, such as seasonal or daily seawater temperatures (Bhagat et al., 2021), spring-neap variability in tidal amplitude (Glaser et al., 2021), and seasonality in subsurface inflow or hydraulic gradient (Qu et al., 2020), will generate a dynamic intertidal environment and induce the evolution of the USP associated with interface perturbation. Interface perturbation has been confirmed to be an important mechanism for the onset of free convection or mixing convection (Schincariol et al., 1997). Figures 8 and 9 show that under the fluctuation of seasonal freshwater inflow, salt-fingering flow not only occurs at the time of a low freshwater influx, but also generates when the freshwater influx is high. And the fixed case with the same high flux is stable for the intertidal environment. By measuring the interface perturbation by the maximum difference in the USP salt mass in each cycle, we found that the important reason for the formation of salt-fingering flow at a high freshwater inflow is the powerful interface perturbation with a large difference in the USP salt mass. The transient external forces accompanied with interface perturbation induced variable and complex movement features of salt fingers including speed and duration time (Figure 9), in contrast to the results under the condition of fixed external forces. Real-world aquifers usually subject to the combined influence of multiple external forces and possess a more complex intertidal environment, which may lead to more complex and variable movement characteristics of salt-fingering flow. Notwithstanding, this study found that the duration and proportion of salt-fingering flow decreased as the period of seasonal freshwater inflow increased due to the weak interface perturbation. This gives us some insight into the estimation of the movement characteristics of salt-fingering flow under multiple instantaneous forces.
The movement of salt fingers in the intertidal zone has an important impact on SGD and related solute transport. As shown in Figure 6, salt finger movement caused the responsive changes in the width of FDZ and fresh SGD fluxes. Terrigenous matter carried by fresh SGD and sea-derived matter delivered by salt SGD are mixed at the USP edge and experience biogeochemical reactions (Heiss et al., 2020). This mixing zone is also known as a subterranean estuary (Robinson et al., 2018). The movement speed and duration time of salt fingers determine the reaction time between terrigenous matter and sea-derived matter and thus affect the reaction rate of subterranean estuaries, which finally determines the chemical loads of land- and sea-derived matters discharged into the ocean. As shown in Figure 4, there is a long duration time and a wide active region as the flow instability is forceful. This is conducive to the reaction of subterranean estuaries, and the reaction position can be extended to the lower part of the aquifer with the enhancement of salt-fingering flow. However, when salt-fingering flow is weak (Figure 7), the finger moves with an increased speed and a compressed active space, and the duration time decreases, which is not conducive to the reaction of subterranean estuaries.
Real-world aquifers usually subject to the combined influence of multiple external forces (e.g., seasonal or daily seawater temperatures (Bhagat et al., 2021), spring-neap variability in tidal amplitude (Glaser et al., 2021), and seasonality in subsurface inflow or hydraulic gradient (Qu et al., 2020)) and possess a more complex intertidal environment, which may lead to more complex and variable movement characteristics of salt-fingering flow than presented in this study. Moreover, the complexity of coastal aquifers such as heterogeneity and anisotropy, is neglected. Greskowiak (2014) found that a high horizontal hydraulic conductivity favors ambient groundwater flow, thus inhibiting the generation of salt-fingering flow. While a high vertical hydraulic conductivity provides better conditions for a downward movement of the denser saline plume and supports fingering flow. The investigations in other instability systems (e.g., Elder problem) provide an insight into the critical effect of heterogeneity on flow instability, but there are no general conclusions for inhibition or support, which depends on the structure and variance of the permeability field. Thus, the complexity of coastal aquifers is highly likely to affect the onset of salt-finger flow and subsequent movement characteristics. Future studies are required to investigate the combined influence of multiple external forces and the complexity of coastal aquifers. Nevertheless, this study provides a useful assessment of groundwater dynamics in the intertidal zone during salt-fingering flow under the conditions with fixed and temporal external forces, which lays the foundation for gaining a better understanding of the potential implications of salt-fingering flow on SGD and related solute transports.
This study conducted laboratory-scale numerical simulations to investigate groundwater dynamics in the intertidal zone during salt-fingering flow. The movement features of salt fingers and the response laws of FDZ were carefully quantified. The key new findings are summarized as follows:
During salt-fingering flow, the finger was repeatedly generated and detached from the USP region, which included the process of the development, separation, and mergence. Horizontally, the finger moved toward the sea, and the finger speed first increased at the development stage, then remained unchanged at the separation stage, and finally decreased at the mergence stage. The movement speed of salt fingers was closely related to ambient freshwater flow in the FDZ. In the vertical direction, the finger first permeated downward with a decreasing speed, and then the upward discharge of fresh groundwater in the FDZ region with an increased flow velocity pushed the finger upwards with an increasing speed.
In contrast to the results in a stable USP regime, the width of FDZ at the aquifer-sea interface fluctuated over time, and the variation trends possessed a well agreement with the flux of fresh groundwater discharge. This suggested that the width of FDZ at the aquifer-sea interface can be used as an indicator of fresh groundwater discharge, even in an unstable regime, to provide a basis for field monitoring. There was a causal relationship between the USP salt mass, the movement of salt fingers, and the FDZ width at the aquifer-sea interface.
As fixed subsurface inflow increased, the movement range of salt finger was compressed in the intertidal zone, and the location where the finger disappeared at the aquifer-sea interface was far from the low-tide mark. The increased freshwater discharge not only limited the downward infiltration of salt fingers, but also accelerated the horizontal and vertically upward movement of salt fingers. These ultimately led to a decrease in the duration time in the intertidal zone.
Temporal changes in seasonal freshwater inflow could cause additional interface perturbation and affected the occurrence of salt-fingering flow and subsequent movement characteristics. The intensity of salt-fingering flow varied over time under the condition of seasonal freshwater inflow. The duration time of salt finger movement in an individual cycle was relatively short, with an average value of 17.49 min less than that of 20–28 min in fixed cases. The difference in the FDZ width at the aquifer-sea interface in the cycle was identified as a positive response to the intensity of salt-fingering flow. The mean duration of salt fingers decreased slightly with the increase of seasonal freshwater periods due to a decrease in the interface perturbation for the intertidal environment.
The original contributions presented in the study are included in the article/Supplementary Material. Further inquiries can be directed to the corresponding authors.
YF: Conceptualization, Investigation, Methodology, Validation, Writing – original draft, Writing – review & editing. JQ: Funding acquisition, Resources, Writing – review & editing, Conceptualization. LM: Supervision, Visualization, Writing – review & editing, Project administration. HW: Writing – review & editing, Conceptualization, Formal analysis, Investigation.
The author(s) declare financial support was received for the research, authorship, and/or publication of this article. This study was supported by the National Natural Science Foundation of China (41831289, 42302268), China Postdoctoral Science Foundation (2022M720979), and the Fundamental Research Funds for the Central Universities (JZ2023HGQB0166).
The authors declare that the research was conducted in the absence of any commercial or financial relationships that could be construed as a potential conflict of interest.
All claims expressed in this article are solely those of the authors and do not necessarily represent those of their affiliated organizations, or those of the publisher, the editors and the reviewers. Any product that may be evaluated in this article, or claim that may be made by its manufacturer, is not guaranteed or endorsed by the publisher.
The Supplementary Material for this article can be found online at: https://www.frontiersin.org/articles/10.3389/fmars.2023.1319751/full#supplementary-material
Andrisoa A., Lartaud F., Rodellas V., Neveu I., Stieglitz T. C. (2019). Enhanced growth rates of the Mediterranean mussel in a coastal lagoon driven by groundwater inflow. Front. Mar. Sci. 6. doi: 10.3389/fmars.2019.00753
Bhagat C., Khandekar A., Singh A., Mohapatra P. K., Kumar M. (2021). Delineation of submarine groundwater discharge and seawater intrusion zones using anomalies in the field water quality parameters, groundwater level fluctuation and sea surface temperature along the Gujarat coast of India. J. Environ. Manage. 296, 113176. doi: 10.1016/j.jenvman.2021.113176
Diersch H. R. G. (2014). FEFLOW: Finite element modeling of flow, mass and heat transport in porous and fractured media (Berlin Heidelberg:Springer Science & Business Media). doi: 10.1007/978-3-642-38739-5
Evans T. B., Wilson A. M. (2017). Submarine groundwater discharge and solute transport under a transgressive barrier island. J. Hydrol. 547, 97–110. doi: 10.1016/j.jhydrol.2017.01.028
Fang Y., Zheng T., Guo B., Zhan H., Wang H., Zheng X., et al. (2022a). Transformation in the stability of tide-Induced upper saline plume driven by transient external forcing. Water Resour. Res. 58 (6), e2021WR031331. doi: 10.1029/2021WR031331
Fang Y., Zheng T., Wang H., Zheng X., Walther M. (2022b). Influence of dynamically stable-unstable flow on seawater intrusion and submarine groundwater discharge over tidal and seasonal cycles. J. Geophys. Res.: Oceans 127 (4), e2021JC018209. doi: 10.1029/2021JC018209
Fang Y., Zheng T., Zheng X., Yang H., Wang H., Walther M. (2021). Influence of tide-induced unstable flow on seawater intrusion and submarine groundwater discharge. Water Resour. Res. 57, e2020WR029038. doi: 10.1029/2020WR029038
Geng X., Michael H. A., Boufadel M. C., Molz F. J., Gerges F., Lee K. (2020). Heterogeneity affects intertidal flow topology in coastal beach aquifers. Geophys. Res. Lett. 47, e2020GL089612. doi: 10.1029/2020GL089612
Glaser C., Frei S., Massmann G., Gilfedder B. S. (2021). Tidal creeks as hot-spots for hydrological exchange in a coastal landscape. J. Hydrol. 597, 126158. doi: 10.1016/j.jhydrol.2021.126158
Goswami R. R., Clement T. P. (2007). Laboratory-scale investigation of saltwater intrusion dynamics. Water Resour. Res. 43 (4), W4411–W4418. doi: 10.1029/2006WR005151
Greskowiak J. (2014). Tide-induced salt-fingering flow during submarine groundwater discharge. Geophys. Res. Lett. 41 (18), 6413–6419. doi: 10.1002/2014GL061184
Heiss J. W., Michael H. A. (2014). Saltwater-freshwater mixing dynamics in a sandy beach aquifer over tidal, spring-neap, and seasonal cycles. Water Resour. Res. 50 (8), 6747–6766. doi: 10.1002/2014WR015574
Heiss J. W., Michael H. A., Koneshloo M. (2020). Denitrification hotspots in intertidal mixing zones linked to geologic heterogeneity. Environ. Res. Lett. 15 (8), 84015. doi: 10.1088/1748-9326/ab90a6
Heiss J. W., Post V. E. A., Laattoe T., Russoniello C. J., Michael H. A. (2017). Physical controls on biogeochemical processes in intertidal zones of beach aquifers. Water Resour. Res. 53 (1), 9225–9244. doi: 10.1002/2017WR021110
Huizer S., Karaoulis M. C., Oude Essink G. H. P., Bierkens M. F. P. (2017). Monitoring and simulation of salinity changes in response to tide and storm surges in a sandy coastal aquifer system. Water Resour. Res. 53 (8), 6487–6509. doi: 10.1002/2016WR020339
Kim K. H., Heiss J. H., Michael H. (2022). Seasonal and spatial production patterns of dissolved inorganic carbon and total alkalinity in a shallow beach aquifer. Front. Mar. Sci. 9. doi: 10.3389/fmars.2022.856281
Kooi H., Groen J., Leijnse A. (2000). Modes of seawater intrusion during transgressions. Water Resour. Res. 36 (12), 3581–3589. doi: 10.1029/2000WR900243
Kuan W. K., Jin G., Xin P., Robinson C. E., Gibbes B., Li L. (2012). Tidal influence on seawater intrusion in unconfined coastal aquifers. Water Resour. Res. 48 (2), 136–149. doi: 10.1029/2011WR010678
Kuan W. K., Xin P., Jin G., Robinson C. E., Gibbes B., Li L. (2019). Combined effect of tides and varying inland groundwater input on flow and salinity distribution in unconfined coastal aquifers. Water Resour. Res. 55, 8864–8880. doi: 10.1029/2018WR024492
Kwon E. Y., Kim G., Primeau F., Moore W. S., Cho H., Devries T., et al. (2014). Global estimate of submarine groundwater discharge based on an observationally constrained radium isotope model. Geophys. Res. Lett. 41 (23), 8438–8444. doi: 10.1002/2014GL061574
Lebbe L. (1981). The subterranean flow of fresh and salt water underneath the Western Belgium beach. In Rapporter Och Meddelanden Sveriges Geologiska Undersökning 27, 193–219.
Lu C., Werner A. D. (2013). Timescales of seawater intrusion and retreat. Adv. Water Resour. 59, 39–51. doi: 10.1016/j.advwatres.2013.05.005
Nguyen T. T. M., Yu X., Pu L., Xin P., Zhang C., Barry D. A., et al. (2020). Effects of temperature on tidally influenced coastal unconfined aquifers. Water Resour. Res. 56 (4), e2019WR26660. doi: 10.1029/2019WR026660
Qu W., Li H., Wang C., Zheng C., Wang X., Zhang Y. (2020). Numerical simulations of seasonally oscillated groundwater dynamics in coastal confined aquifers. Groundwater 58, 550–559. doi: 10.1111/gwat.12926
Robinson C. E., Xin P., Santos I. R., Charette M. A., Li L., Barry D. A. (2018). Groundwater dynamics in subterranean estuaries of coastal unconfined aquifers: Controls on submarine groundwater discharge and chemical inputs to the ocean. Adv. Water Resour. 115, 315–331. doi: 10.1016/j.advwatres.2017.10.041
Rodellas V., Garcia-Orellana J., Masqué P., Feldman M., Weinstein Y. (2015). Submarine groundwater discharge as a major source of nutrients to the Mediterranean Sea. Proc. Natl. Acad. Sci. United States America 112 (13), 3926–3930. doi: 10.1073/pnas.1419049112
Röper T., Greskowiak J., Massmann G. (2015). Instabilities of submarine groundwater discharge under tidal forcing. Limnol. Oceanogr. 60 (1), 22–28. doi: 10.1002/lno.10005
Santos I. R., Chen X., Lecher A. L., Sawyer A. H., Moosdorf N., Rodellas V., et al. (2021). Submarine groundwater discharge impacts on coastal nutrient biogeochemistry. Nat. Rev. Earth Environ. 2, 307–323. doi: 10.1038/s43017-021-00152-0
Schincariol R. A., Schwartz F. W., Mendoza C. A. (1997). Instabilities in variable density flows: Stability and sensitivity analyses for homogeneous and heterogeneous media. Water Resour. Res. 33 (1), 31–41. doi: 10.1029/96WR02587
Shen C., Zhang C., Kong J., Xin P., Lu C., Zhao Z., et al. (2019). Solute transport influenced by unstable flow in beach aquifers. Adv. Water Resour. 125, 68–81. doi: 10.1016/j.advwatres.2019.01.009
Simmons C. T., Narayan K. A. (1997). Mixed convection processes below a saline disposal basin. J. Hydrol. 194 (1), 263–285. doi: 10.1016/S0022-1694(96)03204-0
Starke C., Ekau W., Moosdorf N. (2020). Enhanced productivity and fish abundance at a submarine spring in a coastal lagoon on Tahiti, French Polynesia. Front. Mar. Sci. 6. doi: 10.3389/fmars.2019.00809
Van Genuchten M. T. (1980). A closed-form equation for predicting the hydraulic conductivity of unsaturated Soils1. Soil Sci. Soc. America J. 44 (5), 892. doi: 10.2136/sssaj1980.03615995004400050002x
Wu X., Xu Z., Xu Z., Hu B. X. (2023). Impact of connected conduit on pumping-induced seawater intrusion in a coastal karst aquifer. Front. Mar. Sci. 10. doi: 10.3389/fmars.2023.1277005
Xie Y., Simmons C. T., Werner A. D. (2011). Speed of free convective fingering in porous media. Water Resour. Res. 47 (11), W11501. doi: 10.1029/2011WR010555
Xie Y., Simmons C. T., Werner A. D., Diersch H. G. (2012). Prediction and uncertainty of free convection phenomena in porous media. Water Resour. Res. 48 (2), W02535. doi: 10.1029/2011WR011346
Xin P., Wang S. S. J., Lu C., Robinson C. E., Li L. (2015). Nonlinear interactions of waves and tides in a subterranean estuary. Geophys. Res. Lett. 42 (7), 2277–2284. doi: 10.1002/2015GL063643
Xing C., Zhang Y., Guo X., Sun J. (2023). Time series investigation of electrical resistivity tomography reveals the key drivers of tide and storm on groundwater discharge. Estuarine Coast. Shelf Sci. 282, 108225. doi: 10.1016/j.ecss.2023.108225
Yu X., Xin P., Wang S. S. J., Shen C., Li L. (2019). Effects of multi-constituent tides on a subterranean estuary. Adv. Water Resour. 124, 53–67. doi: 10.1016/j.advwatres.2018.12.006
Zhang J., Lu C., Shen C., Zhang C., Kong J., Li L. (2021). Effects of a low-permeability layer on unstable flow pattern and land-sourced solute transport in coastal aquifers. J. Hydrol. 598, 126397. doi: 10.1016/j.jhydrol.2021.126397
Zhang Y., Wu J., Zhang K., Guo X., Xing C., Li N., et al. (2021). Analysis of seasonal differences in tidally influenced groundwater discharge processes in sandy tidal flats: A case study of Shilaoren Beach, Qingdao, China. J. Hydrol. 603, 127128. doi: 10.1016/j.jhydrol.2021.127128
Zhang Y., Xing C., Guo X., Zheng T., Zhang K., Xiao X., et al. (2023). Temporal and spatial distribution patterns of upper saline plumes and seawater-groundwater exchange under tidal effect. J. Hydrol. 625, 130042. doi: 10.1016/j.jhydrol.2023.130042
Zhang B., Zheng T., Zheng X., Walther M. (2021). Utilization of pit lake on the cleaning process of residual saltwater in unconfined coastal aquifers. Sci. Total Environ. 770, 144670. doi: 10.1016/j.scitotenv.2020.144670
Keywords: flow instability, submarine groundwater discharge, movement characteristics, tide, unconfined aquifer
Citation: Fang Y, Qian J, Ma L and Wang H (2023) Groundwater dynamics in intertidal zones of beach aquifers during salt-fingering flow. Front. Mar. Sci. 10:1319751. doi: 10.3389/fmars.2023.1319751
Received: 11 October 2023; Accepted: 20 November 2023;
Published: 04 December 2023.
Edited by:
Olaf Kolditz, Helmholtz Association of German Research Centres (HZ), GermanyCopyright © 2023 Fang, Qian, Ma and Wang. This is an open-access article distributed under the terms of the Creative Commons Attribution License (CC BY). The use, distribution or reproduction in other forums is permitted, provided the original author(s) and the copyright owner(s) are credited and that the original publication in this journal is cited, in accordance with accepted academic practice. No use, distribution or reproduction is permitted which does not comply with these terms.
*Correspondence: Jiazhong Qian, cWlhbmppYXpob25nQGhmdXQuZWR1LmNu; Huan Wang, d2FuZ2h1YW5mb3JtYWxAMTYzLmNvbQ==
Disclaimer: All claims expressed in this article are solely those of the authors and do not necessarily represent those of their affiliated organizations, or those of the publisher, the editors and the reviewers. Any product that may be evaluated in this article or claim that may be made by its manufacturer is not guaranteed or endorsed by the publisher.
Research integrity at Frontiers
Learn more about the work of our research integrity team to safeguard the quality of each article we publish.