 Qiang Ma
 Houguo Xu
 Samwel Mchele Limbu2
 Yuliang Wei
 Mengqing Liang
95% of researchers rate our articles as excellent or good
Learn more about the work of our research integrity team to safeguard the quality of each article we publish.
Find out more
ORIGINAL RESEARCH article
Front. Mar. Sci. , 30 November 2023
Sec. Aquatic Physiology
Volume 10 - 2023 | https://doi.org/10.3389/fmars.2023.1310415
This article is part of the Research Topic Endocrine Regulation and Physiological Adaptation of Stress Response in Aquatic Organisms View all 18 articles
Carbohydrates are a common and economical energy source in animal feeds. However, most fish show a persistent postprandial hyperglycemia after intake of a high-carbohydrate diet. Unfortunately, the mechanism of glucose metabolism in fish is still unclear. In the present study, tiger puffer (Takifugu rubripes) and turbot (Scophthalmus maximus) were intraperitoneally injected or orally administered with glucose or fructose (500 mg/kg body weight) to evaluate the ability of fish to utilize carbohydrates. Afterwards, serum glucose, fructose, pyruvate, insulin levels, and acute hypoxia tolerance were measured. Our results showed increased serum glucose level and then decreased post intraperitoneal injection with glucose, and reached a peak after 0.5 hours in turbot and 1 hour in tiger puffer. Tiger puffer had significantly lower liver glycogen, serum glucose, fructose, pyruvate, and insulin contents than turbot. Glucose and fructose only induced insulin secretion in turbot, but did not change serum insulin level in tiger puffer. Glucose was a stronger stimulator of insulin than fructose in the two marine species. Both intraperitoneal injection and oral fructose intake increased serum glucose level, while intraperitoneal or oral glucose also increased serum fructose level. Intraperitoneal injection of glucose promoted absorption and utilization of glucose in the blood more effectively than oral glucose intake. In addition, turbot and tiger puffer were intolerant to acute hypoxia, whereas supplementation with glucose or fructose improved hypoxia tolerance in the two marine fishes by activating anaerobic glycolysis. Taken together, our results provide important scientific information for understanding the mechanism for glucose and fructose utilization and improving hypoxia tolerance in fish.
Carbohydrates, such as starch and glucose, are a common and digestible energy source in food for mammals. Appropriate levels of carbohydrates in animal feeds promote growth and reduce the use of fat and protein ingredients (Ren et al., 2011; Kamalam et al., 2017; Zhang et al., 2019). However, many fish species show persistent postprandial hyperglycemia after a glucose tolerance test (GTT) or intake of high-carbohydrate feed, generally considered as glucose intolerance (Moon, 2001; Stone, 2003). GTT, including intraperitoneal glucose tolerance test (IPGTT) and oral glucose tolerance test (OGTT), are accepted methods used to evaluate glucose utilization capacity in humans and animals (Hemre and Hansen, 1998; Tuomilehto et al., 2001). However, carbohydrates utilization and GTT in fish are affected by various factors including insulin secretion, insulin receptor content, perception and transporter ability of glucose, glycolysis and gluconeogenesis-related enzymes activities, intestinal digestive enzymes activities, dietary carbohydrate sources, fish size, water temperature and hypoxia stress (Panserat et al., 2000; Blasco et al., 2001; Moon, 2001; Hemre et al., 2002; Alexander et al., 2011; Caruso and Sheridan, 2011). Accordingly, IPGTT and OGTT have been used in various cultured fish species to evaluate carbohydrate utilization.
Previous studies on IPGTT and OGTT revealed different peaks in measured parameters for various fish species. In carnivorous fish, such as Japanese flounder (Paralichthys olivaceus), serum glucose content reached the peak after 5 hours and returned to normal level until 48 hours post intraperitoneal glucose injection at 1000 mg glucose/kg body weight (Liu et al., 2018). However, serum insulin content decreased to the lowest level at 3 hours and returned to normal level until 48 hours after IPGTT (Liu et al., 2018). In largemouth bass (Micropterus salmoides), intraperitoneal glucose injection at 500 mg glucose/kg body weight increased serum glucose level that reached the peak after 3 hours and returned to normal level after 12 hours following IPGTT, but IPGTT did not affect the gene expression of insulin receptors (Li et al., 2021). In omnivorous fish, such as zebrafish (Danio rerio) GTT at 1000 mg glucose/kg body weight caused a peak serum glucose level after 0.5 hour and returned to normal level after 6 hour post injection (Eames et al., 2010). In Nile tilapia (Oreochromis niloticus), another omnivorous fish species GTT at 1000 mg glucose/kg body weight caused a glucose level peak in the plasma after 1 hour, which returned to normal level after 3 hour post injection (Chen et al., 2020). These results suggest that omnivorous fish have a greater ability to utilize glucose than carnivorous fish. Currently, the mechanism for glucose metabolism and carbohydrate utilization in fish are still unclear.
Fructose is an isomer of glucose, both with the molecular formula of C6H12O6. The two are the most common monosaccharides in most foods. In mammals, fructose is metabolized mainly in the liver and intestine by the fructose-1-phosphate pathway and the fructose-6-phosphate pathway, where solute carrier family 2 member 5 (SLC2A5/GLUT5) and ketohexokinase (KHK) enzymes play important roles (Havel, 2005; Tolan, 2007). Dietary excessive fructose cause nonalcoholic fatty liver, diabetes, insulin resistance, hyperuricemia, dyslipidemia, and obesity (Tesz and Bence, 2020). However, few studies exist on fructose metabolism in fish. In the fruit-eating fish Piaractus mesopotamicus, oral fructose at 2000 mg/kg body weight caused lower blood glucose levels than oral glucose and starch treatments (Takahashi et al., 2018). Moreover, feeding diets containing 22% and 15% fructose decreased growth performance and hepatic health in Amur sturgeon (Acipenser schrenckii) and Nile tilapia (Jiang et al., 2014; Zhou et al., 2022). The existence of limited studies, calls for more research to explain the effects of fructose on cultured fish species.
Ocean warming, eutrophication, diurnal alternation, extreme weather in nature and high-density culture, long-distance transportation, and power interruption in aquaculture all cause water environment hypoxia, which affect the growth performance and health of aquatic animals (Wu et al., 2003; Ma et al., 2023a). Acute hypoxia cause mass death of cultured fishes within a short time resulting in severe economic losses (Landman et al., 2005). Therefore, it is crucial to improve the tolerance of fish to acute hypoxia for sustainable aquaculture production. In mammals and fish, acute hypoxia activates hypoxia-inducible factor (HIF) and anaerobic glycolysis pathway and promotes the breakdown of glycogen into glucose and the production of lactic acid (Koukourakis et al., 2001; Li et al., 2018a). Accordingly, a naked mole-rat (Heterocephalus glaber) survived for 18 minutes in a zero oxygen environment without significant damage because it utilizes only fructose for anaerobic glycolysis and produces lactic acid in hypoxia condition (Park et al., 2017). This study indicated that not only glucose but also fructose improved hypoxia tolerance in animals. However, the effects of glucose and fructose on acute hypoxia tolerance and metabolism in fish have not been evaluated.
Marine fish farming is an important part of world aquaculture due to the rapid development of deep-sea net pens, large-scale aquaculture vessels, and land-based factory recirculating aquaculture. Tiger puffer (Takifugu rubripes) and turbot (Scophthalmus maximus) are important farmed marine fish species in northern China with annual outputs of around 16,000 tons and 50,000 tons, respectively, which are famous for their tasty meat and high economic value (Ma et al., 2023b). However, the effects of glucose and fructose on insulin secretion and hypoxia tolerance of the two marine fishes have not been studied. Therefore, tiger puffer and turbot were intraperitoneally injected or orally administered with glucose or fructose solution at 500 mg/kg body weight. Afterward, glucose, fructose, pyruvate, and insulin levels in the serum and the survival rate of eight fish species under acute hypoxia were measured. Our study compares the ability of tiger puffer and turbot to utilize glucose and fructose and assesses the effects of glucose and fructose on acute hypoxia tolerance in the two-marine fish species.
All experimental procedures and animal care were conducted under a protocol approved by experimental animal care, ethics, and safety inspection from the Yellow Sea Fisheries Research Institute, Chinese Academy of Fishery Sciences.
Juvenile tiger puffer (Takifugu rubripes), turbot (Scophthalmus maximus), half-smooth tongue sole (Cynoglossus semilaevis), goby (Acanthogobius ommaturus), Japanese sea bass (Lateolabrax japonicas), grey mullet (Mugil cephalus Linnaeus), yunlong grouper (Epinephelus moara♀ × Epinephelus lanceolatus♂), and pearl gentian grouper (Epinephelus fuscoguttatus♀ × Epinephelus lanceolatus♂) were provided by Huanghai Aquaculture Co. Ltd. (Yantai, China). The initial weights of the fish species ranged from 30 to 125 g. All fish were acclimatized in a flow-through seawater system and fed with the same commercial marine fish feed (protein 46%, lipid 10%, ash 11%, moisture 10%, Shengsuo fishery culture feed research center, Shangdong, China) for two weeks. Salinity, water temperature, dissolved oxygen (DO), pH, and total ammonia nitrogen were kept at 26 to 30‰, 20 to 23°C, 6 to 7 mg/L, 7 to 8, and < 0.02 mg/L, respectively.
One hundred and eight tiger puffer (113.5 ± 10.9 g) and the same number of turbot (105.2 ± 15.6 g) were randomly distributed into 36 tanks (6 fish of each species per tank, 200 L). Before intraperitoneal injection or oral gavage, tiger puffer and turbot were fasted for 12 h to empty residual food in the digestive tract. Glucose and fructose powder (purity ≥ 99%) were purchased from China National Pharmaceutical Group Corporation (Sinopharm). Glucose and fructose were weighed and dissolved in normal saline solution (NS) to obtain glucose and fructose solutions at concentrations of 100 mg/mL. The injection or oral doses were all 5 μL/g body weight (500 mg/kg body weight).
Six tiger puffer or turbot were anaesthetized with MS-222 (10 mg/L) and injected with normal saline solution as a zero hour treatment. Forty-eight tiger puffer and the same number of turbot were injected with glucose or fructose solution. Blood was collected from six fish per tank (n = 6) after 0.5, 1, 3, and 7 hours post intraperitoneal glucose or fructose injection. In the same way, six tiger puffer or turbot were fed with normal saline solution orally as a zero hour treatment. Forty-eight tiger puffer and the same number of turbot were fed with glucose or fructose solution orally. Afterward, blood was collected from six fish per tank (n = 6) after 0.5, 1, 3, and 7 hours post oral glucose or fructose. The blood was placed at 4°C for two hours, centrifuged at 3000 rpm for 10 minutes, and then serum was collected. The design and sampling of the experiment are shown in Figure 1.
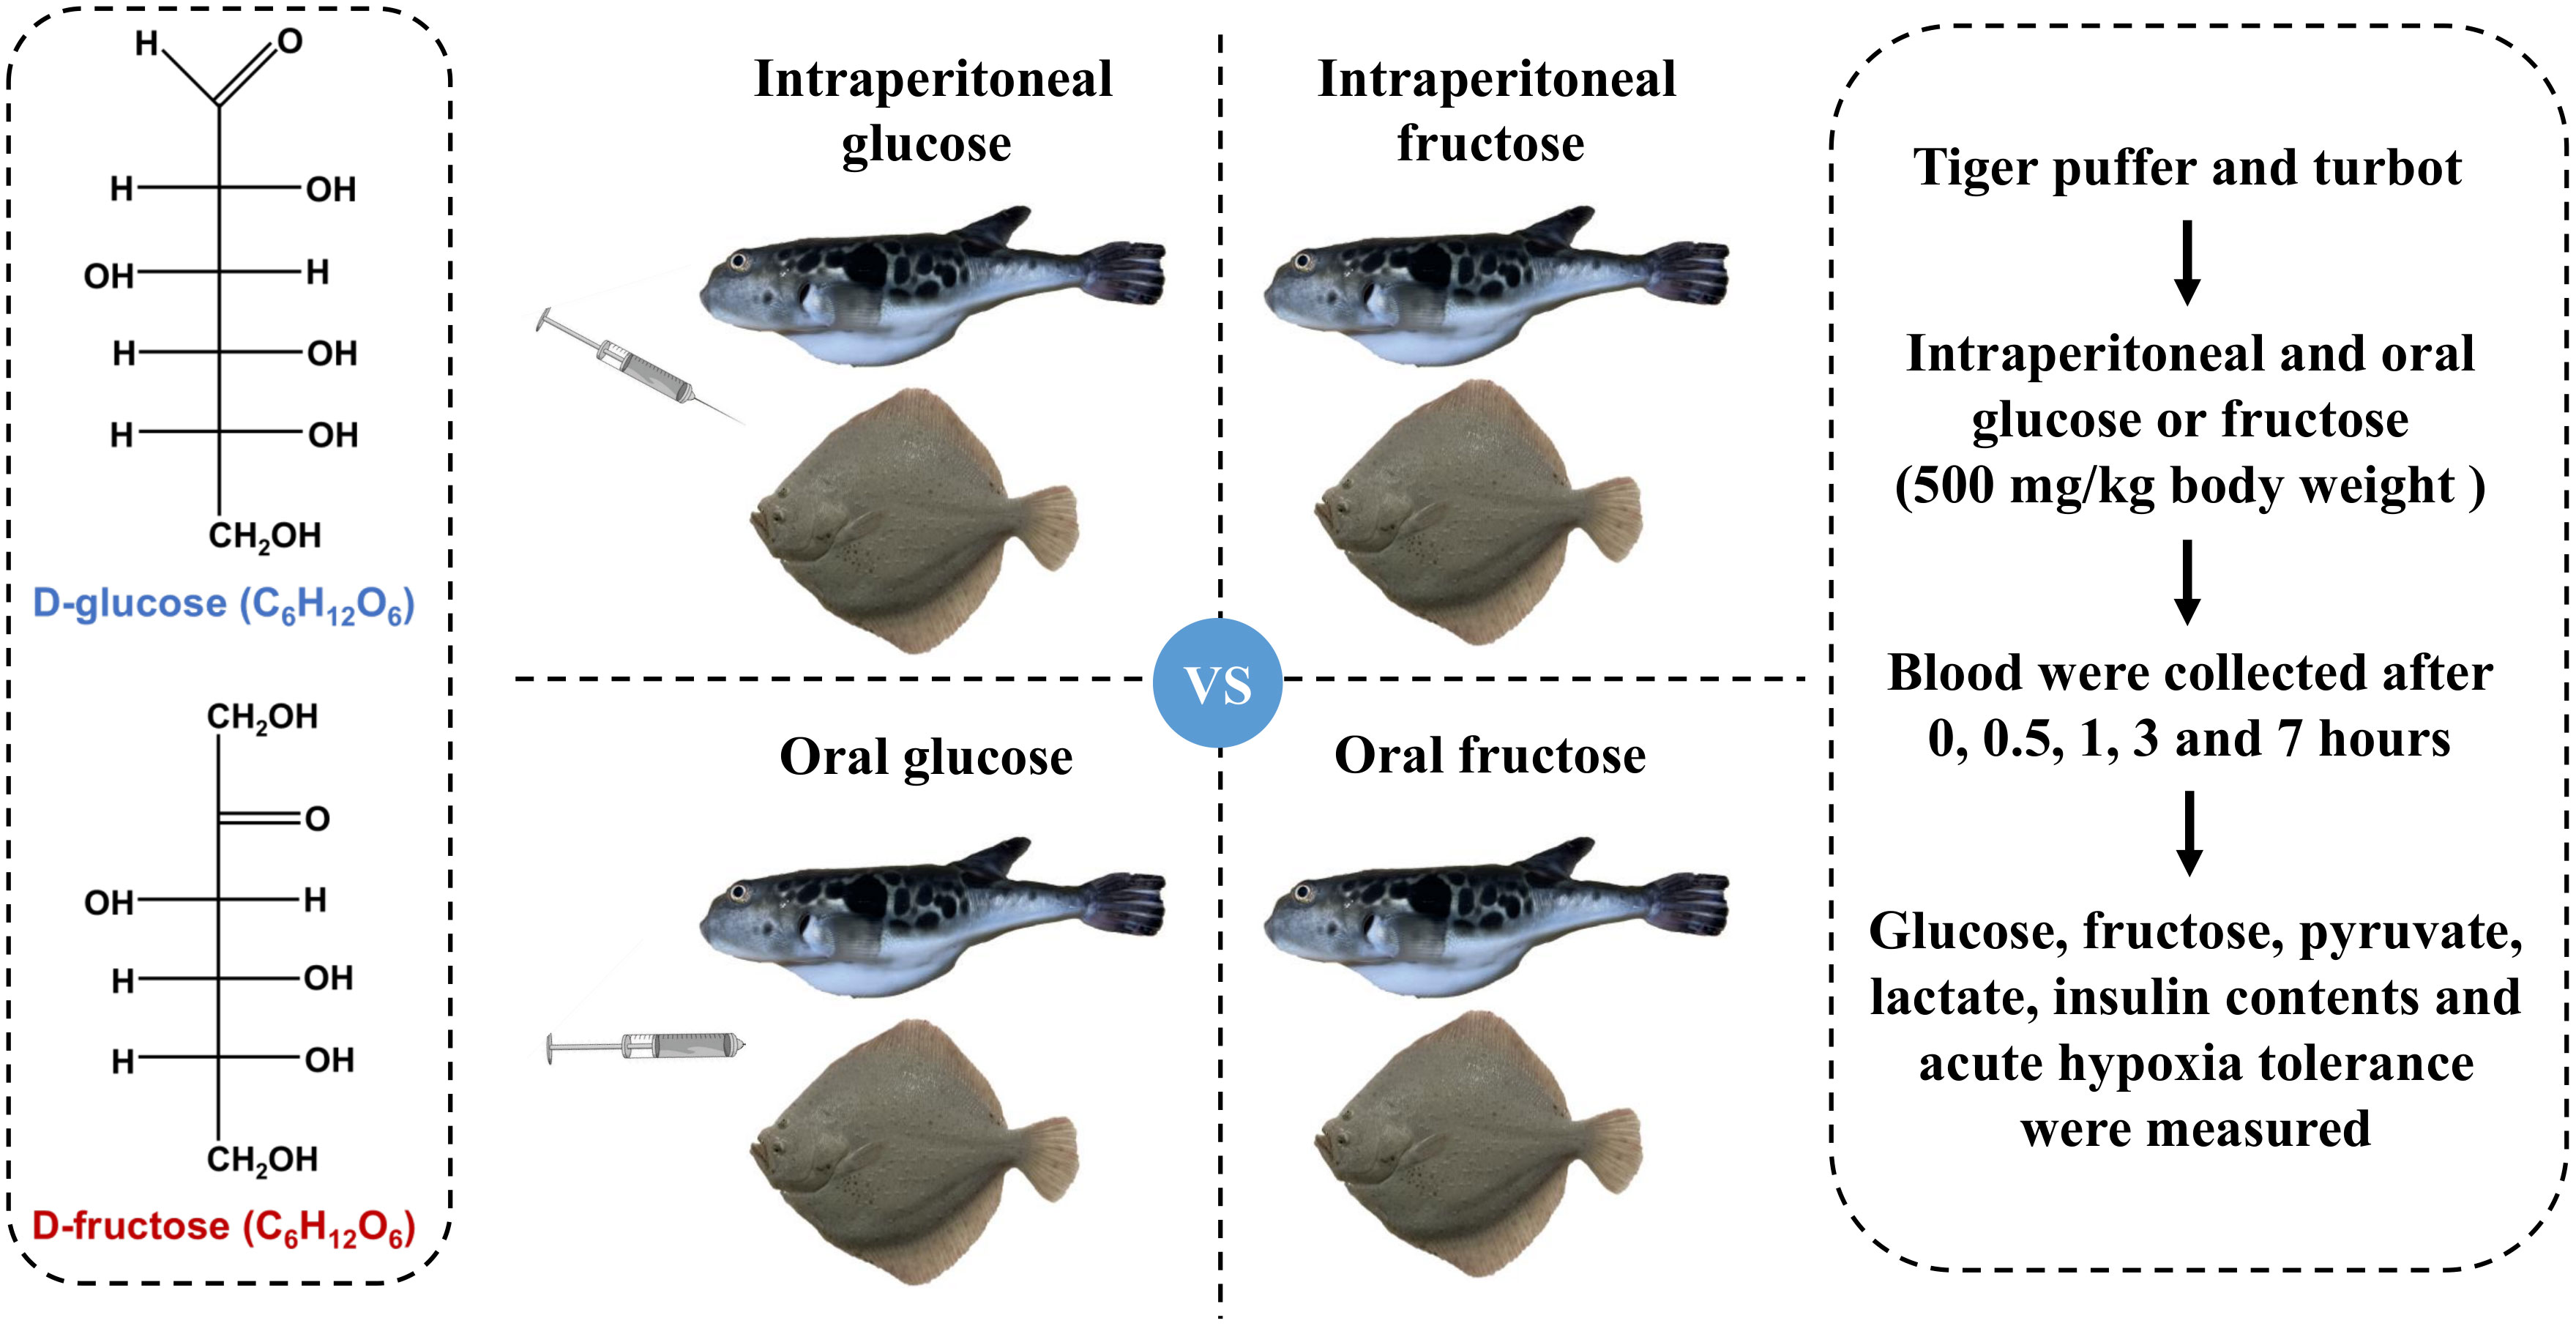
Figure 1 Design and sampling of the experiment. Tiger puffer and turbot were fasted for 12 h and then given 500 mg/kg body weight glucose solution or fructose solution via intraperitoneal injection or oral gavage, respectively. Serum biochemical indicators and survival rate during acute hypoxia were measured.
After two weeks of acclimatization, eight marine fish species (n = 20, two replicates per species, 10 fish per species per tank) were fasted for 12 h and transferred to customized hypoxic equipment (patent number: ZL202020482406.9) to evaluate the tolerance to acute hypoxia. The initial DO was 7.0 mg/L, the aquarium air pump was turned off, and then DO was decreased continuously to 0.1 mg/L with the prolonging of hypoxic time. The fish mortality was recorded every 0.5 hours. A fish was regarded dead when the gill stopped breathing. All the fish died after 12 h acute hypoxia. The survival rate was calculated by using the following formula: Survival rate (%) = alive fish number/initial fish number × 100.
Moreover, one hundred tiger puffer or turbot were randomly distributed into five treatments: normal saline (NS), intraperitoneal glucose (IG), intraperitoneal fructose (IF), oral glucose (OG), and oral fructose (OF), respectively. Each treatment had 20 tiger puffer or turbot (two replicates, 10 fish for each species per tank). Then, the tiger puffer or turbot were intraperitoneal injected or orally fed with glucose or fructose solution and studied for acute hypoxia stress. The fish died after the DO level in the water decreased. After 2 hours of hypoxia stress, the number of dead fish was counted and the survival rate after hypoxia was calculated. Afterward, the fish that survived were anesthetized with MS-222, and blood was collected for further analysis.
The concentrations of glucose (F006-1-1), fructose (A085-1-1), lactate (A019-2-1), and pyruvate (A081-1-1) in the serum were measured by using specific commercial kits (Nanjing Jiancheng Bioengineering Institute, China). Insulin content was determined by using a fish insulin enzyme-linked immune sorbent assay (ELISA) kit (HB407-QT, Shanghai Hengyuan Biological Technology Co., LTD, China). All the results were read by using a microplate reader (Tecan Infinite M200, Switzerland).
All data were tested for normality and homogeneity of variances by using Shapiro-Wilk and Levene’s tests, respectively. One-way analysis of variance (ANOVA, Duncan) was performed to evaluate significant differences among different sampling times (0, 0.5, 1, 3, and 7 hours). An independent-sample t-test was applied to determine the significant difference between tiger puffer and turbot, glucose and fructose, or between intraperitoneal injection and oral gavage. Significant differences were set at P < 0.05 and graphs were made by GraphPad Prism 8.0 software. All data were analyzed by using the SPSS Statistics 21.0 software (IBM company, USA). The results are reported as means ± standard error of means (SEM).
The fish intraperitoneal injected with glucose increased in serum glucose level and then decreased with the extension of sampling time compared with zero hour treatment (normal saline injection). The serum glucose level reached a peak after 0.5 hours in turbot and at 1 hour in tiger puffer (Figure 2A). The serum fructose and pyruvate levels also showed a similar trend in turbot (Figures 2B) and tiger puffer (Figures 2C) after glucose intraperitoneal injection. As the sampling time was extended, the serum insulin level showed an increasing trend in the turbot, but there was no significant effect on insulin level in the tiger puffer (Figure 2D). In oral glucose treatments, the two marine fishes showed a continuously increasing trend in serum glucose level, but the increase of glucose level in tiger puffer was more rapid than that in turbot (Figure 2E). The serum fructose level increased and then decreased with the extension of sampling time, and reached a peak after 1 hour in both turbot and tiger puffer (Figure 2F). The serum pyruvate and insulin levels separately showed a decreasing and an increasing trend in turbot as the sampling time was extended (Figure 2G), but the trend was reversed in the tiger puffer (Figure 2H). These data illustrate that intraperitoneal injection and oral glucose increased serum glucose and fructose contents in both tiger puffer and turbot, but only increased serum insulin content in the turbot.
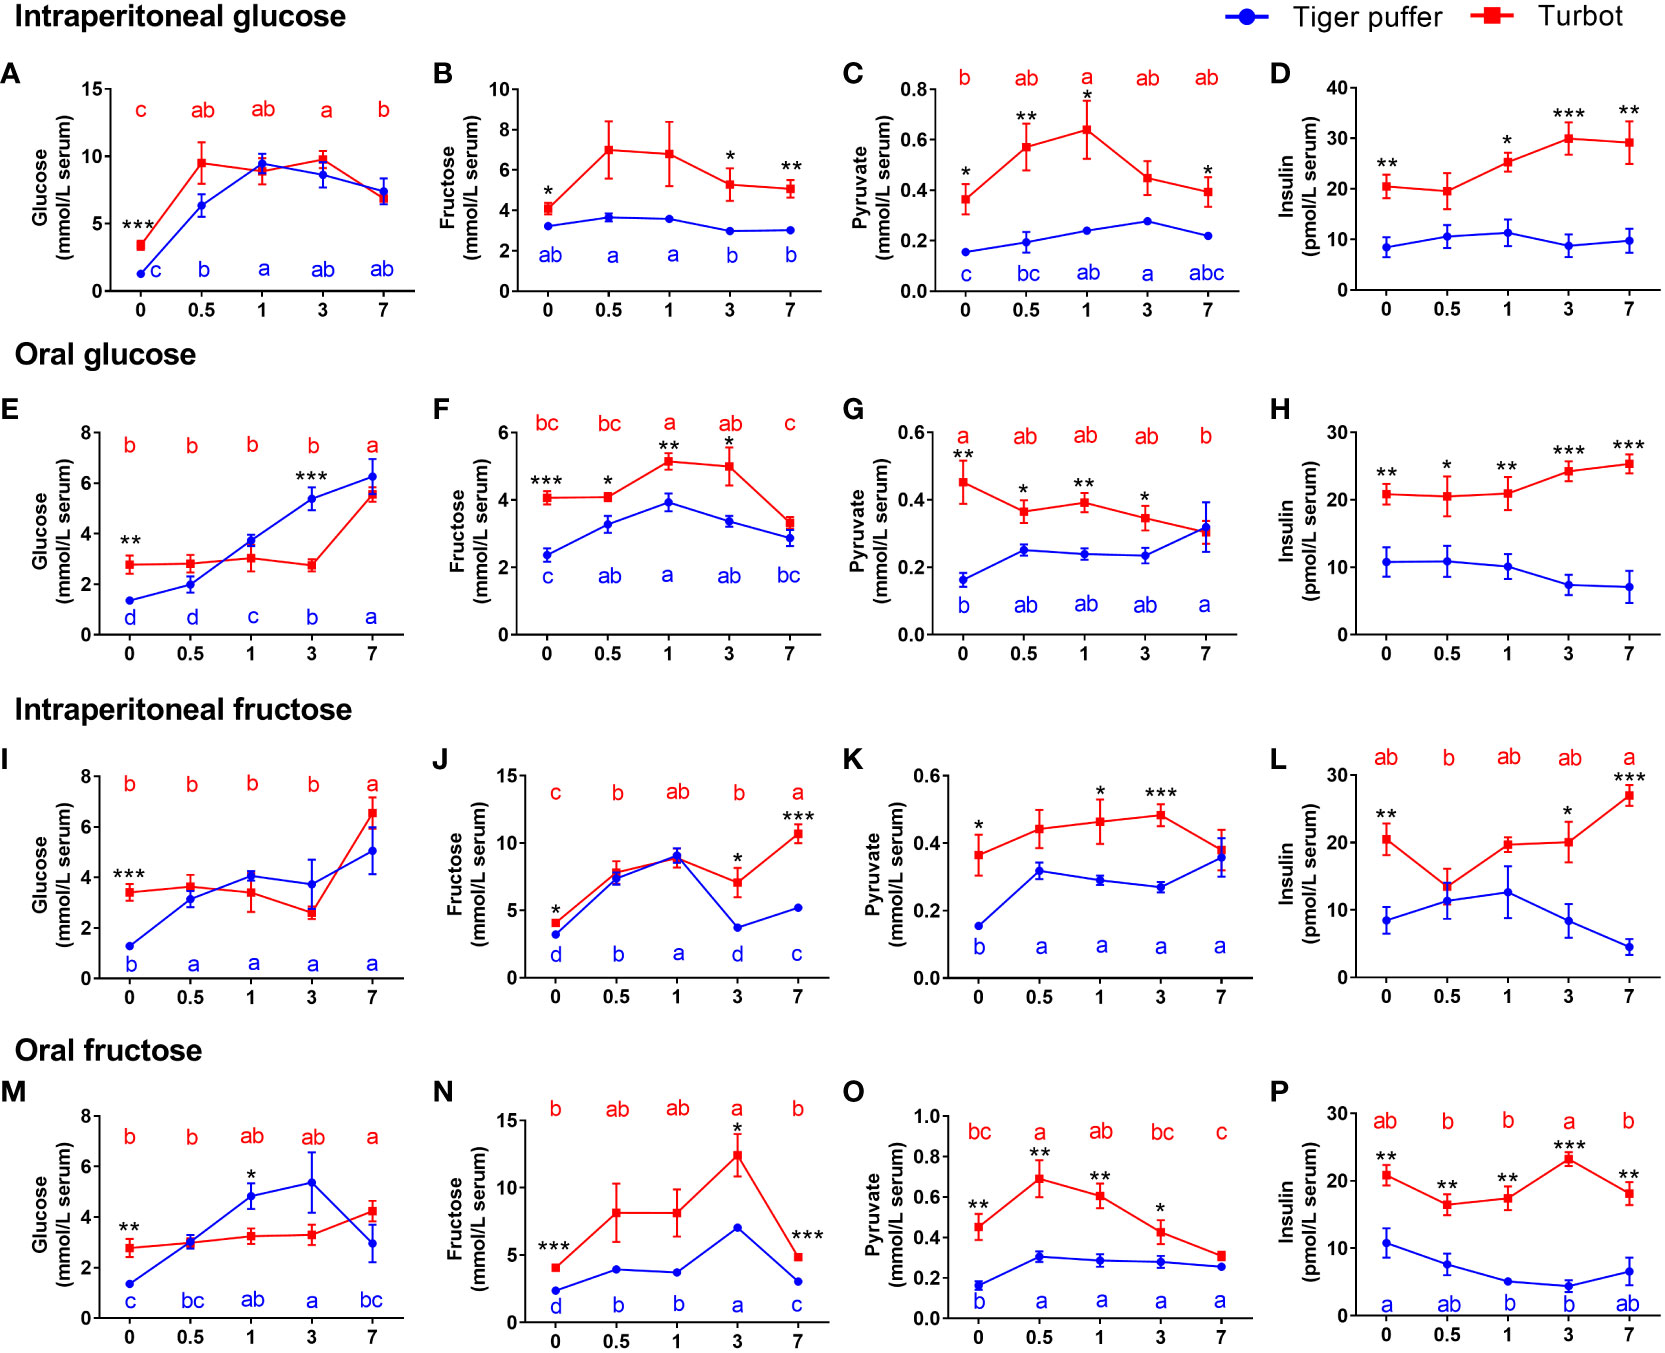
Figure 2 Comparison of differences in glucose or fructose utilization between tiger puffer and turbot. (A, E, I, M) glucose content. (B, F, J, N) fructose content. (C, G, K, O) pyruvate content. (D, H, L, P) insulin content. All values are means ± SEM (n=6). Different letters (A–C) with the same color indicate significant differences in the same fish species with different sampling times. *(p < 0.05), **(p < 0.01), and ***(p < 0.001) indicate significant differences at the same sampling time among different fish species.
Both turbot and tiger puffer intraperitoneal injected with fructose increased the serum glucose and pyruvate levels compared to the zero hour treatments and the significances were found in the tiger puffer (Figures 2I, K). Meanwhile, the fructose and insulin contents also showed an increasing trend in turbot (Figure 2J), but showed an increasing and then decreasing trend in tiger puffer (Figure 2L). In oral fructose treatments, the serum glucose level increased first and then decreased in tiger puffer with the extension of sampling time and reached the peak at 3 hours (Figure 2M). The turbot orally treated with fructose had a significant difference in serum glucose level after 7 hours (Figure 2M). The serum fructose and pyruvate levels showed an increasing and decreasing trend in the both turbot and tiger puffer after oral administration of fructose (Figure 2N). The fructose content reached a peak after 3 hours, and pyruvate content reached a peak after 0.5 hours (Figures 2N, O). Oral fructose did not affect the serum insulin content in turbot, but decreased the serum insulin content in tiger puffer (Figure 2P). In particular, the serum glucose level of tiger puffer was higher than that of turbot after 1 and 3 hours of oral administration of glucose or fructose. These data demonstrate that both intraperitoneal injection and oral fructose increased serum fructose and pyruvate contents in both tiger puffer and turbot, but only significantly increased serum glucose content in the tiger puffer. In general, the serum glucose, fructose, pyruvate, and insulin contents in turbot fish were all significantly higher than those in tiger puffer fish.
The intraperitoneal glucose treatments had significantly higher glucose content in the serum from 0.5 to 3 hours compared with the intraperitoneal fructose treatments (Figures 3A, I). However, both turbot and tiger puffer had lower fructose content in the serum (Figures 3B, J). In tiger puffer, the fish intraperitoneal injected with fructose had higher pyruvate levels than the fish intraperitoneal injected with glucose (Figure 3C). However, there was no significant effect on serum insulin content between fructose and glucose injections (Figure 3D). In turbot, the fish intraperitoneal injected with glucose had higher pyruvate and insulin levels in the serum than those injected intraperitoneal with fructose, and the significance was found in insulin content at 1 and 3 hours (Figures 3K, L).
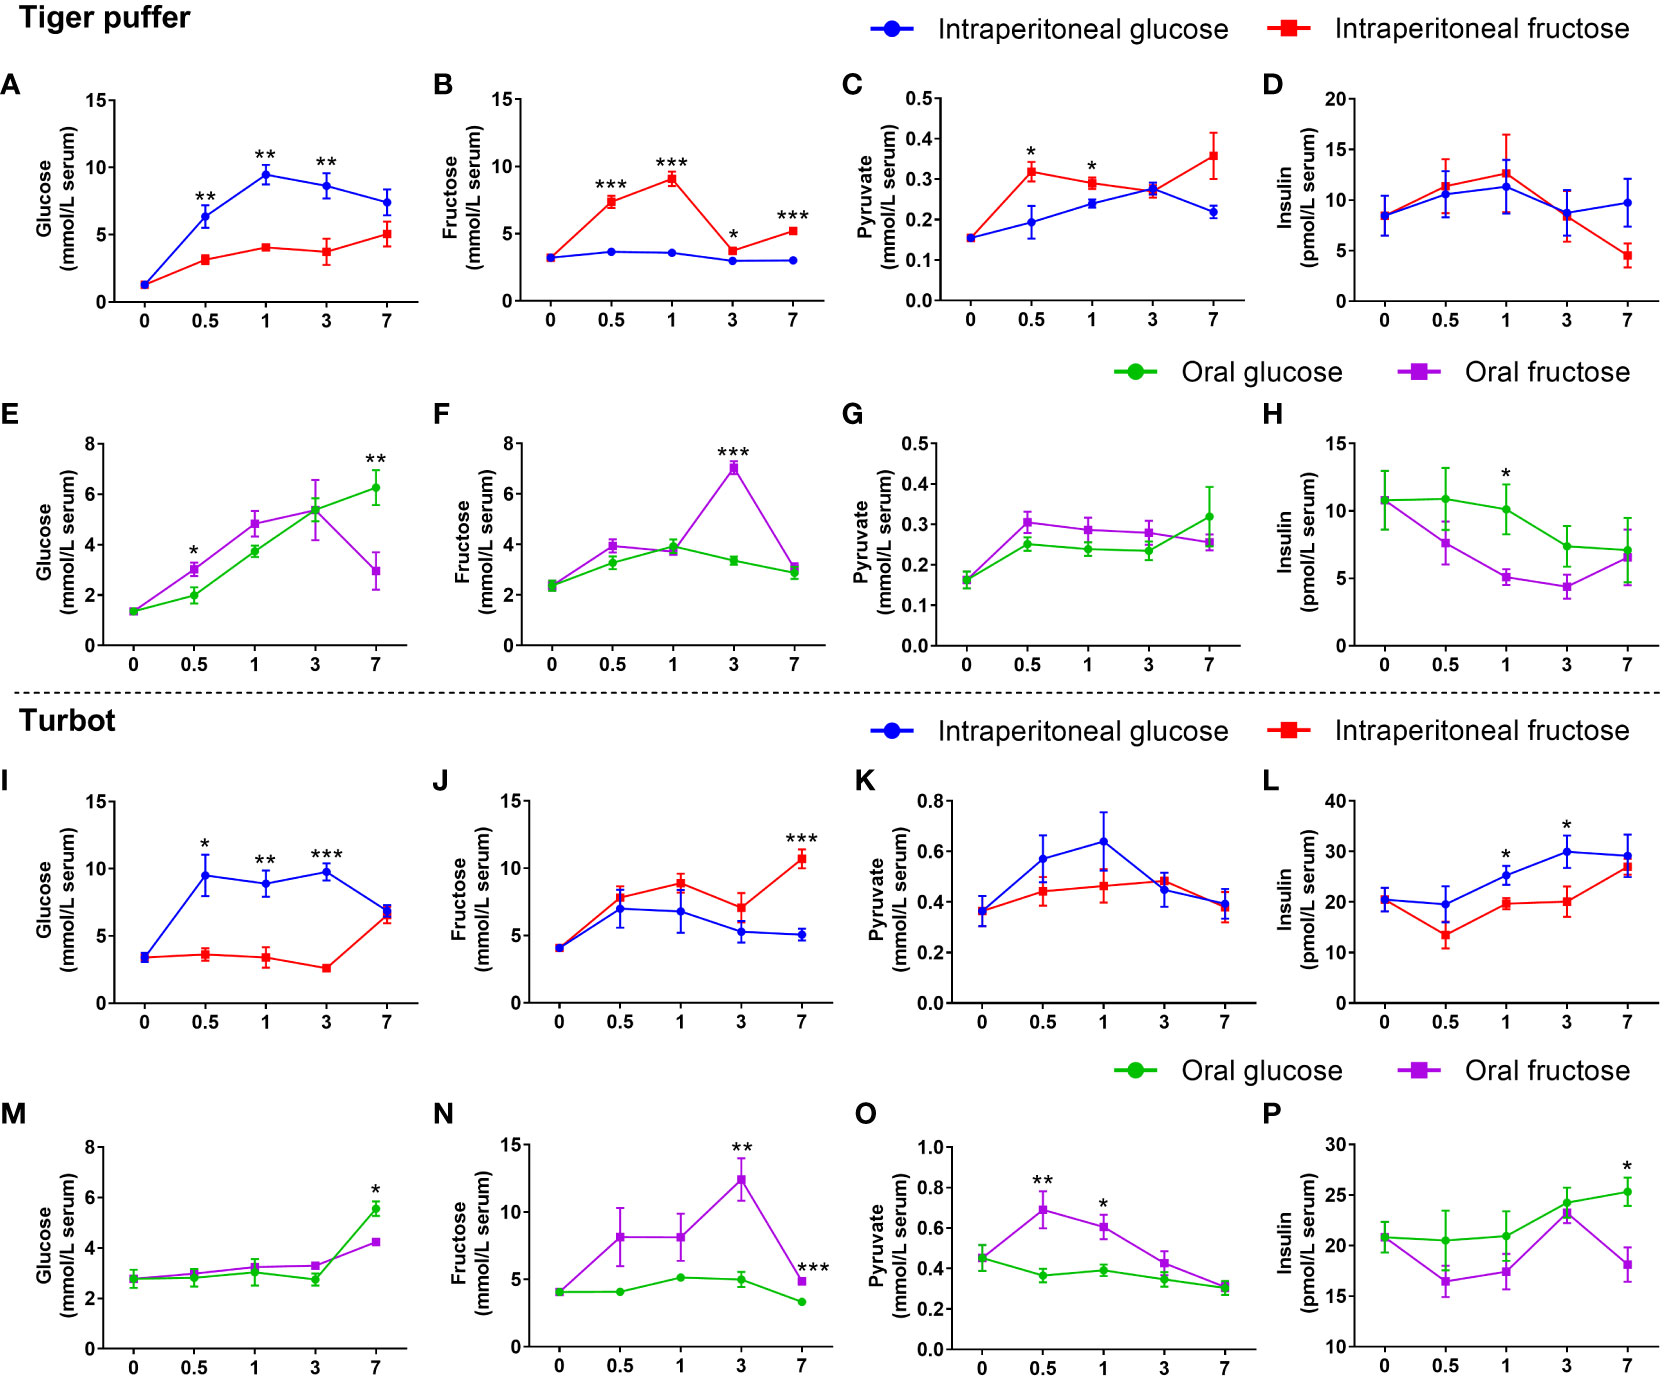
Figure 3 The differences between glucose and fructose utilization in fish. (A, E, I, M) glucose content. (B, F, J, N) fructose content. (C, G, K, O) pyruvate content. (D, H, L, P) insulin content. All values are means ± SEM (n=6). *(p < 0.05), **(p < 0.01), and ***(p < 0.001) indicate significant differences between glucose and fructose at the same sampling time (compared to the same data in Figure 2 in different ways).
In both tiger puffer and turbot, the oral glucose treatments had lower glucose content in the serum from 0.5 to 3 hours, but had significantly higher glucose content than the oral fructose after 7 hours (Figures 3E, M). In tiger puffer, the fish treated with oral fructose had significantly higher fructose content in the serum after 3 hours than the oral glucose treatment (Figure 3F). However, there was no significant effect on pyruvate levels between oral fructose and glucose treatments (Figure 3G). In turbot, the oral fructose treatment had significantly higher fructose and pyruvate contents in the serum than those treated with oral glucose treatment (Figures 3N, O). The oral glucose treatments had higher serum insulin content in both tiger puffer and turbot compared with oral fructose treatments (Figures 3H, P). All these results indicate that glucose and fructose may be converted to each other in fish. Glucose is a stronger stimulator of insulin secretion than fructose in the two marine fishes.
The intraperitoneal glucose treatments had significantly higher serum glucose content from 0.5 to 3 hours in the both tiger puffer and turbot compared with oral glucose treatments (Figures 4A, I). In turbot, intraperitoneal glucose treatment had higher fructose, pyruvate, and insulin contents in the serum than that in the oral glucose treatment (Figures 4J–L). However, these indicators did not change between intraperitoneal glucose and oral glucose treatments in tiger puffer (Figures 4B–D). In tiger puffer, the intraperitoneal fructose treatment had significantly higher serum fructose content at 0, 0.5, 1, and 7 hours (Figure 4F). Moreover, the intraperitoneal fructose treatment had higher insulin levels after 0.5, 1, and 3 hours than the oral fructose treatment (Figure 4H). However, the two administration methods did not affect glucose and pyruvate levels in the serum (Figures 4E, G). In turbot, the intraperitoneal fructose treatment had significantly higher serum glucose, fructose, and insulin contents only after 7 hours than the oral fructose treatment (Figures 4M, N, P). However, the intraperitoneal fructose treatment had a significantly lower fructose level after 3 hours and pyruvate level after 0.5 hour than the oral fructose treatment in the serum (Figures 4N, O). These data prove that intraperitoneal injection can promote the absorption and utilization of glucose compared with oral administration.
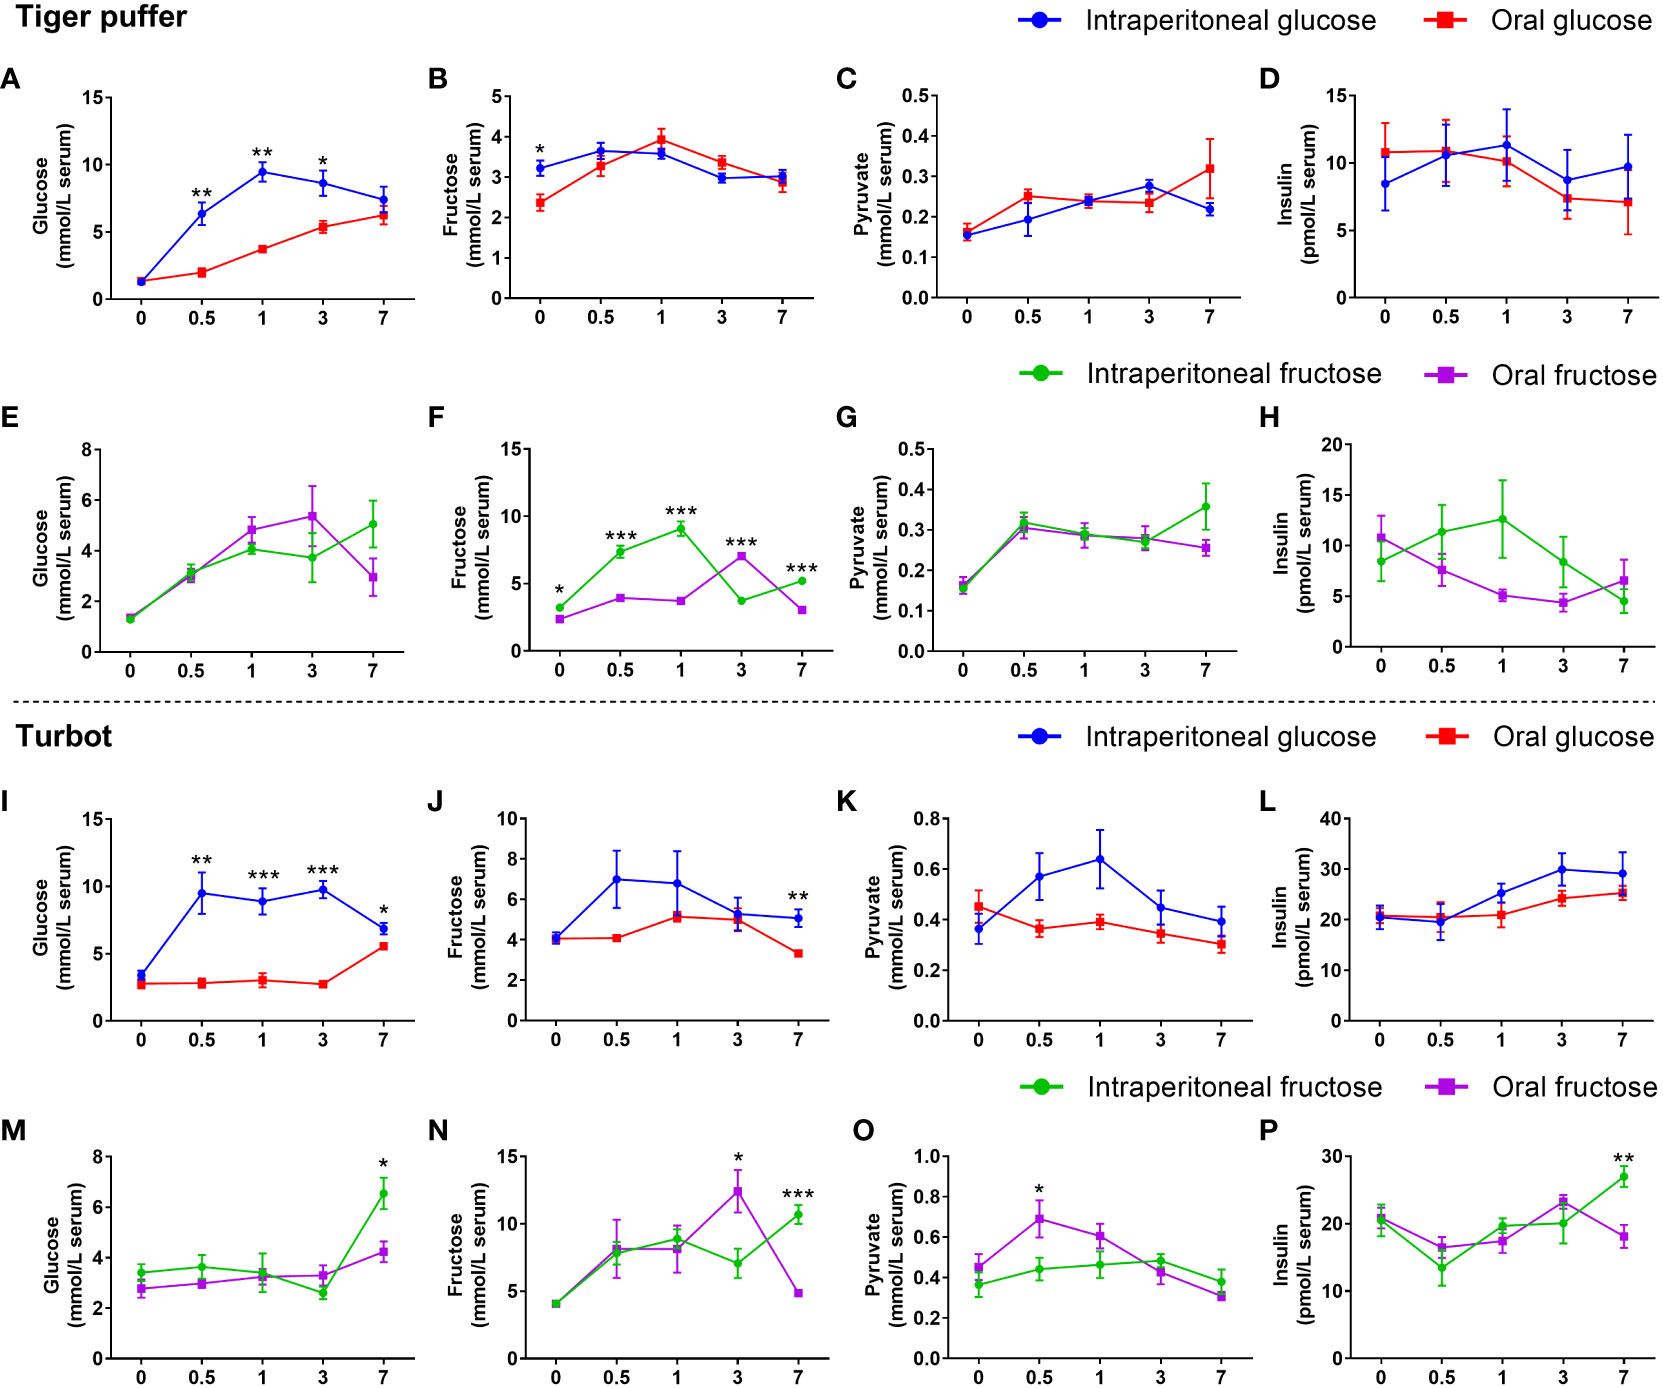
Figure 4 Effects of intraperitoneal injection and oral gavage on glucose or fructose utilization. (A, E, I, M) glucose content. (B, F, J, N) fructose content. (C, G, K, O) pyruvate content. (D, H, L, P) insulin content. All values are means ± SEM (n=6). *(p < 0.05), **(p < 0.01), and ***(p < 0.001) indicate significant differences between intraperitoneal injection and oral gavage at the same sampling time (compared to the same data of Figure 2 in different ways).
The hypoxic survival rate of the eight fish species is shown in Figure 5. Turbot (Scophthalmus maximus) was the most intolerant to hypoxia, while pearl gentian grouper (Epinephelus fuscoguttatus♀ × Epinephelus lanceolatus♂) was the most tolerant to hypoxia (Figures 5A). The hypoxia tolerance ability of the eight species was in the order: turbot (Scophthalmus maximus) < tiger puffer (Takifugu rubripes) < half-smooth tongue sole (Cynoglossus semilaevis) < goby (Acanthogobius ommaturus) < Japanese sea bass (Lateolabrax japonicas) < grey mullet (Mugil cephalus Linnaeus) < yunlong grouper (Epinephelus moara ♀× Epinephelus lanceolatus♂) < pearl gentian grouper (Epinephelus fuscoguttatus♀ × Epinephelus lanceolatus♂). Both turbot and tiger puffer were intolerant to hypoxia. However, there were distinct physiological differences between the two fish species. Tiger puffer had a significantly higher liver fat level than turbot (Figure 5B). However, liver glycogen content was significantly lower in tiger puffer than turbot (Figure 5C). Intraperitoneal glucose (IG), intraperitoneal fructose (IF), oral glucose (OG), and oral fructose (OF) treatments all increased hypoxic survival rate compared with the normal saline (NS) treatment, and the significances were found in the OG treatment in tiger puffer and in the IG and IF treatments in turbot (Figures 5D, F). Meanwhile, the fish treated with OG, IG, OF, and IF all had significantly higher serum lactate levels than the NS treatment both in turbot and tiger puffer (Figures 5E, G). These data suggest that supplementation with glucose or fructose can improve hypoxia tolerance in the two fish species.
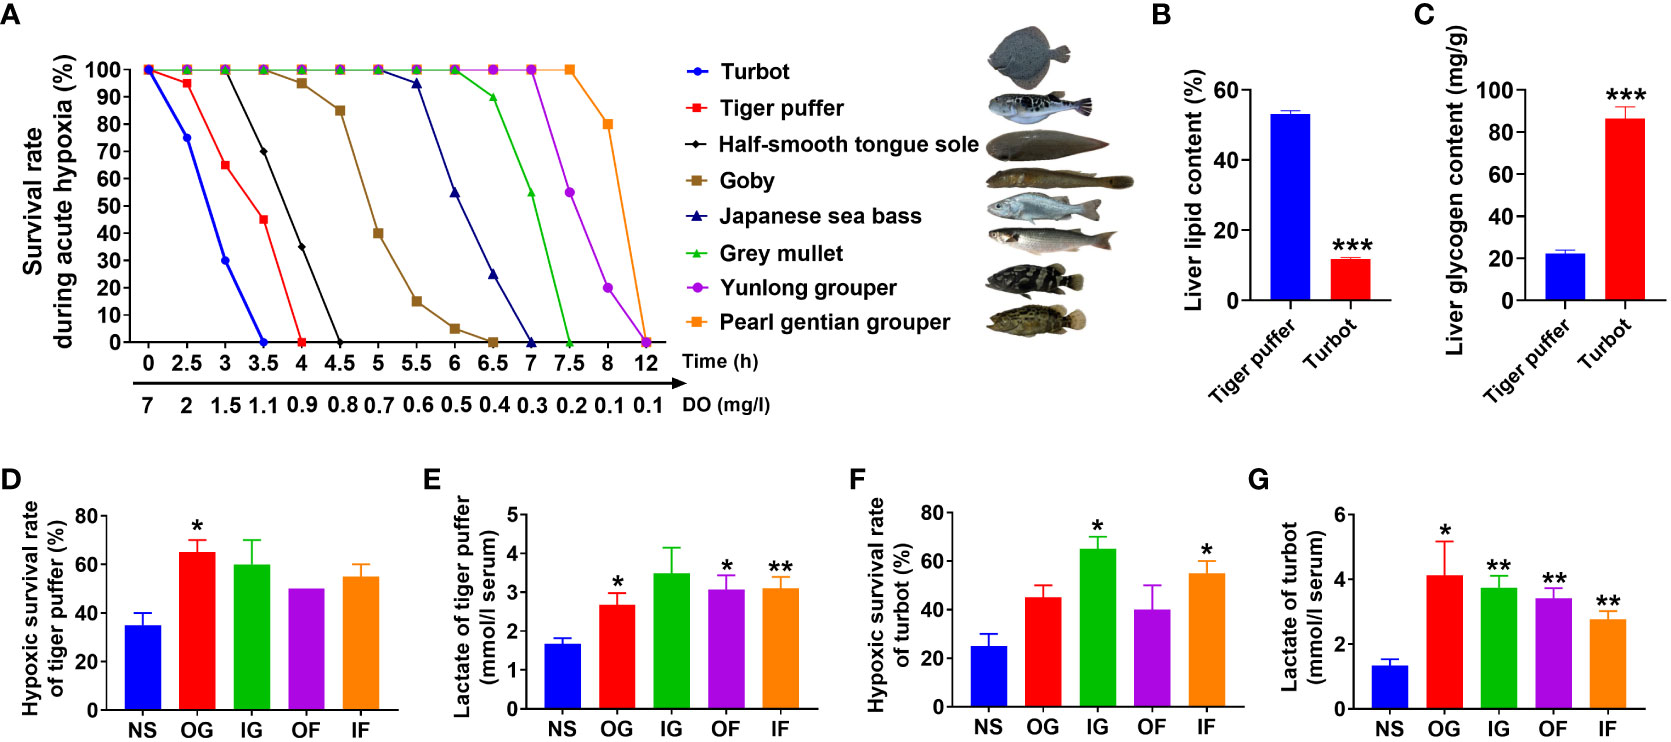
Figure 5 Effects of glucose and fructose utilization on acute hypoxia tolerance. (A) The survival rates of 8 marine fish species under acute hypoxia (values are means of two replications, n=20). (B) Liver lipid content in the tiger puffer and turbot. (C) Liver glycogen content in the tiger puffer and turbot. (D) Survival rate of tiger puffer with intraperitoneal and oral glucose or fructose after 2 h acute hypoxia stress. (E) Serum lactate content of tiger puffer after 2 h acute hypoxia. (F) Survival rate of turbot with intraperitoneal and oral glucose or fructose after 2 h acute hypoxia stress. (G) Serum lactate content of turbot after 2 h acute hypoxia (values are means ± SEM, n=4). *(p < 0.05) and **(p < 0.01) indicate significant differences between OG (oral glucose), IG (intraperitoneal glucose), OF (oral fructose), IF (intraperitoneal fructose) group, and NS (normal saline) group. ***(p < 0.001) indicates significant differences between tiger puffer and turbot.
Fish especially carnivorous fish, have a limited ability to utilize carbohydrates in their diet and commonly show postprandial hyperglycemia for extended periods. GTT is an important tool to evaluate the ability of fish to utilize glucose, which can be performed orally or intraperitoneally (Enes et al., 2009; Liu et al., 2018). In omnivorous fishes such as hybrid Amazon catfish (Pseudoplatystoma fasciatum × Leiarius marmoratus) and traíra (Hoplias malabaricus), the serum glucose content rose to the highest point from 2 to 4 hours and declined to baseline after 16 hours post-IPGTT at 1000 mg glucose/kg body weight (De Souza et al., 2021). However, intraperitoneal fructose injection did not affect serum glucose level (De Souza et al., 2021). In omnivorous fishes such as Nile tilapia and piau (Leporinus elongatus), serum glucose content rose to the highest point from 0.5 to 1 hour and declined to baseline at 8 hours post-IPGTT at 1000 mg glucose/kg body weight (De Souza et al., 2021). In grass carp (Ctenopharyngodon idellus), serum glucose content peaked after 1 hour and returned to normal level after 12 hours post intraperitoneal glucose at 300 mg glucose/kg body weight (Li et al., 2018b). In the fruit-eating fish Piaractus mesopotamicus, oral admission with three types of carbohydrates (glucose, fructose, and starch at 2000 mg/kg body weight) all resulted in raised blood glucose content (Takahashi et al., 2018). The highest blood glucose content was reached after 2 hours post oral fructose and 4 hours post oral glucose or starch, respectively, and glucose content recovered to baseline level within 12 hours after carbohydrates gavage (Takahashi et al., 2018). In grass carp, the high-carbohydrate treatment (60% corn starch) had increased glucose tolerance, glycogen content, and glucokinase (Gk, key enzyme of glycolysis) activity in the liver compared to the low-carbohydrate treatment (20% corn starch). However, the liver had lower phosphoenolpyruvate carboxykinase (Pepck, key enzyme of gluconeogenesis) activity than the low-carbohydrate treatment (Li et al., 2018b). In Nile tilapia, a high-carbohydrate diet (32.3% corn starch) lowered weight gain and condition factor versus the low-carbohydrate treatment (13.1% corn starch) (Chen et al., 2020). However, increased hepatosomatic index, intraperitoneal fat ratio, glucose and triglyceride contents in the serum, glycogen content, phosphofructokinase (Pfk) activity, and mRNA expression of glucose transporter (glut2/4) and pfk in the liver and white muscle (Chen et al., 2020). These results confirm that omnivorous fish have the ability to clear glucose more quickly than carnivorous fish. In the present study, we found that intraperitoneal glucose injected fish first increased and then decreased the serum glucose level with the extension of sampling time, and reached the peak after 0.5 hours in turbot and after 1 hour in tiger puffer, which proved that, the two marine fishes had the ability to clear excessive glucose. However, the time for blood glucose to return to normal level was slower than in some omnivorous freshwater fishes.
In mammals, insulin is one of the key anabolic hormones for maintaining glucose homeostasis by stimulating postprandial glucose uptake in peripheral tissues, promoting glycogen and lipid synthesis, and inhibiting gluconeogenesis in the liver (Saltiel and Kahn, 2001). Intraperitoneal glucose at 1000 mg glucose/kg body weight increased serum glucose concentration that reached the peak after 2 to 6 hours and returned to normal level after 12 hours post-IPGTT (Conde-Sieira et al., 2015). However, it did not change the serum insulin content in European sea bass (Dicentrarchus labrax) (Conde-Sieira et al., 2015). In white sea bream (Diplodus sargus), serum glucose and insulin contents were increased and reached the peak after 2 hours and returned to normal levels after 9 hours post intraperitoneal glucose at 1000 mg glucose/kg body weight (Enes et al., 2012). On the contrary, IPGTT reduced the insulin content of serum in Japanese flounder (Liu et al., 2018). In the present study, we found that intraperitoneal glucose, oral glucose, and intraperitoneal fructose all increased the serum insulin content in turbot, but did not change the serum insulin level in the tiger puffer, while oral fructose even decreased the serum insulin content in the tiger puffer. The above data suggest that glucose and fructose only induce insulin secretion in turbot, but not in tiger puffer. The decrease of serum glucose after GTT in tiger puffer may not be insulin-dependent. Meanwhile, intraperitoneal or oral glucose treatments had higher serum insulin content than the intraperitoneal or oral fructose treatments, which indicated that glucose is a stronger stimulator of insulin than fructose in fish. In rainbow trout (Oncorhynchus mykiss), dietary glucose increased gk gene expression in the liver, but dietary fructose did not affect the expression of the gk gene (Panserat et al., 2001). In omnivorous fish species, intraperitoneal fructose at 1000 mg glucose/kg body weight did not affect serum glucose level in Nile tilapia and piau, but increased serum glucose level in tambaqui (Colossoma macropomum) (De Souza et al., 2021). In the present study, we found that intraperitoneal or oral fructose all increased serum glucose levels, and intraperitoneal or oral glucose also increased serum fructose levels. These results indicate that glucose and fructose may be converted to each other in fish. However, the mechanism of the interconversion of the two monosaccharides is still unclear. In addition, the serum glucose, fructose, pyruvate, and insulin contents in turbot were all higher than those in the tiger puffer. Tiger puffer is a fish that stores fat mainly in the liver, and has significantly higher liver fat content than turbot. However, turbot has significantly higher liver glycogen content than tiger puffer. These physiological differences suggest that turbot may have better glucose utilization than tiger puffer. In Senegalese sole (Solea senegalensis) intraperitoneal glucose at 600 mg glucose/kg body weight, increased first and then decreased serum glucose level with the extension of sampling time, and reached a peak after 4 hours and returned to normal level after 24 hours post IPGTT. However, oral glucose feeding at 1000 mg glucose/kg body weight increased serum glucose level that reached a peak after 1 hour and returned to normal level after 10 hours post OGTT (Conde-Sieira et al., 2015). In the present study, we found that in oral glucose treatments, the serum glucose level showed a continuously increasing trend in the two marine fishes. Indeed, the glucose absorption and metabolism rates in intraperitoneal glucose treatments were faster than in oral glucose treatments. These data prove that compared with oral administration (into the intestine), intraperitoneal injection can promote the absorption and utilization of glucose, which indicates slow intestinal digestion and absorption of carbohydrates may be responsible for persistent postprandial hyperglycemia in marine carnivorous fish.
With the rapid development of marine fish farming, acute hypoxia stress has been a common and harmful stress in aquaculture. In Norway and Chile, the high-density culture mode of salmon requires high dissolved oxygen levels, and uncontrollable ocean currents, which cause acute hypoxia, resulting in massive mortality and serious economic losses (Martínez et al., 2020). However, few studies have been conducted to improve hypoxia tolerance in marine fish. In the present study, we selected eight marine fish species to perform acute hypoxia stress simultaneously. We found that the hypoxia tolerance ability of the eight species was in the order: turbot < tiger puffer < half-smooth tongue sole < goby < Japanese sea bass < grey mullet < yunlong grouper < pearl gentian grouper, which proved that both turbot and tiger puffer are very intolerant to acute hypoxia. In a hypoxia environment, the naked mole-rat increased fructose concentration in the liver, kidney, and blood, while fructose but not glucose entered anaerobic glycolysis to produce energy and lactate by activating GLUT5 and KHK (Park et al., 2017). In zebrafish, feeding a high-carbohydrate diet increased the survival rate during acute hypoxia stress by activating the anaerobic glycolysis pathway (Ma et al., 2020). Crucian carp (Carassius auratus) are the most hypoxia-tolerant vertebrates and can survive for months in water without any oxygen. In hypoxia, glucose from the liver glycogen produces energy and lactate via an anaerobic glycolysis pathway, and lactate can be converted to ethanol that is excreted into water from the gills to avoid acidosis (Shoubridge Eric and Hochachka, 1980). In our study, intraperitoneal or oral glucose or fructose both increased survival rate and serum lactate level after acute hypoxia than the normal saline treatment in turbot and tiger puffer. Our study proved that supplementation with glucose or fructose improves hypoxia tolerance in the two marine fishes.
Turbot and tiger puffer are able to clear excessive glucose after GTT, but the time for serum glucose to return to normal level was slower than some omnivorous fishes. Tiger puffer has lower liver glycogen, serum glucose, fructose, pyruvate, and insulin contents than turbot. Glucose and fructose only induce insulin secretion in turbot, but did not change serum insulin level in tiger puffer. Glucose is a stronger stimulator of insulin than fructose, and glucose and fructose may be converted to each other in the two fish species. Intraperitoneal glucose promotes the absorption and utilization of glucose more than oral glucose. Turbot and tiger puffer are intolerant to acute hypoxia. However, supplementation with glucose or fructose improves hypoxia tolerance in the two marine fishes by activating anaerobic glycolysis. Our results help to understand the mechanism glucose and fructose utilization in fish and provide guidance to improve fish tolerance to acute hypoxia.
The original contributions presented in the study are included in the article/supplementary material. Further inquiries can be directed to the corresponding author.
The animal study was approved by Yellow Sea Fisheries Research Institute, Chinese Academy of Fishery Sciences. The study was conducted in accordance with the local legislation and institutional requirements.
QM: Conceptualization, Data curation, Formal Analysis, Funding acquisition, Investigation, Methodology, Writing – original draft, Writing – review & editing. HX: Data curation, Formal Analysis, Methodology, Writing – review & editing. SML: Formal Analysis, Writing – review & editing. YW: Methodology, Writing – review & editing, Data curation, Formal Analysis. ML: Formal Analysis, Writing – review & editing, Data curation, Methodology.
The author(s) declare financial support was received for the research, authorship, and/or publication of this article. This work was supported by the National Natural Science Foundation of China (32202950), the China Postdoctoral Science Foundation (2022M713471), the Central Public-interest Scientific Institution Basal Research Fund, CAFS (2023TD52), and the earmarked fund for China Agriculture Research System (CARS47-G15).
We thank Dr. Zhang-Bin Liao for technical assistance in the study.
The authors declare that the research was conducted in the absence of any commercial or financial relationships that could be construed as a potential conflict of interest.
All claims expressed in this article are solely those of the authors and do not necessarily represent those of their affiliated organizations, or those of the publisher, the editors, and the reviewers. Any product that may be evaluated in this article, or claim that may be made by its manufacturer, is not guaranteed or endorsed by the publisher.
Alexander C., Sahu N. P., Pal A. K., Akhtar M. S., Saravanan S., Xavier B., et al. (2011). Higher water temperature enhances dietary carbohydrate utilization and growth performance in Labeo rohita (Hamilton) fingerlings. J. Anim. Physiol. An. N. 95, 642–652. doi: 10.1111/j.1439-0396.2010.01095.x
Blasco J., Marimon I., Viaplana I., Fernandez-Borras J. (2001). Fate of plasma glucose in tissues of brown trout in vivo: effects of fasting and glucose loading. Fish Physiol. Biochem. 24, 247–258. doi: 10.1023/A:1014084313207
Caruso M. A., Sheridan M. A. (2011). New insights into the signaling system and function of insulin in fish. Gen. Comp. Endocr. 173, 227–247. doi: 10.1016/j.ygcen.2011.06.014
Chen J. X., Feng J. Y., Zhu J., Luo L., Lin S. M., Wang D. S., et al. (2020). Starch to protein ratios in practical diets for genetically improved farmed Nile tilapia Oreochromis niloticus: Effects on growth, body composition, peripheral glucose metabolism and glucose tolerance. Aquaculture 515, 734538. doi: 10.1016/j.aquaculture.2019.734538
Conde-Sieira M., Soengas J. L., Valente L. M. P. (2015). Potential capacity of Senegalese sole (Solea Senegalensis) to use carbohydrates: Metabolic responses to hypo- and hyper-glycaemia. Aquaculture 438, 59–67. doi: 10.1016/j.aquaculture.2014.12.042
De Souza A. M., Copatti C. E., Campeche D. F. B., De Melo F. V. S. T., Melo J. F. B. (2021). Glucose tolerance in six fish species reared in Brazil: Differences between carnivorous and omnivorous. An. Acad. Bras. Cienc. 93, e20201541. doi: 10.1590/0001-3765202120201541
Eames S. C., Philipson L. H., Prince V. E., Kinkel M. D. (2010). Blood sugar measurement in zebrafish reveals dynamics of glucose homeostasis. Zebrafish 7, 205–213. doi: 10.1089/zeb.2009.0640
Enes P., Panserat S., Kaushik S., Oliva-Teles A. (2009). Nutritional regulation of hepatic glucose metabolism in fish. Fish Physiol. Biochem. 35, 519–539. doi: 10.1007/s10695-008-9259-5
Enes P., Peres H., Pousao-Ferreira P., Sanchez-Gurmaches J., Navarro I., Gutierrez J., et al. (2012). Glycemic and insulin responses in white sea bream Diplodus sargus, after intraperitoneal administration of glucose. Fish Physiol. Biochem. 38, 645–652. doi: 10.1007/s10695-011-9546-4
Havel P. J. (2005). Dietary fructose: Implications for dysregulation of energy homeostasis and lipid/carbohydrate metabolism. Nutr. Rev. 63, 133–157. doi: 10.1301/nr.2005.may.133-157
Hemre G. I., Hansen T. (1998). Utilisation of different dietary starch sources and tolerance to glucose loading in Atlantic salmon (Salmo salar), during parr-smolt transformation. Aquaculture 161, 145–157. doi: 10.1016/S0044-8486(97)00266-4
Hemre G. I., Mommsen T. P., Krogdahl A. (2002). Carbohydrates in fish nutrition: effects on growth, glucose metabolism and hepatic enzymes. Aquacult. Nutr. 8, 175–194. doi: 10.1046/j.1365-2095.2002.00200.x
Jiang M., Liu W., Wen H., Huang F., Wu F., Tian J., et al. (2014). Effect of dietary carbohydrate sources on the growth performance, feed utilization, muscle composition, postprandial glycemic and glycogen response of Amur sturgeon, Acipenser schrenckii Brand. J. Appl. Ichthyol. 30, 1613–1619. doi: 10.1111/jai.12600
Kamalam B. S., Medale F., Panserat S. (2017). Utilisation of dietary carbohydrates in farmed fishes: New insights on influencing factors, biological limitations and future strategies. Aquaculture 467, 3–27. doi: 10.1016/j.aquaculture.2016.02.007
Koukourakis M. I., Giatromanolaki A., Skarlatos J., Corti L., Blandamura S., Piazza M., et al. (2001). Hypoxia inducible factor (HIF-1a and HIF-2a) expression in early esophageal cancer and response to photodynamic therapy and radiotherapy. Cancer Res. 61, 1830–1832. doi: 10.1046/j.1523-5394.2001.009002104.x
Landman M. J., Van Den Heuvel M. R., Ling N. (2005). Relative sensitivities of common freshwater fish and invertebrates to acute hypoxia. New. Zeal. J. Mar. Fresh. 39, 1061–1067. doi: 10.1080/00288330.2005.9517375
Li M., Wang X., Qi C., Li E., Du Z., Qin J. G., et al. (2018a). Metabolic response of Nile tilapia (Oreochromis niloticus) to acute and chronic hypoxia stress. Aquaculture 495, 187–195. doi: 10.1016/j.aquaculture.2018.05.031
Li R. X., Liu H. Y., Chen Q., Tan B. P., Dong X. H., Chi S. Y., et al. (2018b). Glucose tolerance of grass carp Ctenopharyngodon idellus after a long-term adaptation to carbohydrate-to-lipid ratio diets. Aquac. Res. 49, 3881–3888. doi: 10.1111/are.13856
Li S., Wang A., Wei Z., Liu R., Wang D., Chen N. (2021). Insulin receptors in largemouth bass (Micropterus salmoides): Cloning, characterization, tissue expression profile and transcriptional response to glucose tolerance test. Aquac. Res. 52, 625–634. doi: 10.1111/are.14919
Liu D., Guo B., Han D., Deng K., Gu Z., Yang M., et al. (2018). Comparatively study on the insulin-regulated glucose homeostasis through brain-gut peptides in Japanese flounder Paralichthys olivaceus after intraperitoneal and oral administration of glucose. Gen. Comp. Endocr. 266, 9–20. doi: 10.1016/j.ygcen.2018.02.013
Ma Q., Hu C. T., Yue J., Luo Y., Qiao F., Chen L. Q., et al. (2020). High-carbohydrate diet promotes the adaptation to acute hypoxia in zebrafish. Fish Physiol. Biochem. 46, 665–679. doi: 10.1007/s10695-019-00742-2
Ma Q., Luo Y., Zhong J., Limbu S. M., Li L. Y., Chen L. Q., et al. (2023a). Hypoxia tolerance in fish depends on catabolic preference between lipids and carbohydrates. Zool. Res. 44, 954–966. doi: 10.24272/j.issn.2095-8137.2023.098
Ma Q., Xu H., Wei Y., Liang M. (2023b). Effects of acute hypoxia on nutrient metabolism and physiological function in turbot, Scophthalmus maximus. Fish Physiol. Biochem. doi: 10.1007/s10695-022-01154-5
Martínez D., De Lázaro O., Cortés P., Oyarzún-Salazar R., Paschke K., Vargas-Chacoff L. (2020). Hypoxia modulates the transcriptional immunological response in Oncorhynchus kisutch. Fish Shellfish. Immun. 106, 1042–1051. doi: 10.1016/j.fsi.2020.09.025
Moon T. W. (2001). Glucose intolerance in teleost fish: fact or fiction? Comp. Biochem. Phys. B. 129, 243–249. doi: 10.1016/S1096-4959(01)00316-5
Panserat S., Capilla E., Gutierrez J., Vachot C., Plagnes-Juan E., Aguirre P., et al. (2001). Dietary fructose does not specifically induce hepatic glucokinase expression in rainbow trout. J. Fish Biol. 59, 455–458. doi: 10.1111/j.1095-8649.2001.tb00144.x
Panserat S., Medale F., Blin C., Breque J., Vachot C., Plagnes-Juan E., et al. (2000). Hepatic glucokinase is induced by dietary carbohydrates in rainbow trout, gilthead seabream, and common carp. Am. J. Physiol-Reg. I. 278, R1164–R1170. doi: 10.1152/ajpregu.2000.278.5.R1164
Park T. J., Reznick J., Peterson B. L., Blass G., Omerbasic D., Bennett N. C., et al. (2017). Fructose-driven glycolysis supports anoxia resistance in the naked mole-rat. Science 356, 305–308. doi: 10.1126/science.aab3896
Ren M., Ai Q., Mai K., Ma H., Wang X. (2011). Effect of dietary carbohydrate level on growth performance, body composition, apparent digestibility coefficient and digestive enzyme activities of juvenile cobia. Rachycentron canadum L. Aquac. Res. 42, 1467–1475. doi: 10.1111/j.1365-2109.2010.02739.x
Saltiel A. R., Kahn C. R. (2001). Insulin signalling and the regulation of glucose and lipid metabolism. Nature 414, 799–806. doi: 10.1038/414799a
Shoubridge Eric A., Hochachka P. W. (1980). Ethanol: novel end product of vertebrate anaerobic metabolism. Science 209, 308–309. doi: 10.1126/science.7384807
Stone D. A. J. (2003). Dietary carbohydrate utilization by fish. Rev. Fish Sci. 11, 337–369. doi: 10.1080/10641260390260884
Takahashi L. S., Ha N., Pereira M. M., Biller-Takahashi J. D., Urbinati E. C. (2018). Carbohydrate tolerance in the fruit-eating fish Piaractus mesopotamicus (Holmber). Aquac. Res. 49, 1182–1188. doi: 10.1111/are.13571
Tesz G. J., Bence K. K. (2020). Finding the sweet spot: parsing tissue-specific contributions of fructose metabolism. Cell Metab. 32, 6–8. doi: 10.1016/j.cmet.2020.06.009
Tolan D. R. (2007). Fructose metabolism in the cerebellum. Cerebellum 6, 130–140. doi: 10.1080/14734220601064759
Tuomilehto J., Lindstrom J., Eriksson J. G., Valle T. T., Hamalainen H., Ilanne-Parikka P., et al. (2001). Prevention of type 2 diabetes mellitus by changes in lifestyle among subjects with impaired glucose tolerance. New Engl. J. Med. 344, 1343–1350. doi: 10.1056/NEJM200105033441801
Wu R. S. S., Zhou B. S., Randall D. J., Woo N. Y. S., Lam P. K. S. (2003). Aquatic hypoxia is an endocrine disruptor and impairs fish reproduction. Environ. Sci. Technol. 37, 1137–1141. doi: 10.1021/es0258327
Zhang Y., Wei Z., Liu G., Deng K., Yang M., Pan M., et al. (2019). Synergistic effects of dietary carbohydrate and taurine on growth performance, digestive enzyme activities and glucose metabolism in juvenile turbot. Scophthalmus maximus L. Aquaculture 499, 32–41. doi: 10.1016/j.aquaculture.2018.08.082
Keywords: glucose tolerance test, fructose tolerance test, carbohydrate utilization, insulin secretion, hypoxia tolerance
Citation: Ma Q, Xu H, Limbu SM, Wei Y and Liang M (2023) Comparative analysis of glucose and fructose tolerance in two marine fishes: effects on insulin secretion and acute hypoxia tolerance. Front. Mar. Sci. 10:1310415. doi: 10.3389/fmars.2023.1310415
Received: 09 October 2023; Accepted: 16 November 2023;
Published: 30 November 2023.
Edited by:
Yiming Li, Fishery Machinery and Instrument Research Institute, ChinaReviewed by:
Yulong Gong, Chinese Academy of Sciences (CAS), ChinaCopyright © 2023 Ma, Xu, Limbu, Wei and Liang. This is an open-access article distributed under the terms of the Creative Commons Attribution License (CC BY). The use, distribution or reproduction in other forums is permitted, provided the original author(s) and the copyright owner(s) are credited and that the original publication in this journal is cited, in accordance with accepted academic practice. No use, distribution or reproduction is permitted which does not comply with these terms.
*Correspondence: Mengqing Liang, bGlhbmdtcUB5c2ZyaS5hYy5jbg==
Disclaimer: All claims expressed in this article are solely those of the authors and do not necessarily represent those of their affiliated organizations, or those of the publisher, the editors and the reviewers. Any product that may be evaluated in this article or claim that may be made by its manufacturer is not guaranteed or endorsed by the publisher.
Research integrity at Frontiers
Learn more about the work of our research integrity team to safeguard the quality of each article we publish.