 Qiaojun Chen1,2
 Delei Li
 Jianlong Feng
 Liang Zhao
 Jifeng Qi
 Baoshu Yin
- 1Key Laboratory of Marine Resource Chemistry and Food Technology (TUST), Tianjin University of Science and Technology, Tianjin, China
- 2CAS Key Laboratory of Ocean Circulation and Waves, Institute of Oceanology, Chinese Academy of Sciences, Qingdao, China
- 3College of Earth and Planetary Sciences, University of Chinese Academy of Sciences, Beijing, China
- 4CAS Engineering Laboratory for Marine Ranching, Institute of Oceanology, Chinese Academy of Sciences, Qingdao, China
The western Pacific Ocean is the global center for marine biodiversity, with high vulnerability to climate change. A better understanding of the spatiotemporal characteristics and potential drivers of compound marine heatwaves (MHWs) and low-chlorophyll (LChl) extreme events is essential for the conservation and management of local marine organisms and ecosystems. Here, using daily satellite sea surface temperature and model-based chlorophyll concentration, we find that the climatological spatial distribution of MHW-LChl events in total days, duration, and intensity exhibits heterogeneous distributions. The southwest sections of the South China Sea (WSCS) and Indonesian Seas are the hotspots for compound events, with total MHW-LChl days that are more than 2.5 times higher than in the other sub-regions. Notably, there is a trend toward more frequent (> 4.2 d/decade), stronger (> 0.5), and longer-lasting (> 1.4 d/decade) MHW-LChl occurrences in the WSCS. The occurrence of compound MHW-LChl extremes exhibits remarkable seasonal differences, with the majority of these events transpiring during winter. Moreover, there are generally statistically significant increasing trends in MHW-LChl events for all properties on both seasonal and inter-annual timescales. Furthermore, we reveal that the total days of compound MHW-LChl extremes are strongly modulated by large-scale climate modes such as the El Niño-Southern Oscillation and Dipole Mode Index. Overall, pinpointing MHW-LChl hotspots and understanding their changes and drivers help vulnerable communities in better preparing for heightened and compounded risks to marine organism and ecosystems under climate change.
1 Introduction
Compound extremes are a combination of multiple drivers and/or hazards factors that can cause more severe societal or environmental risks compared to single hazards (Zscheischler et al., 2018; IPCC, 2019). For example, compound flooding events induced by extreme rainfall, tropical cyclones, and storm surges have caused over USD 71 billion in direct economic losses and 4376 fatalities in China from 1989 to 2014 (Fang et al., 2017). Extreme heatwaves and wildfires continued to plague parts of the Mediterranean and North Africa in the summer of 2021, aggravating the spread of wildfires in Greece, Turkey, El Salvador, and elsewhere (Bezak and Mikoš, 2020; Founda et al., 2022). Furthermore, climate change projections suggest that these compound extremes will increase worldwide over the coming decades (IPCC, 2021). However, most studies are currently focused on land (Zscheischler et al., 2020), and little is known about compound extremes in the ocean (Collins et al., 2019).
One of the most advanced areas is the compound events caused by marine heatwave (MHW) and ocean biogeochemical extreme events (e.g., compound MHW and low-chlorophyll extremes, compound MHW and ocean acidity extremes, compound MHW and low-oxygen extremes, and so on) (Gruber et al., 2021), which pose a predominant risk to marine ecosystems under anthropogenic climate change. Marine heatwaves (MHWs) are discrete periods of anomalously high sea surface temperatures (SST) (Hobday et al., 2016). They can have catastrophic effects on marine ecosystems, including mass coral bleaching and significant losses in kelp forests and seagrass meadows (Thomson et al., 2015; Wernberg et al., 2016; Arias-Ortiz et al., 2018).
While MHWs may increase the death of some marine organisms by altering the living environment (e.g., nutrient-limited, loss of dissolved oxygen, and increased hydrogen ion concentration), low productivity also threatens marine environments whose food webs depend on phytoplankton. Furthermore, MHWs will result in more frequent low-chlorophyll (LChl) events and further exacerbate the impacts on ecosystems and society through their co-occurring interactions (Boyd and Brown, 2015). The most typical example of a compound MHW and LChl extreme is the “Blob” in the northeast Pacific over 2013–2015, which was the longest-lasting and most intense on record of MHW across the region (Jacox et al., 2016; Laufkötter et al., 2020). Initially, the “Blob” coincided with large negative anomalies in phytoplankton abundance associated with reduced coastal upwelling in the California Current, resulting in LChl throughout spring and summer (Leising et al., 2015; Whitney, 2015). Later in 2014–2015, the MHW-LChl event extended further south to the eastern equatorial Pacific. These compound extremes had exceedingly severe impacts on marine ecosystems and biodiversity, including low primary productivity (Whitney, 2015; Jacox et al., 2016), toxic algal blooms (Walsh et al., 2018), extreme mortality of mammals (Cavole et al., 2016), reduced commercially important fish species (Caputi et al., 2016; Jacox, 2019), and large-scale shifts towards favoring warm-water species (Cheung and Frölicher, 2020). In recent years, there are also some studies forced on the occurrence, intensity, and duration of compound MHW-LChl events. Gupta et al. (2020) found that the most extreme MHWs tended to coincide with reduced chlorophyll-a concentrations at low and mid-latitudes. Le Grix et al. (2021) assessed the compound MHW-LChl events over the satellite period, and concluded that their occurrence is mostly modulated by the El Niño-Southern Oscillation (ENSO) and other climate modes. Nevertheless, current research mainly focuses on compound MHW-LChl extremes across the global ocean, has not yet fully revealed their multi-scale spatiotemporal variations and mechanisms in different ocean areas, leaving regional systematic studies relatively unexplored.
The western Pacific Ocean is the global center for marine biodiversity and of high vulnerability to climate change (Kong et al., 2019). Previous studies indicated that this region has experienced a greater increase in the frequency of MHWs, which overlaps with existing hotspots of marine biodiversity, high thermal sensitivity of species, and non-climatic human stressors (Oliver et al., 2018; Smale et al., 2019). Li et al. (2023) reported that a record-breaking MHW occurred in the northwest Pacific Ocean in July 2021, with the potential to increase about 43 times due to anthropogenic warming. Moreover, several studies have found more frequent, intense, extensive, and longer-lasting MHWs in the South China Sea, mainly influenced by the anomalous western North Pacific subtropical high and the strong regulation of the ENSO (Li Y. et al., 2022;; Liu et al., 2022; Tan et al., 2022). There are also some research indications that the LChl extremes in this region are related to MHWs. Mandal et al. (2022) suggested that the unprecedentedly lowest chlorophyll concentrations were observed along the south Java coast in 2010 and 2016, attributable to the intense and prolonged MHWs. However, existing studies pay little attention to compound MHW-LChl extremes compared to univariate extremes, coupled with data limitations and the difficulty of identifying compound events, there is a lack of detailed investigation in this emerging research area.
In this study, we investigate the multi-scale spatiotemporal variability and potential drivers of compound MHW-LChl extreme events in the western Pacific region (10°S–45°N, 100°E–140°E) over the past three decades. The outline of this paper is organized as follows. Section 2 describes datasets and the definitions of univariate and compound extremes. In Section 3, we show the climatology, seasonality and linear trends of the compound MHW-LChl properties from different sub-regions. Additionally, we further explored the modulation of their total days by large-scale modes of climate variability. Finally, conclusions and discussion are given in Section 4.
2 Data and methods
2.1 Observational and simulation data
To identify and characterize compound MHW-LChl events, we employ satellite-derived sea surface temperature (SST) from the National Oceanic and Atmospheric Administration (NOAA) Daily Optimum Interpolation Sea Surface Temperature (OISST) at a 0.25° × 0.25° horizontal resolution (Reynolds et al., 2007; Banzon et al., 2016) from September 1st, 1981 to the present. For chlorophyll concentration (Chl), the daily data were obtained from the Copernicus Marine Environment Monitoring Service (CMEMS) global biogeochemical multi-year reanalysis (GLOBAL_REANALYSIS_BIO_001_029 product) (Aumont et al., 2015; Perruche, 2018) for the period 1993–2020. The chlorophyll data have been validated against the Globcolour products (Perruche et al., 2019) and prove to be of high skills in reproducing the climatology and variability of observed Chl.
To explore the associations between compound MHW-LChl extremes and climate modes, we first obtain correlation coefficients between the two through Pearson’s correlation analysis, and further use the composite method to compute the total days (as an example) of compound events during positive and negative phases of the most relevant climate modes identified as drivers (Holbrook et al., 2019). These climate modes include the El Niño-Southern Oscillation (ENSO), the North Atlantic Oscillation (NAO), the Arctic Oscillation (AO), the Dipole Mode Index (DMI), and the Pacific Decadal Oscillation (PDO) (Table S1).
The analysis period for all the above datasets is 1993–2020, and anomalies of all variables were calculated relative to the corresponding mean seasonal cycle.
2.2 Definition of extremes and compound extremes
Following the studies of Le Grix et al. (2021), we define MHWs as abnormal high-temperature extremes where the daily SST anomaly exceeds its 90th percentile threshold (Figure S1A). For consistency, LChl events are defined as days when the surface Chl anomaly falls below its 10th percentile threshold (Figure S1B). The seasonally varying thresholds were calculated from the climatological daily mean, which was smoothed with a 30-day running mean to remove noise on a daily scale associated with the 28-year data record (Hobday et al., 2016; Oliver et al., 2018). Under both definitions of univariate extremes, MHWs and LChl events can be identified at any time of the year, even during the local winter. The 90th and 10th percentiles were chosen to ensure a higher probability of identifying compound MHW-LChl extreme occurrences.
Intuitively, compound MHW and LChl extremes are defined as when both marine heatwaves and low-chlorophyll extremes co-occur in time and space (Figure 1). For each compound extreme event, we calculate a series of metrics to quantify variations in its characteristics, such as the total days, duration, and intensity (Table 1). Specially, we use the definition of intensity for compound MHW-LChl extremes defined by Li D. et al. (2022), which is expressed as the product of standardized SST anomalies and standardized Chl anomalies. The standardized anomalies are calculated by subtracting the climatological mean (i.e., 1993–2020) from each variable and dividing by the standard deviation. In contrast, the mean intensity of MHWs or LChl events is the average SST or Chl anomaly relative to the climatological mean during each respective event.
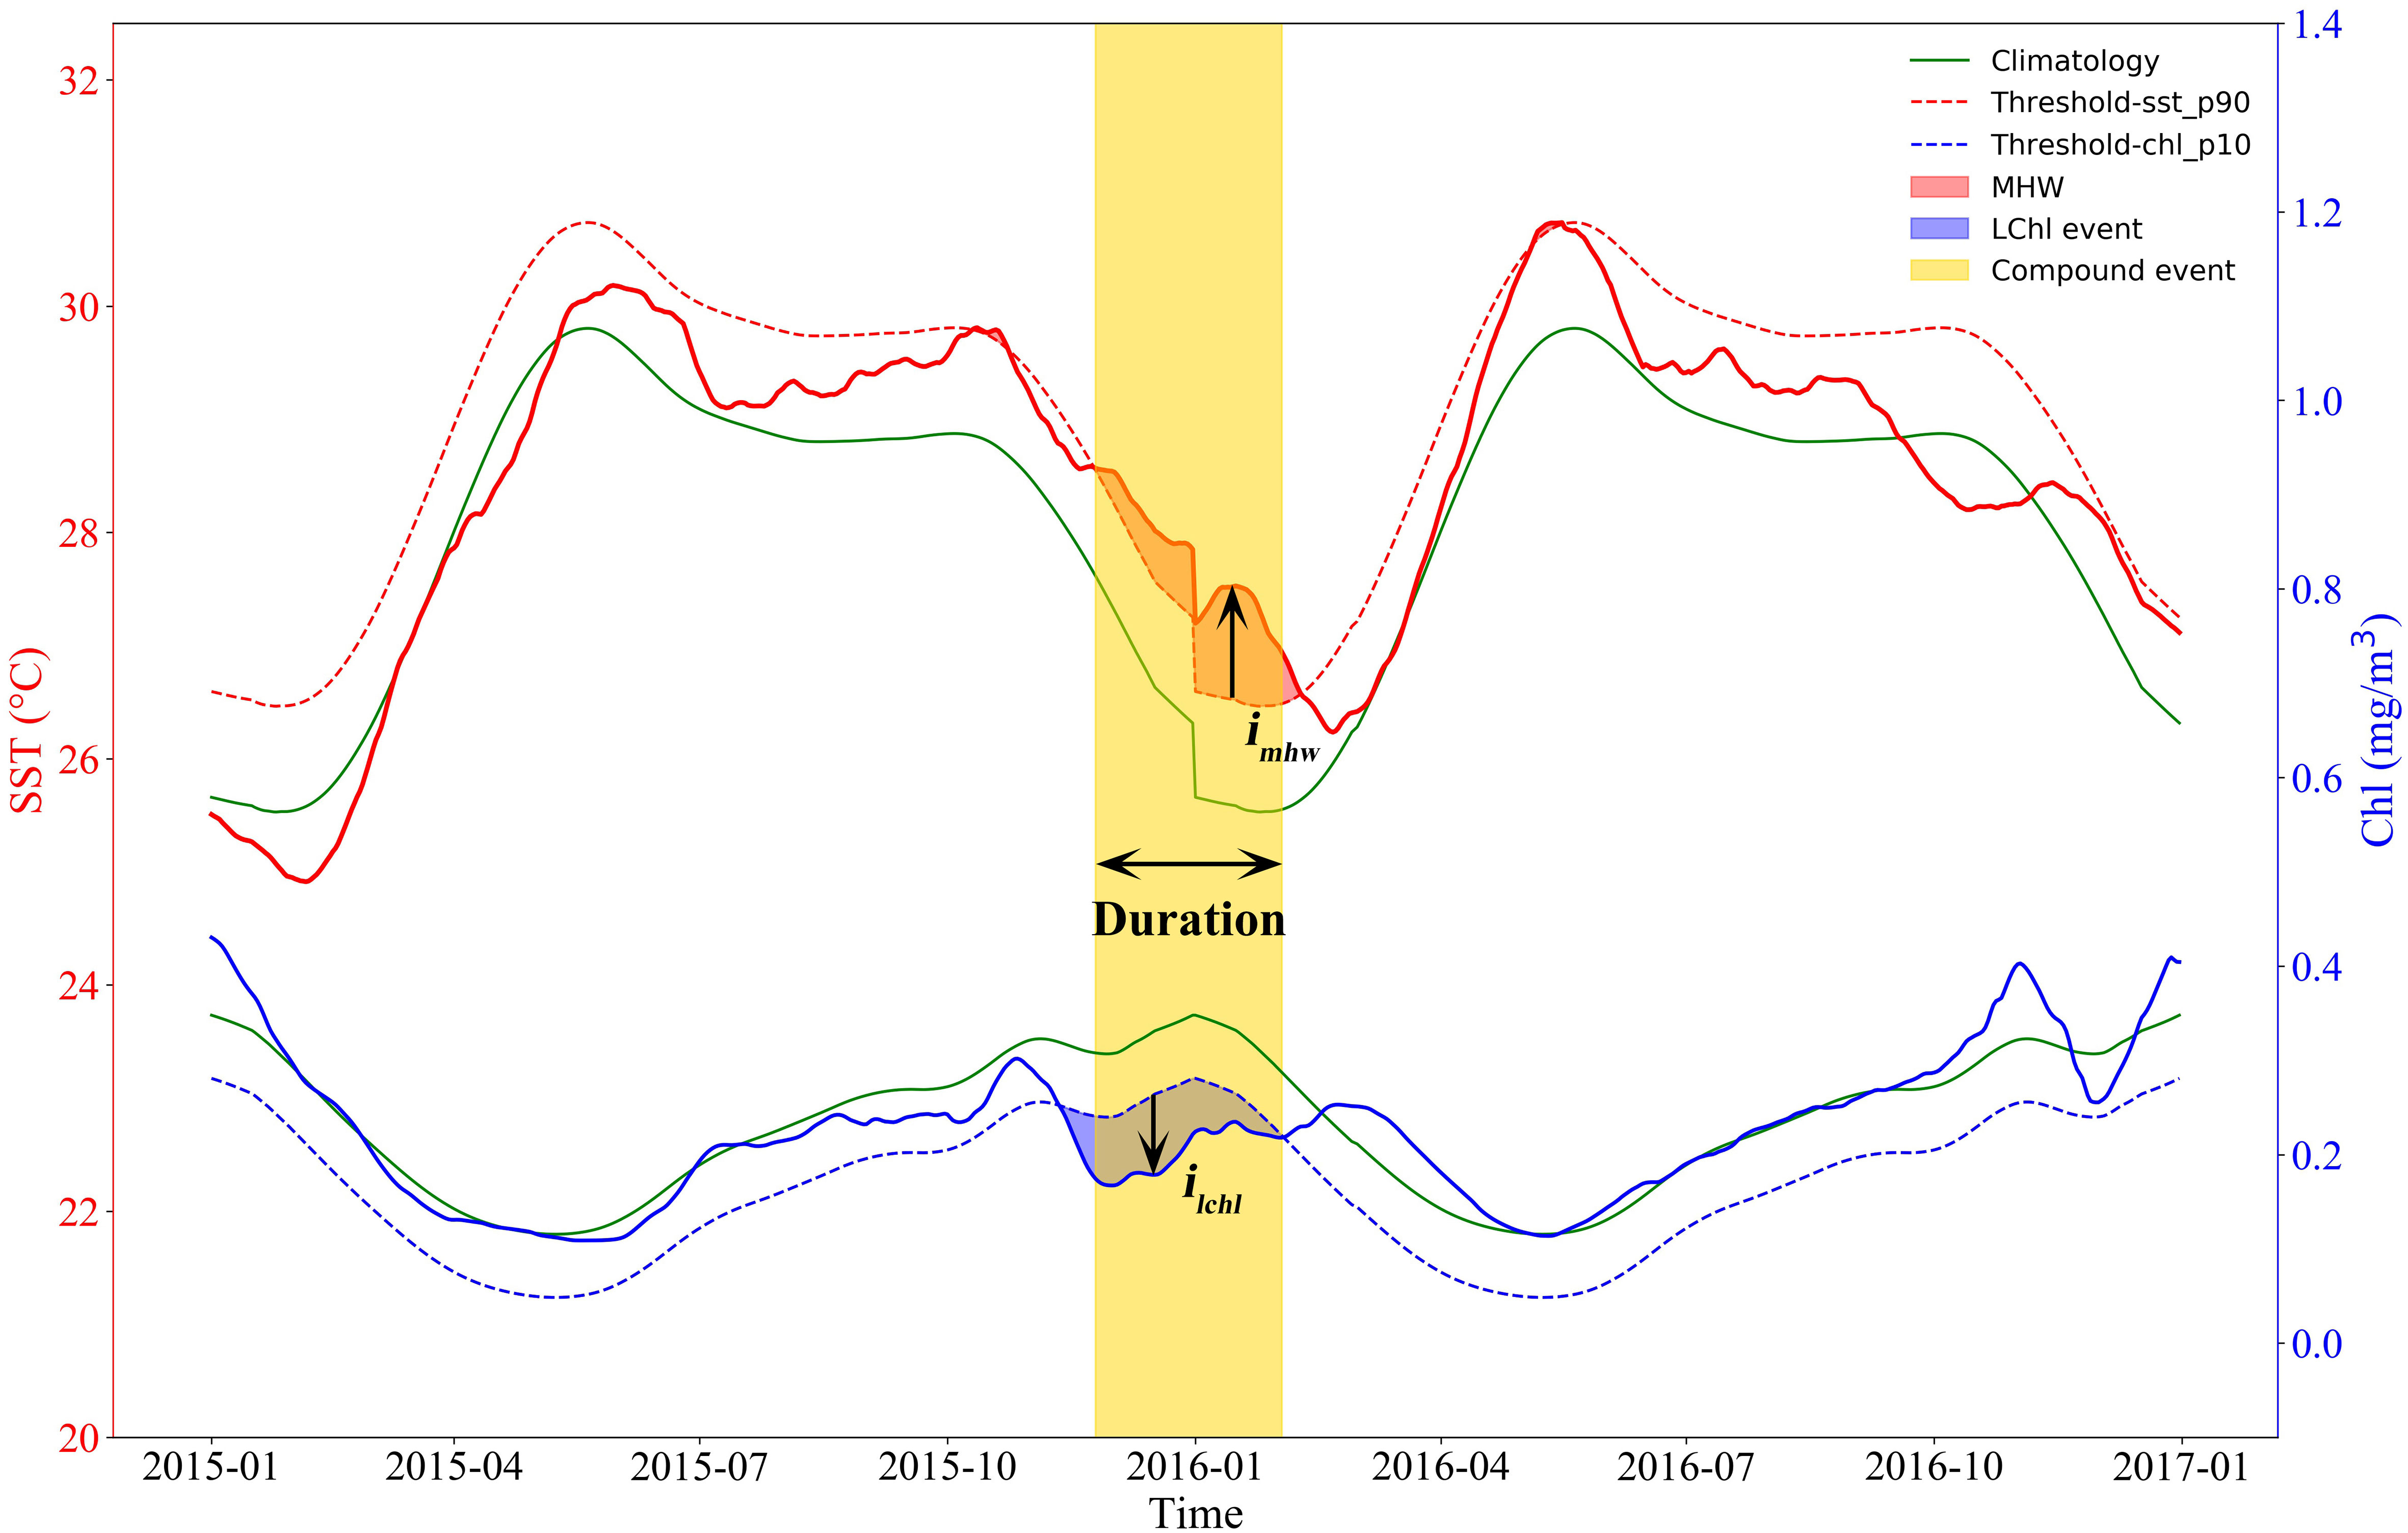
Figure 1 Schematic diagram illustrating the definition of MHWs, LChl events, and compound MHW-LChl extreme events. Time series of SST and Chl are extracted from 2015 to 2016 at 8.375°N, 105.875°E and smoothed using a 30-day running mean. The climatological seasonal cycle is shown in solid green line. A MHW occurs (red shaded area) when the SST (solid red line) is above its 90th-percentile threshold (dashed red line). A LChl event (blue shaded area) occurs when the Chl (solid blue line) is below its 10th-percentile threshold (dashed blue line). The yellow shaded bands indicate compound MHW-LChl extremes, and its time span is labeled as the duration. Also shown are the mean intensity of MHWs and LChl events (imhw, mean SST exceedance anomaly over the duration of MHWs; ilchl, Chl anomaly averaged over the duration of LChl events). (adapted from Le Grix et al., 2021).
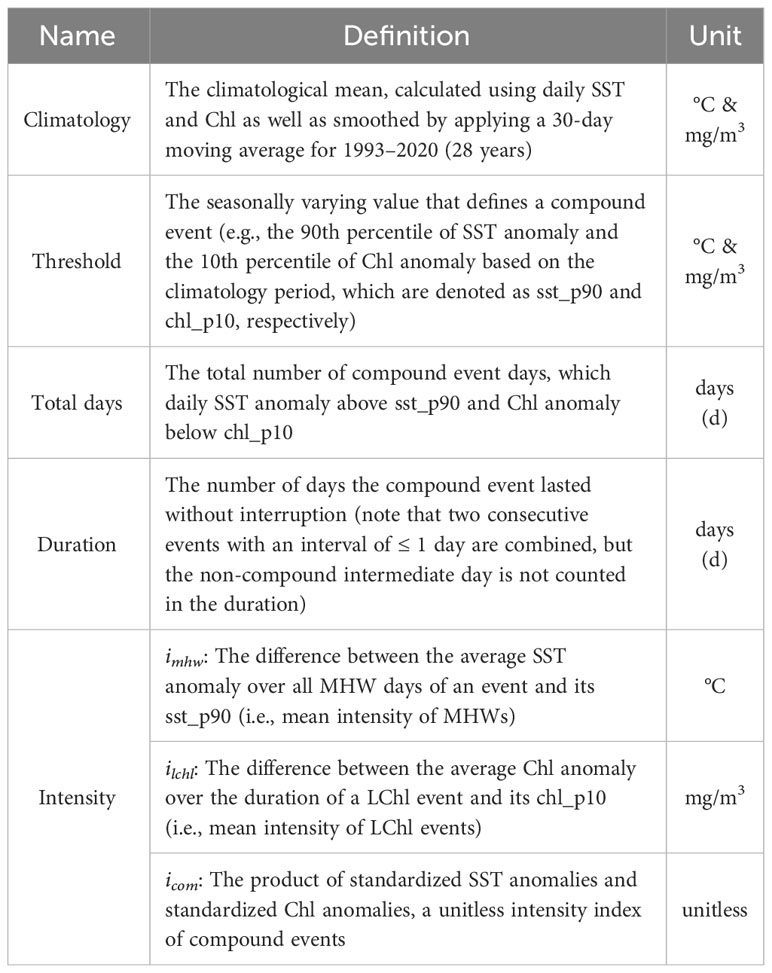
Table 1 Definitions of metrics to characterise compound MHW-LChl extremes.
To assess the long-term trends of compound MHW-LChl extremes, we use Sen’s slope estimator (Sen, 1968), a robust tool that is the median of all possible slopes determined by pairs of sample points. The modified Mann-Kendall test with the trend-free pre-whitening procedure (MK-TFPW) is utilized to assess the significance of trends in the extreme metrics (Mann, 1945; Yue and Wang, 2002). In contrast to the conventional MK test, this MK-TFPW test not only does not make assumptions about the specific distribution of the data and is sufficiently insensitive to outliers in the time series, but also eliminates the influence of serial autocorrelation on the significance. Furthermore, correlation analysis and composite analysis are conducted to explore the potential relationship between compound MHW-LChl extremes and climate modes.
3 Results
3.1 Climatological characteristics of compound MHW-LChl extremes
The climatology of the annual total days, duration, and intensity of compound MHW-LChl extremes has a heterogeneous distribution across the western Pacific Ocean for 1993–2020 (Figure 2). The frequency of MHW-LChl extremes exceeds 1% over 60% of the ocean area (see stippling areas; Figure 2A). It displays that the co-occurrence of MHWs and LChl events more often than expected if variations in SST and Chl anomalies were independent. The mean annual total days of compound MHW-LChl events is 5.17 d, ranging from 0.1 to 17.8 d. Higher-value areas are in the south of the western South China Sea (WSCS) (> 8.4 d) and southwestern Indonesian Seas (IS) (> 9.4 d), and lower-value in the northeastern East China Sea (ECS) (< 3.4 d) and central Philippine Sea (PS) (< 1.4 d). Combining the results of the correlation analysis in Figure 2D, it can be concluded that the occurrences of MHW-LChl (Figure 2A) exhibit contrasting patterns when compared to the correlation coefficient of SST and Chl anomalies (Figure 2D). That is, hotspots of compound MHW-LChl extremes correspond to regions where SST and Chl anomalies are strongly negatively correlated, and vice versa.
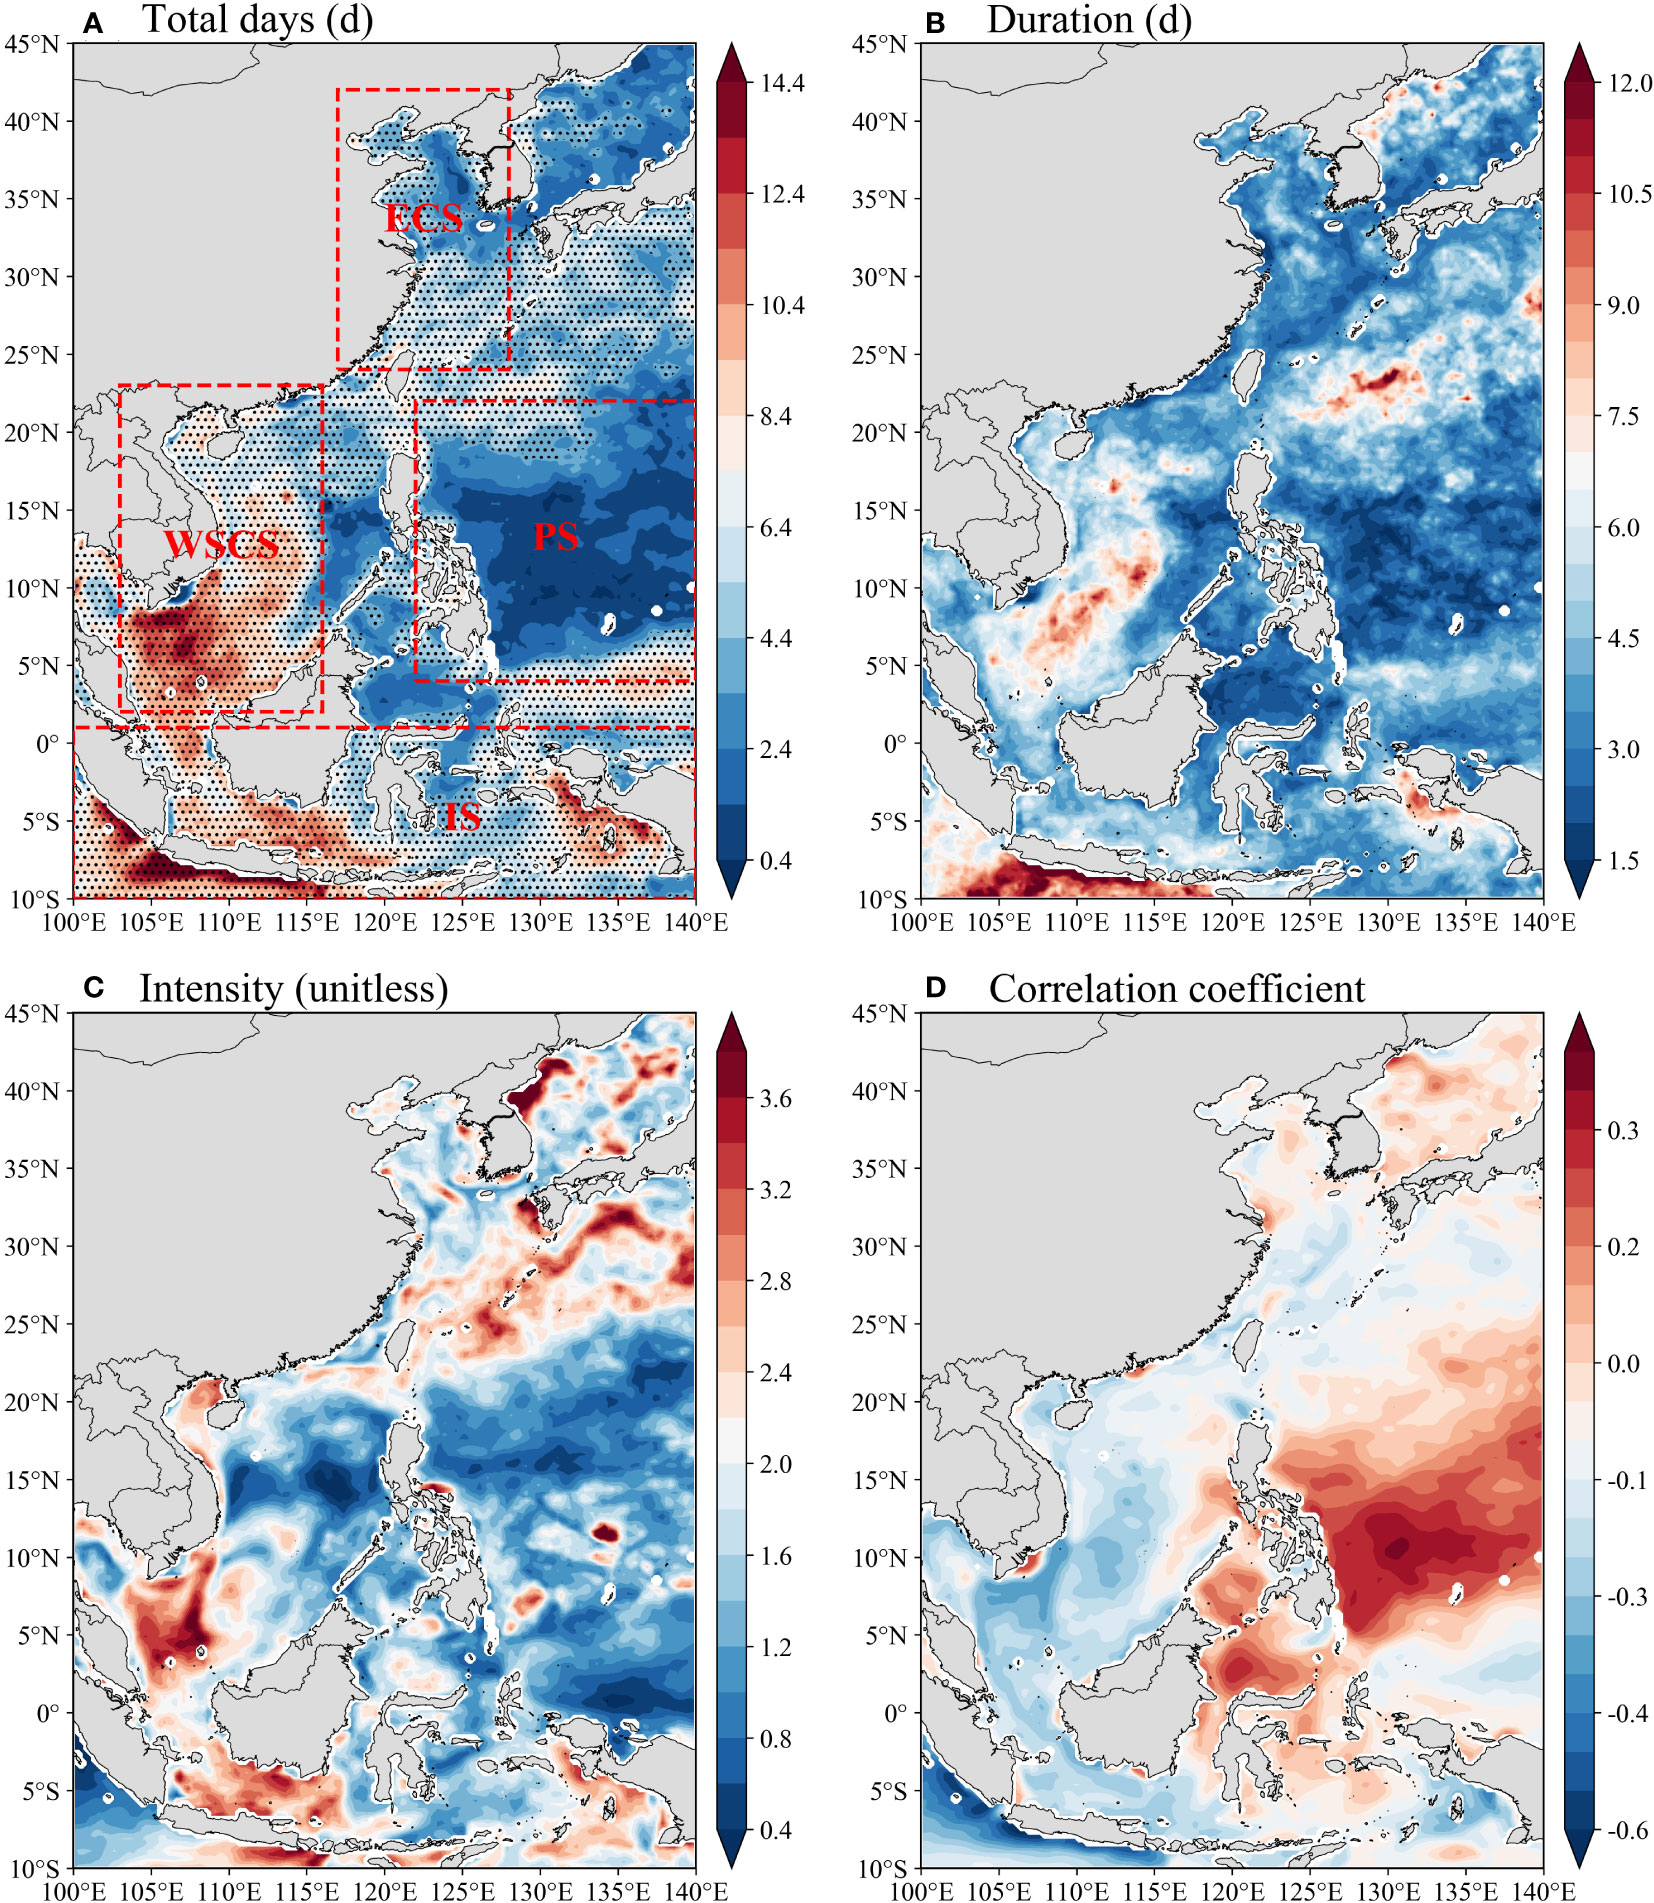
Figure 2 The annual average compound MHW-LChl events during 1993–2020: (A) total days, (B) duration, and (C) intensity. (D) Linear correlation coefficient of SST and surface Chl anomalies. The domain and the corresponding abbreviations of sub-regions are marked in (A) as: East China Sea (ECS; 24°N–42°N, 117°E–128°E), western South China Sea (WSCS; 2°N–23°N, 103°E–116°E), Philippine Sea (PS; 4°N–22°N, 122°E–140°E), and Indonesian Seas (IS; 10°S–1°N, 100°E–140°E), respectively. Stippling areas in (A) indicate that the frequency (%) of compound MHW-LChl events is more than expected (1%) under the assumption of independence between MHW and LChl events (i.e., the product of their univariate frequencies 10%×10% = 1%).
The spatial pattern of the average duration of compound MHW-LChl extremes broadly resembles the total days but with slight differences (Figure 2B). The annual mean duration is 4.30 d and ranges from 1.0 to 15.5 d in the western Pacific Ocean. The longest MHW-LChl events (> 9.0 d) also occur in the region off the southern coast of Java Island. Long MHW-LChl extreme events (> 7.0 d) concentrate in the east of Taiwan Island, the central-southern WSCS, and northwestern New Guinea. Short MHW-LChl extreme events (< 3.0 d) are observed in the PS, where the total days of compound extremes are also low. Conversely, the spatial distribution of intensity is rather heterogeneous (Figure 2C). The annual mean intensity of compound MHW-LChl extremes ranges from 0.21 to 5.75. Areas with high intensity (> 2.2) mainly include the midwest of the Japan Sea, the Kuroshio Current, north and south of the WSCS, Java Sea, southeastern Java Island, and west of New Guinea Island. Overall, the southern WSCS, southeastern Java Island and northwestern New Guinea in the IS tend to register the highest total days (> 8.4 d), longest-lasting (> 6.5 d), and strongest intensity (> 2.4).
3.2 Seasonality of compound MHW-LChl extremes
According to Figure 3, the largest proportion (i.e., compound event occurrence area/total study sea area) of MHW-LChl event area occurs in winter (80%), followed by spring (76%) and autumn (66%), and the least in summer (49%).
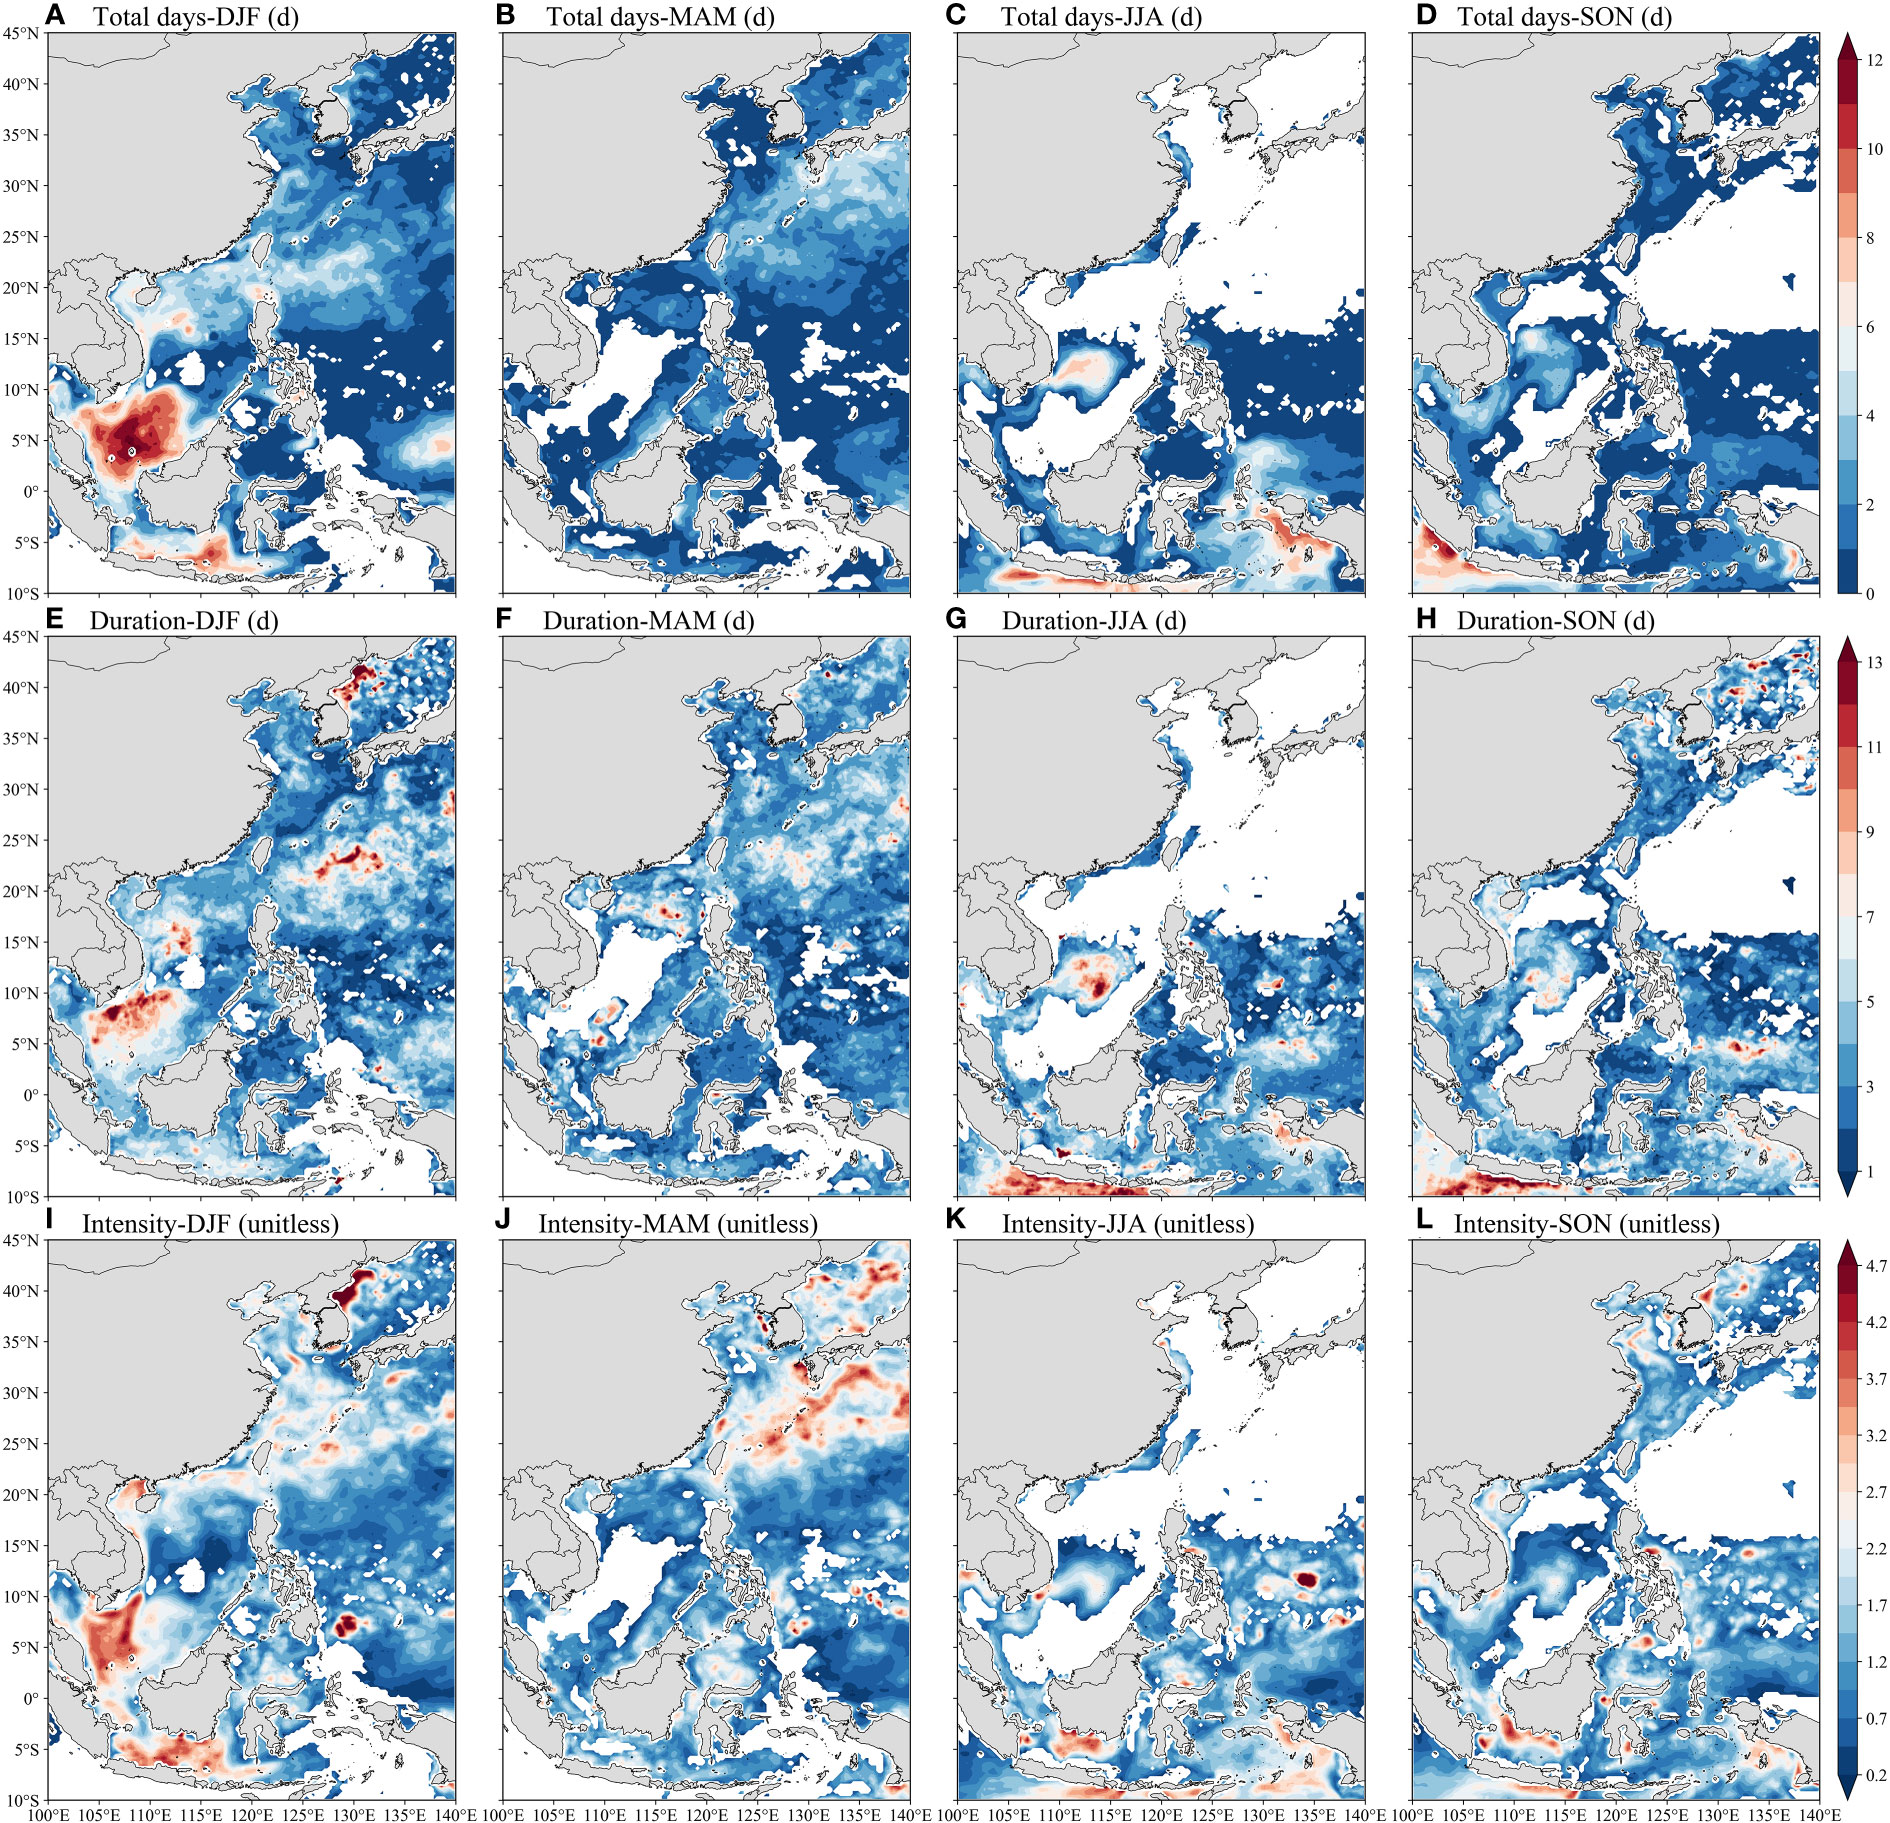
Figure 3 Spatial distribution of seasonal compound MHW-LChl extremes characteristics in boreal winter (December to February, DJF), spring (March to May, MAM), summer (June to August, JJA), and autumn (September to November, SON) from 1993 to 2020: (A–D) total days; (E–H) duration; (I–L) intensity.
Total days of compound MHW-LChl extremes in each season are compared in Figures 3A-D. The winter MHW-LChl events (mean = 2.54 d) cover the most extensive ocean area, with the highest center concentrated in the south of WSCS and most of the Java Sea, in which their total days exceed 7 d (Figure 3A). MHW-LChl events occur least in spring (mean = 1.29 d), primarily along the vicinity of the Kuroshio Current with values of 3–5 d (Figure 3B). In summer (mean = 2.0 d), higher MHW-LChl days are confined to the central WSCS, south of Java Island and western New Guinea in the IS, varying from 5 to 9 d (Figure 3C). Autumn MHW-LChl events are mostly located off the southwestern Sumatra-southeast coast of Java Island, with a seasonal mean of 1.34 d (Figure 3D). Specifically, throughout the year, MHW-LChl events in the ECS mainly occur in spring, autumn and winter, and there are almost no MHW-LChl days in summer; in the WSCS, MHW-LChl extremes are observed in all seasons, with the most (least) days appearing in winter (spring); in the PS, it is not prone to detect MHW-LChl occurrences; in the IS, MHW-LChl events occur most frequent in summer and autumn.
The spatial mean duration of compound MHW-LChl extremes (Figures 3E-H) share similar seasonality of the total days. In winter, longer duration (> 7 d) are observed in the northwest of the Japan Sea, eastern Taiwan Island, and the southeast of WSCS (Figure 3E). During spring and summer, the spatial patterns of MHW-LChl duration are consistent with its total day distribution, respectively (Figures 3F, G). In autumn, maximum durations (> 8 d) are found in the southern coast of Java Island (Figure 3H).
For the entire study region, the spatial mean intensity of compound MHW-LChl extremes is the strongest during winter (mean = 1.55), followed by spring (mean = 1.43) and summer (mean = 1.42), and is the weakest (mean = 1.30) in autumn (Figures 3I-L). In spring, a large-scale distribution of strong intensity (> 2.45) is observed in the southeastern ESC and the Japan Sea (Figure 3J). During summer and autumn (Figures 3K-L), the higher-value regions (> 2.2) are located on both the east and west sides of IS. In winter, areas with strong MHW-LChl events (> 2.7) are mainly in the northwestern Japan Sea, southern portion of the WSCS, and Java Sea (Figure 3I).
In summary, the winter MHW-LChl events show higher total days and longer-lasting over a broad region in the western Pacific Ocean, especially in the WSCS, with a relatively strong intensity than in other seasons. However, the least total days and duration of MHW-LChl events occurred in spring, experiencing the second strongest mean intensity of 1.43. There is a similar distribution of compound MHW-LChl extremes for all three metrics in summer and autumn.
3.3 Long-term spatiotemporal trends in compound MHW-LChl extremes
Figure 4 displays the spatial distribution of the estimated trends of compound MHW-LChl extremes during the 28 years (1993–2020). The spatial patterns of the three MHW-LChl event properties show high similarity. For total days, the highest significant trends (> 2.2 d/decade) are mainly found along the Kuroshio Current, northern-central Beibu Gulf, and the south of Java Sea, especially in the southern part of WSCS with a linear trend above 4.2 d/decade (p < 0.05; Figure 4A). In these regions, the annual duration and intensity of compound MHW-LChl extremes show a linear increase of 0.8–2.2 days per decade and 0.2–0.8, respectively (p < 0.05; Figures 4B, C). Notably, the maximum and most significant trends of MHW-LChl duration (> 1.4 d/decade) and intensity (> 0.5) are detected in the southern WSCS.
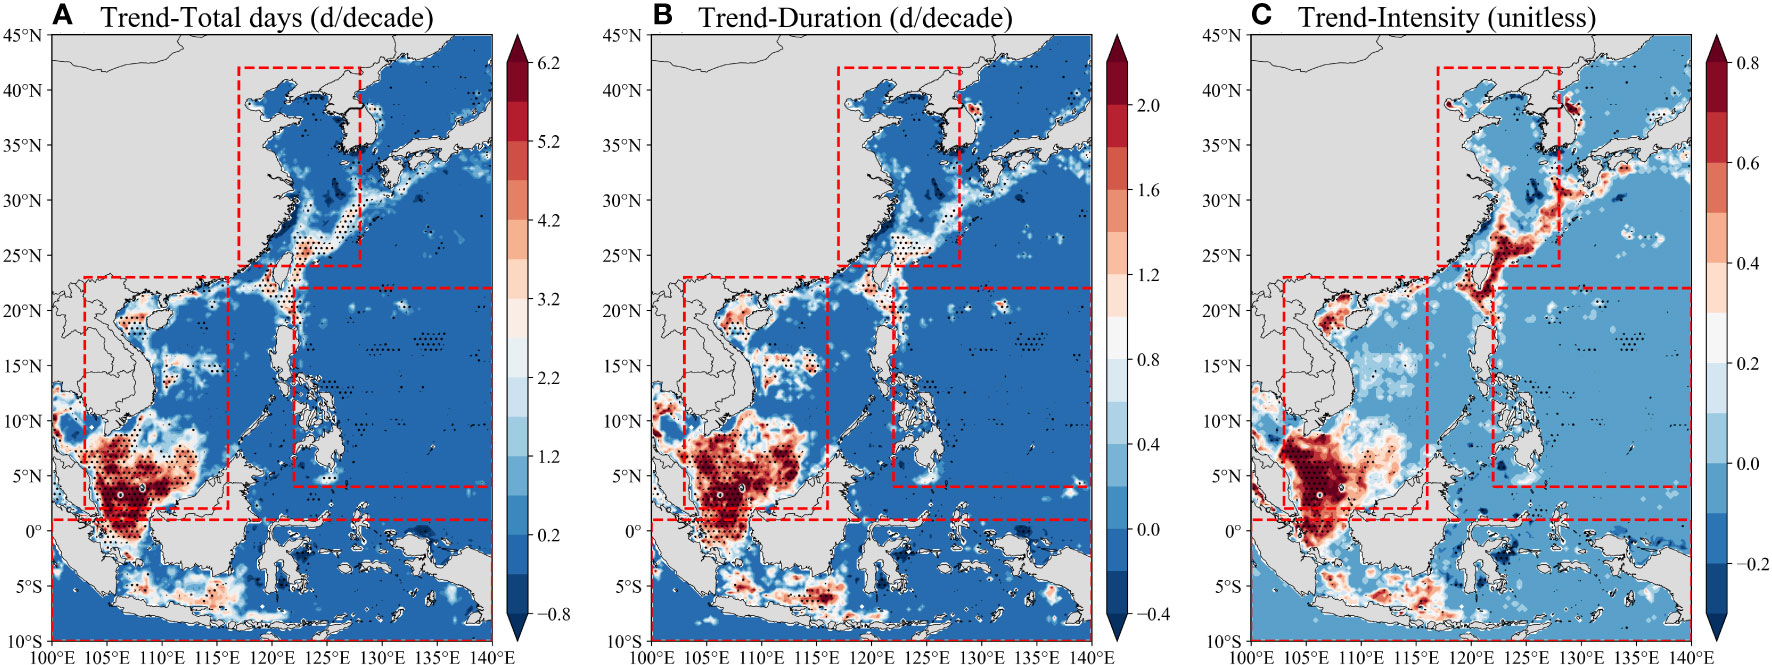
Figure 4 The linear trend of compound MHW-LChl extremes over the 1993–2020 period: (A) total days, (B) duration, and (C) intensity. Stippling indicates areas where the trends are significant at a 0.05 level.
To explore the temporal changes and dominant factors (i.e., MHWs and/or LChl events) of compound MHW-LChl extremes, we calculate regionally aggregated yearly mean total days, duration, and intensity in the entire study area and its four sub-regions from 1993 to 2020, respectively (Figure 5; Table 2). Here, the absolute values of LChl events intensity are used for consistency with those for MHWs and MHW-LChl events.
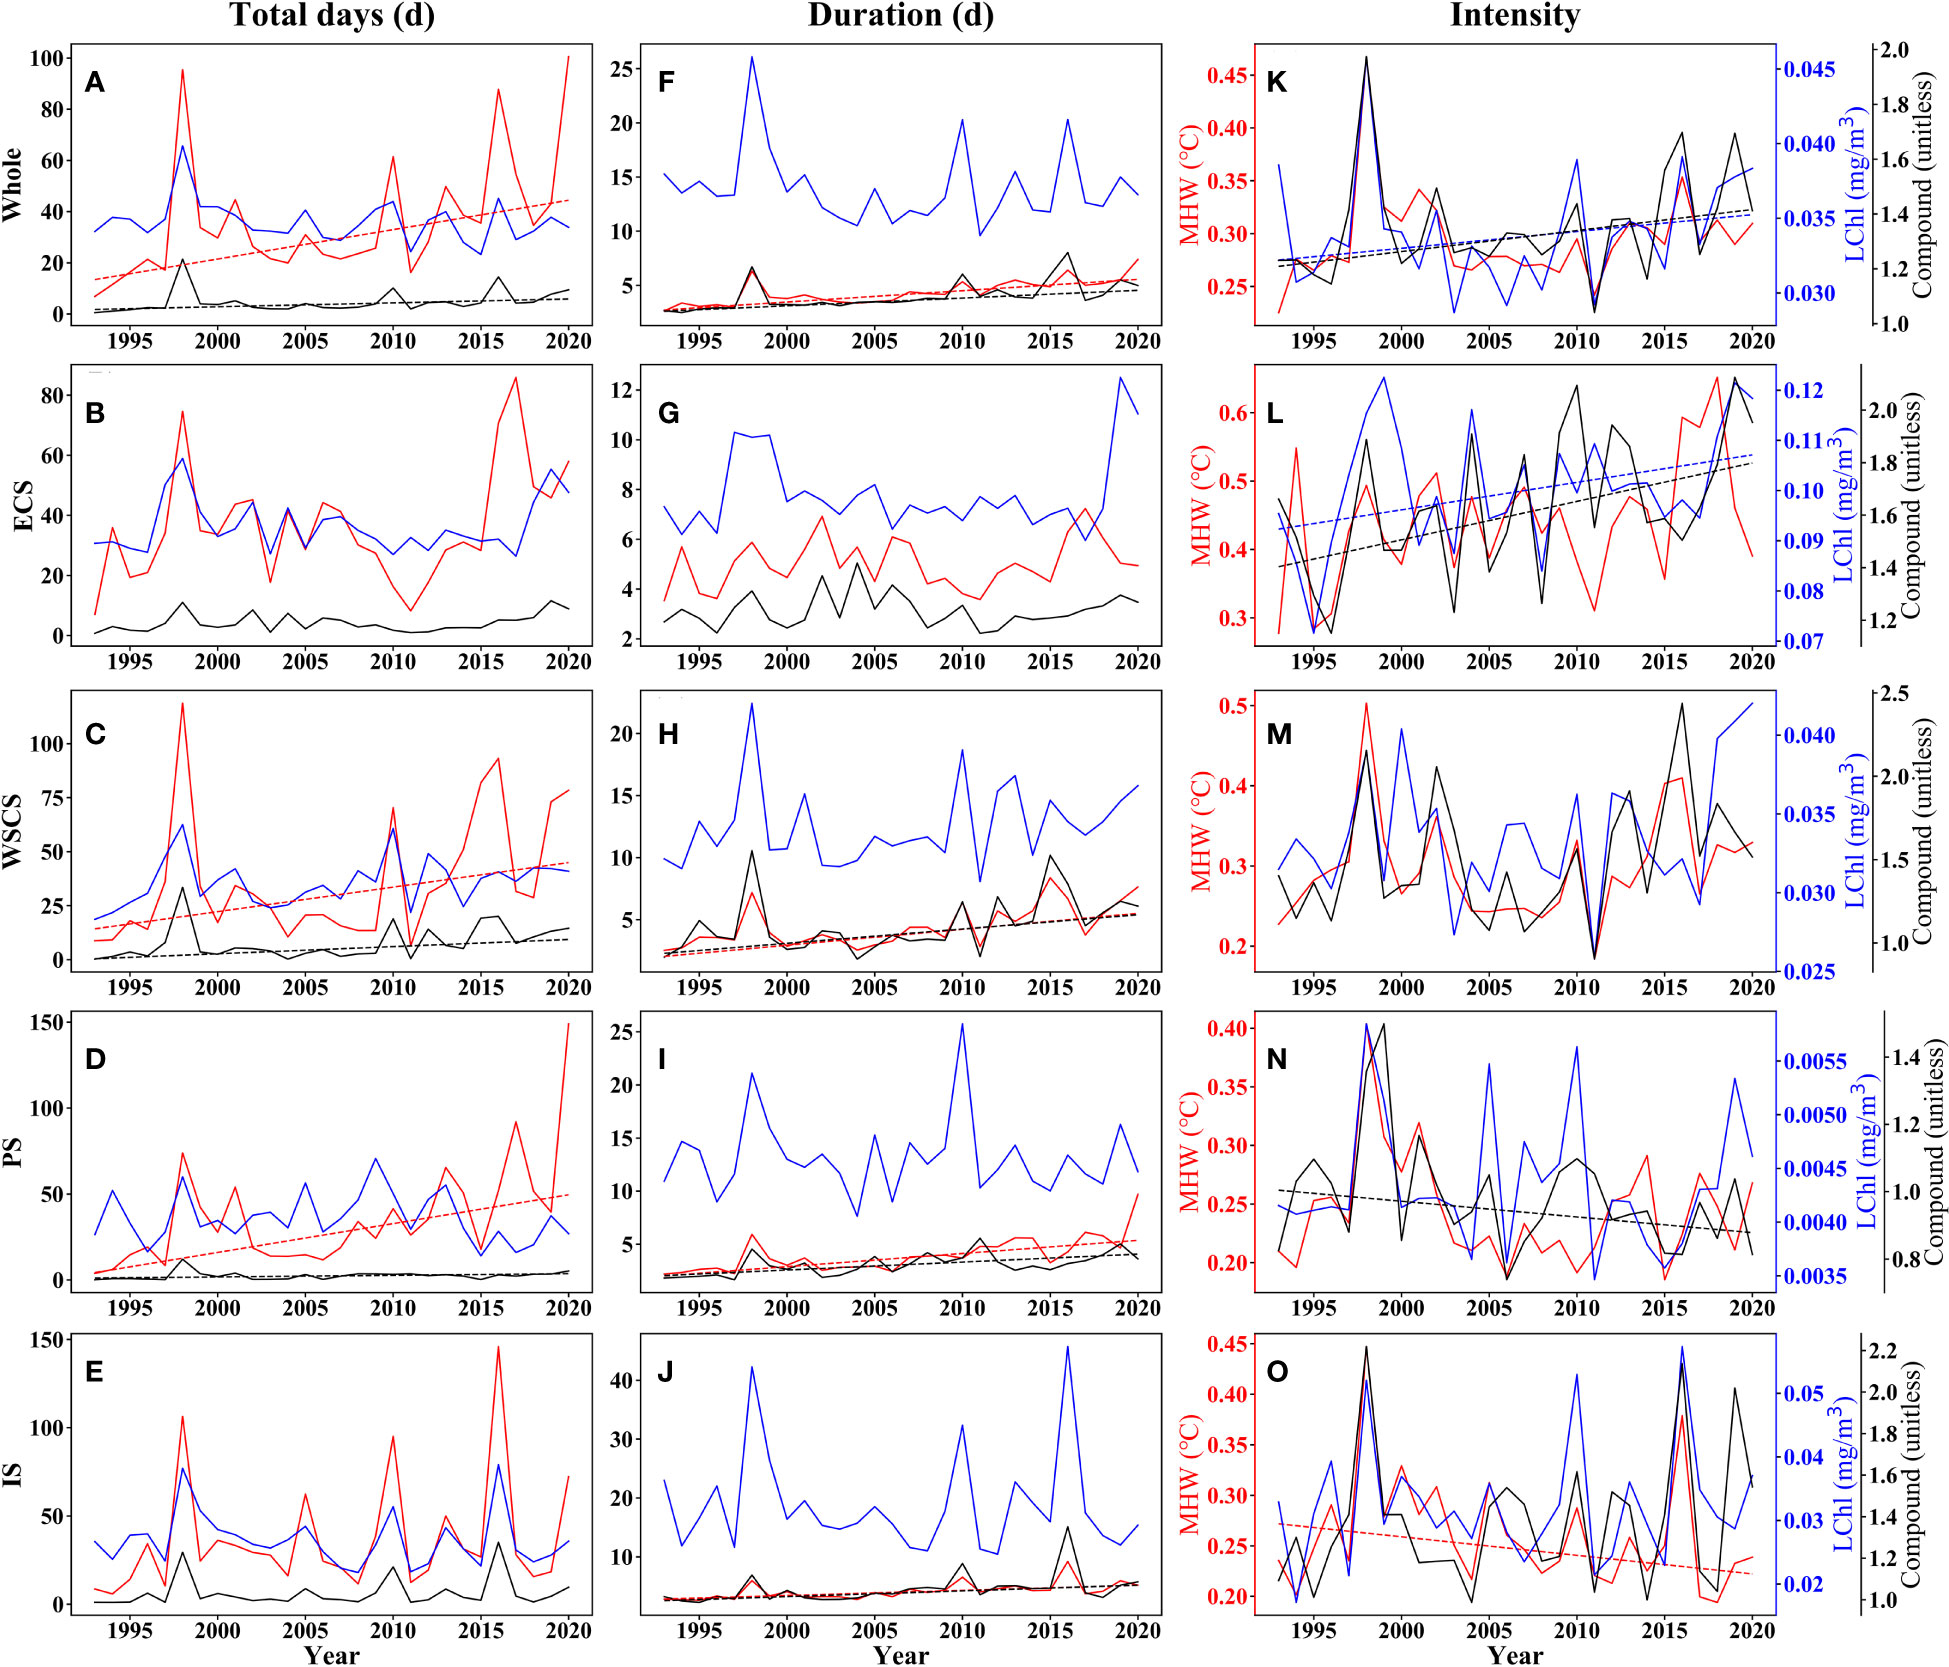
Figure 5 The annual time series of regionally-averaged (A–E) total days, (F–J) duration, and (K–O) intensity of MHWs (red lines), LChl events (blue lines), and compound MHW-LChl extremes (black lines) during 1993–2020, in the whole study area and its four sub-regions (shown in Figure 1A) as noted by the y-axis legend. The numbers in brackets on top of each subplot indicate the magnitude of long-term trends (per decade) and the corresponding p-value calculated by the Mann-Kendall test, respectively. Note that the linearly-fitted dashed lines are plotted when the trend passes the statistical significance test at the 90% confidence level.
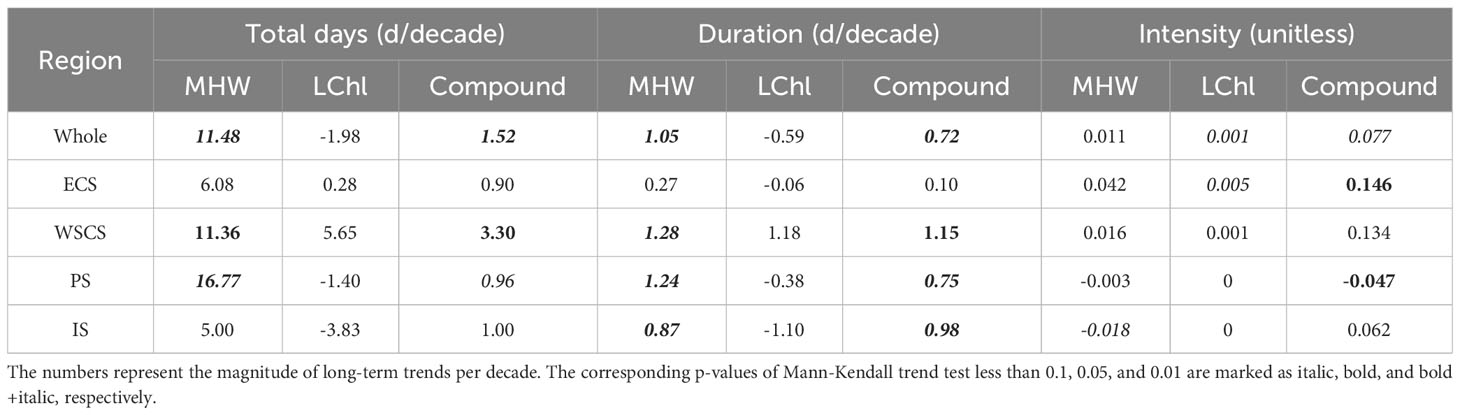
Table 2 The summary of trends for total days, duration, and intensity of MHWs, LChl events, and compound MHW-LChl extremes in 1993–2020 across the whole western Pacific Ocean and its different four sub-regions (shown in Figure 1A).
In the whole study region, the mean MHW-LChl (black curves) days and duration exhibit rapidly increasing inter-annual trends of about 1.52 d/decade and 0.72 d/decade, respectively (p < 0.01; Figures 5A, F). The total MHW-LChl days display a relatively larger trend of 3.30 d/decade (p < 0.05; Figures 5A-E) only in the WSCS. The duration of compound MHW-LChl events shows statistically significant increase trends (p < 0.05; Figures 5F-J), larger than those in all sub-regions except ECS. For intensity, MHWs (red curves), LChl events (blue curves), and compound MHW-LChl extremes all remain a relatively stable weak trend throughout the study period (p < 0.1; Figures 5K-O), but PS experiences a significant decreasing trend in MHW-LChl events (p < 0.05; Figure 5N). Taking a univariate perspective, the total days and duration of MHWs display extremely significant positive trends (p < 0.01) in most parts of the study region. Meanwhile, the variations in MHW-LChl duration are highly consistent with those of MHWs on an inter-annual scale (Figures 5F-J). However, LChl events generally show no statistically significant negative trends. Thus, we conclude that the long-term trends of most compound MHW-LChl extremes are supposed to be caused by changes in MHWs instead of changes in LChl events.
Combing all three metrics (first row in Figure 5), we found that severe MHW-LChl events were recorded in 1998, 2010, 2016, and 2019, years which are all characterized by strong El Niño events (Yao and Wang, 2021). For example, the strongest MHW-LChl events took place in 1998 with the highest total days exceeding 20 days; the longest MHW-LChl duration of up to 8 days was observed in 2016. Similarly, the years with remarkable anomalous MHW-LChl events in each sub-region almost coincided with El Niño years.
3.4 Relationship between MHW-LChl extremes and climate modes
Previous studies have shown that these climate modes, such as ENSO, DMI, NAO, AO, and PDO, favor or suppress the occurrence of MHW-LChl events (Le Grix et al., 2021; Hamdeno et al., 2022). To further understand the influence of large-scale modes of inter-annual to decadal climate variability on compound MHW-LChl events in the study region, we perform correlation and composite analysis between the total days of compound events and five different climate modes (see Section 2.1).
Figures 6 and 7 illustrate the large regional differences in the correlation distribution of total MHW-LChl days during these climate modes from 1993 to 2020. Most MHW-LChl occurrences are significantly related to ENSO compared to other climate indices (Figure 6A), implying its critical role in compound extremes over the western Pacific Ocean. Specifically, the positive phase of ENSO (i.e., El Niño) can contribute to enhancing total MHW-LChl days along the Kuroshio region and most parts of the Java Sea, especially in the southern WSCS with the highest correlation coefficient (r > 0.35) and total days (> 7 d) (Figures 6A, 7A). In contrast, the negative phase of ENSO (i.e., La Niña) is closely correlated with increased MHW-LChl days in the northern New Guinea Island (> 6.5 d) and southern Java Island (> 5 d) (Figure 7B). Combined with the difference in composite maps of MHW-LChl events during ENSO phases (i.e., El Niño - La Niña) (Figure 7C), we suppose that ENSO has a prominent influence on the occurrence of compound extremes in the WSCS and IS, which corresponds to the results of their temporal evolution in Section 3.3.
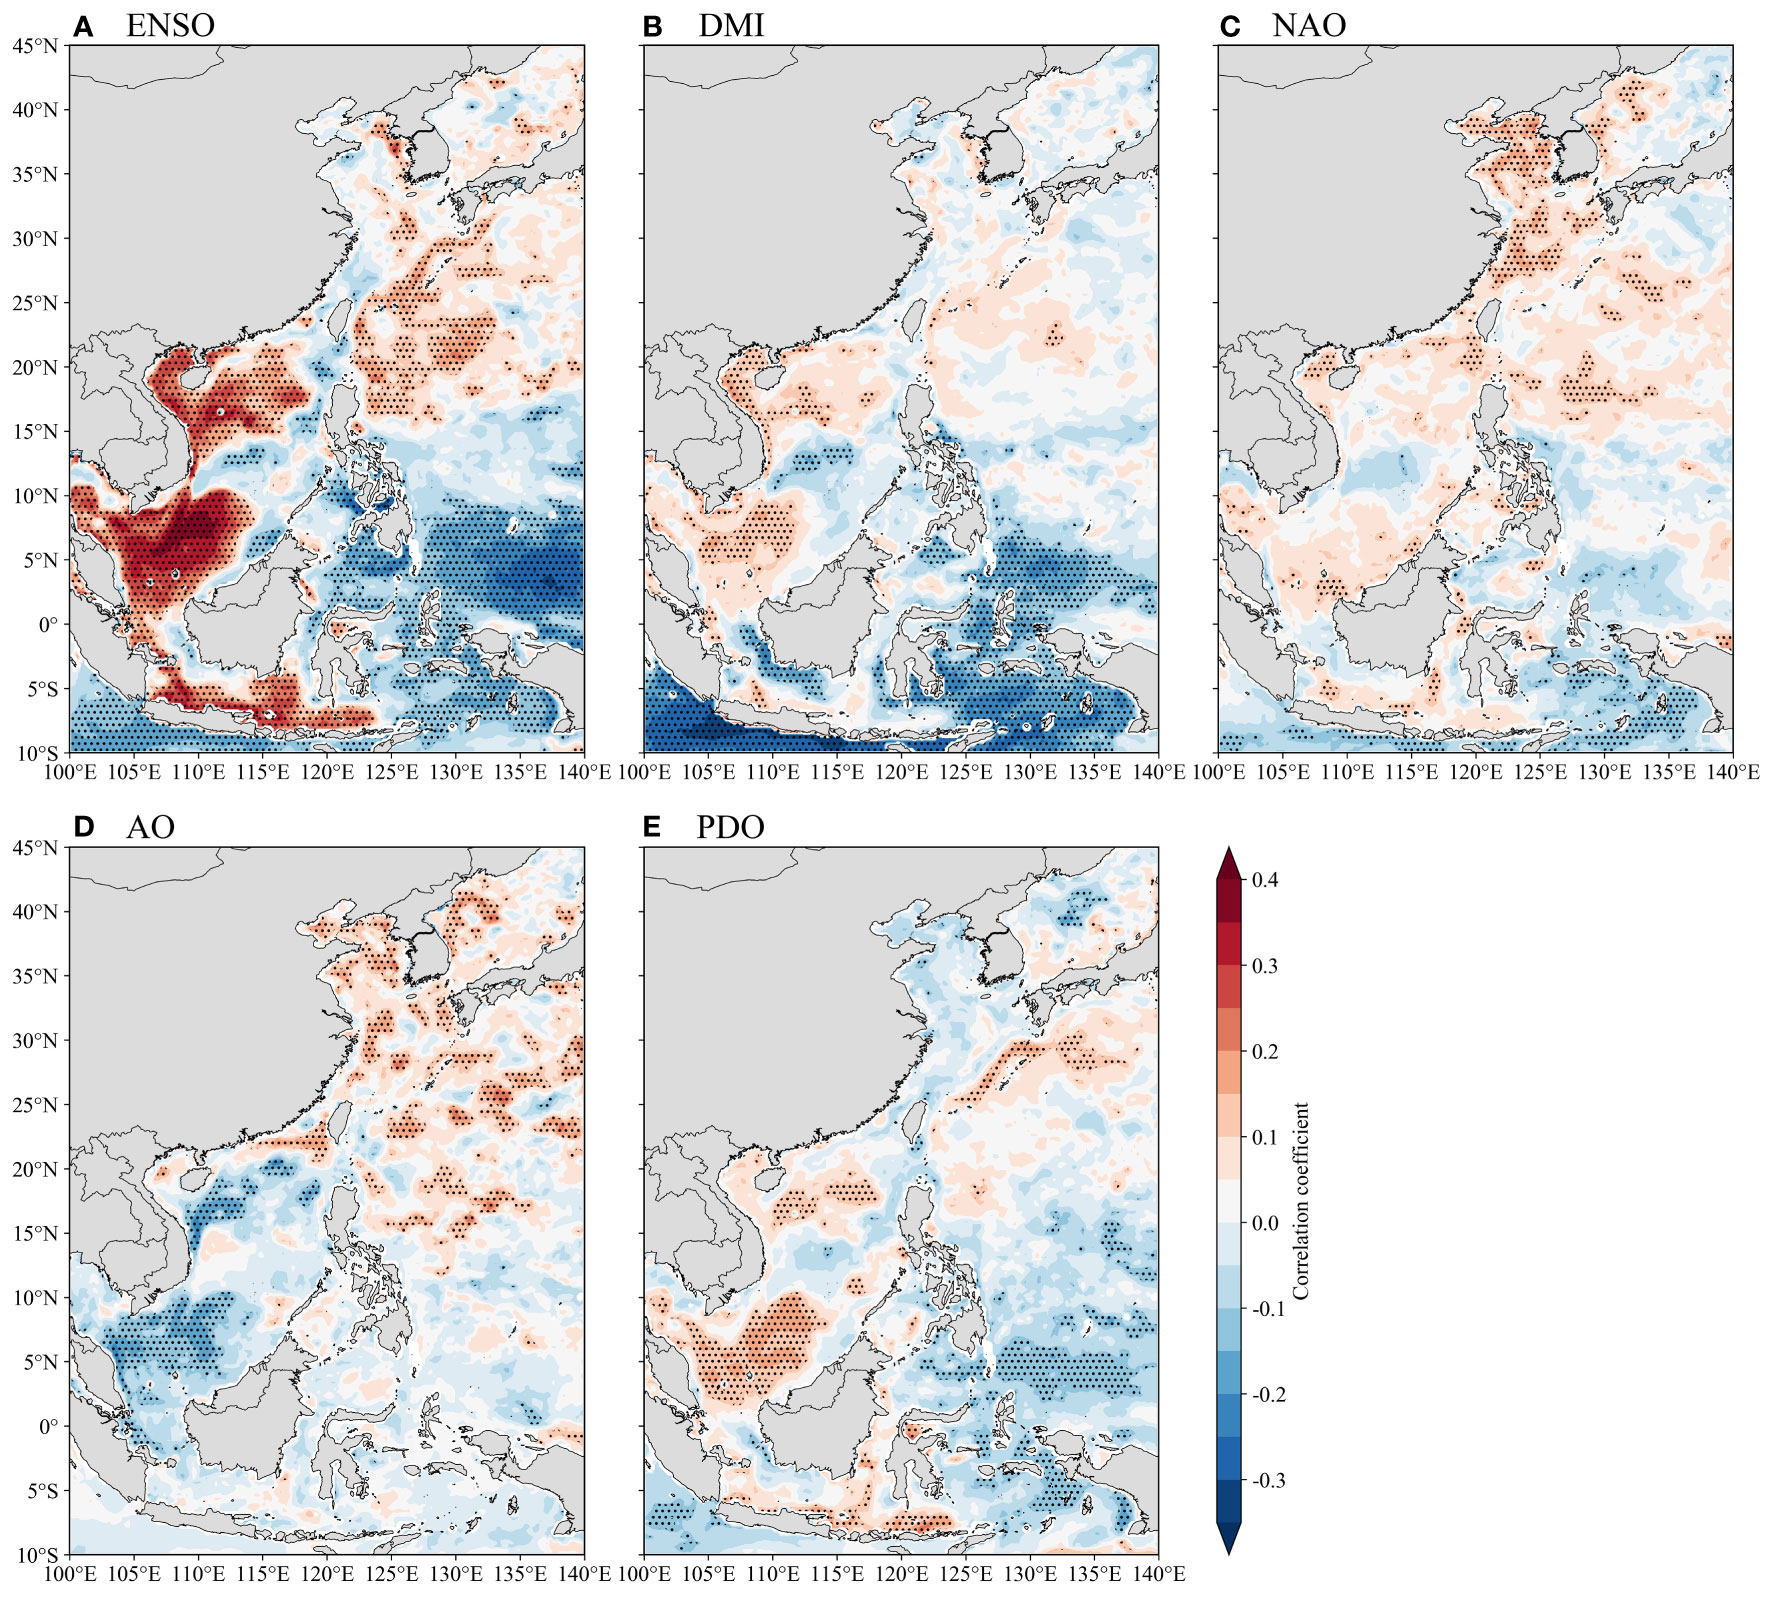
Figure 6 Spatial patterns of the correlation coefficients between the MHW-LChl total days field and (A) ENSO index, (B) DMI, (C) NAO index, (D) AO index, and (E) PDO index from 1993 to 2020. The dotted areas indicate statistically significant at the 95% confidence level.
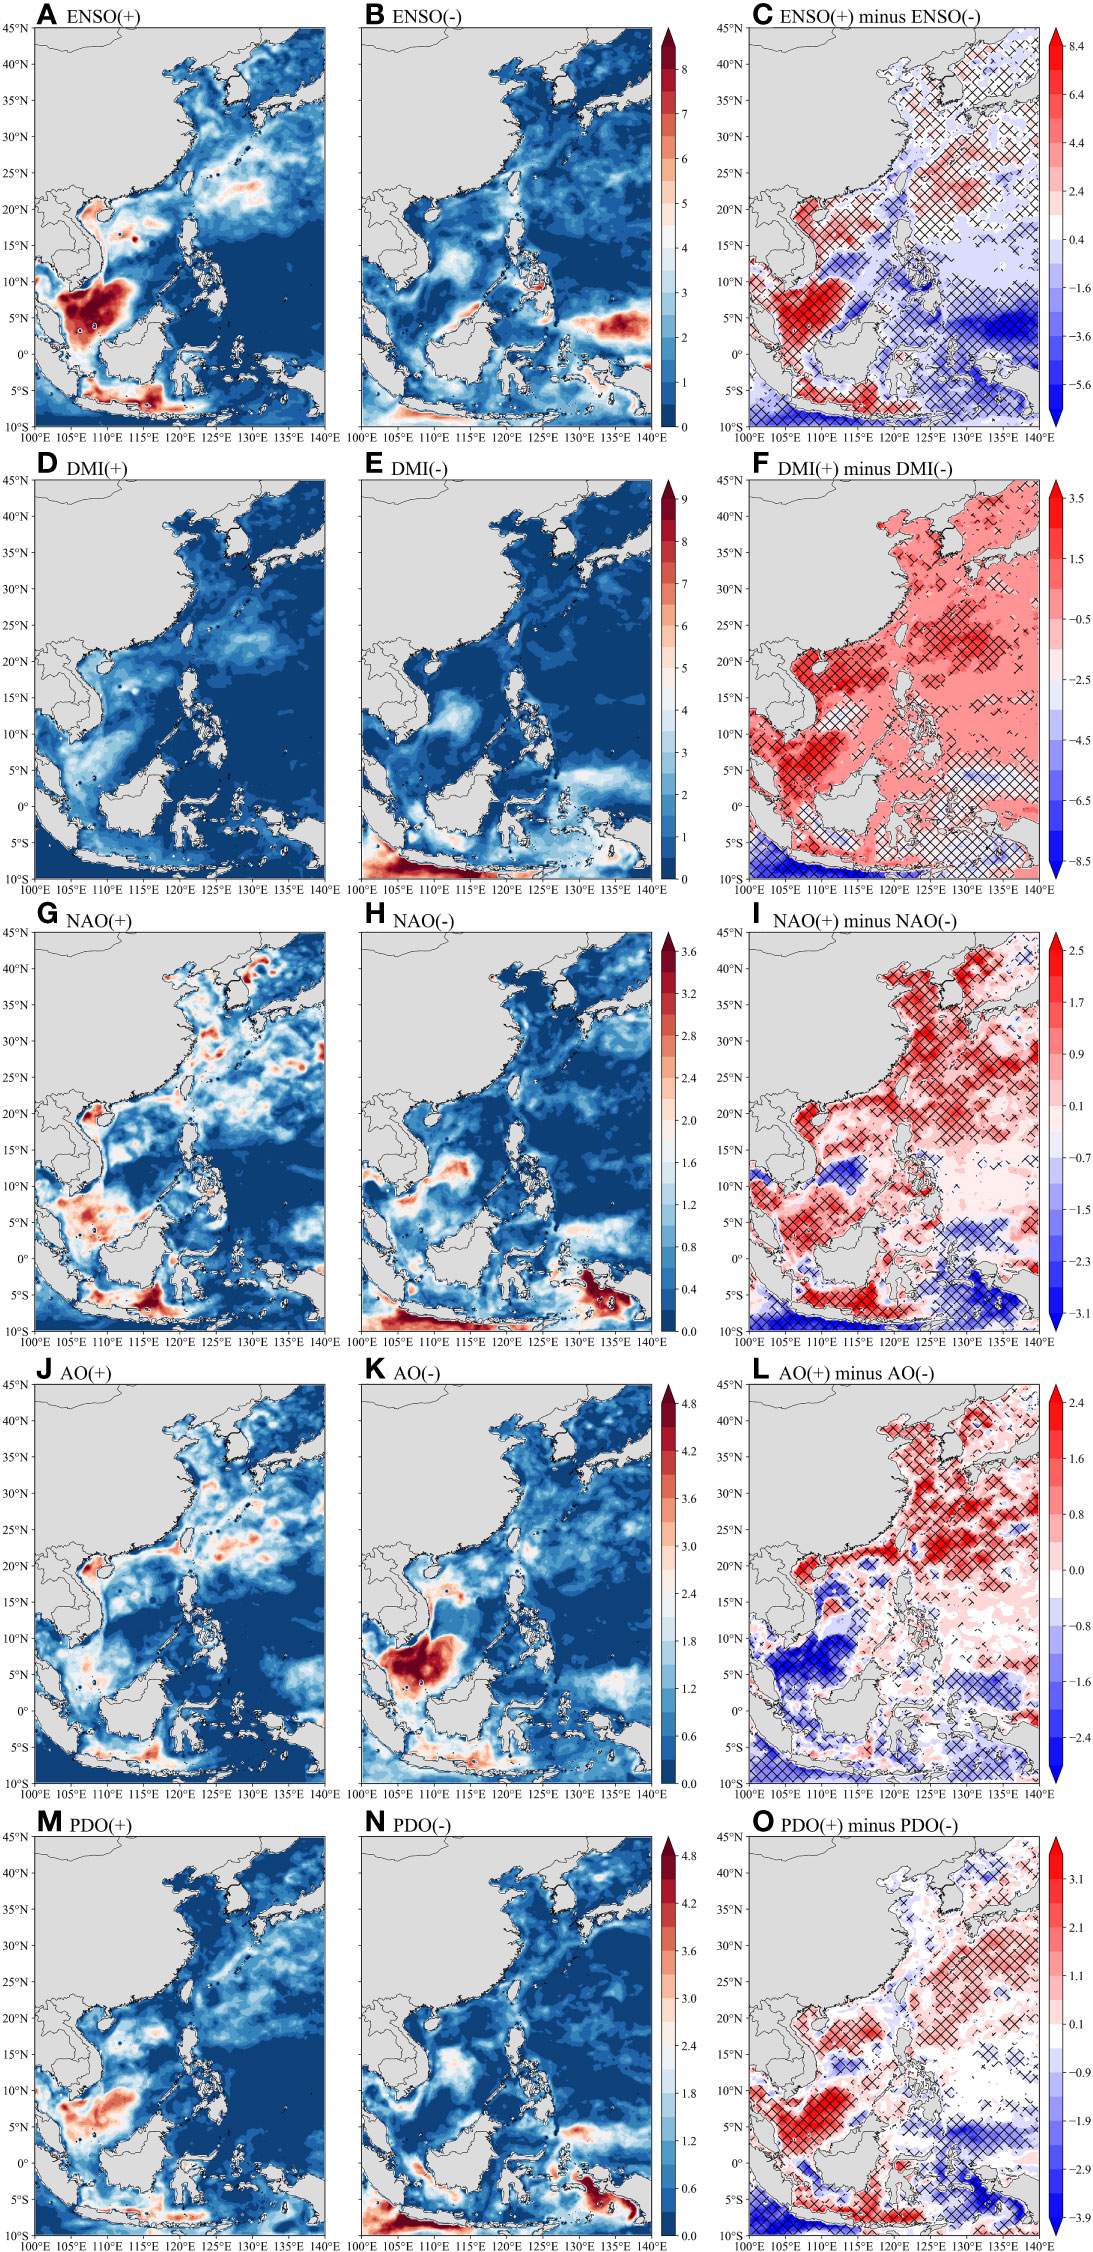
Figure 7 Total days change (units: d) in compound MHW-LChl extremes during positive and negative phases of several climate modes, as well as the difference between their phases over 1993–2020. Analyzed climate modes include (A–C) ENSO, (D–F) DMI, (G–I) NAO, (J–L) AO, and (M–O) PDO. The grid areas indicate statistical significance at the 99% confidence level.
The correlation pattern between MHW-LChl total days and DMI (Figure 6B) broadly resembles that of ENSO. However, during the positive phase of DMI (Figure 7D), MHW-LChl events in the WSCS are less affected by it than by ENSO; during the negative phase of DMI (Figure 7E), along the southern Sumatra-Java Island in IS are observed more MHW-LChl days (> 7.5 d) than in the negative ENSO phase. Different from both positive ENSO and DMI phases, the positive phase of NAO is the relatively dominant phase that enhances MHW-LChl days in the ECS, even if it has a slightly weak significant correlation coefficient (Figures 6C, 7G). The negative NAO phase is associated with increased compound events in western New Guinea and south of Java (> 2.6 d) (Figure 7H).
Similarly, the positive AO phase is another leading mode of compound events variability in the ECS (Figure 7J). On the other hand, its negative phase is related to higher MHW-LChl days in the south of WSCS (> 3.6 d) (Figure 7K), and increasing days are more than that in the positive phase (Figure 7L). That is, there is a negative correlation relationship in the southern WSCS, and vice versa during the other four climate modes (Figure 6 and third column in Figure 7). Since the spatial pattern of PDO resembles that of ENSO (Zhang et al., 1997), the occurrence of compound MHW-LChl events during PDO phases covers almost the same region influenced by ENSO (Figures 7M–O), whereas it brought less effect than ENSO (Figure 6E).
Overall, ENSO and the negative phase of DMI are both more important in regulating the inter-annual variability of compound MHW-LChl extremes throughout the entire study region, especially in the WSCS and IS, with their relative contributions differing across sub-regions. Positive NAO and AO phases seem to be the relatively primary modulators of compound extremes in some parts of the ECS.
4 Conclusions and discussion
In this study, we provide a systematic analysis of the multi-scale spatiotemporal variations in compound MHW-LChl extremes across the western Pacific Ocean from 1993 to 2020. We find that the compound MHW-LChl extremes in total days, duration, and intensity present a heterogeneous distribution in climatological mean (Figure 2). The hotspots of compound events are observed in the central-southern part of WSCS and the eastern and western sides of IS, which are coupled with a significant negative correlation between the SST and Chl anomalies. The trend maps of the three MHW-LChl features show a similar spatial pattern (Figure 4). The highest significant trends in MHW-LChl total days (> 4.2 d/decade), duration (> 1.4 d/decade) and intensity (> 0.5) are detected in the southern WSCS.
These results are consistent with recent studies that reported suppressed surface Chl during MHWs in regions with lower background nutrient concentration (Gupta et al., 2020; Hayashida et al., 2020; Noh et al., 2022). For example, Noh et al. (2022) reported that MHWs typically reduce Chl in the tropical and subtropical regions, where background nitrate concentrations are insufficient. Le Grix et al. (2021) discovered frequent compound MHW-LChl events in the central equatorial Pacific and Indian Ocean, which corresponds to the co-occurrence of MHWs and low net primary productivity events (Le Grix et al., 2022). However, the features of compound MHW-LChl events over the marginal seas are not revealed in Le Grix et al. (2021), we perform a more detailed analysis of multi-scale characteristics of compound MHW-LChl extremes over the western Pacific Ocean, including the marginal seas regions. More specific, we expanded the definition of compound MHW-LChl event to include its intensity and duration, which are significant characteristics of the compound event that should be considered when informing regionally tailored ocean mitigation and conservation strategies.
The spatial patterns for compound events exhibit remarkable seasonality, with the largest proportion of area occurring in winter and the least in summer (Figure 3). Over the whole study region, the spatial mean total days and duration of MHW-LChl events follow the order of winter > summer > autumn > spring. Specifically, most MHW-LChl events with strong intensity in the ECS occur in spring, especially along the vicinity of the Kuroshio Current; WSCS MHW-LChl events tend to have higher total days, be longer-lasting, and be more intense in winter than in other seasons; in the PS, it is hard to detect MHW-LChl events; and IS MHW-LChl events occur most often in summer and autumn, followed by winter. The underlying physical mechanisms of compound MHW-LChl extremes are expected to be seasonally different in each sub-region. For instance, in the ECS, MHW-LChl events may be due to atmospheric processes and Kuroshio variation with the redistribution of mass and energy (Yao et al., 2020). In the WSCS, the summer MHW-LChl events are supposed to be dominated by atmospheric forcing, including the weakening mid-western upwelling induced by the anomalous western North Pacific subtropical high (Yao and Wang, 2021) and intense anticyclonic eddy activity decreasing Chl (He et al., 2019); the winter MHW-LChl events occurrence may be driven by ocean dynamics, such as seasonal incursions of the Kuroshio Current (Xue et al., 2004; Chen et al., 2020). In the IS, MHW-LChl events could be attributed primarily to seasonally evolving coastal upwelling associated with the southeast monsoon (June–October) and northwest monsoon (December–April) (Wirasatriya et al., 2018; Wirasatriya et al., 2021; Mandal et al., 2022). Therefore, more process-oriented research is needed in the future to determine the precise physical and biogeochemical processes underlying the various spatial and seasonal patterns of compound MHW-LChl extreme events.
From the temporal variability of extreme events, we conclude that there are statistically significant linear increasing trends in MHW-LChl event properties across the entire study region for 1993–2020 (Figure 5). Due to a gradually increasing SST warming rate, MHWs occur more often (Frölicher and Laufkötter, 2018), whereas LChl events have slightly decreasing trends throughout the period. Moreover, earth system models project further ocean warming accompanied by a decline in primary productivity in the low to mid latitudes during the twenty-first century (Kwiatkowski et al., 2020). It will enhance pressure on marine organisms and ecosystems in these places over the next few decades. Given the aforementioned projected long-term trends and severe impacts, we encourage future work on disaster risk assessment of these compound extremes on marine ecosystems to promote marine biodiversity protection.
Additionally, some issues about our study should be brought to attention. Due to the paucity of chlorophyll observation data, we use model simulations from CMEMS, which have been well validated, but may suffer from limitations in capturing extremes due to model deficiency (Perruche et al., 2019). It is indispensable to make thorough comparisons among different datasets in capturing features of compound MHW-LChl extremes, to assess the uncertainties from different datasets and to overcome the potential overfitting issue due to the usage of a specific dataset. In addition, the quantitative results are sensitive to the threshold setting for extreme events. We utilized the 90th (10th) percentile thresholds for identifying compound MHW-LChl extremes. It seems more concerning for the stakeholders to use thresholds for defining events from the perspective of event impacts instead of statistical quantiles in the future.
In addition, our analysis revealed that ENSO and the negative DMI phase are primary modulators of MHW-LChl events in the WSCS and IS (Figures 6, 7). In the WSCS, ENSO substantially influences MHW-LChl occurrences, which is possibly attributed to the combined effects of the deepening thermocline and its dynamical response to surface wind stress changes, weak vertical mixing, formative downwelling, reduced upwelling, and the solar radiation process (Holbrook et al., 2019; Kong et al., 2019; Yao and Wang, 2021). The most prominent impact of DMI on the variability of MHW-LChl events is found in the IS, especially along the southern coast of Java-Sumatra Island. On the inter-annual timescale, the higher total MHW-LChl days are observed during the negative DMI years (e.g., 2010 and 2016), which is well supported by the deepening thermocline, positive sea surface height anomalies, and comparatively warm SST anomalies at the surface, all indicating reduced upwelling (Mandal et al., 2022). However, further in-depth studies are needed to explore the exact physical processes of individual climate modes in modifying MHW-LChl occurrences by incorporating additional approaches, such as empirical copula, logistic regression model (Hao et al., 2018; Mukherjee et al., 2022; Zhang et al., 2023), and mixed layer heat (nutrient) budget analysis (Gao et al., 2022; Liu et al., 2022).
Overall, our study provides new insights for a more comprehensive understanding of compound MHW-LChl extremes and associated drivers in the western Pacific Ocean, which set the basis for assessing the potential risk of compound events to marine organisms and ecosystems under the climate change.
Data availability statement
The original contributions presented in the study are included in the article/Supplementary Material. Further inquiries can be directed to the corresponding authors.
Author contributions
QC: Writing – original draft, Data curation, Formal Analysis, Visualization, Investigation. DL: Writing – review & editing, Conceptualization, Funding acquisition, Methodology, Project administration, Resources, Supervision. JF: Writing – review & editing, Conceptualization, Project administration, Resources, Supervision. LZ: Resources, Writing – review & editing. JQ: Software, Validation, Writing – review & editing. BY: Resources, Writing – review & editing.
Funding
The author(s) declare financial support was received for the research, authorship, and/or publication of this article. The study was supported by the National Key Research and Development Project of China (2022YFE0112800), the National Natural Science Foundation of China (grants 42176198), the Strategic Priority Research Program of the Chinese Academy of Sciences (XDB42000000), the Youth Innovation Promotion Association CAS (2022204), the Taishan Scholars Program (tsqn202211252), the Impact and response of Antarctic seas to climate change under contract RFSOCC2020-2022-No.18 and the Tianjin Research Innovation Project for Postgraduate Students (2022SKY104).
Acknowledgments
The authors would like to thank the organizations that provided the data used in this work, including the National Oceanic and Atmospheric Administration (NOAA) and the Copernicus Marine Environment Monitoring Service (CMEMS).
Conflict of interest
The authors declare that the research was conducted in the absence of any commercial or financial relationships that could be construed as a potential conflict of interest.
The author(s) declared that they were an editorial board member of Frontiers, at the time of submission. This had no impact on the peer review process and the final decision.
Publisher’s note
All claims expressed in this article are solely those of the authors and do not necessarily represent those of their affiliated organizations, or those of the publisher, the editors and the reviewers. Any product that may be evaluated in this article, or claim that may be made by its manufacturer, is not guaranteed or endorsed by the publisher.
Supplementary material
The Supplementary Material for this article can be found online at: https://www.frontiersin.org/articles/10.3389/fmars.2023.1303663/full#supplementary-material
References
Reynolds R. W., Smith T. M., Liu C., Chelton D. B., Casey K. S., Schlax M. G. (2007). Daily high-resolution-blended analyses for sea surface temperature. J. Clim. 20, 5473–5496. doi: 10.1175/2007JCLI1824.1
Arias-Ortiz A., Serrano O., Masqué P., Lavery P. S., Mueller U., Kendrick G. A., et al. (2018). A marine heatwave drives massive losses from the world’s largest seagrass carbon stocks. Nat. Clim. Change 8, 338–344. doi: 10.1038/s41558-018-0096-y
Aumont O., Ethé C., Tagliabue A., Bopp L., Gehlen M. (2015). PISCES-v2: an ocean biogeochemical model for carbon and ecosystem studies. Geosci. Model. Dev. 8, 2465–2513. doi: 10.5194/gmd-8-2465-2015
Banzon V., Smith T. M., Chin T. M., Liu C., Hankins W. (2016). A long-term record of blended satellite and in situ sea-surface temperature for climate monitoring, modeling and environmental studies. Earth Syst. Sci. Data 8, 165–176. doi: 10.5194/essd-8-165-2016
Bezak N., Mikoš M. (2020). Changes in the compound drought and extreme heat occurrence in the 1961–2018 period at the European scale. Water 12, 3543. doi: 10.3390/w12123543
Boyd P. W., Brown C. J. (2015). Modes of interactions between environmental drivers and marine biota. Front. Mar. Sci. 2. doi: 10.3389/fmars.2015.00009
Caputi N., Kangas M., Denham A., Feng M., Pearce A., Hetzel Y., et al. (2016). Management adaptation of invertebrate fisheries to an extreme marine heat wave event at a global warming hot spot. Ecol. Evol. 6, 3583–3593. doi: 10.1002/ece3.2137
Cavole L. C. M., Demko A. M., Diner R. E., Giddings A., Koester I., Pagniello C. M. L. S., et al. (2016). Biological impacts of the 2013-2015 warm-water anomaly in the Northeast Pacific. Oceanography 29, 273–285. doi: 10.5670/oceanog.2016.32
Chen Y., Zhai F., Li P. (2020). Decadal variation of the Kuroshio intrusion into the South China Sea during 1992–2016. J. Geophys. Res. Ocean. 125, e2019JC015699. doi: 10.1029/2019JC015699
Cheung W. W. L., Frölicher T. L. (2020). Marine heatwaves exacerbate climate change impacts for fisheries in the northeast Pacific. Sci. Rep. 10, 6678. doi: 10.1038/s41598-020-63650-z
Collins M., Sutherland M., Bouwer L., Cheong S. M., Frölicher T., Jacot Des Combes H., et al. (2019). “Extremes, abrupt changes and managing risk”, in IPCC Special Report on the Ocean and Cryosphere in a Changing Climate eds. Pörtner H.O., Roberts D.C., Masson-Delmotte V., Zhai P., Tignor M., Poloczanska E., et al (Geneva: World Meteorological Organization), 589-665. doi: 10.1017/9781009157964.008
Fang J., Liu W., Yang S., Brown S., Nicholls R. J., Hinkel J., et al. (2017). Spatial-temporal changes of coastal and marine disasters risks and impacts in Mainland China. Ocean Coast. Manage. 139, 125–140. doi: 10.1016/j.ocecoaman.2017.02.003
Founda D., Katavoutas G., Pierros F., Mihalopoulos N. (2022). The Extreme heat wave of summer 2021 in Athens (Greece): cumulative heat and exposure to heat stress. Sustainability 14, 7766. doi: 10.3390/su14137766
Frölicher T. L., Laufkötter C. (2018). Emerging risks from marine heat waves. Nat. Commun. 9, 650. doi: 10.1038/s41467-018-03163-6
Gao G., Yang D., Xu L., Zhang K., Feng X., Yin B. (2022). A biological-parameter-optimized modeling study of physical drivers controlling seasonal chlorophyll blooms off the southern coast of Java Island. J. Geophys. Res. Ocean. 127, e2022JC018835. doi: 10.1029/2022JC018835
Gruber N., Boyd P. W., Frölicher T. L., Vogt M. (2021). Biogeochemical extremes and compound events in the ocean. Nature 600, 395–407. doi: 10.1038/s41586-021-03981-7
Gupta A. S., Thomsen M., Benthuysen J. A., Hobday A. J., Oliver E., Alexander L. V., et al. (2020). Drivers and impacts of the most extreme marine heatwave events. Sci. Rep. 10, 1–15. doi: 10.1038/s41598-020-75445-3
Hamdeno M., Nagy H., Ibrahim O., Mohamed B. (2022). Responses of satellite chlorophyll-a to the extreme sea surface temperatures over the Arabian and Omani Gulf. Remote Sens. 14, 4653. doi: 10.3390/rs14184653
Hao Z., Hao F., Singh V., Zhang X. (2018). Quantifying the relationship between compound dry and hot events and El Niño–Southern Oscillation (ENSO) at the global scale. J. Hydrol. 567, 332–338. doi: 10.1016/j.jhydrol.2018.10.022
Hayashida H., Matear R. J., Strutton P. G. (2020). Background nutrient concentration determines phytoplankton bloom response to marine heatwaves. Glob. Change Biol. 26, 4800–4811. doi: 10.1111/gcb.15255
He Q., Zhan H., Xu J., Cai S., Zhan W., Zhou L., et al. (2019). Eddy-induced chlorophyll anomalies in the western South China Sea. J. Geophys. Res. Ocean. 124, 9487–9506. doi: 10.1029/2019JC015371
Hobday A. J., Alexander L. V., Perkins S. E., Smale D. A., Straub S. C., Oliver E. C. J., et al. (2016). A hierarchical approach to defining marine heatwaves. Progr. Oceanogr. 141, 227–238. doi: 10.1016/j.pocean.2015.12.014
Holbrook N. J., Scannell H. A., Sen Gupta A., Benthuysen J. A., Feng M., Oliver E. C. J., et al. (2019). A global assessment of marine heatwaves and their drivers. Nat. Commun. 10, 2624. doi: 10.1038/s41467-019-10206-z
IPCC (2019). Summary for policymakers. IPCC special report on the ocean and cryosphere in a changing climate. Available at: https://www.ipcc.ch/srocc/chapter/summary-for-policymakers/.
IPCC (2021). Climate Change 2021: The physical science basis. Contribution of working group I to the sixth assessment report of the intergovernmental panel on climate change Masson-Delmotte V., Zhai P., Pirani A., Connors S.L., Péan C., Berger S., et al (eds.)]. (Cambridge, United Kingdom and New York, NY, USA: Cambridge University Press). doi: 10.1017/9781009157896
Jacox M. G. (2019). Marine heatwaves in a changing climate. Nature 571, 485–487. doi: 10.1038/d41586-019-02196-1
Jacox M. G., Hazen E. L., Zaba K. D., Rudnick D. L., Edwards C. A., Moore A. M., et al. (2016). Impacts of the 2015–2016 El Niño on the California current system: early assessment and comparison to past events. Geophys. Res. Lett. 43, 7072–7080. doi: 10.1002/2016GL069716
Kong F., Dong Q., Xiang K., Yin Z., Li Y., Liu J. (2019). Spatiotemporal variability of remote sensing ocean net primary production and major forcing factors in the tropical eastern Indian and western Pacific Ocean. Remote Sens. 11, 391. doi: 10.3390/rs11040391
Kwiatkowski L., Torres O., Bopp L., Aumont O., Chamberlain M., Christian J. R., et al. (2020). Twenty-first century ocean warming, acidification, deoxygenation, and upper-ocean nutrient and primary production decline from CMIP6 model projections. Biogeosciences 17, 3439–3470. doi: 10.5194/bg-17-3439-2020
Laufkötter C., Zscheischler J., Frölicher T. L. (2020). High-impact marine heatwaves attributable to human-induced global warming. Science 369, 1621–1625. doi: 10.1126/science.aba0690
Le Grix N., Zscheischler J., Laufkötter C., Rousseaux C. S., Frölicher T. L. (2021). Compound high-temperature and low-chlorophyll extremes in the ocean over the satellite period. Biogeosciences 18, 2119–2137. doi: 10.5194/bg-18-2119-2021
Le Grix N., Zscheischler J., Rodgers K., Yamaguchi R., Frölicher T. L. (2022). Hotspots and drivers of compound marine heatwaves and low net primary production extremes. Biogeosciences 19, 5807–5835. doi: 10.5194/bg-19-5807-2022
Leising A., Schroeder I., Bograd S., Abell J., Durazo R., Gaxiola-Castro G., et al. (2015). State of the California Current 2014–15: impacts of the warm-water “Blob”. CalCOFI Rep. 56, 31–68. Available at: https://www.researchgate.net/publication/293491648_State_of_the_California_Current_2014-15_Impacts_of_the_warm-water_Blob.
Li D., Chen Y., Messmer M., Zhu Y., Feng J., Yin B., et al. (2022). Compound wind and precipitation extremes across the Indo-Pacific: climatology, variability, and drivers. Geophys. Res. Lett. 49. doi: 10.1029/2022GL098594
Li D., Chen Y., Qi J., Zhu Y., Lu C., Yin B. (2023). Attribution of the July 2021 record-breaking northwest Pacific marine heatwave to global warming, atmospheric circulation, and ENSO. Bull. Am. Meteorol. Soc 104, E291–E297. doi: 10.1175/BAMS-D-22-0142.1
Li Y., Ren G., Wang Q., Mu L., Niu Q. (2022). Marine heatwaves in the South China Sea: tempo-spatial pattern and its association with large-scale circulation. Remote Sens. 14, 5829. doi: 10.3390/rs14225829
Liu K., Xu K., Zhu C., Liu B. (2022). Diversity of marine heatwaves in the South China Sea regulated by ENSO phase. J. Clim. 35, 877–893. doi: 10.1175/JCLI-D-21-0309.1
Mandal S., Susanto R. D., Ramakrishnan B. (2022). On investigating the dynamical factors modulating surface chlorophyll-a variability along the south Java coast. Remote Sens. 14, 1745. doi: 10.3390/rs14071745
Mukherjee S., Mishra A. K., Ashfaq M., Kao S.-C. (2022). Relative effect of anthropogenic warming and natural climate variability to changes in compound drought and heatwaves. J. Hydrol. 605, 127396. doi: 10.1016/j.jhydrol.2021.127396
Noh K., Lim H. G., Kug J. S. (2022). Global chlorophyll responses to marine heatwaves in satellite ocean color. Environ. Res. Lett. 17, 064034. doi: 10.1088/1748-9326/ac70ec
Oliver E. C. J., Donat M. G., Burrows M. T., Moore P. J., Smale D. A., Alexander L. V., et al. (2018). Longer and more frequent marine heatwaves over the past century. Nat. Commun. 9, 1324. doi: 10.1038/s41467-018-03732-9
Perruche C. (2018). Product user manual for the global ocean biogeochemistry hindcast GLOBAL_REANALYSIS_BIO_001_029. Version 1. Copernicus Marine Environment Monitoring Service, Toulouse, France. doi: 10.25607/OBP-490
Perruche C., Szczypta C., Paul J., Drévillon M. (2019). Global production centre GLOBAL_REANALYSIS_BIO_001_029. (Toulouse, France: Copernicus Marine Environment Monitoring Service). doi: 10.48670/moi-00019
Sen P. K. (1968). Estimates of the regression coefficient based on Kendall’s tau. J. Am. Stat. Assoc. 63, 1379–1389. doi: 10.1080/01621459.1968.10480934
Smale D. A., Wernberg T., Oliver E. C. J., Thomsen M., Harvey B. P., Straub S. C., et al. (2019). Marine heatwaves threaten global biodiversity and the provision of ecosystem services. Nat. Clim. Change 9, 306–312. doi: 10.1038/s41558-019-0412-1
Tan H. J., Cai R. S., Wu R. G. (2022). Summer marine heatwaves in the South China Sea: trend, variability and possible causes. Adv. Clim. Change Res. 13, 323–332. doi: 10.1016/j.accre.2022.04.003
Thomson J. A., Burkholder D. A., Heithaus M. R., Fourqurean J. W., Fraser M. W., Statton J., et al. (2015). Extreme temperatures, foundation species, and abrupt ecosystem change: an example from an iconic seagrass ecosystem. Glob. Change Biol. 21, 1463–1474. doi: 10.1111/gcb.12694
Walsh J. E., Thoman R. L., Bhatt U. S., Bieniek P. A., Brettschneider B., Brubaker M., et al. (2018). The high latitude marine heat wave of 2016 and its impacts on Alaska. Bull. Am. Meteorol. Soc 99, S39–S43. doi: 10.1175/BAMS-D-17-0105.1
Wernberg T., Bennett S., Babcock R. C., de Bettignies T., Cure K., Depczynski M., et al. (2016). Climate-driven regime shift of a temperate marine ecosystem. Science 353, 169–172. doi: 10.1126/science.aad8745
Whitney F. A. (2015). Anomalous winter winds decrease 2014 transition zone productivity in the NE Pacific. Geophys. Res. Lett. 42, 428–431. doi: 10.1002/2014GL062634
Wirasatriya A., Prasetyawan I. B., Triyono C. D., Muslim, Maslukah L. (2018). Effect of ENSO on the variability of SST and chlorophyll-a in java sea. IOP Conf. Ser. Earth Environ. Sci. 116, 12063. doi: 10.1088/1755-1315/116/1/012063
Wirasatriya A., Susanto R., Jalil R., Ramdani F., Puryajati A. (2021). Northwest monsoon upwelling within the Indonesian seas. Int. J. Remote. Sens. 42, 5437–5458. doi: 10.1080/01431161.2021.1918790
Xue H., Chai F., Pettigrew N., Xu D., Shi M., Xu J. (2004). Kuroshio intrusion and the circulation in the South China Sea. J. Geophys. Res. Ocean. 109, e2019JC015801. doi: 10.1029/2002JC001724
Yao Y., Wang C. (2021). Variations in summer marine heatwaves in the South China Sea. J. Geophys. Res. Ocean. 126, e2021JC017792. doi: 10.1029/2021JC017792
Yao Y., Wang J., Yin J., Zou X. (2020). Marine heatwaves in China’s marginal seas and adjacent offshore waters: past, present, and future. J. Geophys. Res. Ocean. 125. doi: 10.1029/2019JC015801
Yue S., Wang C. Y. (2002). Applicability of prewhitening to eliminate the influence of serial correlation on the Mann-Kendall test. Water Resour. Res. 38, 41–47. doi: 10.1029/2001WR000861
Zhang D., Chen L., Yuan Y., Zuo J., Ke Z. (2023). Why was the heat wave in the Yangtze River valley abnormally intensified in late summer 2022? Environ. Res. Lett. 18, 034014. doi: 10.1088/1748-9326/acba30
Zhang Y., Wallace J. M., Battisti D. S. (1997). ENSO-like interdecadal variability: 1900–93. J. Clim. 10, 1004–1020. doi: 10.1175/1520-0442(1997)010<1004:ELIV>2.0.CO;2
Zscheischler J., Martius O., Westra S., Bevacqua E., Raymond C., Horton R. M., et al. (2020). A typology of compound weather and climate events. Nat. Rev. Earth Environ. 1, 333–347. doi: 10.1038/s43017-020-0060-z
Keywords: western Pacific Ocean, marine heatwaves, low-chlorophyll, compound extreme events, multi-scale variability, climate change
Citation: Chen Q, Li D, Feng J, Zhao L, Qi J and Yin B (2023) Understanding the compound marine heatwave and low-chlorophyll extremes in the western Pacific Ocean. Front. Mar. Sci. 10:1303663. doi: 10.3389/fmars.2023.1303663
Received: 28 September 2023; Accepted: 15 November 2023;
Published: 29 November 2023.
Edited by:
Qicheng Meng, Ministry of Natural Resources, ChinaReviewed by:
Wenxia Zhang, Ministry of Natural Resources, ChinaQiong Wu, Zhejiang Ocean University, China
Haocai Huang, Zhejiang University, China
Copyright © 2023 Chen, Li, Feng, Zhao, Qi and Yin. This is an open-access article distributed under the terms of the Creative Commons Attribution License (CC BY). The use, distribution or reproduction in other forums is permitted, provided the original author(s) and the copyright owner(s) are credited and that the original publication in this journal is cited, in accordance with accepted academic practice. No use, distribution or reproduction is permitted which does not comply with these terms.
*Correspondence: Delei Li, ZGVsZWlsaUBxZGlvLmFjLmNu; Jianlong Feng, ZmpsMTgxOTg4QHR1c3QuZWR1LmNu