 Zhenhua Wang
 Qiaofeng Ma1†
 Wenhao Hou
95% of researchers rate our articles as excellent or good
Learn more about the work of our research integrity team to safeguard the quality of each article we publish.
Find out more
ORIGINAL RESEARCH article
Front. Mar. Sci. , 09 January 2024
Sec. Marine Ecosystem Ecology
Volume 10 - 2023 | https://doi.org/10.3389/fmars.2023.1297137
This article is part of the Research Topic Tropical Blue Carbon: Challenges and Opportunities View all 8 articles
Seagrass plays an important role in global coastal ecosystems but is among the least conserved marine ecosystems. The Northern Chinese Seas have abundant seagrasses. However, the limited information on their distribution and habitat suitability has hindered seagrass conservation and restoration in this area. The maximum entropy (MaxEnt) model was developed to study the distribution and habitat suitability of seagrasses. First, the model was developed using seagrass occurrence points and environmental variables data. The predictions were visualized using ArcGIS to create a map of potential seagrass distribution. Next, the Jackknife analysis tool and contribution rate were used to identify and quantify the dominant environmental variables. The predictions were analyzed to quantify the suitable range of the dominant environmental variables and determine the conditions for seagrass habitat suitability in the study area. Finally, the predictions were re-analyzed. By coupling the previous predictions and re-analysis results, the areas and suggestions for seagrass conservation and restoration were identified and recommended. The results indicated the predictions of the model were highly reliable, with a total potential seagrasses distribution area was 3,296.47 km2 in the study area. The distance from the shore, transparency, substrate type, SST, and nitrate concentration were identified as the dominant environmental variables. Seagrasses habitat suitability was high in study area when the distance from the shore was < 210 m, the SST was around 11 ~ 25°C, the substrate type was sandy with high mud content, the substrate particle size was around 35 ~ 330 µm, the transparency was around 0.7 ~ 1.5 m, and the nitrate concentration was< 6.4 mol·m-3. This was the first study in which seagrasses were investigated and predicted in the Northern Chinese Seas, and their potential distribution and suitable habitat conditions were assessed. Our work will not only provide fundamental information for coastal seagrass ecosystem management, but also serve as a method to support the conservation and restoration of seagrasses.
Seagrasses are flowering plants that have adapted to aquatic settings (Unsworth et al., 2019). They are widely distributed along temperate and tropical coastlines. They not only provide nursery and foraging grounds for marine species (Unsworth et al., 2019) but also participate in carbon capture and storage (Mazarrasa et al., 2018). However, seagrass and its ecosystem services are under the threat of increasing natural (extreme climate) and human pressure (Figure 1). This makes the complete habitat of seagrass cut and dispersed into small patches. Large-scale losses in seagrasses occurred around the world during the past decade. Since 1990, the rate of decline in seagrass areas has increased to 7% annually (Waycott et al., 2009).
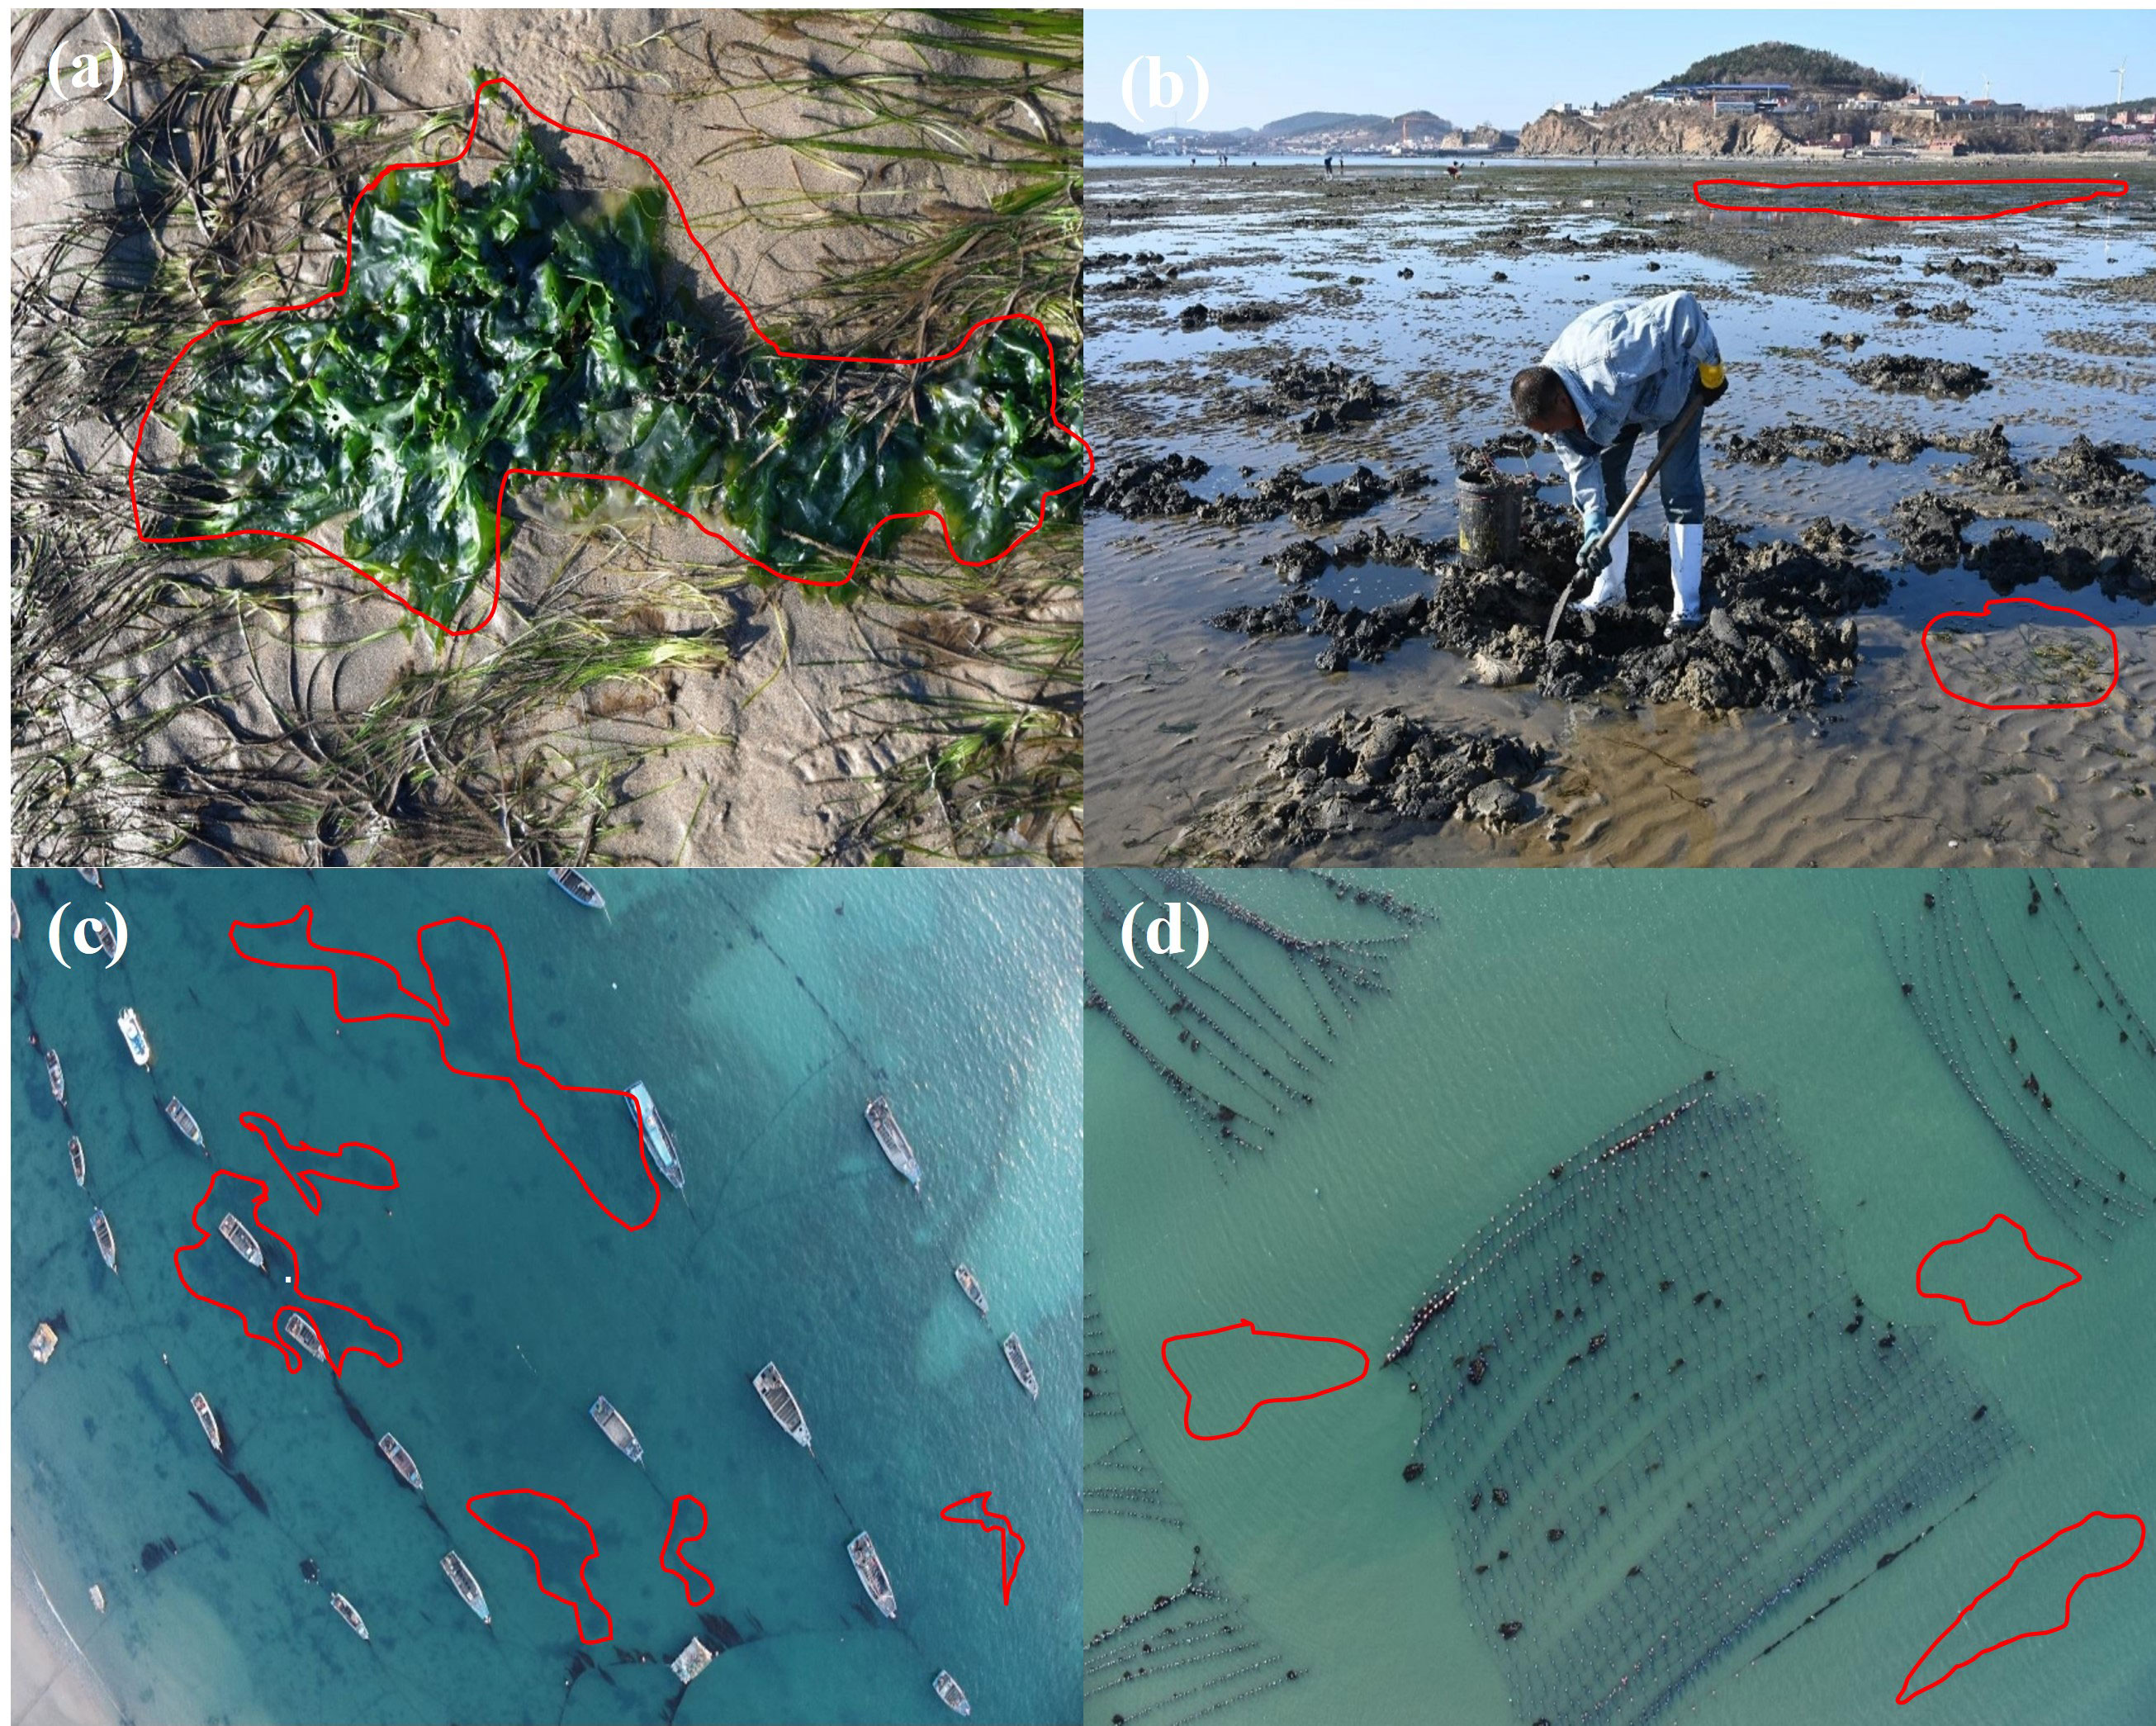
Figure 1 Humal pressure on seagrasses habitats (A) algae attachment, (B) snail dredging, (C) ship docking, and (D) fishery aquaculture (All the figures were taken by field investigation).
Under the concept of blue carbon, several researchers have also found that seagrasses help stabilize our climate by storing and sequestering carbon in the sediment (Duarte et al., 2013). Thus, seagrasses need to be conserved. Only 26% of all recorded seagrass fall within Marine Protected Areas (MPAs), which is lower compared to coral reefs (40%) and mangroves (43%) in MPAs (UN Envirionment Programme, 2020); the percentage of seagrass within protected areas in China is even lower. Seagrasses distribution and habitat suitability are expected to receive greater attention in the future, considering that seagrass management is a Nature-based Solution (NbS) to climate change and can contribute to the ‘30·60’ goal of China (Garmendia et al., 2023).
Seagrass in China is primarily distributed in the Southern Chinese Seas and the Northern Chinese Seas. The abundance and diversity of seagrass species is higher in the Southern Chinese Seas than in the Northern Chinese Seas (Hu et al., 2021). Green and Short (2003) published a global synthesis report on seagrass distribution and status in the “World Atlas of Seagrass”, which showed the distribution and diversity of seagrass around the globe. UNEP-WCMC, Short, F.T (2018) updated the global distribution dataset of seagrass. However, information on the occurrence of seagrass in the Northern Chinese Seas is inadequate. Seagrass in China is mostly distributed in the low intertidal zone and subtidal zone at a depth of approximately 4 m (Xiao et al., 2020). These areas are difficult to reach on foot or by boat, which makes seagrass data collection costly and inefficient. Although surveys on seagrass in China started in the 1980s, most of them mainly focused on specific bays, and thus, the information collected on seagrass distribution and habitat suitability was limited.
Determining the distribution and habitat suitability of seagrass can enhance our understanding of its resources and help in formulating strategies for conserving and restoring seagrass. Researchers around the world have mainly focused on the species, diversity, and biomass of seagrass (McHenry et al., 2023; Prihadi et al., 2023; Yang et al., 2023). Seagrass conservation has been ignored due to limited information on its distribution and habitat suitability. Due to a lack of conservation, seagrass in China has decreased considerably and is now found in small patches scattered along the coast (Xu et al., 2022).
Species distribution models (SDMs) are commonly used to study species distribution and habitat suitability, especially of species that are difficult to monitor. This approach associates species distribution and the environment to predict the likelihood of existing in a specific area while analyzing the underlying environmental drivers of their geographic distribution. The application of SDMs in marine ecosystems has increased significantly (Melo-Merino et al., 2020). The maximum entropy (MaxEnt) model is a type of SDM that has been widely used in recent decades. Jayathilake and Costello (2018) used the MaxEnt model to predict the global distribution of seagrass. However, this model allows researchers to predict seagrass distribution only at a small scale.
In this study, we investigated the Northern Chinese Seas and developed a MaxEnt model to predict potential seagrass distribution and habitat suitability. The areas of distribution and suggestions for seagrass conservation and restoration were determined after re-analyzing the predictions. The aims of this study were as follows: (i) to test the reliability of the MaxEnt model in predicting potential seagrass distribution and habitat suitability; (ii) map the potential distribution of seagrass in the study area; (iii) identify the dominant variables and quantify the suitable habitat conditions of seagrass in the study area; (iv) identify areas and provide suggestions for the conservation and restoration of seagrass in the study area.
The study area included the Bohai Sea and part of the Yellow Sea, which covered the north coast of mainland China, including the Liaoning province, Hebei province, and most of the Shandong province, as well as, Tianjin municipality (Figure 2). The study area was within 35.8°N to 41.1°N and 117.6°E to 123.2°E. The southern boundary of the study area was located south of Qingdao City, and the eastern boundary was set as the eastern part of Zhuanghe City. The total area of the study site was 133,099.8 km2. Three seagrasses genera and nine seagrasses species identified in this area, with Z. marina and Z. japonica are two dominant species.
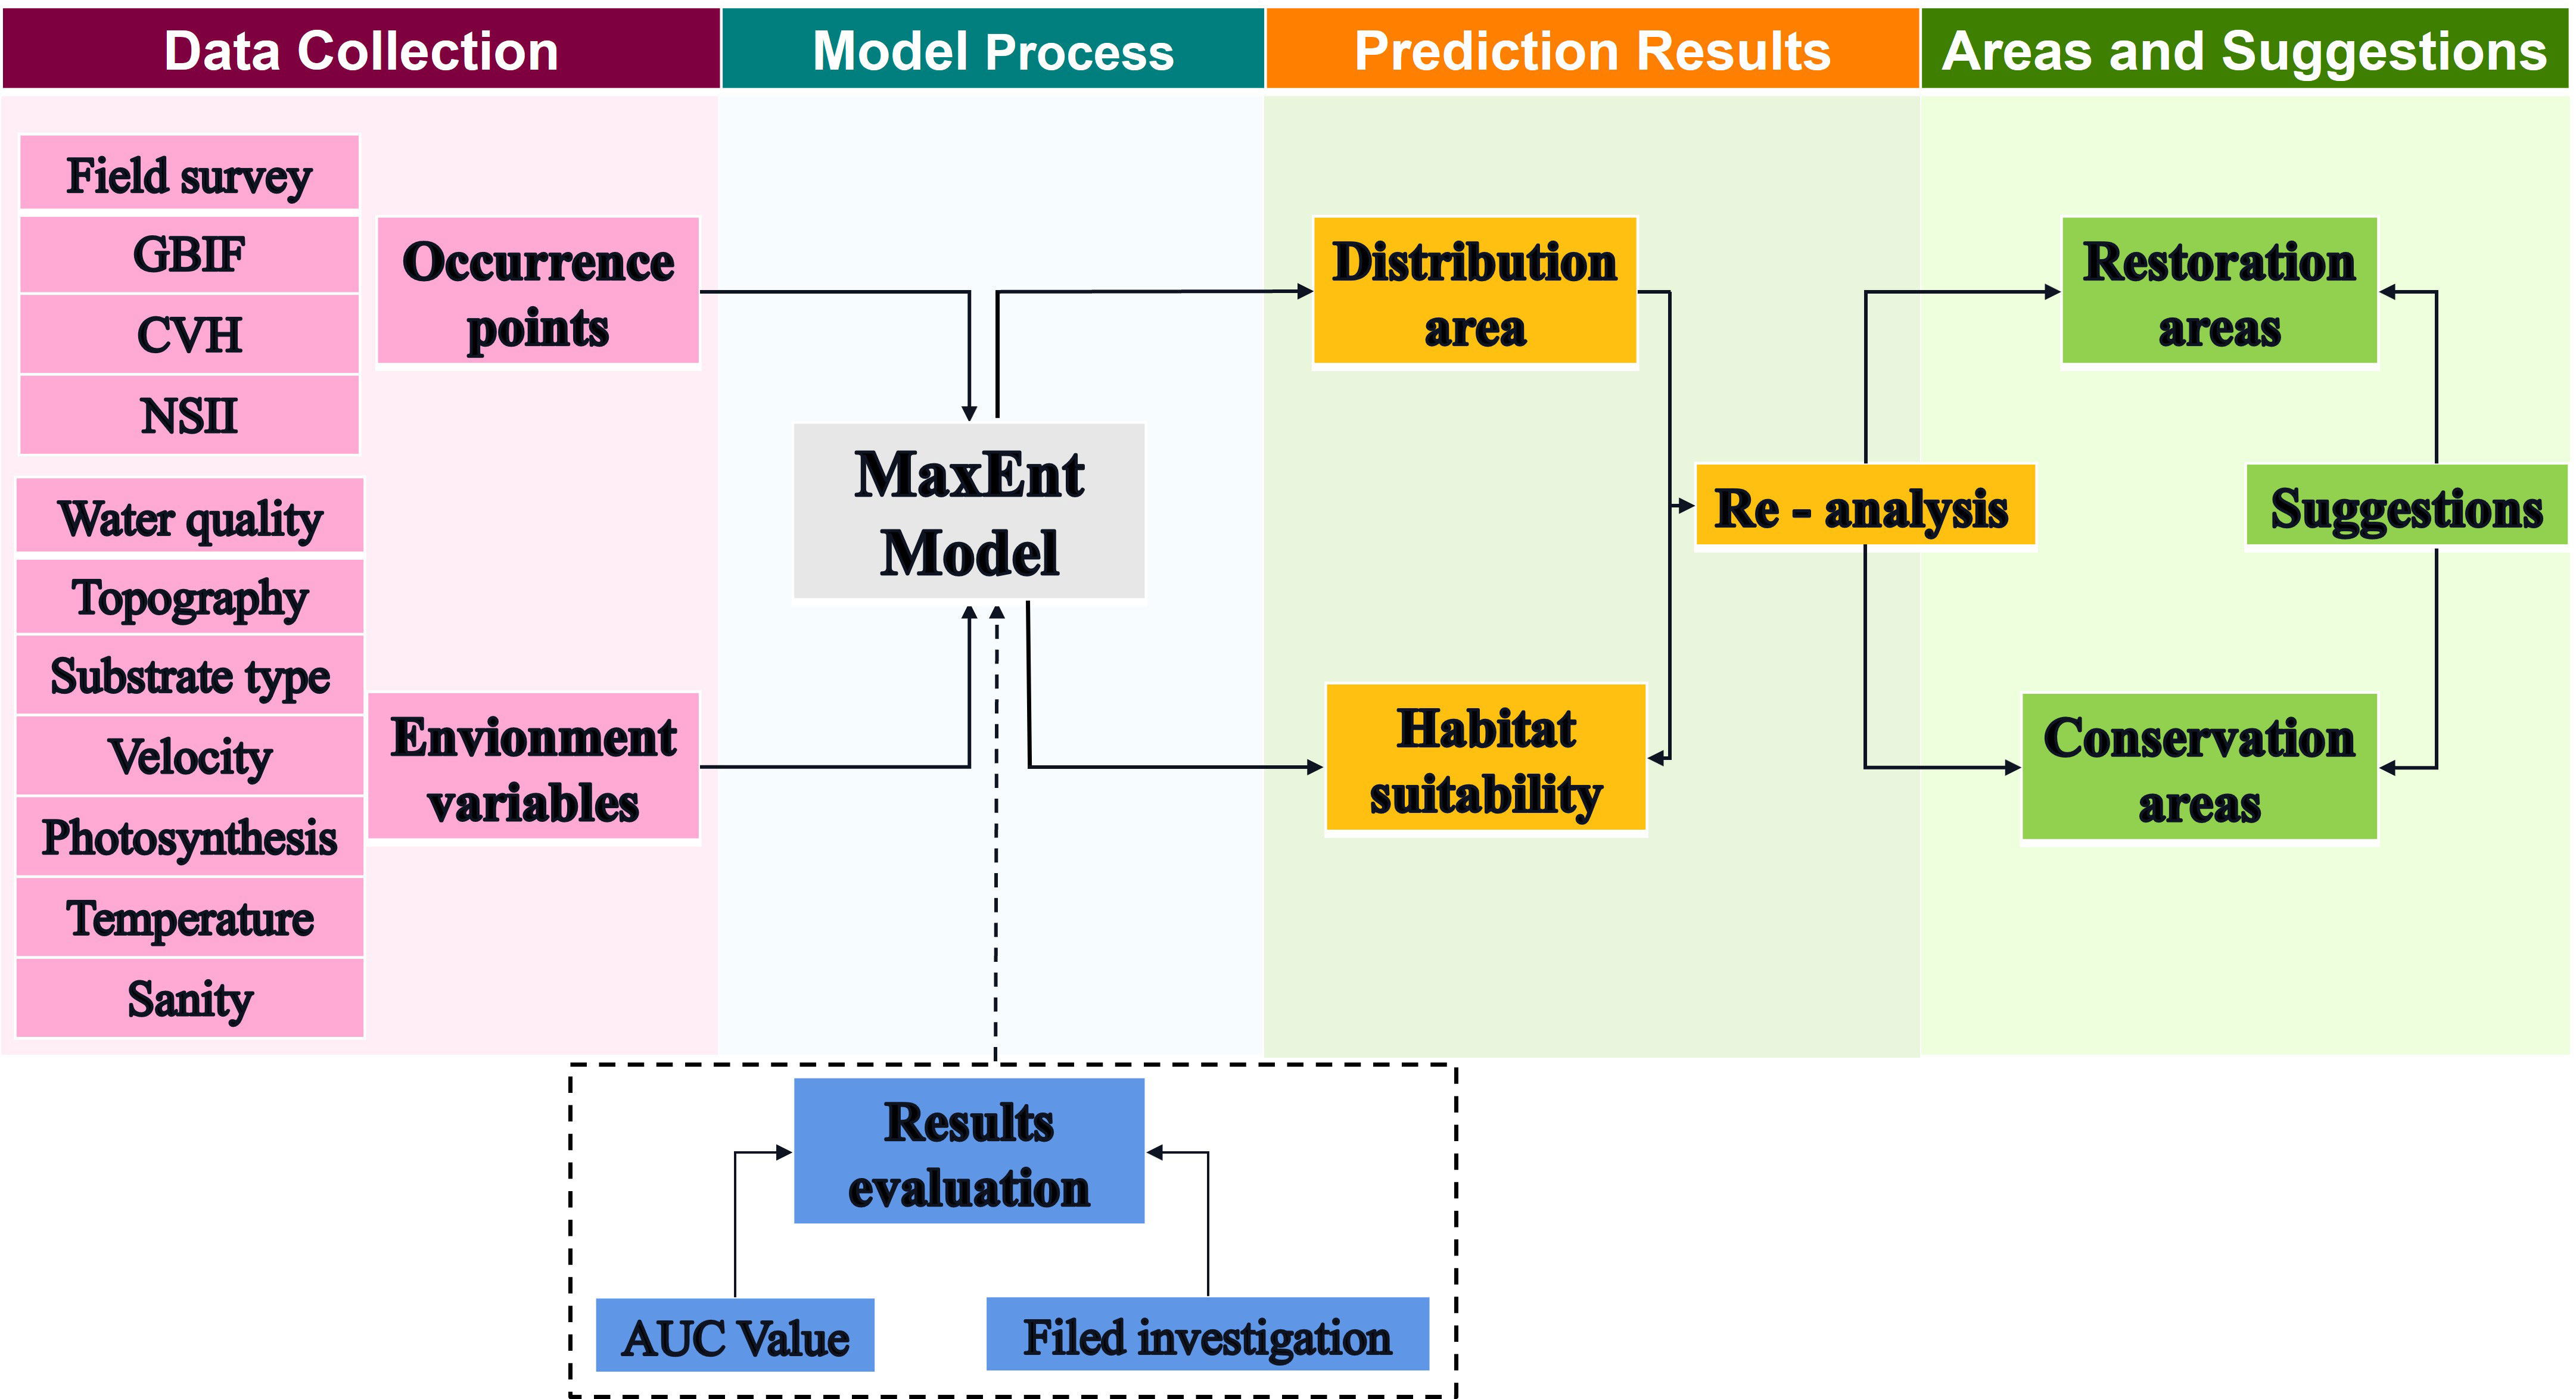
Figure 2 Research flowchart.
The flowchart of this study is shown in Figure 2. First, the MaxEnt model was applied using seagrass occurrence points and environmental variables. The reliability of the model and predictions were evaluated using the AUC value and field investigation results. Next, the predictions of seagrass distribution and habitat suitability were analyzed. Finally, the predictions were re-analyzed to identify areas and suggestions for seagrass conservation and restoration.
We developed a MaxEnt model to simulate potential seagrass distribution and habitat suitability. When assessing the potential distribution, seagrass and its living environment were considered to be a living system. By calculating the state parameters when the system reached the maximum entropy, the relatively stable relationship between the seagrass and the environment was determined. This information was used to speculate the distribution of seagrass.
We selected 75% of the seagrass distribution data to train the model, whereas the remaining 25% of the data were used to test the model. The suggested default settings of convergence threshold (10 – 5), maximum iterations (500), and maximum background points (10,000) were bootstrap resampled 10 times, with the average being the final prediction.
The predictions were plotted as a grid map at a resolution of 1 km. The value of each grid cell represented the distribution probability, ranging from 0 to 1. Larger values indicated a higher likelihood of species presence. We extracted the predicted probability values for each seagrass occurrence point and considered the lowest value to be the lowest occurrence threshold. Areas below this value were classified as areas without seagrass.
The MaxEnt model used seagrasses occurrence data to make predictions. All seagrass species in the study area should be considered to map the distribution of Northern Chinese Seas seagrass. Since information on the distribution of seagrasses is relatively limited in the Northern Chinese Seas, there was little public data for our study area (Xiao et al., 2020). Additionally, due to the significant variation in water quality along the near-shore areas of mainland China, extracting information on seagrasses distribution from remote sensing data is challenging (Esteban et al., 2018). We generated a dataset from several sources, including field sampling data, unpublished personal observations, published data, and the literature reviewed. Field sampling data were conducted between 2019 and 2023, mainly covering the Liaoning, Hebei and Shandong provinces. After collecting occurrence records, we identified the dominant seagrass species in study area: Z. marina and Z. japonica. All occurrences of seagrass species were recorded, forming a comprehensive database of seagrass records in the Northern Chinese Seas. A total of 95 seagrass occurrence points were recorded for all seagrasses species in study area. Around these occurrence points, a 1 km buffer zone was established that had environmental conditions similar to those of the occurrence points and could be suitable for seagrasses. The occurrence information included the seagrasses type, latitude, and longitude. The data were screened using the tool “Spatially Rarefy Occurrence Data” to ensure that the occurrence data were spatially independent and to avoid over-fitting towards environmental biases, after which the data were extracted as model input.
A range of environmental data was used to estimate the current distribution of seagrasses in the study area. Based on the information from published studies (Orth et al., 2000; Lee et al., 2007; Waycott et al., 2009; Sweatman et al., 2017), we selected the environmental variables which have been related to the seagrass distribution and physiological processes include light, substrate type, depth, temperature and salinity (Table 1). Water quality variables such as PH, chlorophyll(C), suspended solids, transparency, dissolved oxygen(D.o), phosphorous(P) and nitrogen(N) concentrations are strongly correlated with seagrass distribution. It affects the uptake of nutrients from seawater and sediment interstitials by seagrasses roots, rhizomes, leaves, and other tissues (Wang et al., 2016). Water velocity can assist the diffusion of nitrogen and is beneficial to the growth of seagrass. When the velocity is too large, the seagrass distribution could be affected due to the possible change of substrate type (Prihadi et al., 2023; Yang et al., 2023). Therefore, environmental variables, directly or indirectly affecting seagrass growth and distribution were selected and classified into water quality, substrate type, topography, sea surface temperature (SST), sea surface salinity (SSS), light and velocity (Table 1).
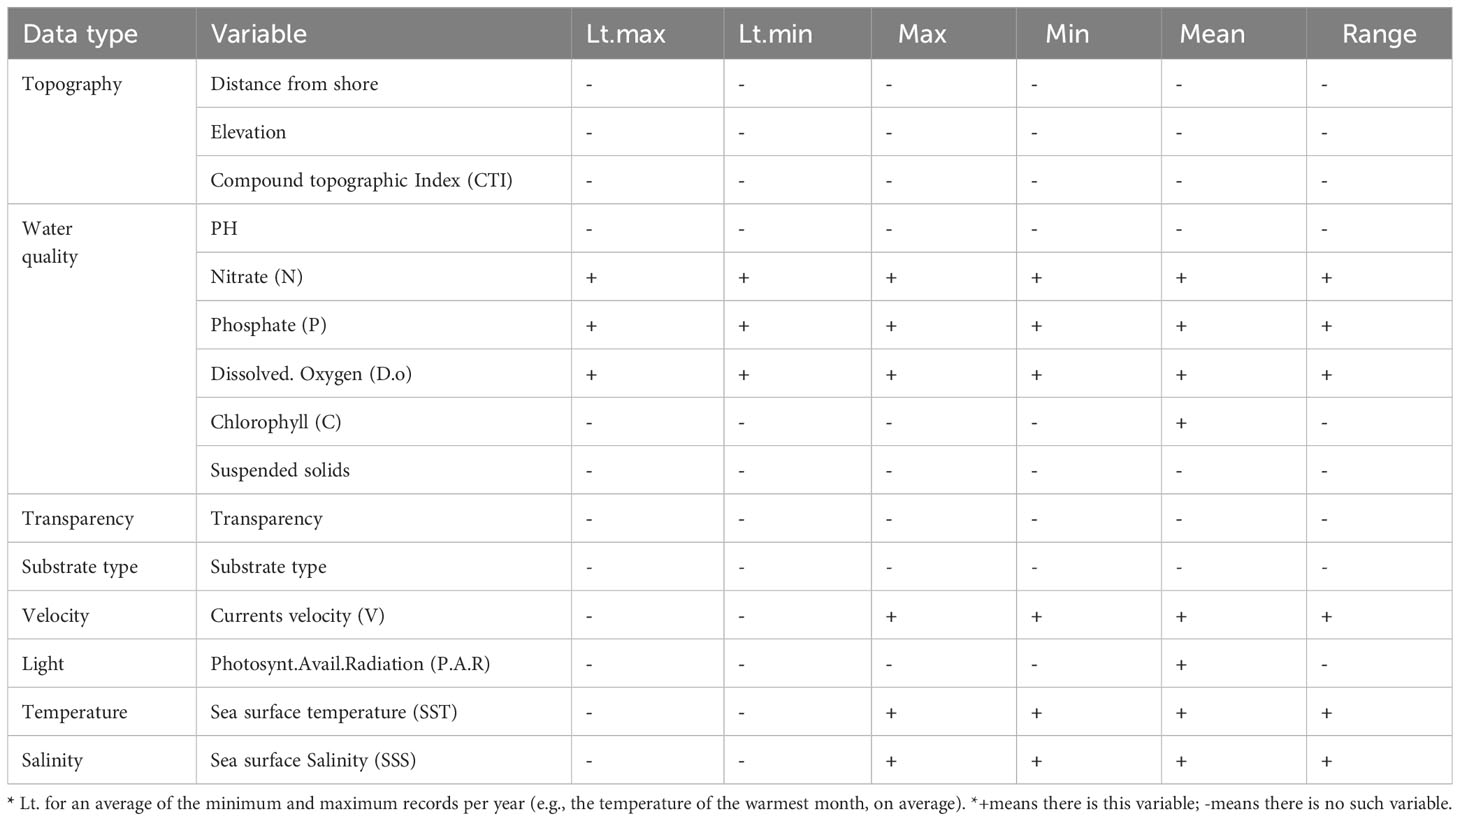
Table 1 The list of environmental variables.
This paper focuses on the impact of environmental variables on the seagrass potential distribution and suitable habitat. The primary sources of these data were nautical charts, ArcGIS software calculations, and a variety of remote sensing databases. The elevation data with a resolution of 500 m were obtained from the General Bathymetric Chart of the Oceans (GEBCO, http://www.gebco.net/) and were transformed into the Compound topographic Index (CTI) using the ArcGIS. Annual average Nitrate (N), Phosphate (P), Dissolved oxygen (D.o), Chlorophyll (C), Photosynt. Avail. Radiation (P.A.R), Sea Surface Salinity (SSS) and current velocity (V) were obtained from Bio-ORACLE (https://www.bio-oracle.org/), with the period is present. Raster data on Sea Surface Temperature (SST) was obtained from the NASA OceanColor level-3 products (https://oceancolor.gsfc.nasa.gov/), with time is 2020 at a spatial resolution of 4 km. Substrate type data was extracted from the 2018 AHO S57 map. Transparency and suspended solids data were obtained from the National Marine Data Center (https://mds.nmdis.org.cn/), with time is 2020 at a spatial maximum resolution of 500m. Distance from shore data was obtained from Global Fishing Watch (https://globalfishingwatch.org), with the last update was 2020 at a spatial resolution of 1 km.
The variables were unified into the same area scope. The topography data have the highest resolution of 500 m, whereas the other environmental data have a lower resolution of 4 ~ 9 km. To handle the lower-resolution data, we first used the Filter tool in ArcGIS 10.8 to fill in NoData holes at the coastline. Then, Kriging interpolation was used to downscale the data resolution to 1 km. For high-resolution data, the same interpolation has a 1km resolution. To eliminate collinearity between environmental variables and to remove redundant information, a Pearson correlation analysis (Figure 3) of environmental factors was performed. First, using ArcGIS 10.8 to extract environmental variables value to each seagrass occurrence point. Additionally, we classified environmental variables into four categories: temperature, salinity, velocity and water quality. Variables were assessed for intra-group correlation according to categories separately. Threshold-based (r = 0.8) variable selection analysis (Pearson rank correlation coefficients) was performed (Figure 4). Strongly correlated variables were calculated and removed from the calibration process. (Lemke et al., 2011). Consequently, the less influential variables are eliminated, and the remaining ones (Table 2) are used for the final simulation.
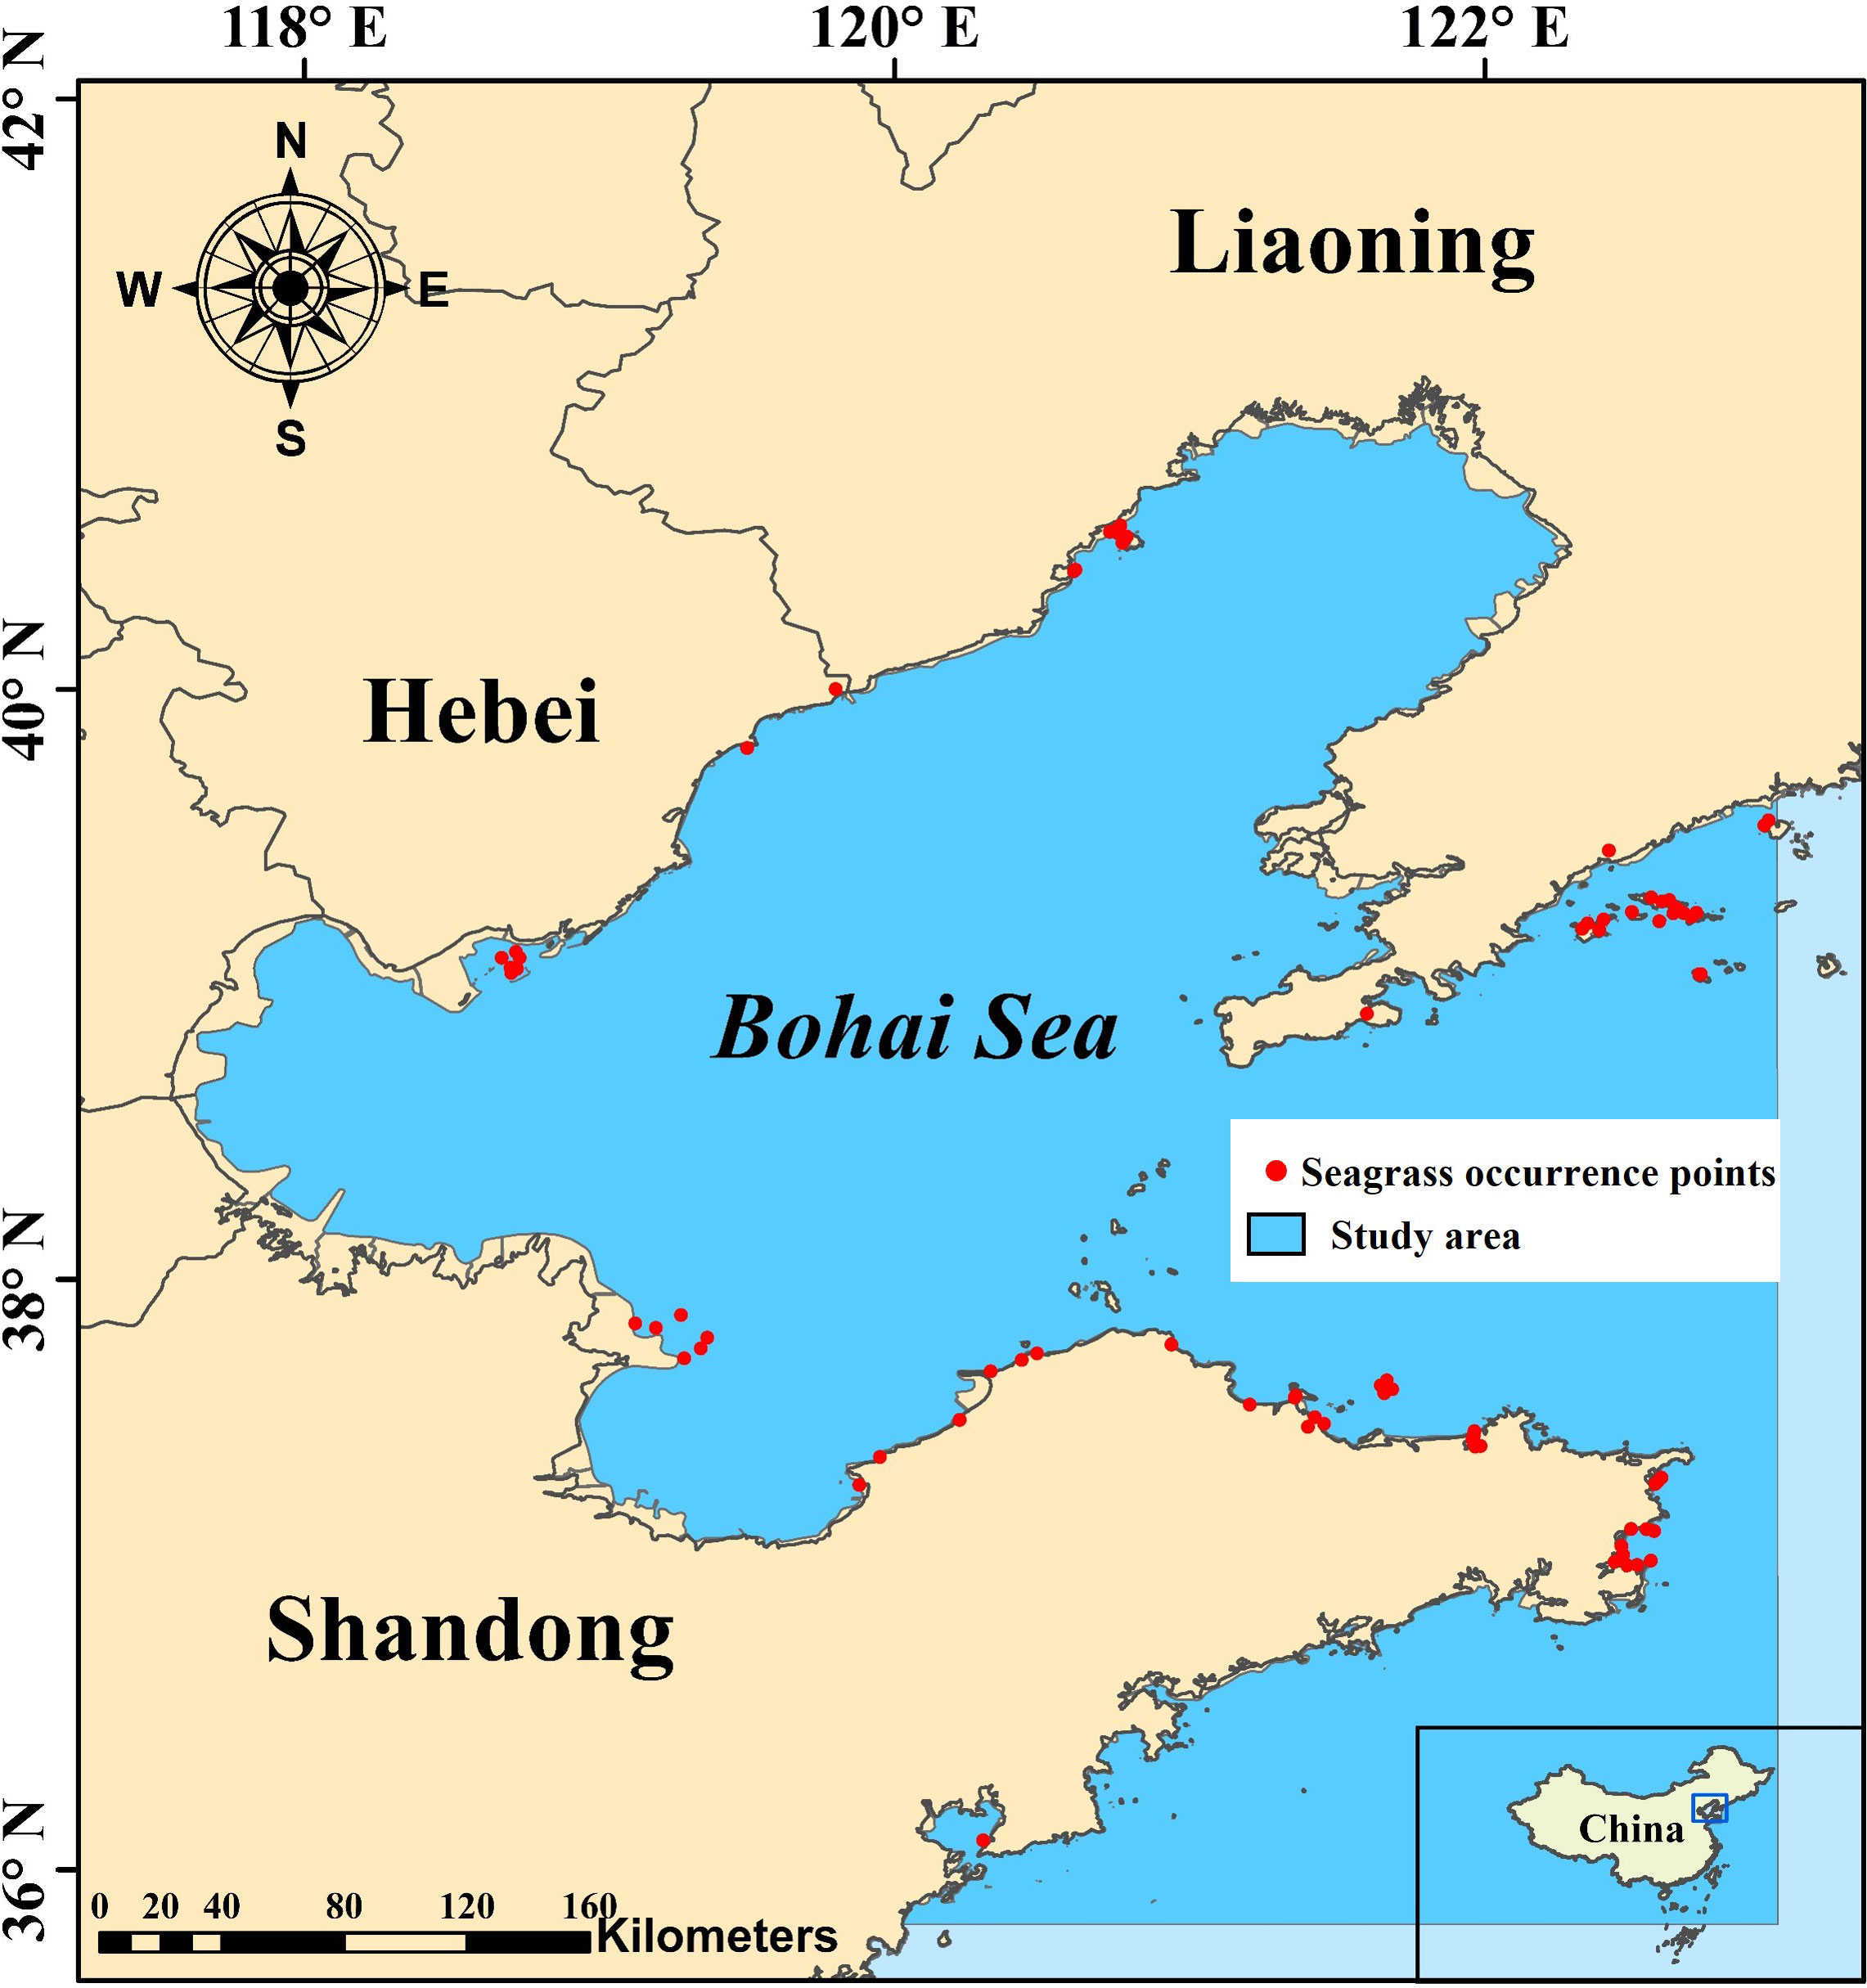
Figure 3 The study area and seagrasses occurrence points.
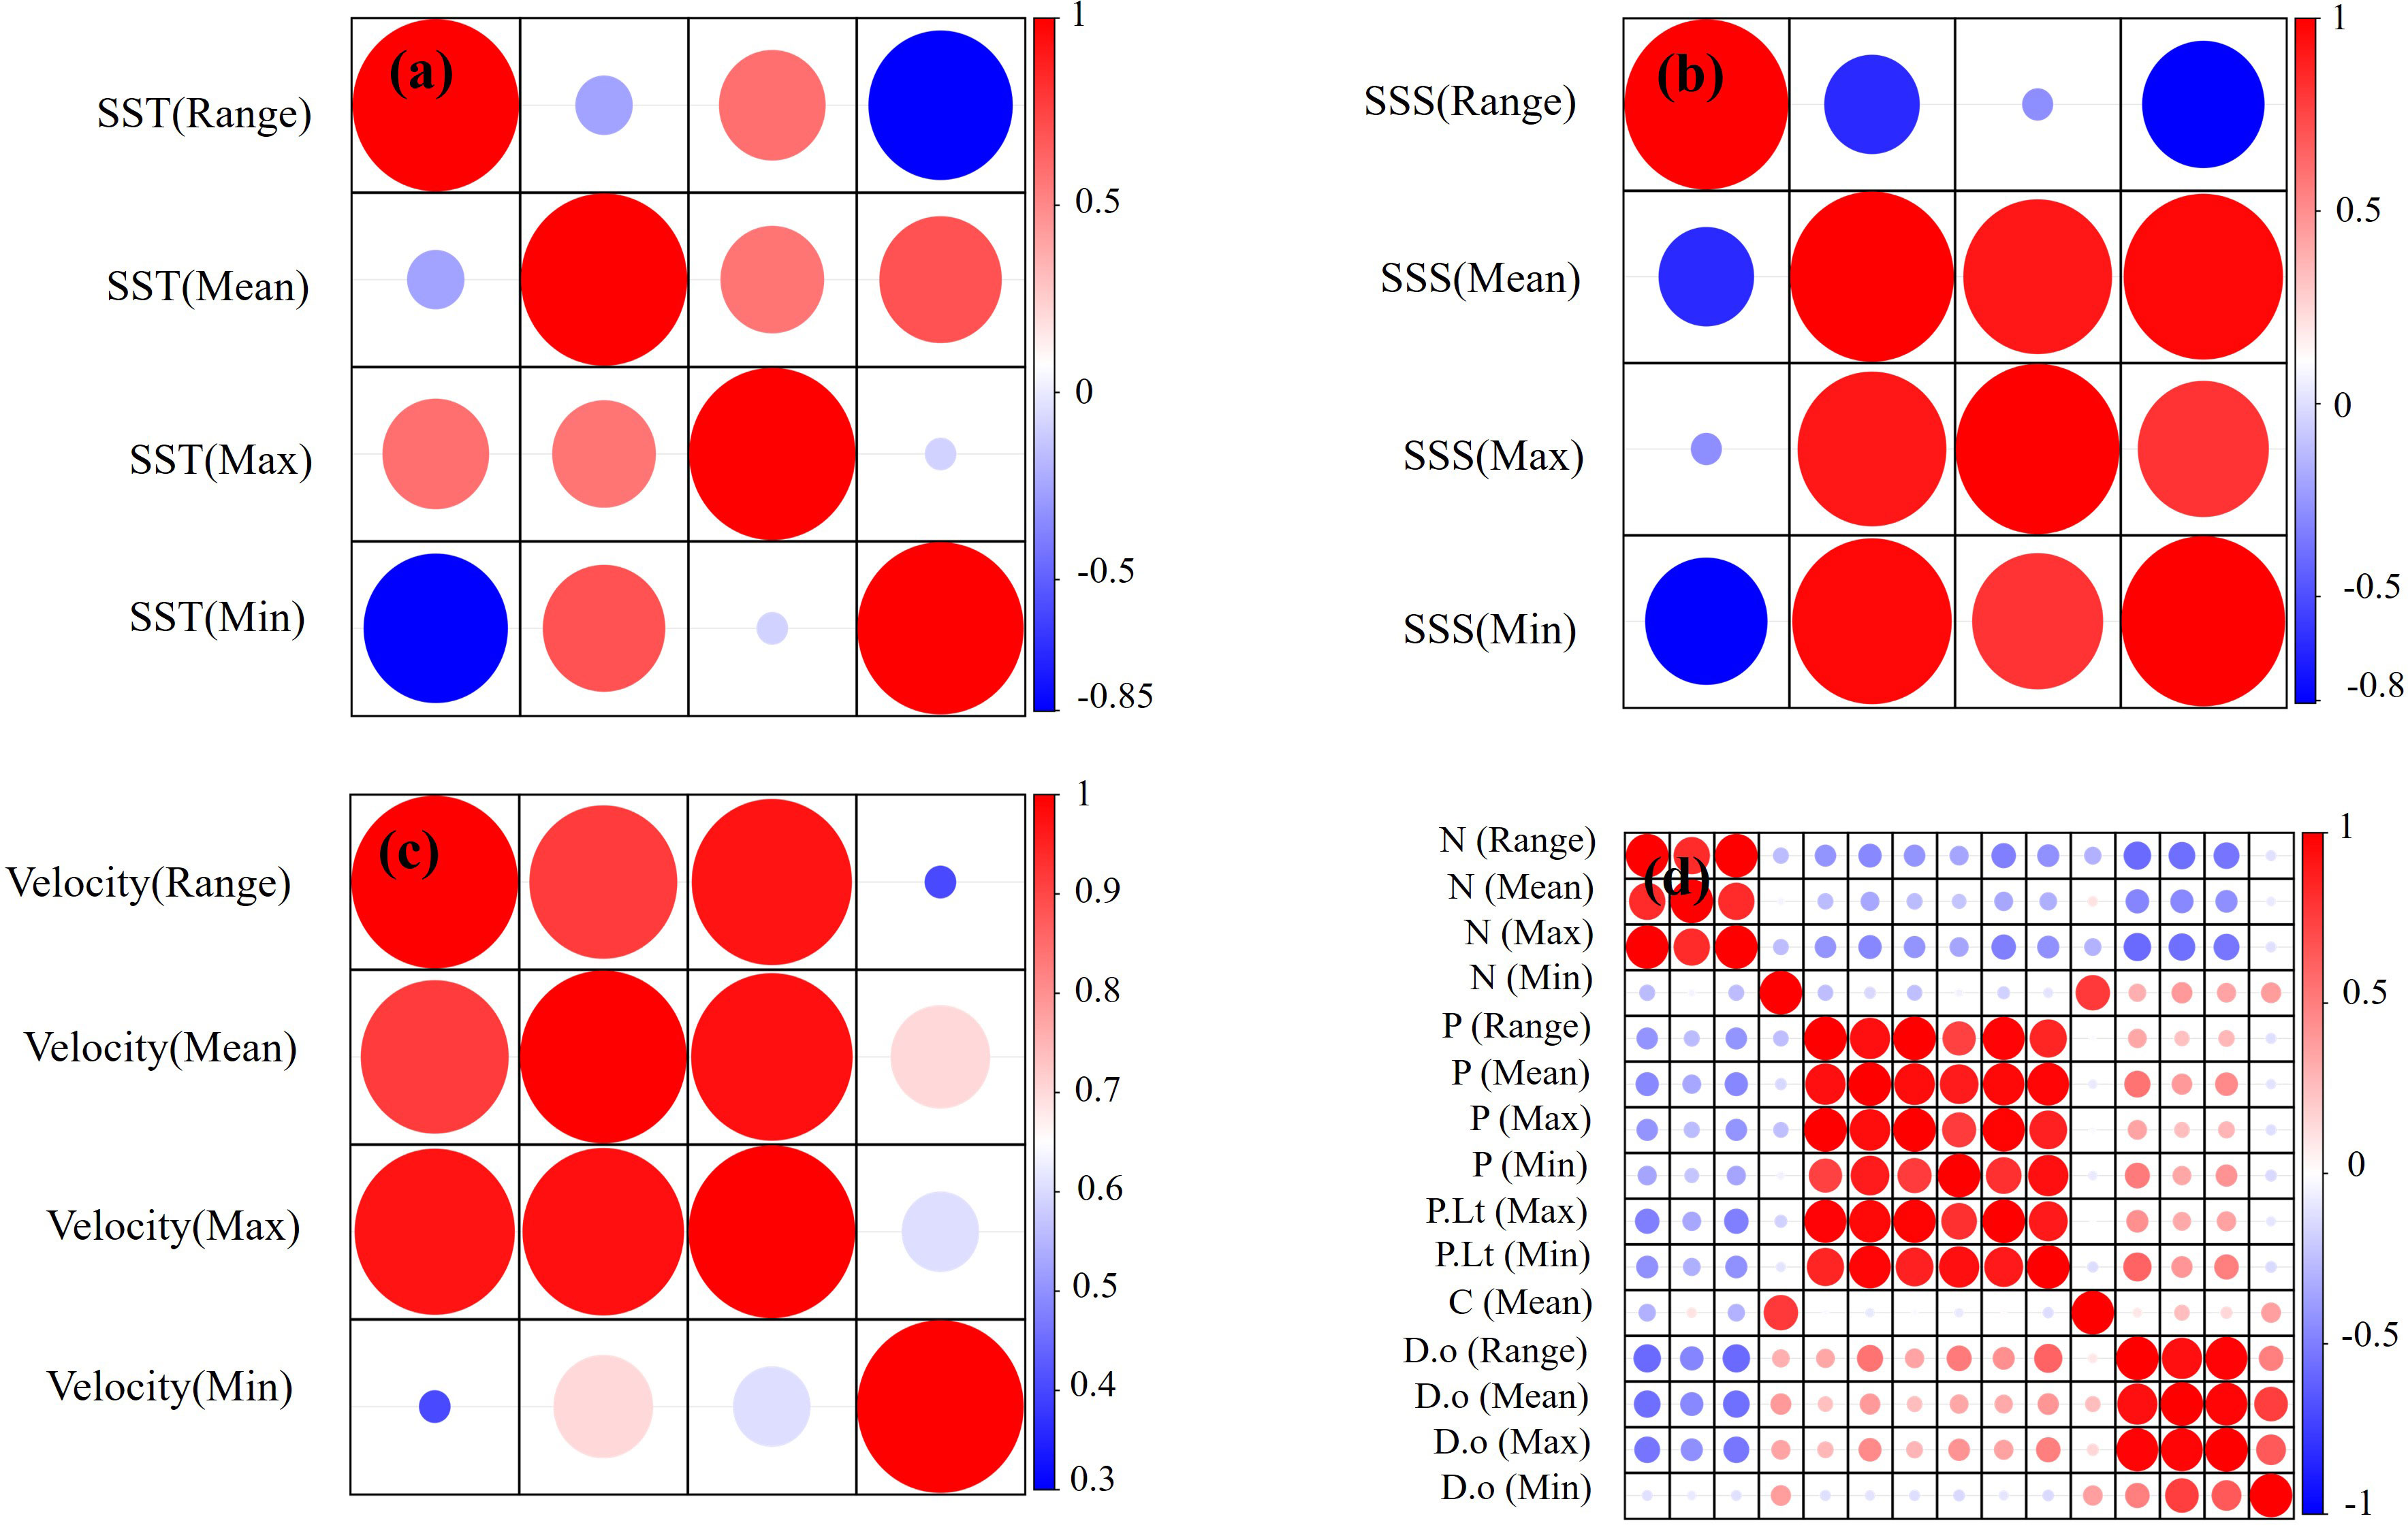
Figure 4 Correlation analysis of environmental variables [(A). sea surface temperature, (B) sea surface salinity, (C) velocity, and (D) water quality].
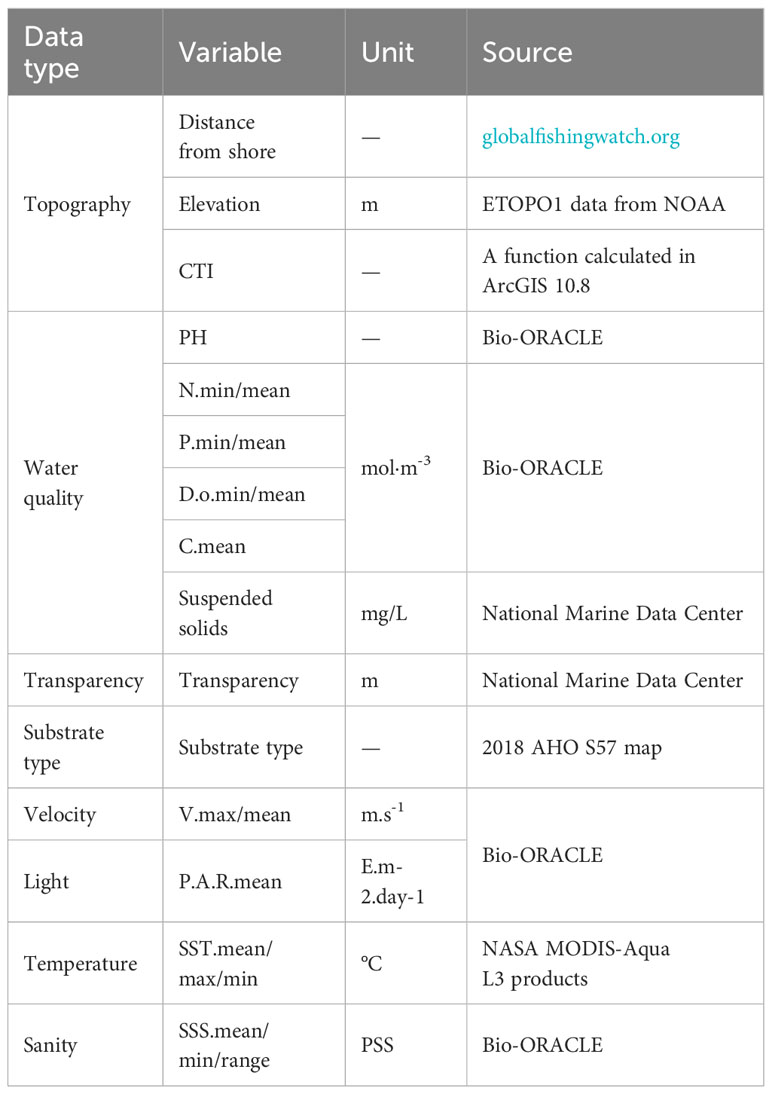
Table 2 The environmental variables used in modeling.
The predictive performance and accuracy of the MaxEnt model were evaluated according to the AUC value (area under the curve). When the AUC value exceeded 0.75, the model was considered to be usable. A higher AUC value indicates better model performance (Araújo and Peterson, 2012). The evaluation standard for AUC is shown in Table 3.
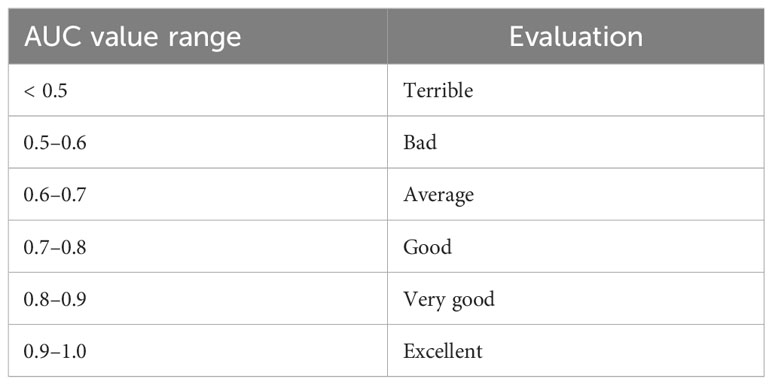
Table 3 The evaluation standard for AUC (Swets, 1988).
The results obtained from field investigations were used to evaluate the predictions. The actual seagrass distribution is influenced by local human activities and is different from the predictions. We proposed two indices, i.e., the seagrasses distribution index (Di) and the overlap index (Oi), to evaluate the reliability of the predictions based on the distribution area and range of seagrass. A composite evaluation index (Ci) was calculated by assigning weights to two indices based on expert opinions.
The index was calculated using the following method. First, the actual distribution of seagrasses was determined through field investigations. The mean probability () of this area was extracted based on predictions. Next, the boundary line of the actual distribution of seagrasses was extended outward by 1 n mile to obtain a region that included the actual distribution and its extension. The area of each grid in the actual distribution and combination was denoted as Am and Ap, respectively. The area of actual distribution was denoted as Af. The equations used for calculating the variables are as follows:
Here, indicates the standardized value of grid j, and pj indicates the actual value of grid j. When , ; when , .
During the field investigation in August 2023, we observed seagrass distribution at a small scale in Panjin, Liaoning province (Figure 5). However, our predictions (Section 3.2) did not indicate the occurrence of seagrass in this region. This proves that our predictions is not accurate at a small regional scale which could hinder the conservation and restoration of seagrass.
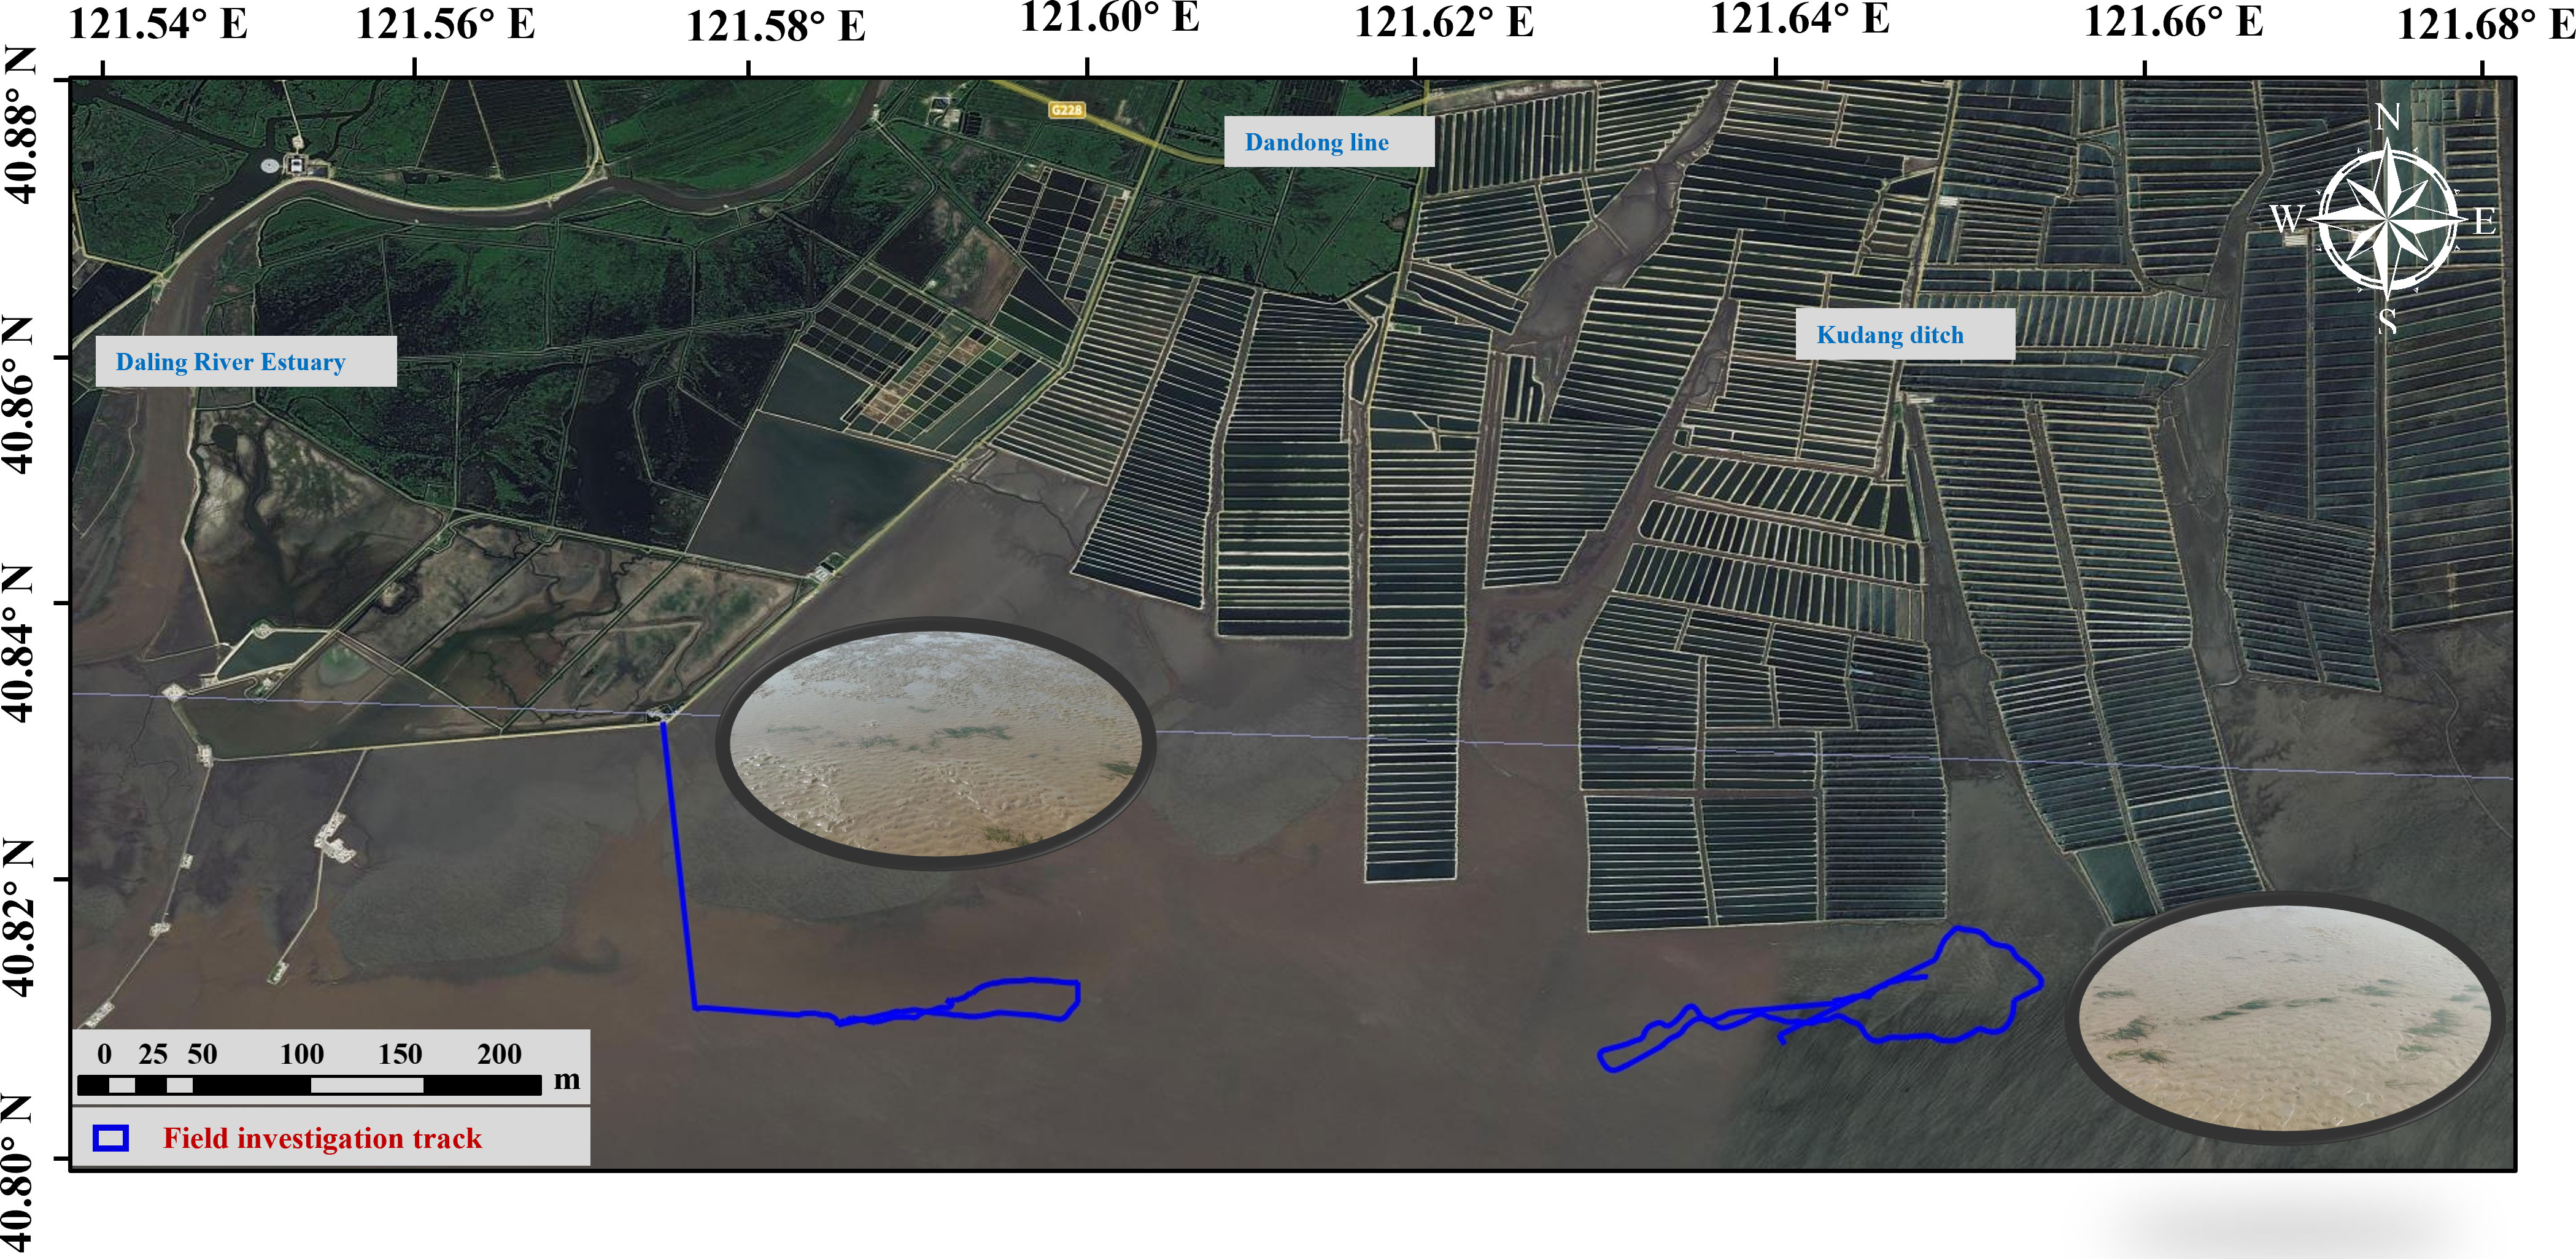
Figure 5 Seagrass investigation in Panjin.
To obtain the areas of seagrass conservation and restoration more comprehensively, the predictions were re-analyzed. We considered the distribution probability of the predictions to be the seagrass habitat suitability index (HSI) and obtained a larger potential seagrass distribution area by using a lower HSI value of seagrass in Panjin investigation as the minimum value of seagrass occurrence.
To prioritize areas of seagrass conservation and restoration, we proposed a conceptual two-dimensional framework (Figure 6) using previous predictions and re-analysis results. The framework was divided using three straight lines: , and . These lines represented the boundaries between the previously predicted seagrass distribution and the re-analyzed distribution area, with proportions of 100%, 50%, and 25%, respectively. Seagrass habitat suitability is high in areas where both areas of seagrass are large. These areas are suitable for seagrass growth. Greater protection and reasonable control of human pressure are necessary for conservation programs to be successful. We define these areas as seagrass conservation areas. When the prediction was smaller than the re-analyzed distribution area, the area was considered to have significant potential. Due to inadequate protection and other factors, certain areas experience degradation or fragmentation, leading to the distribution of seagrass in a smaller area. Site-specific conservation and restoration measures need to be implemented simultaneously to promote the recovery of seagrass areas. We define these areas as seagrass conservation and restoration areas. When the predicted area was larger than the re-analyzed distribution area, it indicated that the human pressure was higher in this area. Achieving natural restoration only by controlling external pressure is difficult. Thus, artificial transplantation or replanting is required for effective restoration. We define these areas as seagrass restoration areas.
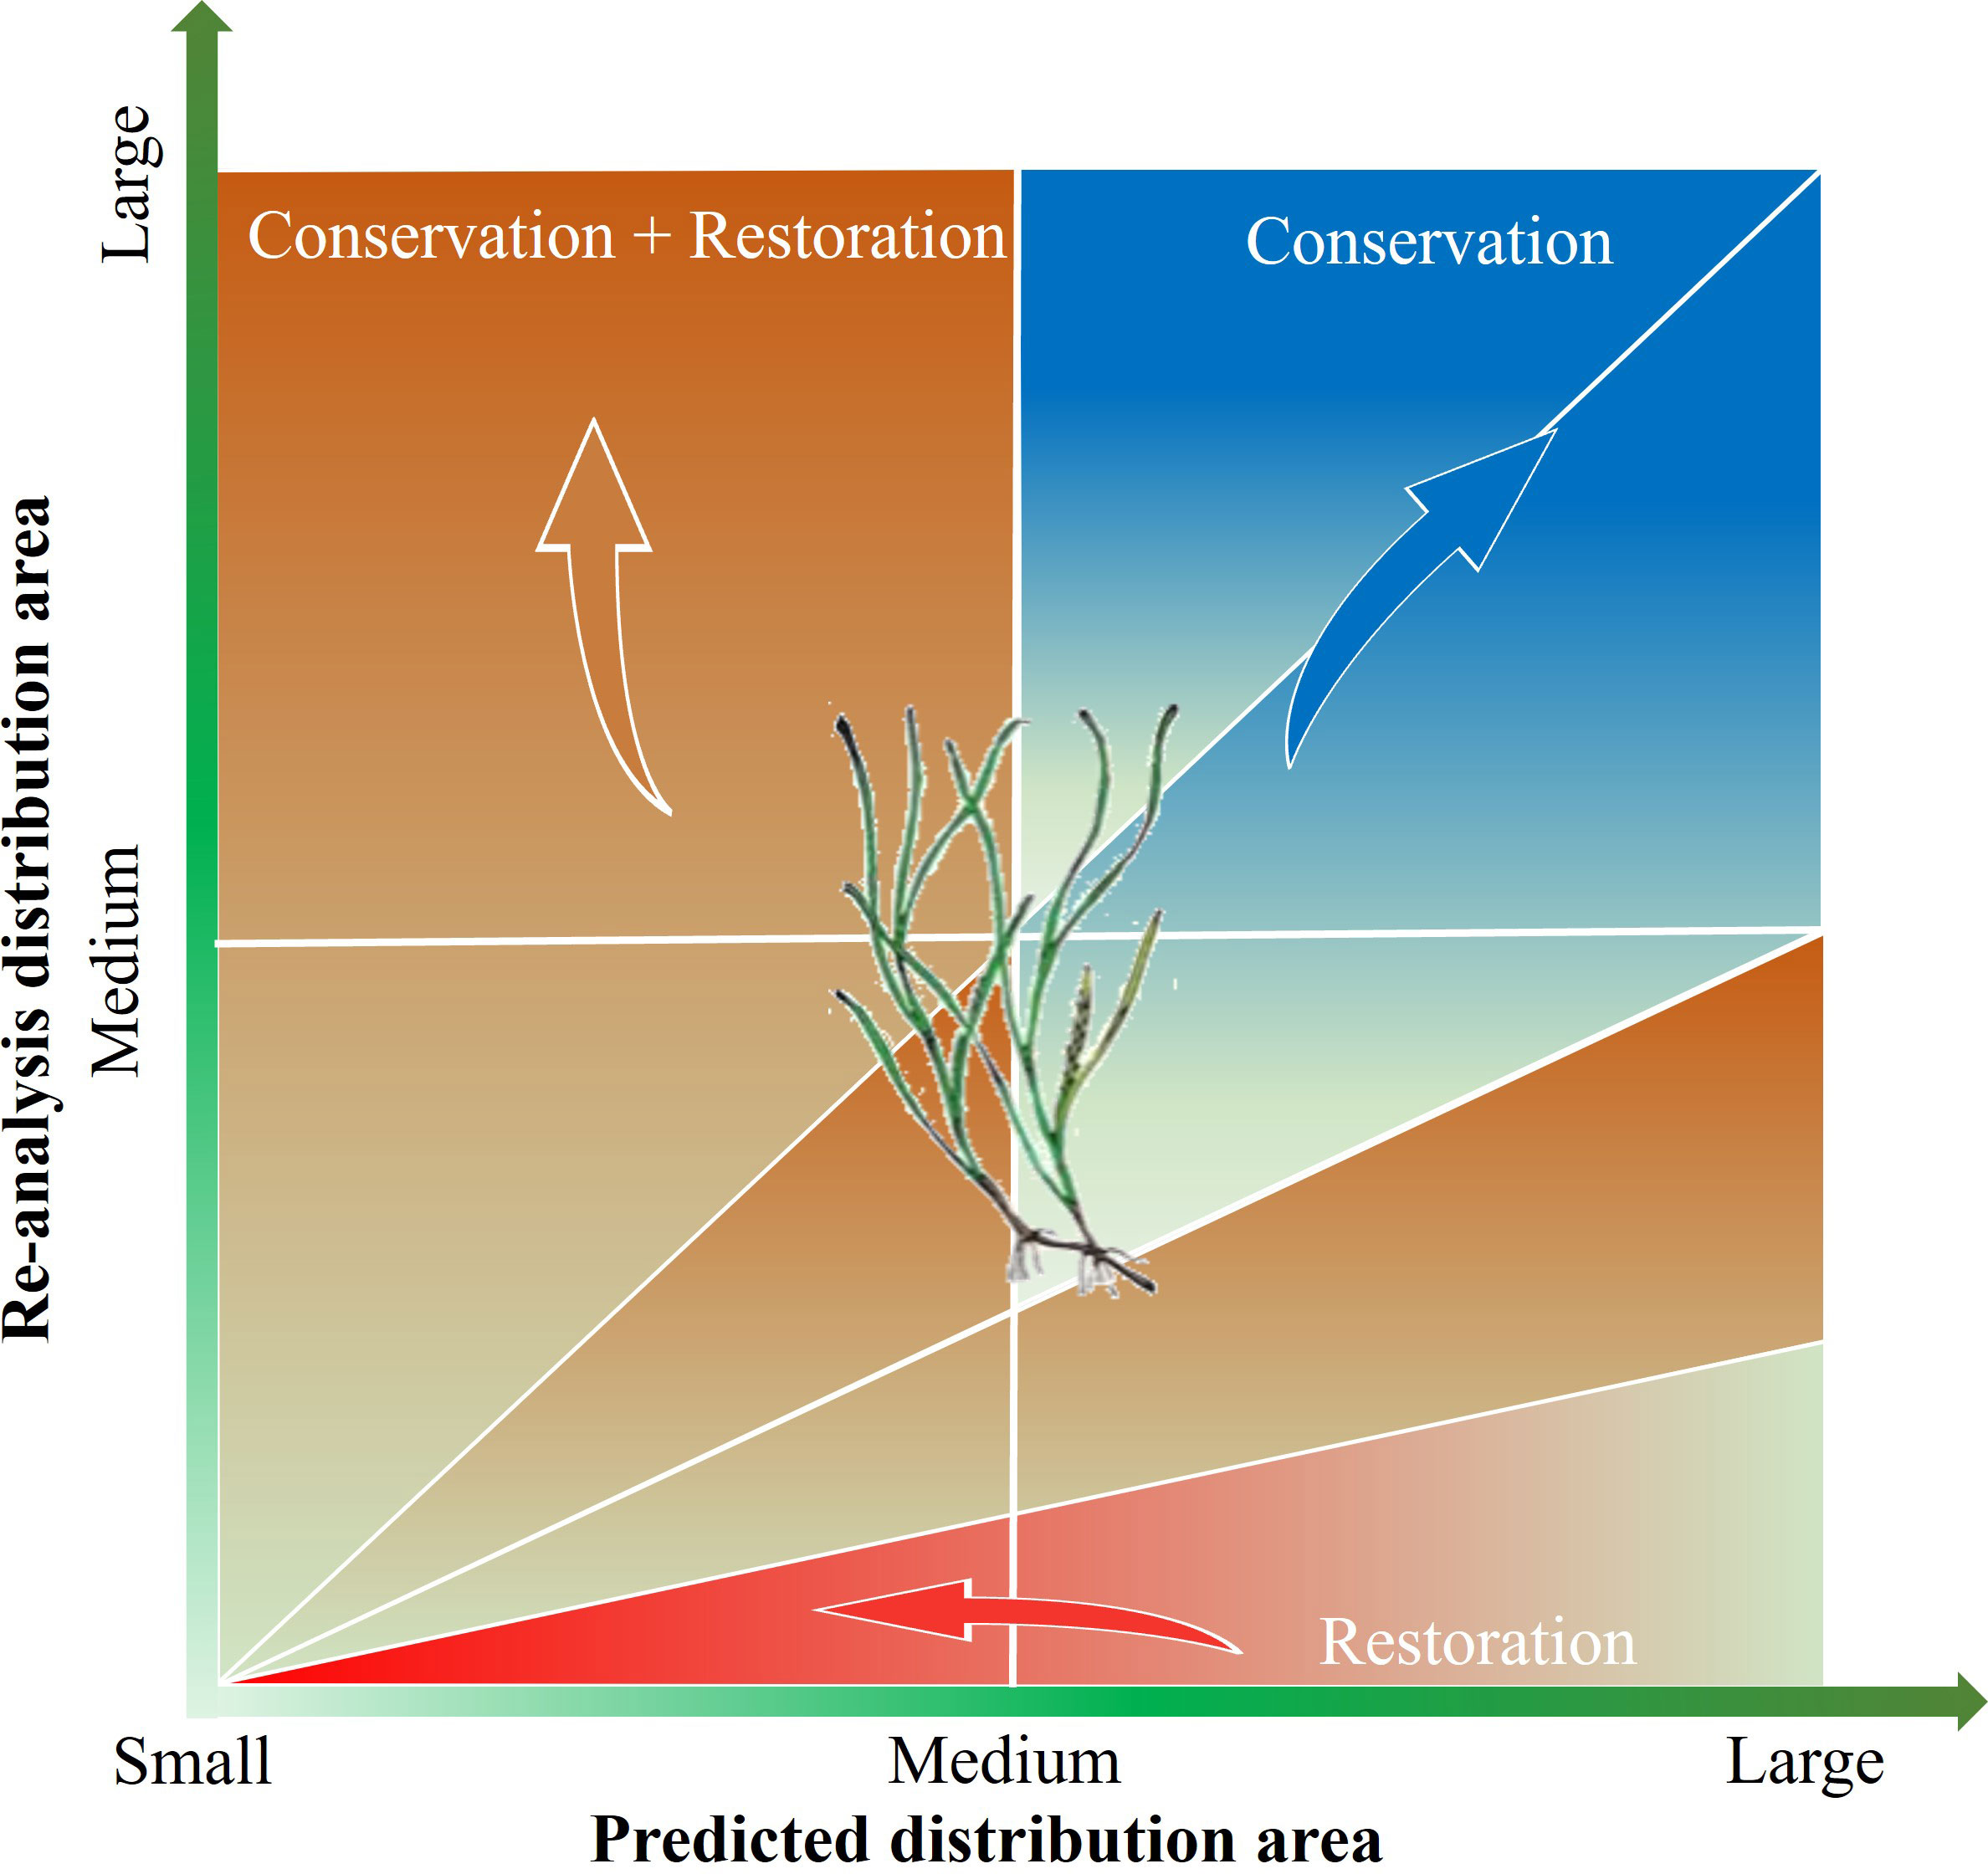
Figure 6 Conceptual two-dimensional framework.
The AUC value for the MaxEnt model was 0.963 (AUC values between 0.9 and 1.0 indicate excellent model performance), which was higher than the random prediction value of 0.5 (Figure 7). The value indicated that the MaxEnt model was highly reliable at simulating potential seagrass distribution and habitat suitability.
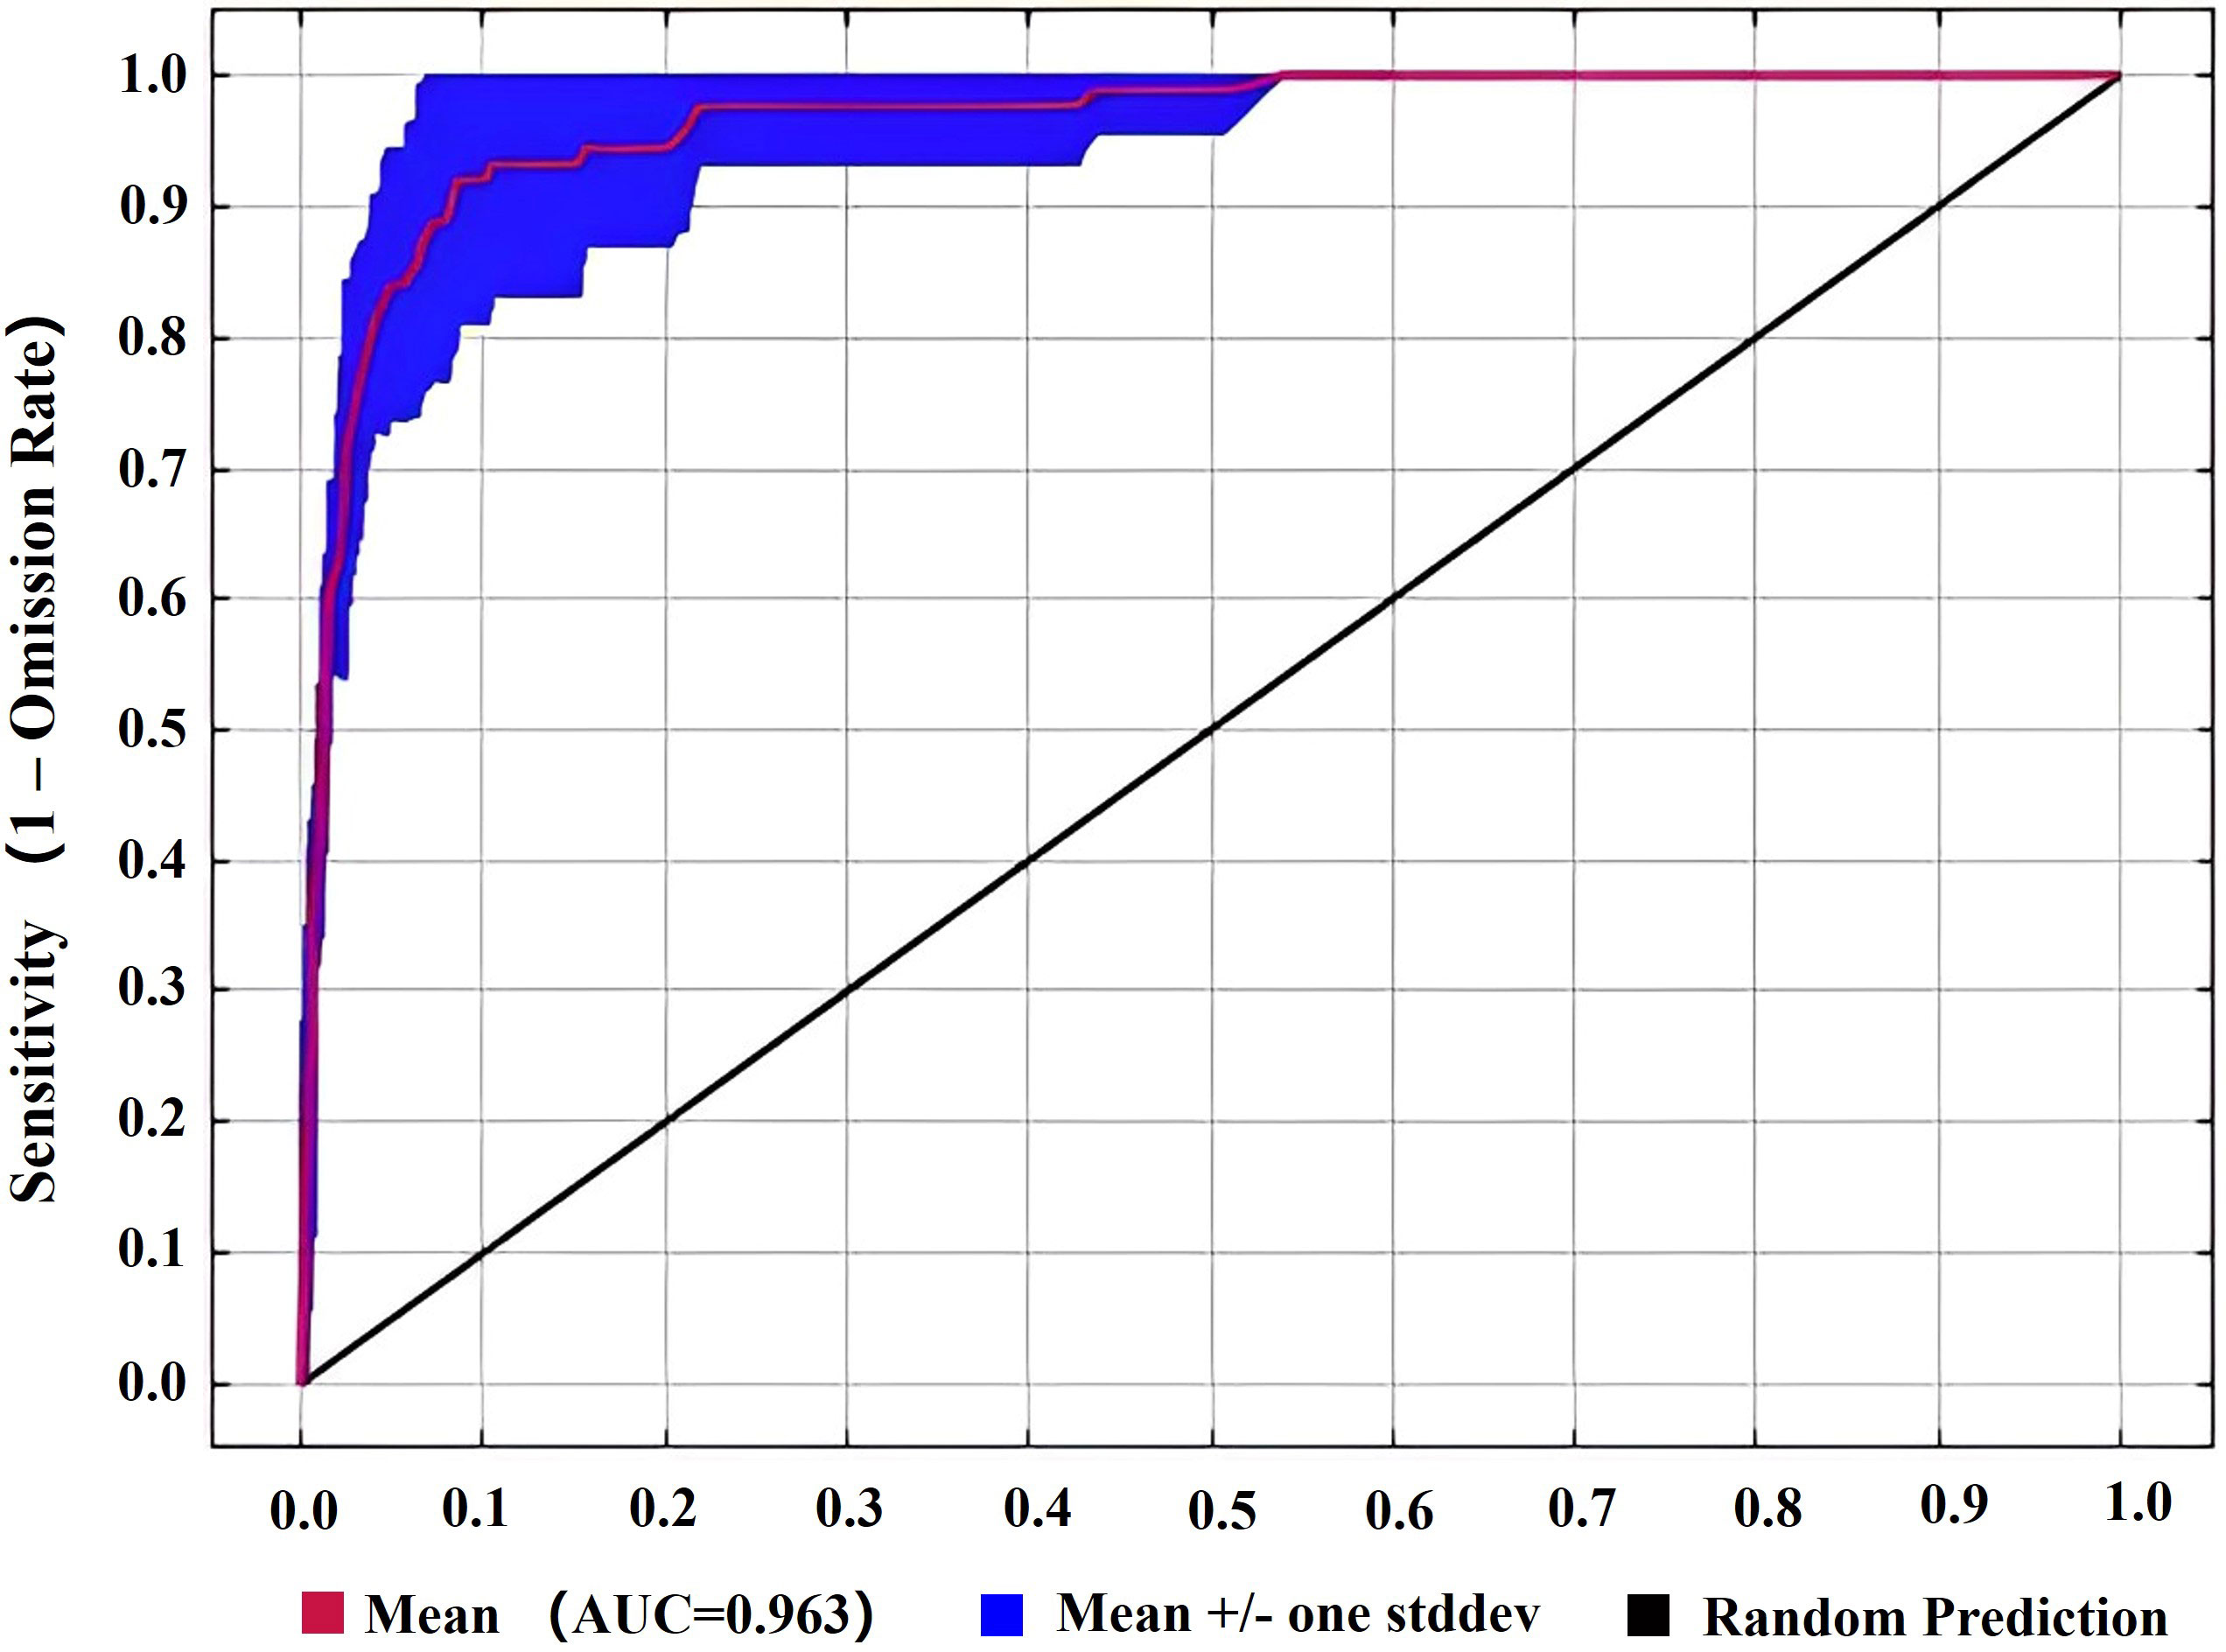
Figure 7 ROC curves and AUC averages for MaxEnt with 10 repeated runs.
We focused on typical seagrass distribution areas in Liaoning, Hebei, and Shandong provinces. Field investigations of seagrass were conducted at Juehua Island, Caofeidian, and the Yellow River estuary (Figure 8). The Ci (mentioned earlier) was used to assess the performance of the predictions. The results are shown in Table 4 below.
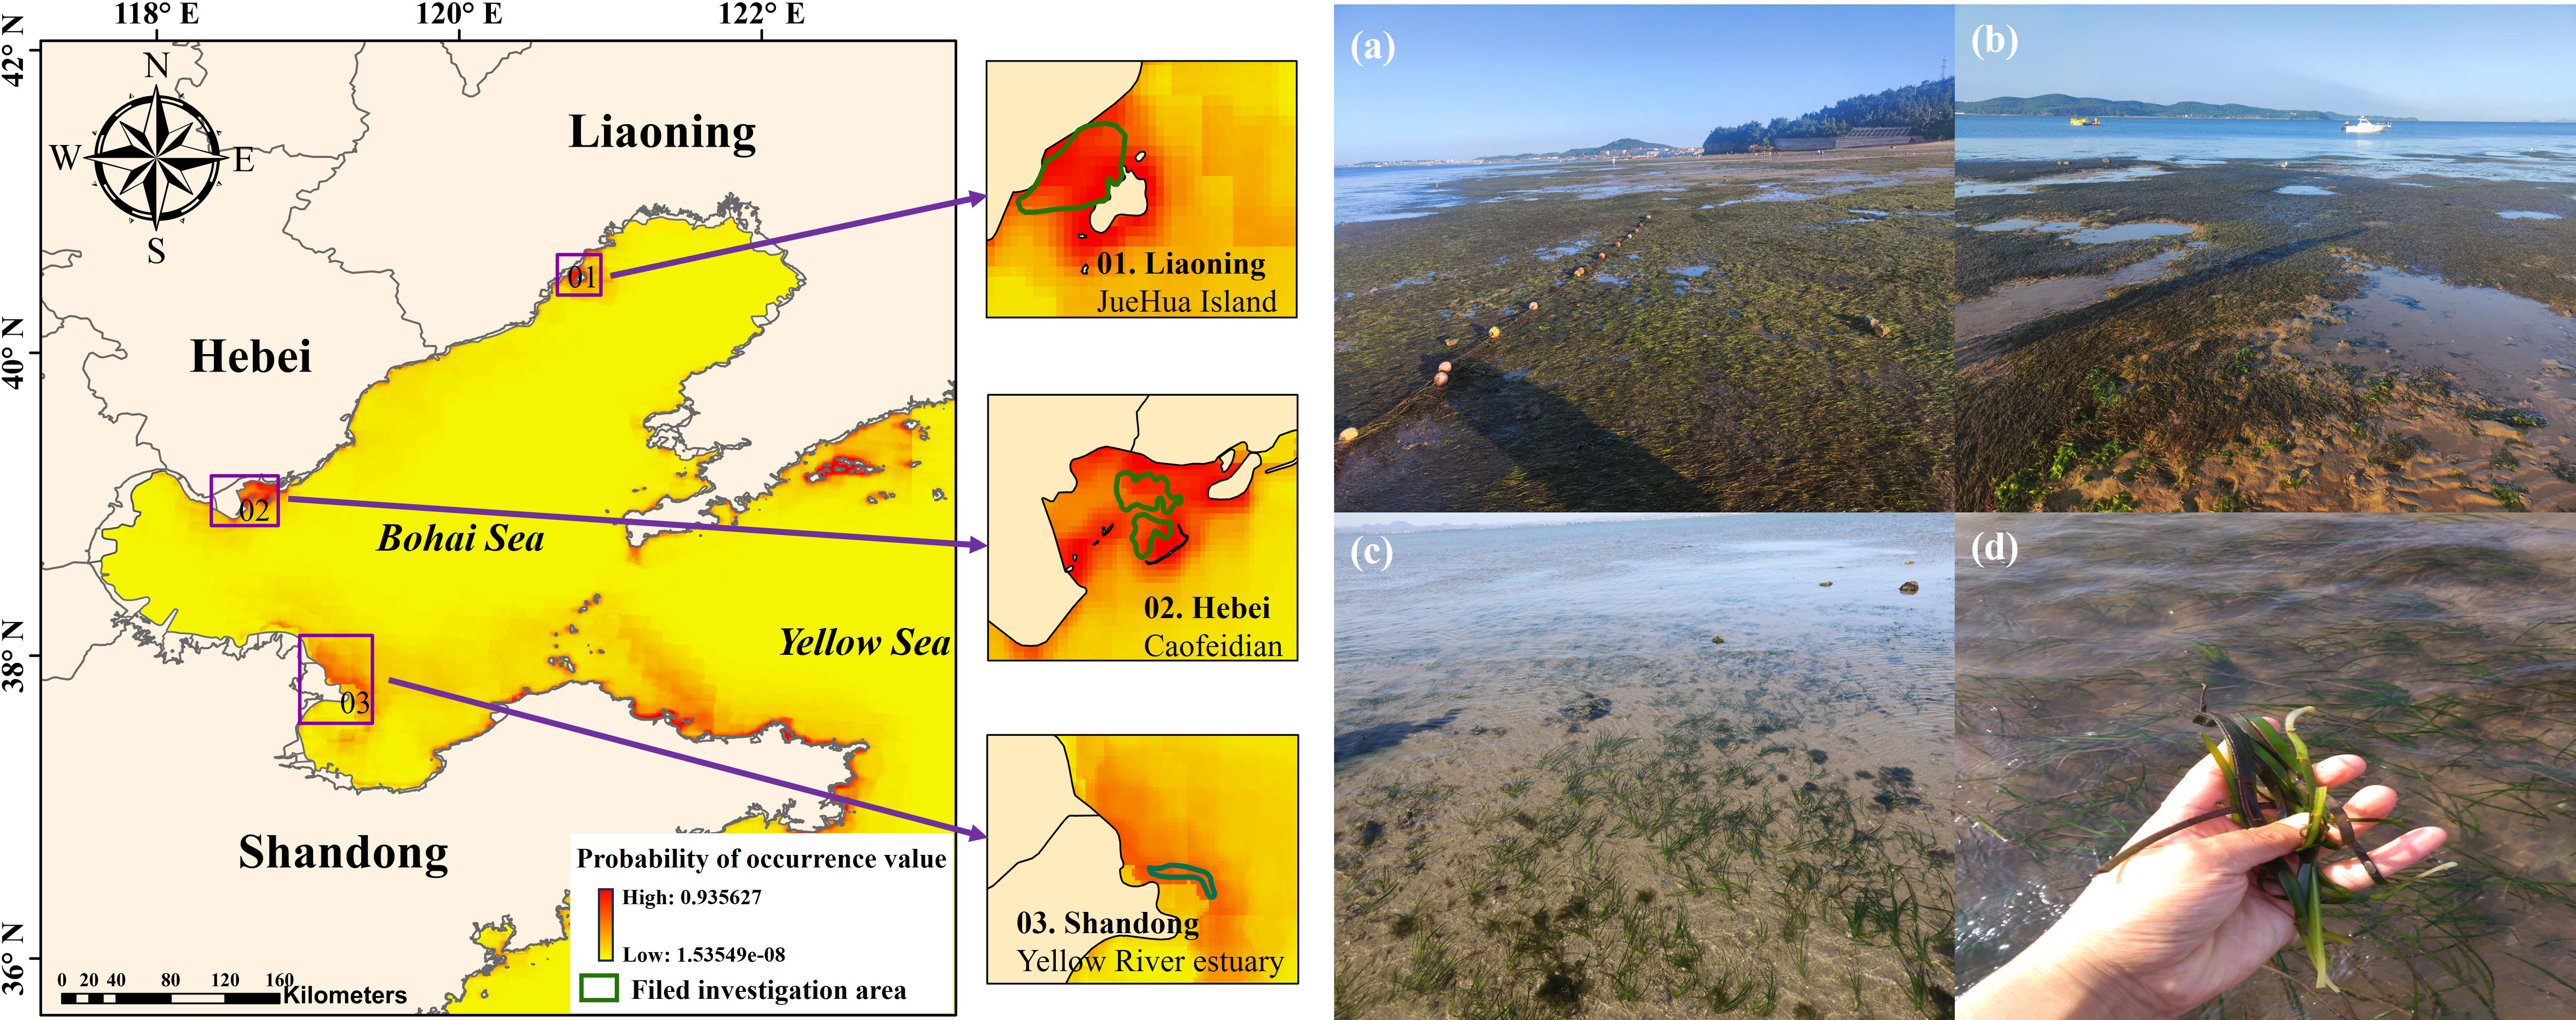
Figure 8 Field investigations, predictions (01. Juehua Island, 02. Caofeidian, and 03. Yellow River estuary), and (A–D) records of field investigations.
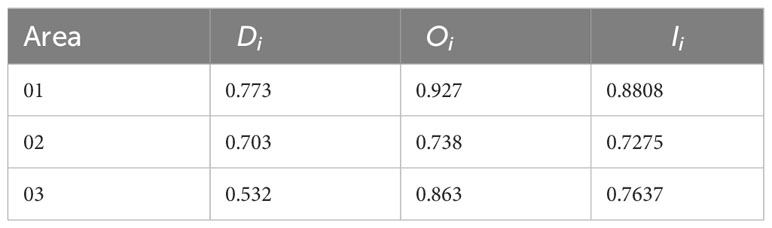
Table 4 The list of calculated indices.
The results strongly agreed with the distribution areas of seagrass field investigations in terms of area and range. This suggested that the predictions were highly reliable.
The prediction is the average of the results after 10 model runs. It was plotted as a grid map at a resolution of 1 km. The value of each grid cell represented the distribution probability, ranging from 0 to 1. Larger values indicated a higher likelihood of seagrass presence. We extracted the predicted probability values for each seagrass occurrence point and regarded the lowest value as the lowest occurrence threshold. Areas below this value were classified as areas without seagrass. The lowest presence threshold used to produce the binary maps was 0.36. The potential seagrass distribution area predicted by the model was 3,296.47 km2 in the study area (Figure 9), which spread across Shandong, Hebei, and Liaoning provinces. Compared to other areas, the distribution area of seagrass in Shandong is the largest, accounting for about 45.8% of the total area, followed by Liaoning (38.6%) and Hebei (15.6%).
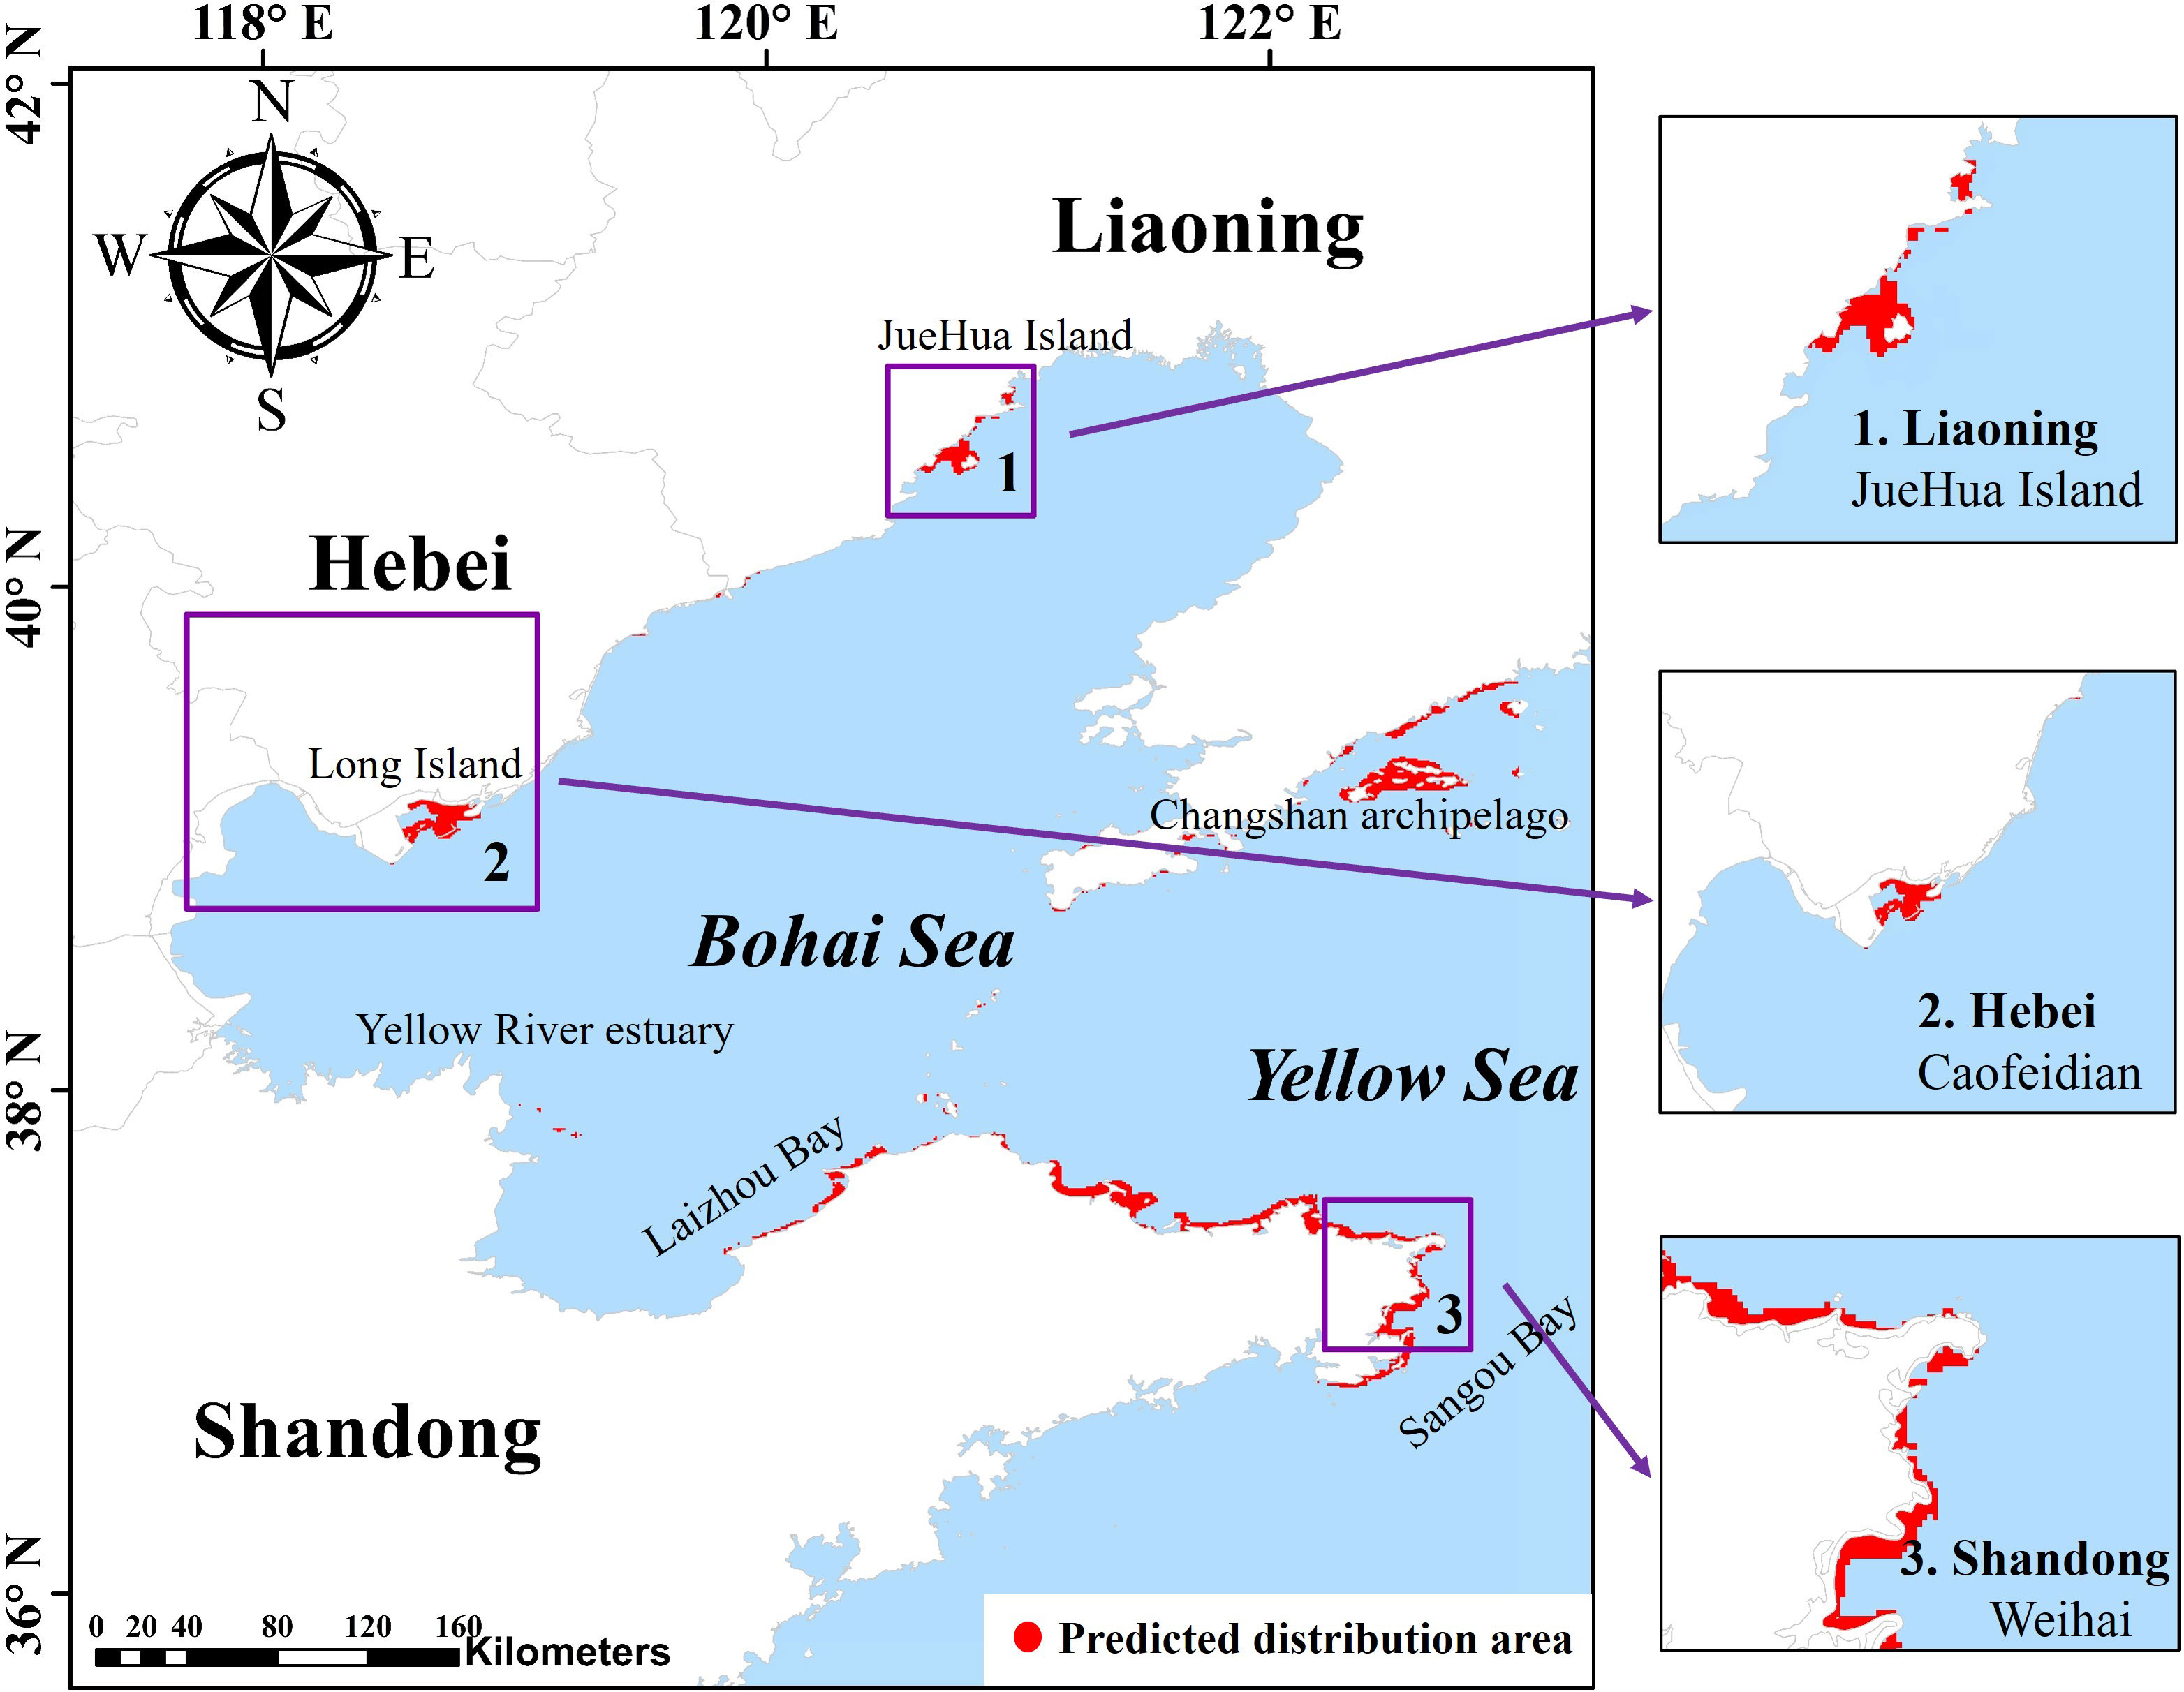
Figure 9 The seagrass distribution areas as predicted by the model.
The model predicted areas as suitable seagrass habitats, both in areas of known seagrass locations and in areas with similar environmental details. Our predictions showed that seagrass in Liaoning Province is primarily found around the Changshan archipelago and Juehua Island. These islands are surrounded by the sea and have similar conditions for growing seagrass. The seagrass in Hebei Province was primarily found near Long Island in Caofeidian. This area has approximately 40 km2 of shallow water below –3 m and provides a suitable environment for seagrass growth. A suitable area for seagrass was found near the Yellow River estuary in Shandong Province, and seagrass habitats were almost continuously distributed from Laizhou Bay to Sangou Bay.
The habitat suitability of seagrass changed in a “W” shape along the latitude and longitude gradient. That is, with the increase of latitude and longitude, the habitat suitability of seagrass first increased then decreased, and finally increased. The habitat suitability was high between 39°N and 40°N, as well as 122°E and 123°E (Figure 10A). The percentage of different suitability values in the study area is shown in Figure 10B. Few areas had a high HSI, which indicated that the range of suitable habitats within the potential distribution area was small, and seagrasses degradation might occur in most areas.
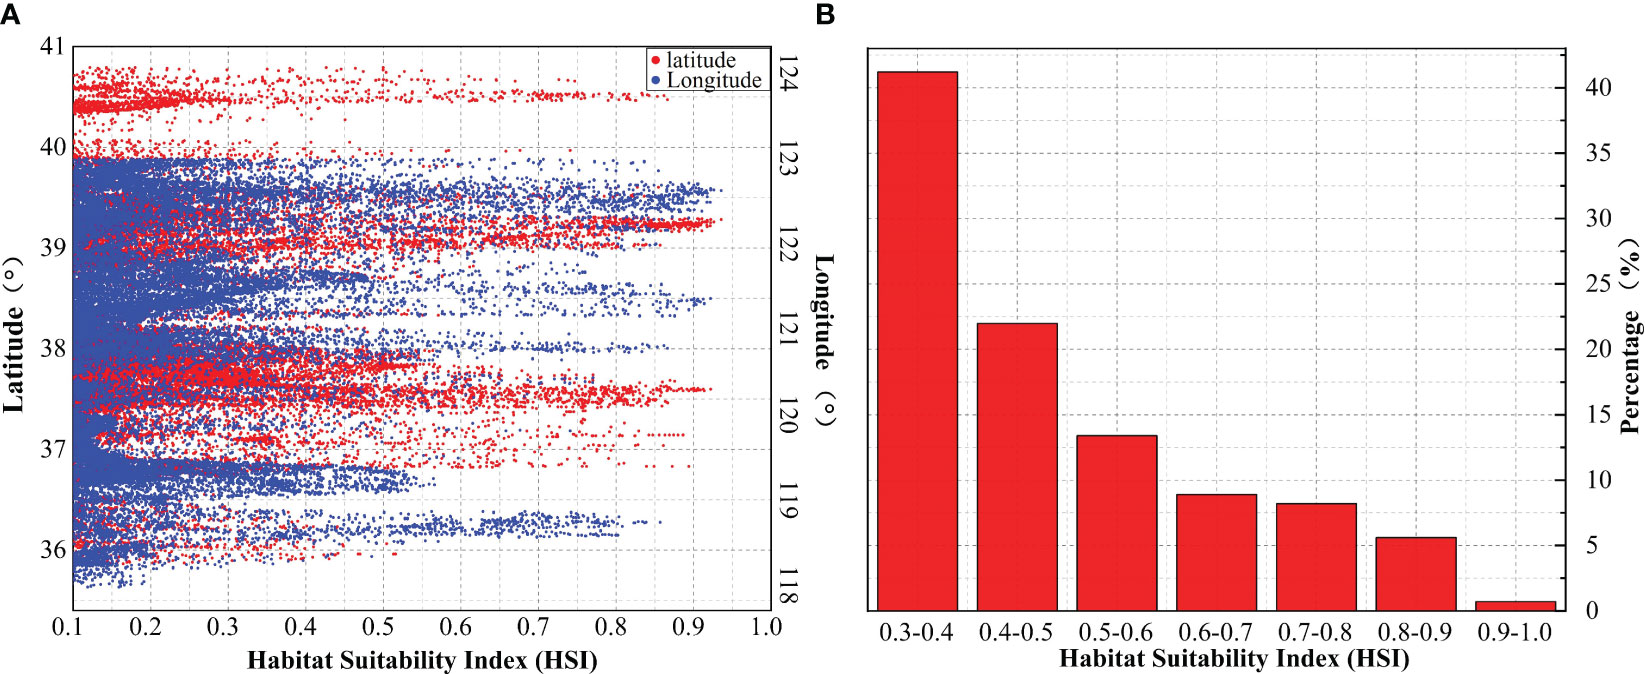
Figure 10 The distribution of HSI. (A) Distribution map of HSI in space. (B) Statistical chart of different values of HSI.
The Jackknife analysis tool in MaxEnt was used to assess the effect of each environmental variable on seagrass distribution. The results are shown in Figure 11A, and the contribution rate of each variable to the predictions is quantitatively presented in Figure 11B. The model can be used to directly evaluate the rate of contribution of different environmental variables to the potential seagrasdistribution and determine the dominant environmental factors.
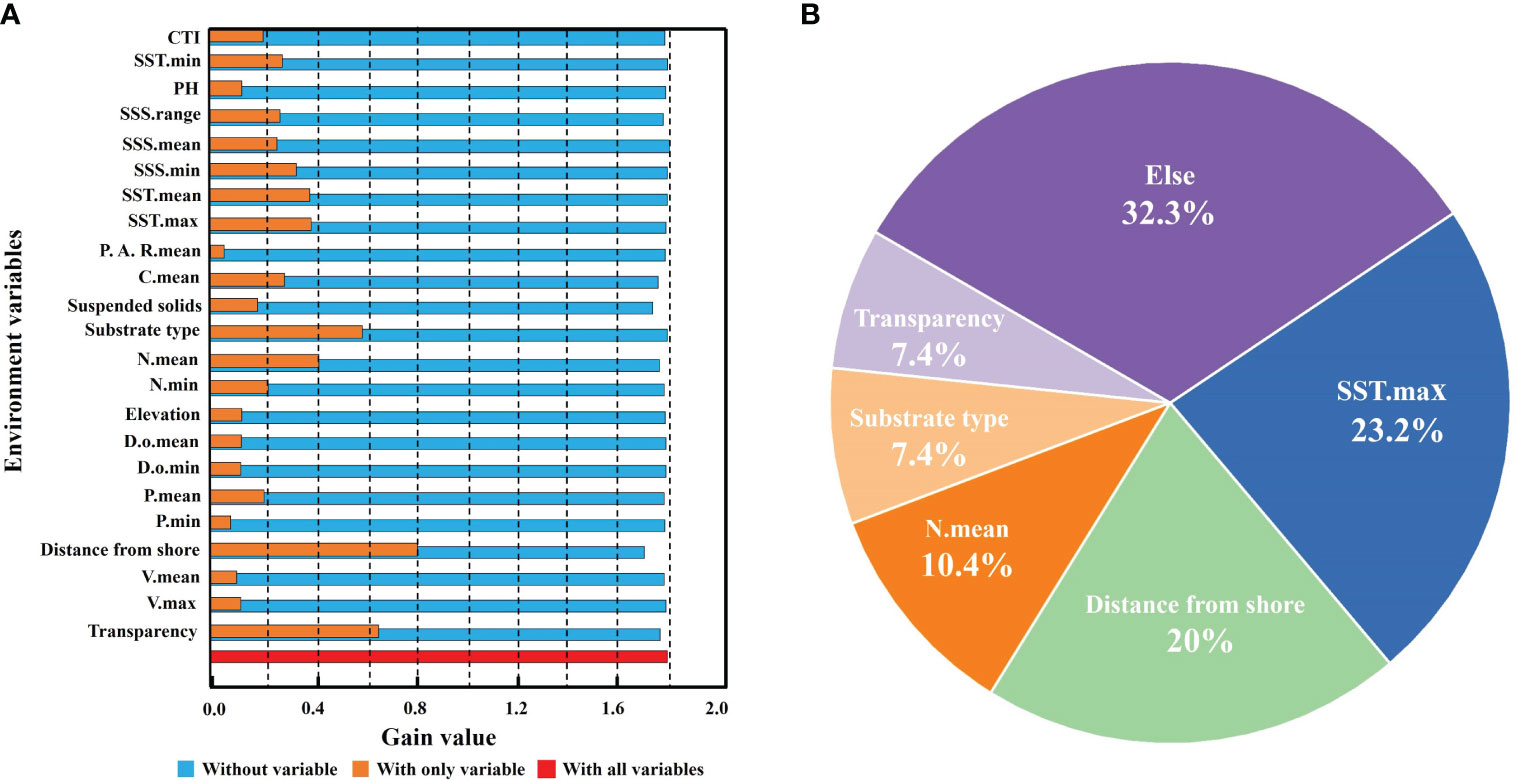
Figure 11 (A) Jackknife Inspection Chart; (B) the contribution of environmental variables to the prediction.
The results showed that the distance from the shore, transparency, substrate type, SST, and nitrate concentration were the dominant environmental variables in the study area. These variables were important for determining the habitat suitability of seagrass in the study area.
The MaxEnt model was used to predict potential seagrass distribution and habitat suitability. We used the average value obtained from 10 repeated runs as a prediction. The prediction was categorized into five types using the “Jenks” tool in ArcGIS 10.8: best, high, medium, low, and not suitable habitat. The best, high and medium suitable habitats are considered to be suitable conditions for seagrass growth. According to the calculation results, the value of 0.5 for HSI serves as a cut-off to determine whether a habitat is suitable or unsuitable. HSI curves of dominant variables as shown in Figure 12. The best suitable ranges of the main variables were the distance from shore was < 210 m, the SST was around 11 ~ 25°C, the substrate type was sandy with high mud content, the substrate particle size was around 35 ~ 330 µm, the transparency was around 0.7–1.5 m, and the nitrate concentration was < 6.4 mol·m–3. These conditions were identified as suitable parameters for determining seagrass habitat in the study area. The available sources and field investigation also indicated that the predictions were reliable. Lee et al. (2007) showed that the optimum temperature for seagrass growth in temperate regions is 11.5 ~ 26°C. Our field investigations also indicated that the results were reliable.
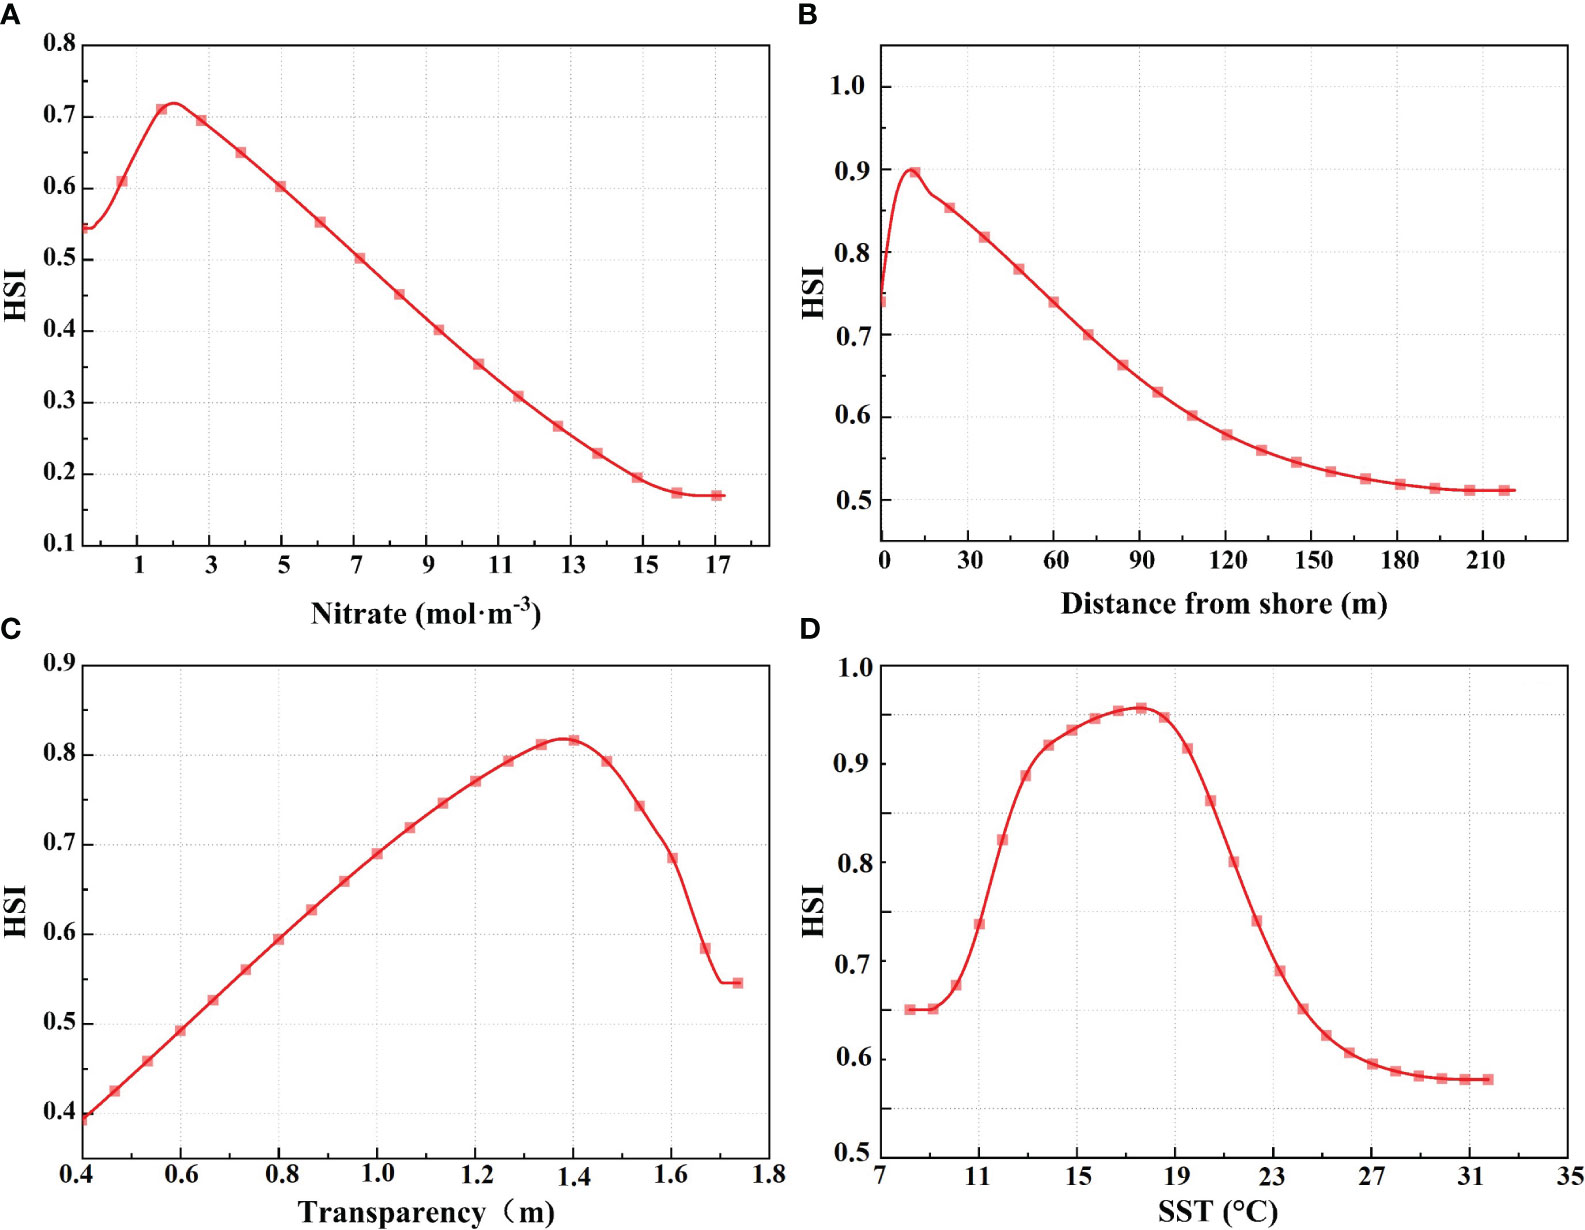
Figure 12 HSI curves for dominant environmental variables; (A) Nitrate, (B) Distance from shore, (C) Transparency, and (D) Sea surface temperature.
To identify suitable areas for seagrass conservation and restoration, we plotted the re-analysis results with the previous predictions based on the coupling framework mentioned in Section 2.5. The result is shown in Figure 13.
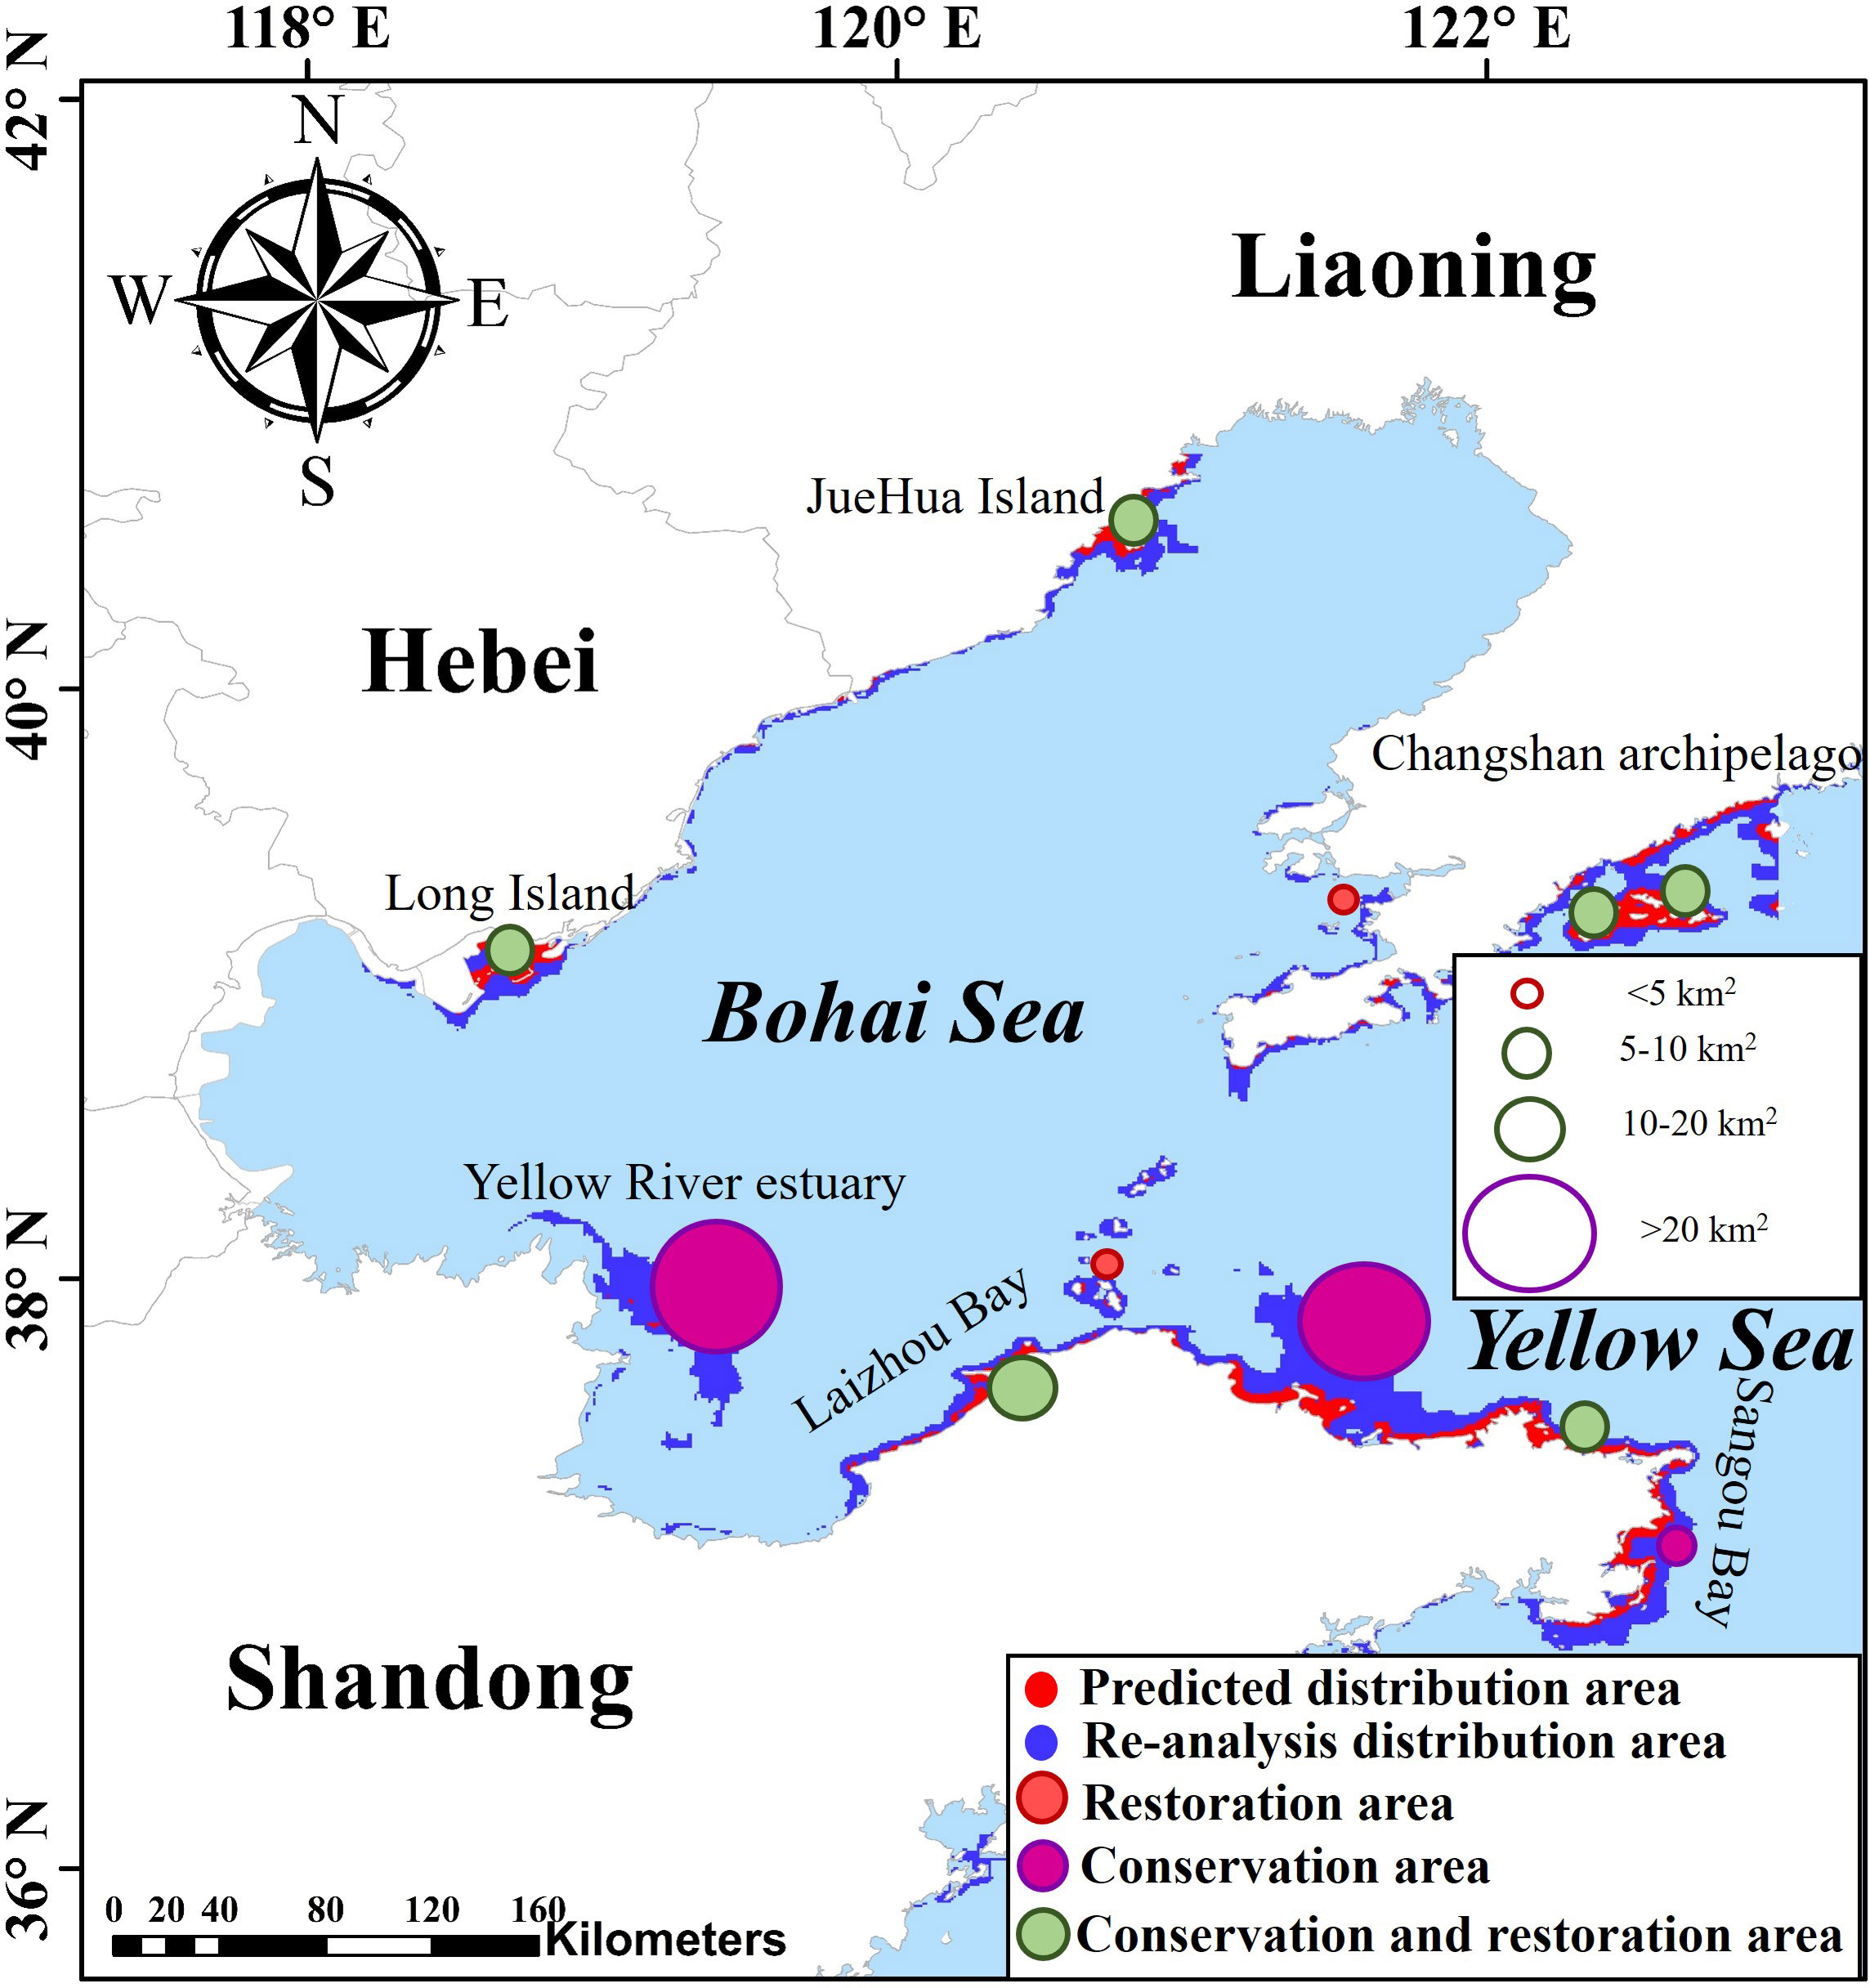
Figure 13 The areas identified for seagrass conservation and restoration.
The results indicated the presence of large seagrass distribution areas with low HSI values in the northern part of Shandong Province from 36.85°N to 37.84°N, as well as, near the Miaodao Archipelago and the Yellow River Estuary. Our results suggested that seagrass should be conserved and restored in certain areas, such as around the Miaodao Islands. In Hebei Province, we recommend providing seagrasses protection and conducting restoration in the sub-region near Caofeidian. Seagrasses distribution areas might be present around the Changshan Archipelago and the Juehua Island in Liaoning Province and along the coast of Dalian City. Different areas of Liaoning Province should be conserved and restored, and some areas in the west of Dalian should be restored after further field investigation.
The seagrass distribution was compared with published global seagrass distribution. The predicted area of the distribution of seagrass was less consistent in some areas. This might be attributed to the inaccurate recording of seagrass locations or inadequate resolution of environmental variables in the modeling process. Since the seagrass locations were primarily collected through field investigations and by searching databases, it was challenging to verify the authenticity of each data point. Additionally, excessive extrapolation of the model probably also led to inaccurate predictions.
We used 1-km resolution data for the environmental variables to map the distribution of seagrass in the study area. However, the model could not fully consider seagrasses habitat occupancy or degradation. For example, the models that we established used predictors with a resolution of ≥ 1 km, and thus, they probably could not capture small-scale heterogeneity within 1 km2. This conclusion matched the findings of the field investigation conducted in Panjin, Liaoning province in August 2023, as mentioned earlier. The model could not predict a suitable distribution in this region, but the area had a continuous distribution of seagrass.
The model also could not consider the effects of human activities and extreme weather on seagrass distribution. The area of seagrass in the Yellow River Delta (China) decreased by nearly 90% due to the Super Typhoon Lichima in 2019 (Yue et al., 2021). Hence, the actual seagrass distribution under various anthropogenic and abiotic pressures might be substantially lower than predicted. A comprehensive investigation is required to accurately determine seagrass distribution and the factors limiting its distribution.
MaxEnt models are evaluated based on the AUC value only. The predictions are considered to be reliable if the AUC value exceeds 0.8. However, due to the selection and resolution of environmental variables, and other human factors accurately reflected the predictions. Verifying the accuracy of predictions only by evaluating the model is challenging. In this study, we evaluated the model and the predictions to confirm the reliability of the predictions while ensuring that the model performed well.
The model and predictions might provide effective and inexpensive ways to plan seagrass conservation, especially in poorly surveyed regions under the growing pressure of habitat loss and degradation. Compared with other research methods such as remote sensing, our model provided a reliable map of seagrass distribution in the area more repeatable and transferable way. The remote sensing method requires finer spatial resolution and suitable data sources, including fewer clouds, low tide, clear water, smooth sea surface and so on to map seagrass distribution. The satellite images are highly affected by weather and water conditions, resulting in inadequate suitable images for seagrasses interpretation, both in the Northern and Southern Chinese Seas. Meanwhile, our method can be used as a reference for seagrass conservation and planning. The predictions identified more seagrass distribution areas, such as the east coast of Juehua Island, than the field investigation. These areas, which have not yet been recorded, may be highly suitable habitats for seagrass. Thus, for rapid economic development, these areas should be assessed and mapped at the earliest.
Seagrass distribution is influenced by various environmental variables. Different studies (Lemke et al., 2011; Valle et al., 2013) may have selected different combinations for constructing models. As the scale of the study varies, the selection of environmental variables can differ between studies.
In the global model, SST and distance from the shore were the most important factors in predicting seagrass distribution (Jayathilake and Costello, 2018). At the regional scale (such as the Mediterranean), the most important variables determining seagrass presence were chlorophyll-a levels and distance to the coast (Effrosynidis et al., 2018). At the local scale, surface nitrate concentration, benthic light availability, wave exposure, and distance to sandy shore determined suitable seagrass habitat distribution (Bittner et al., 2020). At even smaller scales, the sedimentation rate and light intensity were found to be the most important factors, followed by pore-water nitrate content (Stankovic et al., 2019).
We identified variables that were similar to those reported in other studies at the regional and local scales, e.g., SST and nitrate concentration. Therefore, while evaluating seagrass distribution in the future, researchers should select environmental variables according to the scale of the study.
Using the coupling framework mentioned in Section 2.5, we identified seagrass conservation and restoration areas. We proposed strategies for creating sustainable habitats for seagrass and developed NbS for seagrass management. Our findings might promote the sustainable development of seagrass ecosystems in the region around the Northern Chinese Seas.
The results of the field investigation showed that the seagrass in the study area was almost entirely distributed in nearshore waters. Algae and human activities have significantly affected the suitable habitats of seagrass and, in severe cases, have resulted in the loss of seagrass habitats. Based on our findings, we proposed that (i) greater efforts should be made to educate the public about seagrass conservation in the coastal areas (ii) seagrass nature reserves should be set up in suitable areas (only a few northern seagrass nature reserves have been established in the study area, and protection efforts and awareness are inadequate) (iii) seagrass should be continuously monitored to evaluate its status, and timely protective measures should be implemented (iv) aquaculture areas should be rationalized. Seagrass beneath floating (Herbeck et al., 2014) fish cages frequently disappears, whereas the surrounding areas display signs of degradation. As fisheries are an important economic source, they must prioritize the rational arrangement of aquaculture areas to achieve a balance between ecological protection and economic benefits.
The lack of information on the distribution and suitable habitat of seagrasses hinders seagrasses conservation and restoration efforts. This was the first study in which seagrasses was studied in the Northern Chinese Seas using the MaxEnt model. The model identified the potential seagrasses distribution and habitat suitability in the study area. We determined the distribution areas and provided constructive suggestions for seagrass conservation and restoration by re-analyzing the predictions. The results showed that (i) the AUC value of the MaxEnt model was 0.963, and the predictions aligned well with the results from field investigations, indicating that the predictions of the potential seagrasses distribution areas were highly reliable (ii) The potential seagrasses distribution area was 3,296.47 km2 in the study area and spread over Shandong, Hebei, and Liaoning provinces (iii) The distance from the shore, transparency, substrate type, SST, and nitrate concentration were identified as the dominant environmental variables in the study area. Seagrasses habitat suitability was high in the study area when the distance from the shore was< 210 m, the SST was around 11 ~ 25°C, the substrate type was sandy with high mud content, the substrate particle size was around 35 ~ 330 µm, the transparency was around 0.7 ~ 1.5 m, and the nitrate concentration was< 6.4 mol·m-3 (iv) By coupling the previous predictions and re-analysis results, we identified areas for the conservation and restoration of seagrass. Our findings suggested that seagrass conservation and monitoring should be strengthened after analyzing the results of field investigations and model predictions. The model developed in this study might serve as an effective tool for ecosystem management and facilitate the conservation and restoration of seagrass along with the ecosystem services it provides.
The original contributions presented in the study are included in the article/supplementary material. Further inquiries can be directed to the corresponding authors.
Written informed consent was obtained from the individuals for the publication of any potentially identifiable images or data included in this article.
ZW: Investigation, Writing – original draft. QM: Data curation, Software, Writing – review & editing. SL: Writing – original draft, Funding acquisition, Supervision. Y-AL: Conceptualization, Data curation, Visualization, Writing – original draft. LL: Writing – review & editing, Investigation, Resources. CH: Writing – review & editing, Software. KC: Writing – review & editing, Validation, Visualization. WH: Formal analysis, Writing – review & editing.
The author(s) declare financial support was received for the research, authorship, and/or publication of this article. This work was supported by the National Key R&D Program of China (2019YFC1407700).
We thank the Data Support from the COPEPOD marine biology dataset (http://mds.nmdis.org.cn/) for providing valuable data and information. We thank LL from Dalian Huaxin Physical And Chemical analysis center CO LTD of China for providing technical support. We also the reviewers for carefully reviewing the manuscript and providing valuable comments to help improve this paper.
Author LL was employed by Dalian Huaxin Physical and Chemical Analysis Center CO LTD.
The remaining authors declare that the research was conducted in the absence of any commercial or financial relationships that could be construed as a potential conflict of interest.
All claims expressed in this article are solely those of the authors and do not necessarily represent those of their affiliated organizations, or those of the publisher, the editors and the reviewers. Any product that may be evaluated in this article, or claim that may be made by its manufacturer, is not guaranteed or endorsed by the publisher.
Araújo M. B., Peterson A. T. (2012). Uses and misuses of bioclimatic envelope modeling. Ecology 93 (7), 1527–1539. doi: 10.1890/11-1930.1
Bittner R. E., Roesler E. L., Barnes M. A. (2020). Using species distribution models to guide seagrass management. Estuar. Coast. Shelf. Sci. 240, 106790. doi: 10.1016/j.ecss.2020.106790
Duarte C. M., Losada I. J., Hendriks I. E., Mazarrasa I., Marbà N. (2013). The role of coastal plant communities for climate change mitigation and adaptation. Nat. Clim. Change 3 (11), 961–968. doi: 10.1038/nclimate1970
Effrosynidis D., Arampatzis A., Sylaios G. (2018). Seagrass detection in the mediterranean: A supervised learning approach. Ecol. Inf. 48, 158–170. doi: 10.1016/i.ecoinf.2018.09.004
Esteban N., Unsworth R. K. F., Gourlay J. B. Q., Hays G. C. (2018). The discovery of deep-water seagrass meadows in a pristine Indian Ocean wilderness revealed by tracking green turtles. Mar. pollut. Bull. 134, 99–105. doi: 10.1016/j.marpolbul.2018.03.018
Garmendia J. M., Rodríguez J. G., Borja Á., Pouso S., del Campo A., Galparsoro I., et al. (2023). Restoring seagrass meadows in Basque estuaries: nature-based solution for successful management. Nat.-Based. Solut. 4, 100084. doi: 10.1016/j.nbsj.2023.100084
Green E. P., Short F. T. (2003). World atlas of seagrasses (Berkeley, CA, USA: University of California Press).
Herbeck L. S., Sollich M., Unger D., Holmer M., Jennerjahn T. C. (2014). Impact of pond aquaculture effluents on seagrass performance in NE Hainan, tropical China. Mar. Poll. Bull. 85 (1), 190–203. doi: 10.1016/j.marpolbul.2014.05.050
Hu W., Zhang D., Chen B., Liu X., Ye X., Jiang Q., et al. (2021). Mapping the seagrass conservation and restoration priorities: Coupling habitat suitability and anthropogenic pressures. Ecol. Indic. 129, 107960. doi: 10.1016/j.ecolind.2021.107960
Jayathilake D. R., Costello M. J. (2018). A modelled global distribution of the seagrass biome. Biol. Conserv. 226, 120–126. doi: 10.1016/j.biocon.2018.07.009
Lee K.-S., Park S. R., Kim Y. K. (2007). Effects of irradiance, temperature, and nutrients on growth dynamics of seagrasses: a review. J. Exp. Mar. Biol. Ecol. 350 (1-2), 144–175. doi: 10.1016/j.jembe.2007.06.016
Lemke D., Hulme P., Brown J., Tadesse W. (2011). Distribution modelling of Japanese honeysuckle (Lonicera japonica) invasion in the Cumberland Plateau and Mountain Region, USA. For. Ecol. Manage. 262 (2), 139–149. doi: 10.1016/j.foreco.2011.03.014
Mazarrasa I., Samper-Villarreal J., Serrano O., Lavery P. S., Lovelock C. E., Marbà N., et al. (2018). Habitat characteristics provide insights of carbon storage in seagrass meadows. Mar. Poll. Bull. 134, 106–117. doi: 10.1016/j.marpolbul.2018.01.059
McHenry J., Rassweiler A., Lester S. E. (2023). Seagrass ecosystem services show complex spatial patterns and associations. Ecosyst. Serv. 63, 101543. doi: 10.1016/j.ecoser.2023.101543
Melo-Merino S. M., Reyes-Bonilla H., Lira-Noriega A. (2020). Ecological niche models and species distribution models in marine environments: A literature review and spatial analysis of evidence. Ecol. Model. 415, 108837. doi: 10.1016/j.ecolmodel.2019.108837
Orth R. J., Harwell M. C., Bailey E. M., Bartholomew A., Jawad J. T., Lombana A. V., et al. (2000). A review of issues in seagrass seed dormancy and germination: implications for conservation and restoration. Mar. Ecol. Prog. Ser. 200, 277–288. doi: 10.3354/meps200277
Prihadi D. J., Agung M. U. K., Wahyuniar P., Iftinaan K. (2023). Seagrass resources as supporting the potential of ecotourism in Menjangan Besar Island, Karimun Islands, Java, Indonesia. World News Nat. Sci. 50, 206–221.
Stankovic M., Kaewsrikhaw R., Rattanachot E., Prathep A. (2019). Modeling of suitable habitat for small-scale seagrass restoration in tropical ecosystems. Estuar. Coast. Shelf. Sci. 231, 106465. doi: 10.1016/j.ecss.2019.106465
Sweatman J. L., Layman C. A., Fourqurean J. W. (2017). Habitat fragmentation has some impacts on aspects of ecosystem functioning in a sub-tropical seagrass bed. Mar. Environ. Res. 126, 95–108. doi: 10.1016/j.marenvres.2017.02.003
Swets J. A. (1988). Measuring the accuracy of diagnostic systems. Science 240 (4857), 1285–1293. doi: 10.1126/science.3287615
UN Envirionment Programme. (2020). Out of the Blue: The Value of Seagrasses to the Environment and to People. Available at: https://www.unep.org/resources/report/out-blue-value-seagrasses-environment-and-people.
UNEP-WCMC, Short, F. T. (2018). Global distribution of seagrasses (version 6.0). Sixth Update to the Data Layer Used in Green and Short, (2003). Available at: http://data.unep-wcmc.org/datasets/7.
Unsworth R. K., Nordlund L. M., Cullen-Unsworth L. C. (2019). Seagrass meadows support global fisheries production. Conserv. Lett. 12 (1), e12566. doi: 10.1111/conl.12566
Valle M., van Katwijk M. M., de Jong D. J., Bouma T. J., Schipper A. M., Chust G., et al. (2013). Comparing the performance of species distribution models of Zostera marina: Implications for conservation. J. Sea. Res. 83, 56–64. doi: 10.1016/j.seares.2013.03.002
Wang M., Wang Y., Guo X., Sha J., Zhang H., Tang X., et al. (2016). Reproductive properties of Zostera marina and effects of sediment type and burial depth on seed germination and seedling establishment. Aquat. Bot. 134, 68–74. doi: 10.1016/j.aquabot.2016.07.003
Waycott M., Duarte C. M., Carruthers T. J. B., Orth R. J., Dennison W. C., Olyarnik S., et al. (2009). Accelerating loss of seagrasses across the globe threatens coastal ecosystems. Proc. Natl. Acad. Sci. U. S. A. 106 (30), 12377–12381. doi: 10.1073/pnas.0905620106
Xiao X., Huang Y., Holmer M. (2020). Current trends in seagrass research in China, (2010-2019). Aquat. Bot. 166, 103266. doi: 10.1016/j.aquabot.2020.103266
Xu S., Xu S., Zhou Y., Yue S., Zhang X., Gu R., et al. (2022). Do adult eelgrass shoots rule seedling fate in a large seagrass meadow in a eutrophic bay in northern China? Mar. Poll. Bull. 178, 113499. doi: 10.1016/j.marpolbul.2022.113499
Yang X., Zhang X., Zhang P., Bidegain G., Dong J., Hu C., et al. (2023). Ensemble habitat suitability modeling for predicting optimal sites for eelgrass (Zostera marina) in the tidal lagoon ecosystem: Implications for restoration and conservation. J. Environ. Manage. 330, 117108. doi: 10.1016/j.jenvman.2022.117108
Yue S., Zhang X., Xu S., Liu M., Qiao Y., Zhang Y., et al. (2021). The super typhoon Lekima, (2019) resulted in massive losses in large seagrass (Zostera japonica) meadows, soil organic carbon and nitrogen pools in the intertidal Yellow River Delta, China. Sci. Total. Environ. 793, 148398. doi: 10.1016/j.scitotenv.2021.148398
Keywords: seagrasses distribution, habitat suitability, MaxEnt model, conservation and restoration, Northern Chinese Seas
Citation: Wang Z, Ma Q, Liang S, Liu Y-a, Liu L, Huang C, Chen K and Hou W (2024) Study on the distribution and habitat suitability of seagrass in the Northern Chinese Seas. Front. Mar. Sci. 10:1297137. doi: 10.3389/fmars.2023.1297137
Received: 19 September 2023; Accepted: 18 December 2023;
Published: 09 January 2024.
Edited by:
Moritz Müller, Swinburne University of Technology Sarawak Campus, MalaysiaReviewed by:
Jianguo Du, State Oceanic Administration, ChinaCopyright © 2024 Wang, Ma, Liang, Liu, Liu, Huang, Chen and Hou. This is an open-access article distributed under the terms of the Creative Commons Attribution License (CC BY). The use, distribution or reproduction in other forums is permitted, provided the original author(s) and the copyright owner(s) are credited and that the original publication in this journal is cited, in accordance with accepted academic practice. No use, distribution or reproduction is permitted which does not comply with these terms.
*Correspondence: Shuxiu Liang, c3hsaWFuZ0BkbHV0LmVkdS5jbg==; Yu-an Liu, eWFsaXVAbm1lbWMub3JnLmNu
†These authors have contributed equally to this work and share first authorship
Disclaimer: All claims expressed in this article are solely those of the authors and do not necessarily represent those of their affiliated organizations, or those of the publisher, the editors and the reviewers. Any product that may be evaluated in this article or claim that may be made by its manufacturer is not guaranteed or endorsed by the publisher.
Research integrity at Frontiers
Learn more about the work of our research integrity team to safeguard the quality of each article we publish.