 Chanhyung Jeon
 Kang-Nyeong Lee
 Qiang Li
 Jae-Hun Park
94% of researchers rate our articles as excellent or good
Learn more about the work of our research integrity team to safeguard the quality of each article we publish.
Find out more
ORIGINAL RESEARCH article
Front. Mar. Sci., 08 January 2024
Sec. Physical Oceanography
Volume 10 - 2023 | https://doi.org/10.3389/fmars.2023.1294191
In situ measurements from an array of pressure-equipped inverted echo sounders (PIESs), numerical simulation results using a non-hydrostatic model (SUNTANS) that does not account for mesoscale variability, and a ray-tracing method are used to investigate the behavior of nonlinear internal waves (NLIWs) in the South China Sea, focusing on period of Typhoon Nanmadol passage. Unusual significant differences in NLIWs arrival time occur between the PIES observation and SUNTANS simulation results after Typhoon Nanmadol passage; i.e., the observed NLIWs show a delay of 0.5–1.5 h at the westernmost PIES sites compared to the simulated ones in the SUNTANS. A data-assimilated ocean model outputs in addition to satellite altimetry reveal that the passage of Typhoon Nanmadol alters the oceanic environments remarkably, creating thermocline shoaling of ~80 m, which can slow down the wave propagation speed. We account for the delay of NLIWs using ray-tracing simulations. Our results demonstrate that typhoon-induced changes in mesoscale structure can significantly impact the fate of NLIWs in the South China Sea, which have potential on ocean mixing and biogeochemical systems.
Nonlinear internal waves (NLIWs) are observed in global oceans and can play important roles in energy dissipation, vertical mixing, sediment resuspension, and biological activities (Apel et al., 2007). Prominent and most energetic NLIWs have been reported in the South China Sea (Zhao et al., 2004; Farmer et al., 2009; Alford et al., 2010; Zhao, 2014; Alford et al., 2015). They arise from steepening of the semidiurnal and diurnal internal tides generated by the interaction of barotropic tides with two ridges in the Luzon Strait (Buijsman et al., 2010a).
Two types of first-mode NLIWs, a- and b-waves, appear in the South China Sea. Several previous studies suggested that the northwestward a-wave with packet-structure was generated in the southern portion of the Luzon Strait because diurnal internal tidal beams reinforced semidiurnal internal tides, and the westward b-wave usually arose from the northern portion of the Luzon Strait, where the distance between the eastern and western ridges is approximately equal to one internal tidal wavelength and leads to semidiurnal internal tidal resonance (Duda et al., 2004; Ramp et al., 2004; Zhao and Alford, 2006; Buijsman et al., 2010a; Buijsman et al., 2010b; Zhang et al., 2011). Recent progress using a numerical simulation pointed out that the a- and b-waves are generated from the western and eastern ridges in the Luzon Strait, respectively, and the b-wave is, in particular, controlled by the double‐ridge internal tide resonance in the strait (Lai et al., 2019). The generation and propagation mechanism of NLIWs in the South China Sea have been reviewed (Helfrich and Melville, 2006; Apel et al., 2007; Alford et al., 2015; Lai et al., 2019); however, several aspects including the evolution of NLIWs interacting with background stratification and current fields still remain insufficiently understood, although several observational studies existed (Huang et al., 2016; Huang et al., 2022; Yang et al., 2022).
The pressure–sensor–equipped inverted echo sounder (PIES), a relatively inexpensive and portable instrument, had been used for the first time to measure NLIWs in the South China Sea and successfully detected NLIWs (Farmer et al., 2009; Li et al., 2009; Li and Farmer, 2011). Further observational study with the PIES array during winter months revealed the existence of NLIWs in winter month (Park and Farmer, 2013), which contradicted the previous understanding from satellite remote sensing (Zheng et al., 2007). Additionally, PIES measurements helped understand the evolution of NLIWs in the deep basin of the South China Sea (Li et al., 2016) and a refraction of NLIWs by the Kuroshio intrusion across the Luzon Strait (Park and Farmer, 2013; Li et al., 2016).
To better understand the evolution of NLIWs transitioning from the Luzon Strait toward the South China Sea, a main observational study of the Internal Waves in Straits Experiment (called IWISE program) was launched in 2011 (July–December) including 13 PIES deployments near the Luzon Strait (Alford et al., 2015). During the observation period, strong Typhoon Nanmadol in 2011 passed across the Luzon Strait from south to north in late August (Figure 1A). We investigated how Typhoon Nanmadol affected the NLIWs in the South China Sea using the PIES observation and numerical simulation as well as the ray-tracing method, focusing on the interaction of NLIWs with background oceanic environments influenced by Typhoon Nanmadol.
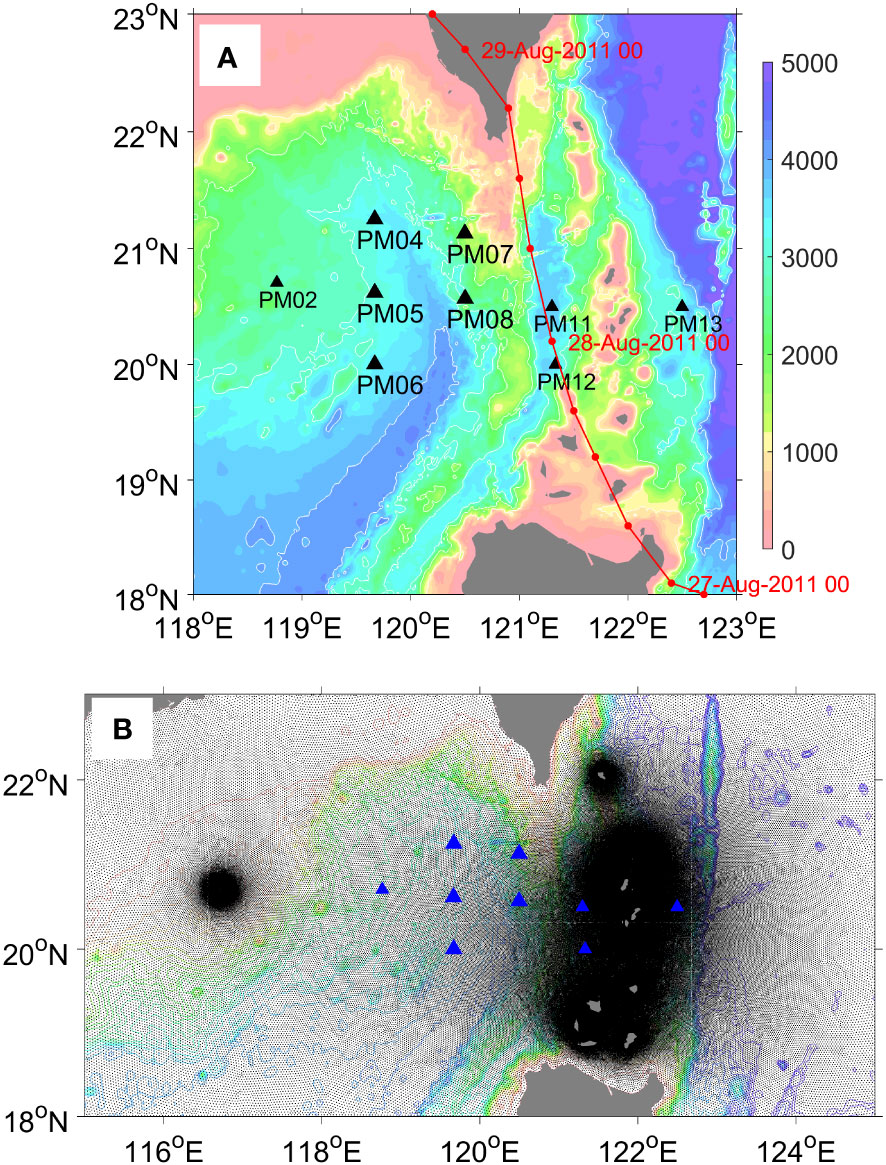
Figure 1 (A) Location of the PIES array in the South China Sea and Luzon Strait. Larger solid black triangles (PM04, PM05, PM06, PM07, and PM08) indicate observation points that are analyzed in this study (see text for detail). Track of Typhoon Nanmadol is marked by a red line with dots at intervals of 6 h. The date designation of the typhoon passage is marked every 24 hours at 00 h GMT (dd-mm-yyyy hh). Background colors denote bathymetry (m). (B) Black dots indicate grid cells of the SUNTANS model. Color contours denote bathymetry (m).
An array of 13 PIES were deployed in a region covering 20–21.5°N and 118.8–122.5°E from July to November 2011 (Figure 1A). Among them, two instruments failed (PM09 and PM10) and the other two were not set up to measure NLIWs (PM01 and PM03). We use the PIES data from PM04–PM08 to investigate the spatiotemporal variability of the NLIWs propagating from the Luzon Strait towards the northern South China Sea. The PIES uses 12 kHz acoustic pings to measure the round-trip acoustic travel time from the seafloor to the sea surface. The travel time is measured every 6 or 10 s to observe the NLIWs and minimize the interference of surface waves and filtered into 2-min samples to reduce instrumental noise. The bottom pressure is measured every 6 s. The effects of free surface displacement on the travel time due to barotropic tides and long period surface displacements are corrected using the bottom pressure measurements (Li et al., 2009; Park and Farmer, 2013). Then, the travel times are converted to thermocline displacements at a rate of 1 millisecond of round-trip acoustic travel time equivalent to a thermocline displacement of 24 m in the South China Sea, which was demonstrated through the direct comparison with tall moorings (Li et al., 2009).
The Stanford Unstructured Nonhydrostatic Terrain-following Adaptive Navier–Stokes Simulator (SUNTANS) model (Fringer et al., 2006) is used for a broader spatial view of internal waves across the basin. The model domain spans 18°–23°N, 115°–125°E, and is composed of 255,883 unstructured grid cells (Figure 1B), with higher resolution near abrupt topography such as ridges in the Luzon Strait. The initial condition for stratification of the SUNTANS model is set to a spatially homogeneous profile derived from historical Conductivity-Temperature-Depth (CTD) casts. Thus, the simulation, forced by eight tidal constituents (M2, S2, N2, K2, O1, K1, P1, and Q1), represents generation and propagation of NLIWs but does not account for an interaction of internal waves with background mesoscale variability. The SUNTANS model has demonstrated excellent performance in previous studies; the simulated wave arrival times are in good agreement with observations (Zhang et al., 2011; Ramp et al., 2019). We compare the SUNTANS model results with the PIES-measured NLIWs to examine the effects of background oceanic fields on NLIWs. For the comparison, the vertical temperature and salinity profiles from the SUNTANS simulation are converted to acoustic travel times and then to the thermocline displacement as for the PIES-measured acoustic travel times.
A linear two-dimensional ray-tracing method, incorporating derivations of the stratification, velocity profiles, and bathymetry, is applied to calculate the wave front propagation (Sherwin et al., 2002; Park and Watts, 2006; Park and Farmer, 2013) and examine the effects of mesoscale variability on the modulation of internal waves. In the ray-tracing method, the ray advances by geometric optics in a direction normal to the wave front by a distance , where and are the eastward and northward linear phase speeds of the first-mode M2 internal tide, respectively, propagating through a velocity field , is the angle between the direction of and ray propagation direction, and is a time step set to 10 min. Phase speed of the first mode, , are estimated by solving the following Taylor-Goldstein equation, including continuous stratification profiles N(z) and horizontal velocity that are obtained from the HYbrid Coordinate Ocean Model (HYCOM, see below) outputs (Smyth et al., 2011; Park and Farmer, 2013; Li et al., 2016),
where is vertical velocity and is the phase speed of eigenmodes. For realistic internal-wave propagation, we add the rotation effect by multiplying 1.07 in the distance calculation as suggested in previous studies (Alford et al., 2010; Park and Farmer, 2013; Li et al., 2016); therefore, for the wave front propagation. Based on previous study (Zhang et al., 2011), we set the initial wave front for a- and b-waves to be inclined at 15.7° and 2.06° clockwise, respectively, and the wave front at each step is spline-smoothed to avoid wiggles caused by numerical errors, as applied in earlier studies (Park and Farmer, 2013; Zhao et al., 2018).
We use data-assimilated HYCOM outputs as a background flow field for the ray-tracing calculations. HYCOM is a global ocean model with a horizontal resolution of 1/12° and adopts vertically hybrid isopycnal-sigma-pressure coordinates (available outputs are the 33 Levitus standard depths). HYCOM data assimilation includes satellite-measured sea level, sea surface temperature, and vertical profiles from various platforms (XBT, CTD, and ARGO profiling floats) (Chassignet et al., 2007). More details on HYCOM are available at www.hycom.org.
Tracks and wind speeds of typhoons for the last 30 years (1992–2021), including Typhoon Nanmadol in 2011, are downloaded from the best track archive of the Joint Typhoon Warning Center (JTWC) (https://www.metoc.navy.mil/jtwc/jtwc.html?western-pacific) and translation speed of typhoons are calculated based on the track and time.
Reproducibility of the two types of NLIWs, the a- and b-waves, from the SUNTANS model is first examined (Figure 2). As pointed out earlier studies (Zhao and Alford, 2006; Zhang et al., 2011), the time-evolving b-wave propagating to the west (Figures 2B–L) and the a-wave evolving toward the northwest are well described (Figures 2G–L). The steepening of thermocline due to the a- and b-waves is simulated near to and west of PM08. The vertical displacement of the thermocline reaches ~70 m at PM05 and PM06.
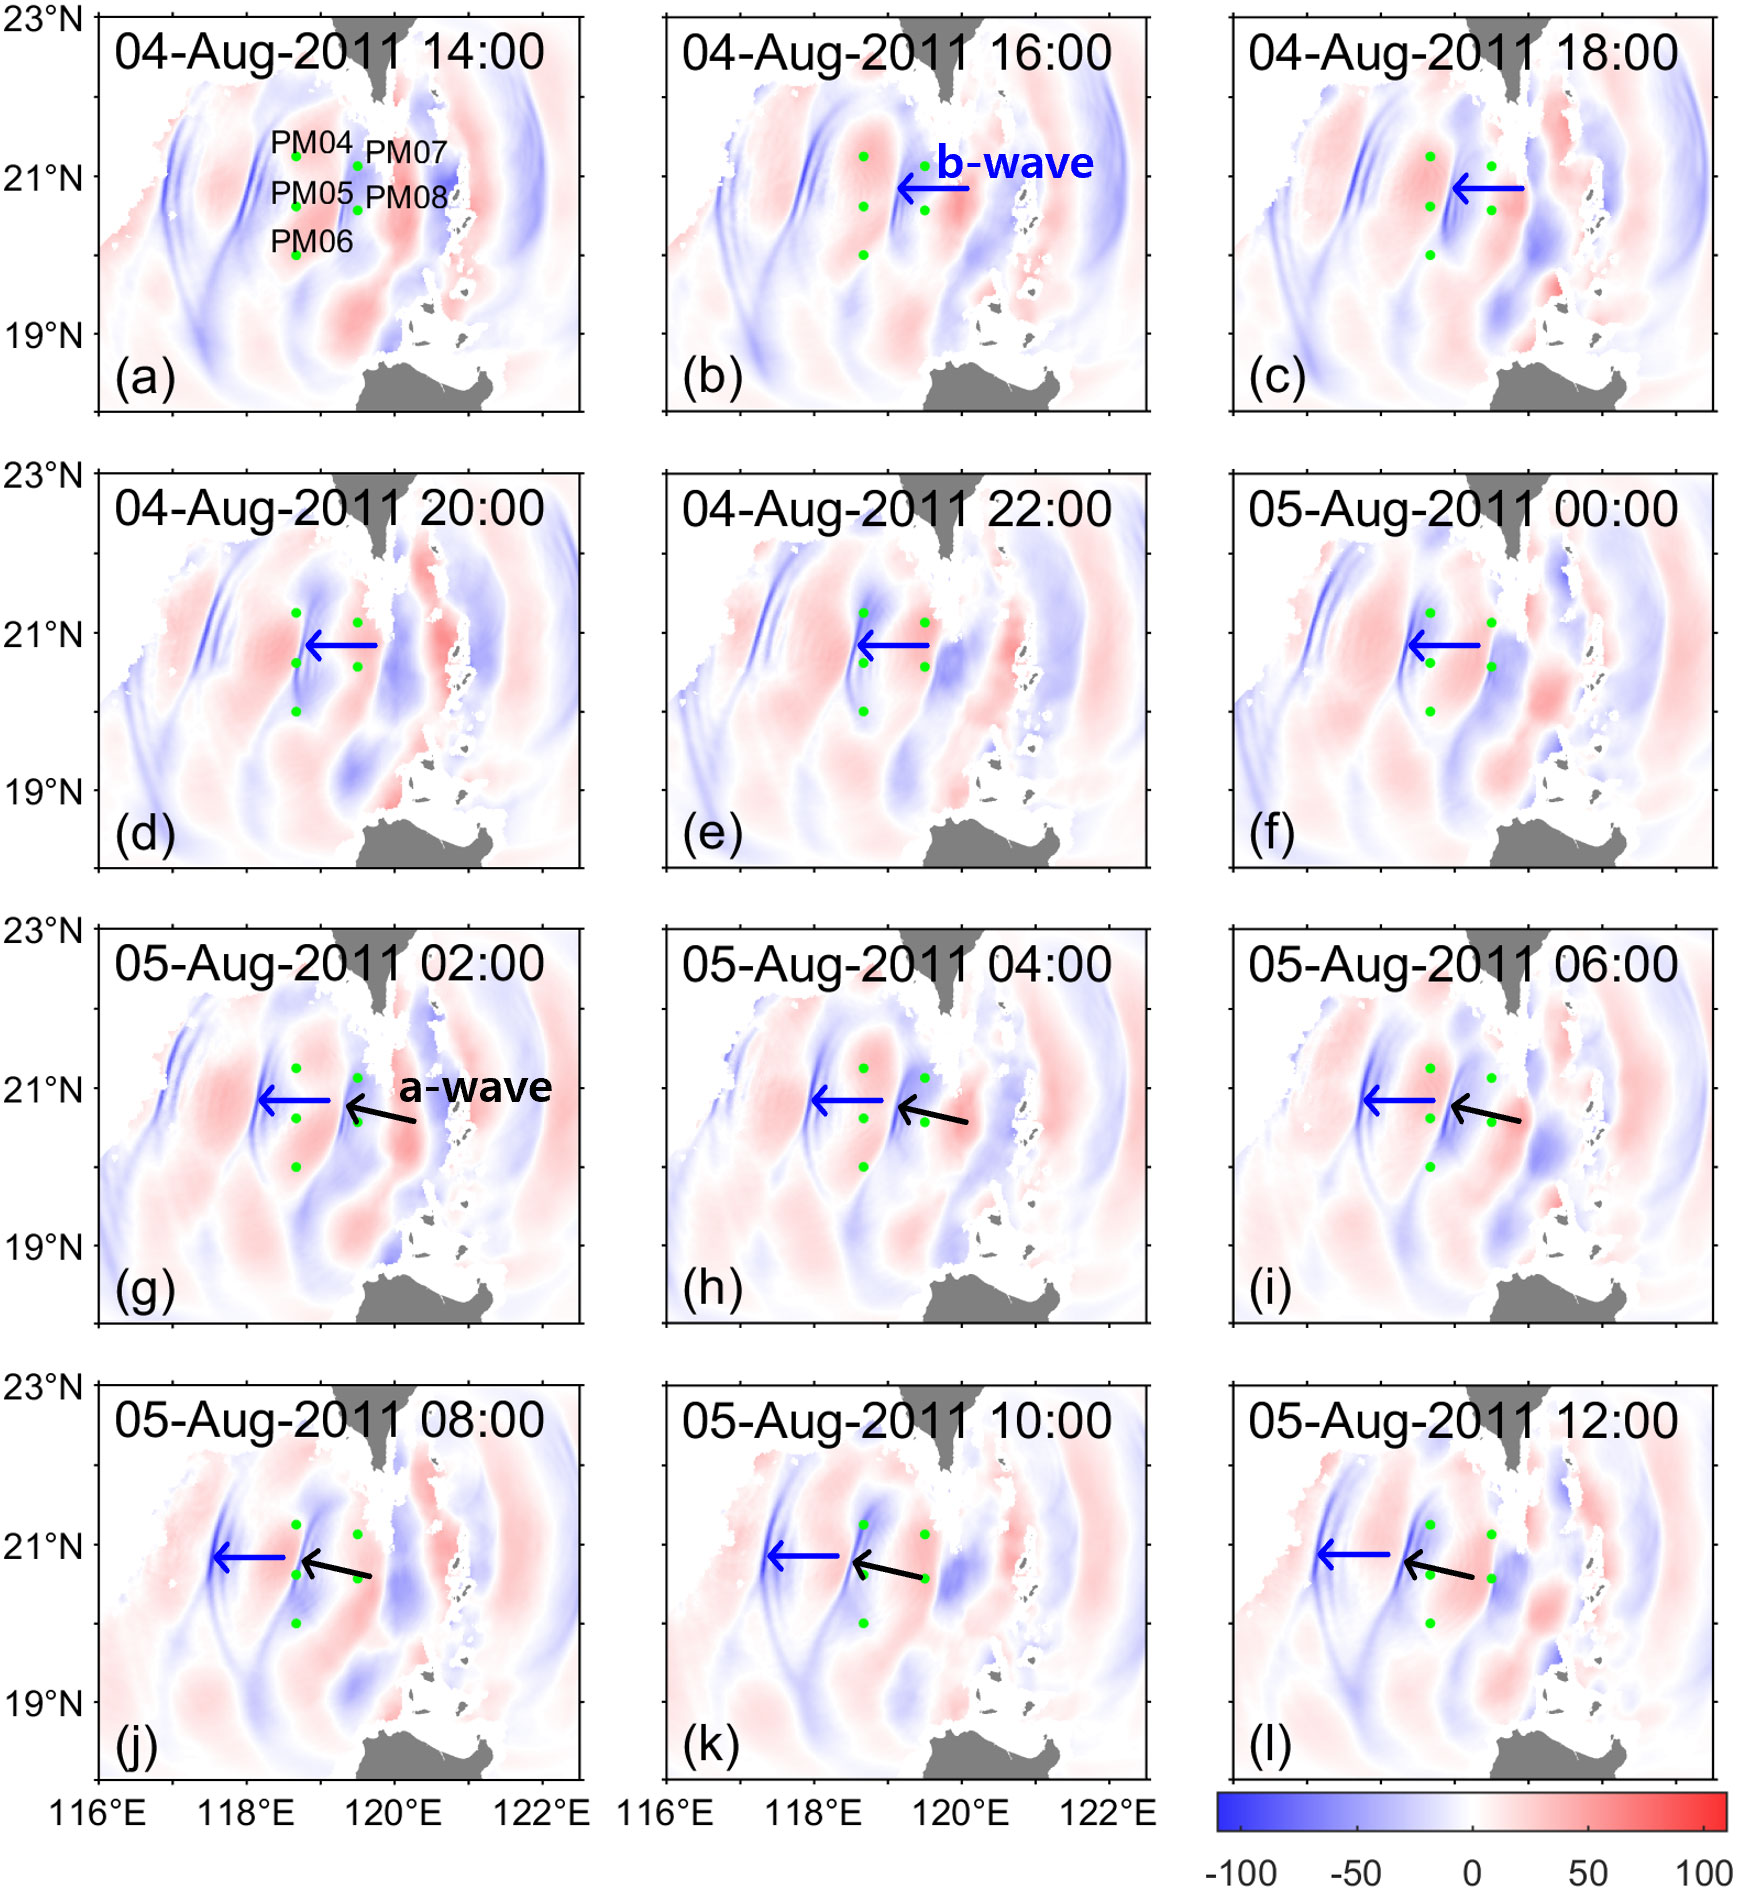
Figure 2 Time series of vertical displacements of the thermocline (m) from the SUNTANS model at intervals of 2 h from 14 h on August 4th to 12 h on August 5th 2011 (A–L). Vertical profiles of the model outputs were used to calculate the acoustic travel times to be converted to the thermocline vertical displacements (see text for detail). Thermocline elevations (depressions) (m) are marked in red (blue). The a-wave (b-wave) propagating northwestward (directly westward) is marked with arrow in panels (G–L) [(B–L)].
A time-series comparison of the vertical displacement of thermocline by the NLIWs between the observed and simulated values at PM04–PM08 is illustrated in Figure 3. In an earlier study (Ramp et al., 2019), the SUNTANS model successfully reproduced the propagation of NLIWs that transitioned from the generation region of the Luzon Strait. The simulated wave trough is in good agreement with the observed one, but subtle differences exist. This discrepancy is probably due to the background oceanic environments, which can cause spatiotemporal variabilities in the internal-wave fields.
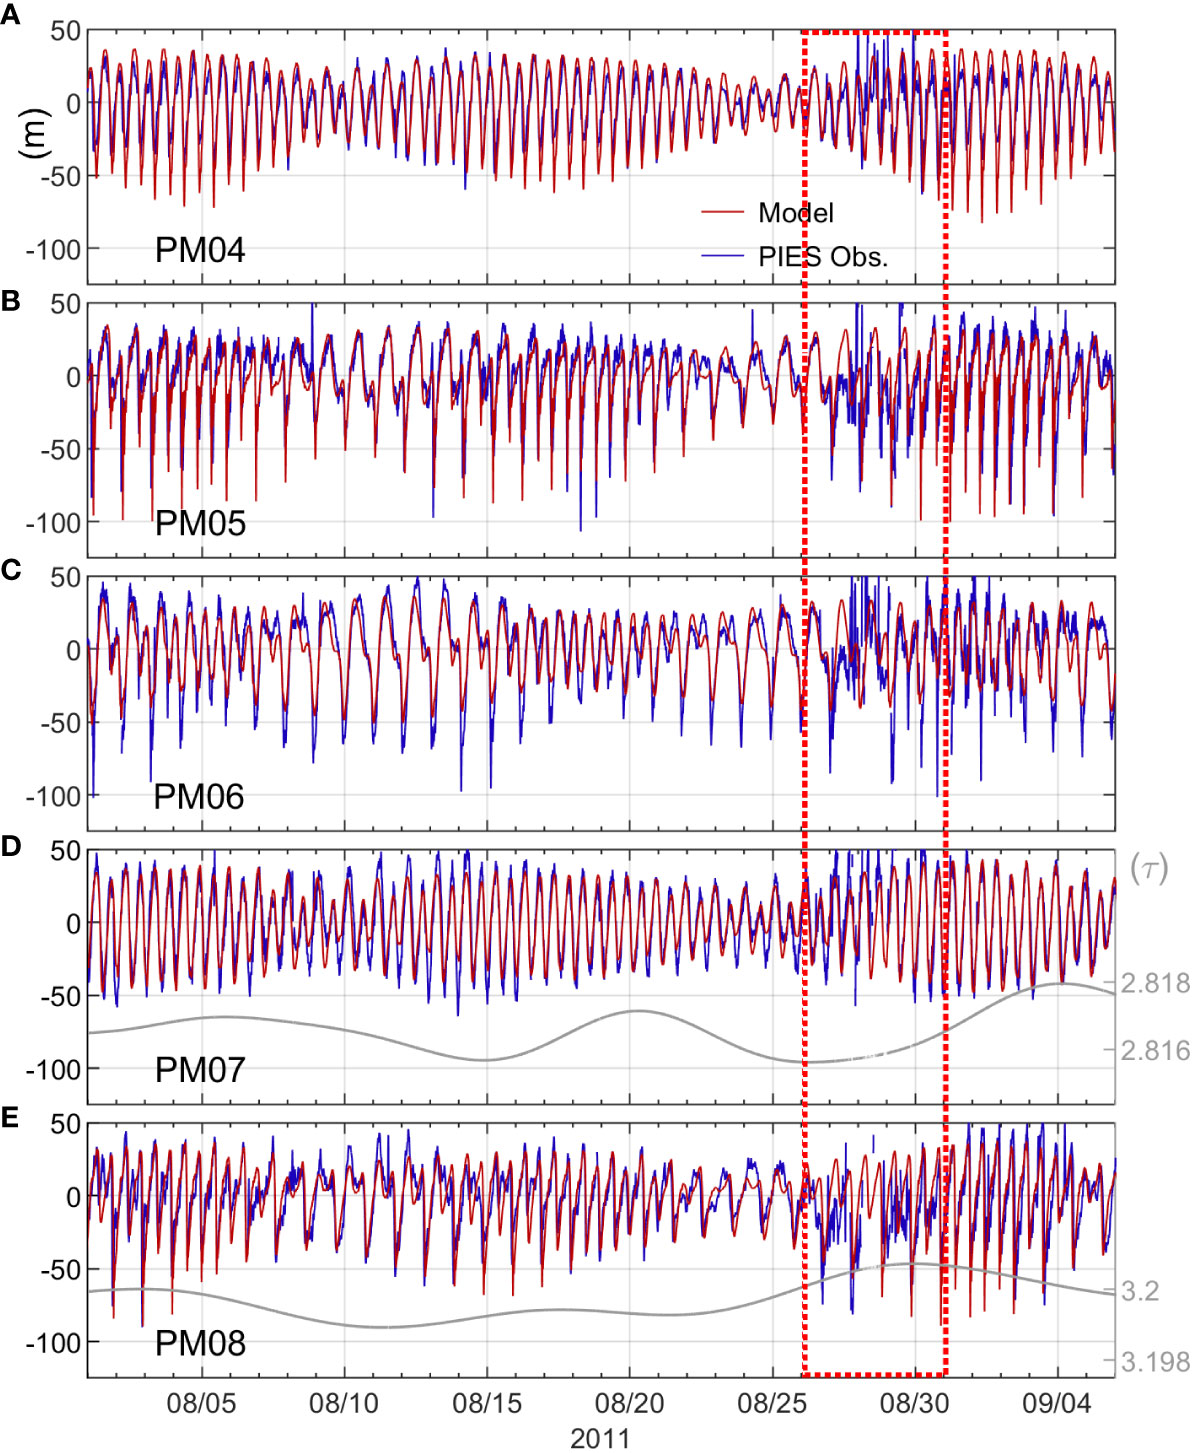
Figure 3 Thermocline displacements at (A) PM04, (B) PM05, (C) PM06, (D) PM07, and (E) PM08 from 1st August to 5th September 2011 from PIES measurements in blue and SUNTANS simulations in red. Positive (negative) values denote upward (downward) displacement. Dotted red box is the period of Typhoon Nanmadol passage, indicating significant peaky but stochastic perturbations in the PIES data (blue solid lines). (D–E) Lowpass-filtered time series of the acoustic travel time from PIES measurements with cut-off periods of 48 h in gray, inferring thermocline shoaling by Typhoon Nanmadol passage.
In late August, the PIES array detects the passage of Typhoon Nanmadol across the Luzon Strait from south to north. Substantial (or abnormal) peaky and random fluctuations arise in the PIES data during typhoon passage (Figure 3, red box with dotted line). Such peaky and stochastic noises are attributed to the extremely rough sea surface and abnormal acoustic scattering at the sea surface due to strong winds of Typhoon Nanmadol. Nevertheless, wave troughs of the NLIWs are efficiently detected (but not all in particular at PM06) from the PIES measurements and are in good agreement with the simulated data.
Discrepancies between the observed and modeled wave arrival times (Δτ), defined as , where τ is the time at the wave trough (Figure 4A), are calculated at PM04, PM05, and PM06 (Figure 4B). The Δτ at PM04–PM06 is almost positive consistently but notable differences in the Δτ occur after Typhoon Nanmadol passage rather than during it. In early September (after Typhoon Nanmadol passage), a remarkable negative Δτ is observed at PM04 and PM05 (blue box) in contrast to other periods, indicating that the observed NLIWs arrive ~1 h later than the simulated ones (when Δτ is negative, the waves reproduced in the SUNTANS model arrive earlier at PIES sites). It is necessary to take into consideration that the time-mean of Δτ is 0.78 h, 0.58 h, and 0.25 h at PM04, PM05, and PM06, respectively. Thus, the actual Δτ in early September would be greater than 1 h. Hence, contrasting to other periods the wave arrivals in the real ocean at PM04 and PM05 are delayed after the typhoon passage, implying that background oceanic environments may play a crucial role in NLIW propagation from the Luzon Strait into the South China Sea.
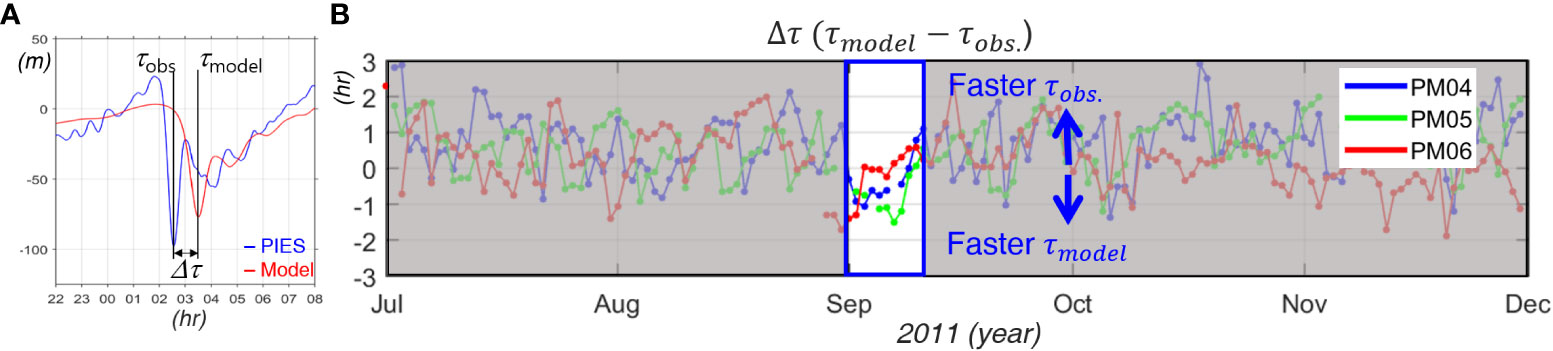
Figure 4 (A) Definition of the discrepancy of the wave arrival time (), time difference of the wave troughs between the observed and modeled NLIW. (B) Time series of discrepancies between the observed and modeled NLIW arrival time () at PM04, PM05, and PM06, indicated by blue, green, and red lines and dots, respectively. Blue box indicates the period after the passage of Typhoon Nanmadol.
The oceanic stratification and current changes induced by Typhoon Nanmadol passage is investigated using data-assimilative HYCOM outputs. The performance of HYCOM in the northern South China Sea was verified in the previous study (Park and Farmer, 2013), though it was different period. For clarity, we compare the background oceanic states by using sea surface height (SSH) fields from the satellite altimetry and HYCOM outputs, focusing on periods of before (mid-August), during (late-August), and after Typhoon Nanmadol (early September). The selection of these periods is based on the development and recovery of low-SSH fields, ensuring temporal and spatial consistency (Figure 5).
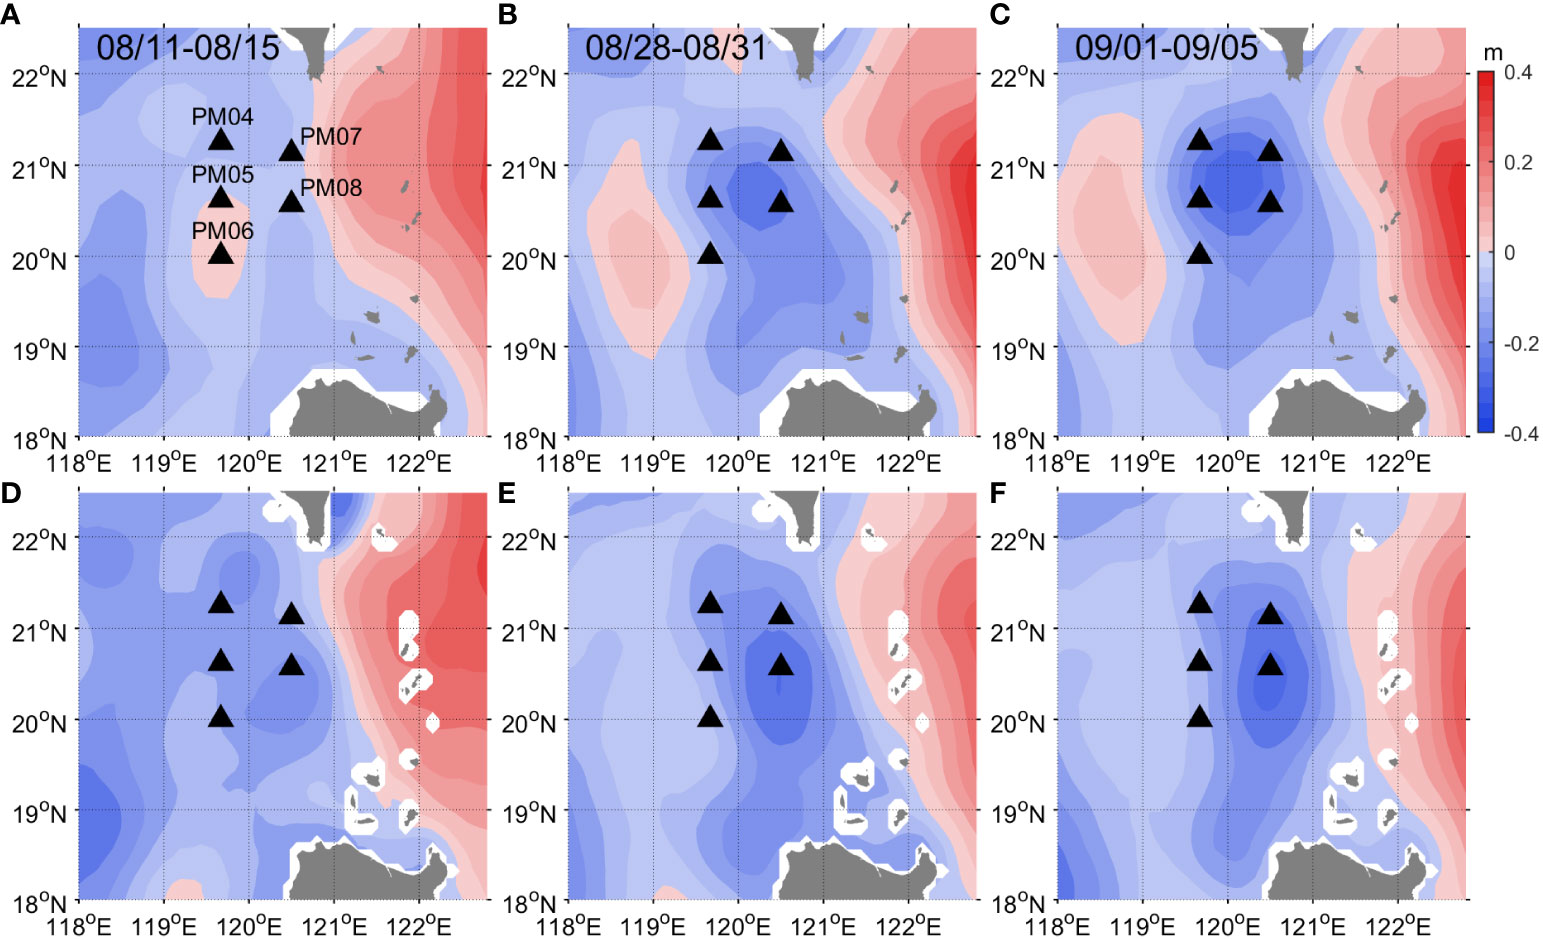
Figure 5 Maps of (A–C) satellite-measured sea surface height (SSH) anomaly averaged on periods of (A) August 11th–15th (before Typhoon Nanmadol), (B) August 28th–31st (during the typhoon), (C) September 1st–5th (after the typhoon). (D–F) are maps of SSH anomaly from HYCOM during (D) before the typhoon, (E) during typhoon, (F) after the typhoon. Note that the spatial mean-value in each map is subtracted.
Before Typhoon Nanmadol, the SSH field (SSH anomaly) from HYCOM exhibits similar pattern to the observed one from satellite altimetry, in particular the location of the Kuroshio and the SSH field near PM07 and PM08 (Figures 5A, D). During the typhoon passage, the location of the Kuroshio and lowered SSH fields at PIES sites (PM04–PM08) are matched well (Figures 5B, E), suggesting notable divergence of surface water or upwelling of thermocline which is a typical oceanic response to the typhoon. After Typhoon Nanmadol, overall SSH fields from the HYCOM are in good agreement with the satellite altimetry at PIES sites of our interest (Figures 5C, F). Comparisons emphasize that the HYCOM represents realistic oceanic environmental changes by the typhoon passage in a region where the key-path of NLIWs in the South China Sea.
Figure 6 shows the oceanic states with an isotherm depth of 15°C, the depth of thermocline (Zheng et al., 2007), and current velocity on the isotherm before, during, and after Typhoon Nanmadol passage. Before the typhoon, the depth of the 15°C isotherm is 200–270 m on the western side of the Luzon Strait. During the typhoon, the depth of the 15°C isotherm shoals and partially reaches ~200 m. A few days later (after the typhoon), the depth of the 15°C isotherm become shallower over the western side of the Luzon Strait, including PM07 and PM08, a well-known oceanic response (upwelling) introduced by cyclonic winds of typhoons in the open ocean (Zhang et al., 2016; Lin et al., 2017; Jeon et al., 2022). The low-pass filtered travel time at PM07 and PM08 also exhibits a slight increasing tendency during and after the typhoon (Figures 3D, E), indicating substantial thermocline shoaling, although the PIES measurements during these periods were a high incidence of missing values. These clearly show that the typhoon changes the oceanic environments notably, which can impact on the internal wave fields (Park and Watts, 2006; Farmer et al., 2011; Jeon et al., 2014; Alford et al., 2015; Chae et al., 2018; Jeon et al., 2019a; Jeon et al., 2019b).
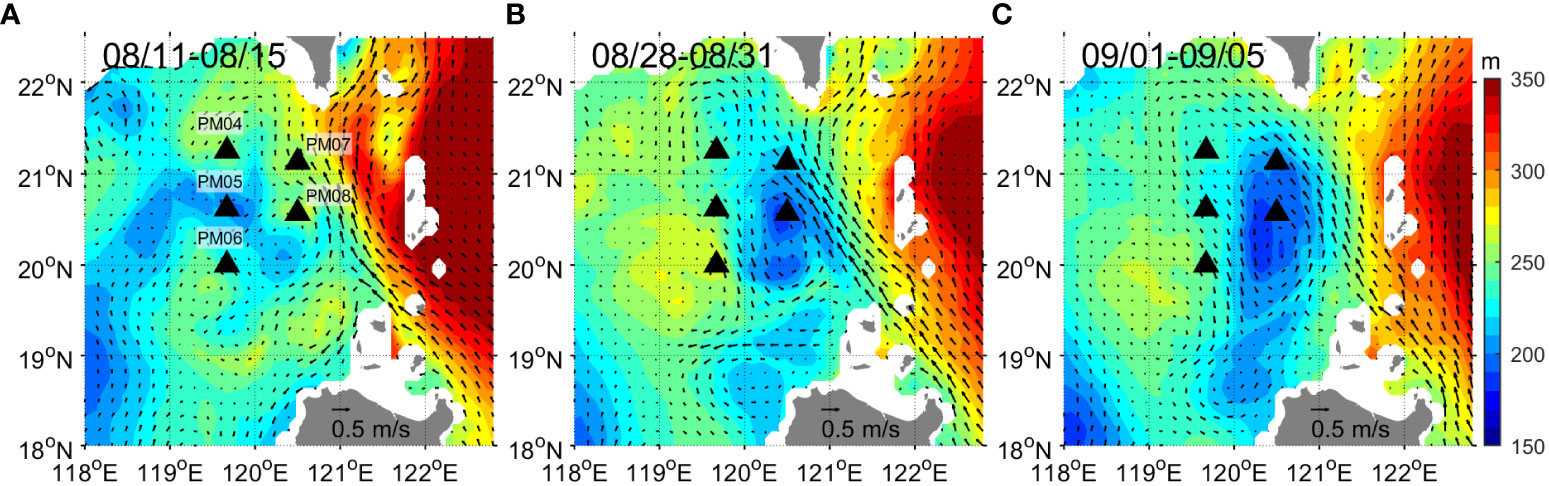
Figure 6 Isotherm depth of 15°C (color) (m) and current velocity (arrow) on the isotherm averaged on (A) August 11th–15th (before the typhoon), (B) August 28th–31st (during Typhoon Nanmadol), (C) September 1st–5th (after the typhoon). Black triangles are PIES observation sites used in this study.
To identify the impact of background oceanic environments on NLIW propagation, we perform three cases of ray-tracing calculation with different oceanic conditions as summarized below (Table 1):
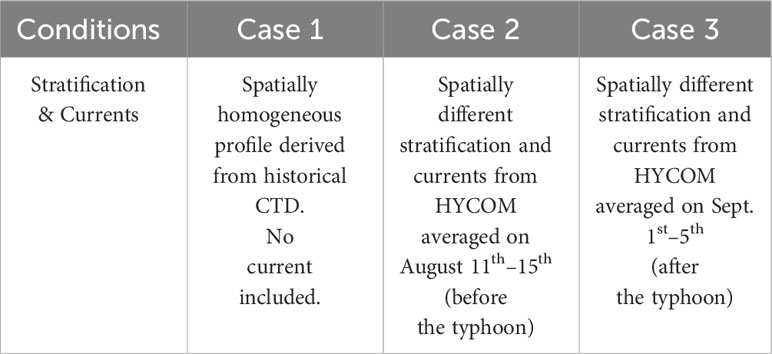
Table 1 Three different cases of the ray-tracing calculation.
The ray-tracing results in spatially constant stratification (Case 1) provide typical paths, mainly determined by water depths. The ray of the a-wave is northwestward (Figure 7A) and that of the b-wave progresses rather westward than the a-wave (Figure 7B). The order of fast wave arrival is the PM06, followed by PM05, and PM04, and the difference in the arrival time between the sites is >2 h and<2 h for a- and b-waves, respectively. The addition of background oceanic conditions in the ray-tracing calculation affects the ray path and wave arrival time. Compared to that in constant stratification (Case 1), the difference in the a-wave arrival times between PM05 and PM06 decreases by an hour and the b-wave arrives at PM05 earlier than at PM06 in the before typhoon scenario (Case 2) (Figures 7C, D). After Typhoon Nanmadol passage, the ray path become similar to that in the constant stratification for both a- and b- waves, but less spreads out for the a-wave (Case 3) (Figures 7E, F).
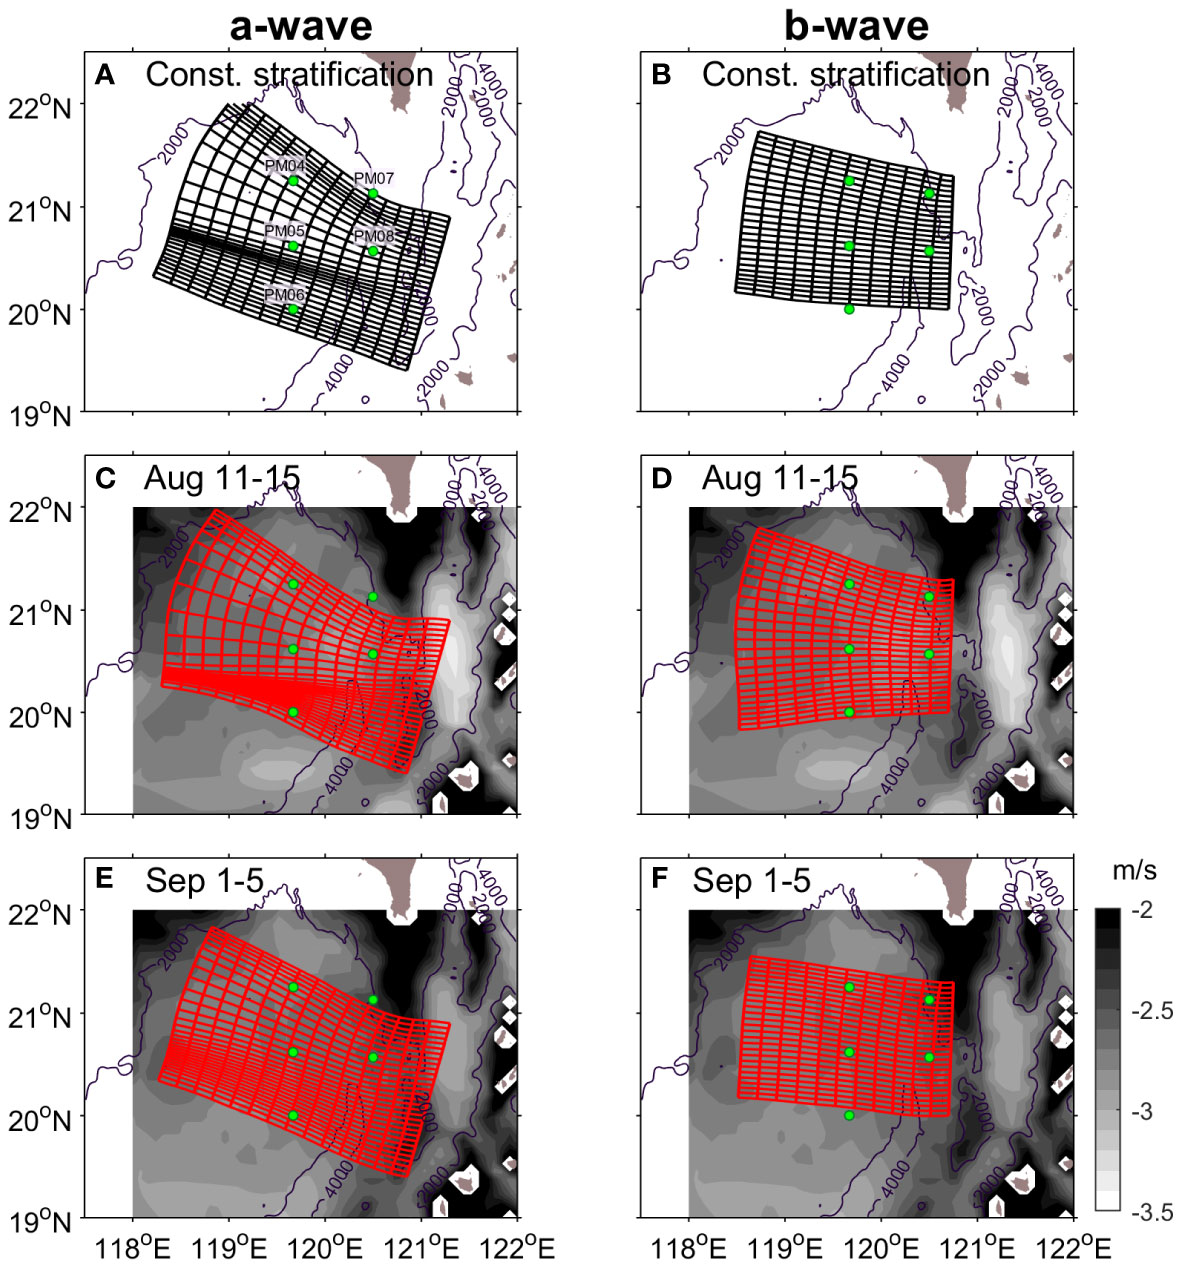
Figure 7 Ray-tracing calculation results with (A, B) constant stratification (Case 1). Ray-tracing calculation results considered spatiotemporally different stratification and current (C, D) during August 11th–15th (Case 2) and (E, F) during September 1st–5th, 2011 (Case 3); (C, E) are for a-wave and (d, f) are for b-wave. Background shades in (C–F) indicate the mean zonal phase speed fields by solving the Taylor-Goldstein equation. We set the initial wave front for a- and b-waves to be inclined at 15.7° and 2.06° clockwise, respectively (see text for detail), and wave fronts were drawn every 2 h. Green dots are PIES deployment sites.
A more detailed comparison of the wave arrival times for a- and b-waves at PM04, PM05, and PM06 is shown in Figure 8. In the constant stratification condition, as aforementioned, the difference in the arrival time between the sites is >2 h and <2 h for a- and b-waves, respectively (Figures 8A, B). Before the typhoon, the a-wave first reaches PM06 after ~13.6 h from the generation region, followed by PM05 about 14.6 h later, and PM04 roughly 16.5 h later, and the difference in the wave arrival time between the sites ~1–2 h (Figure 8C). The difference in the wave arrival time between the sites increases up to 1.8 or 2.5 hours in early September (after the typhoon) (Figure 8E). Before the typhoon, the b-wave first arrives at PM05 after ~10.05 h from the generation regions, followed by PM06 (~10.5 h later), and PM04 (~11.1 h later) (Figure 8D), but after the typhoon passage, it first arrives at PM06 after ~10.5 h, followed by PM05 after ~10.85 h, and PM04 after ~11.6 h (Figure 8F). For both the a- and b-waves, the wave arrival time is significantly delayed at PM04 and PM05, while negligible change is observed at PM06, since there are not significant changes in thermocline depth on the eastern side of PM06. These results indicate that Typhoon Nanmadol influences the propagation speed of a- and b-waves transitioning toward PM04 and PM05 through changes in background oceanic environments. These results correspond to the late wave arrivals at PM04 and PM05 in the PIES data compared to the SUNTANS model results as illustrated in Figure 4B. Therefore, it can be concluded that the delayed wave arrivals at PM04 and PM05 arise from the reduced wave speed by the mesoscale oceanic variability that is created by Typhoon Nanmadol.
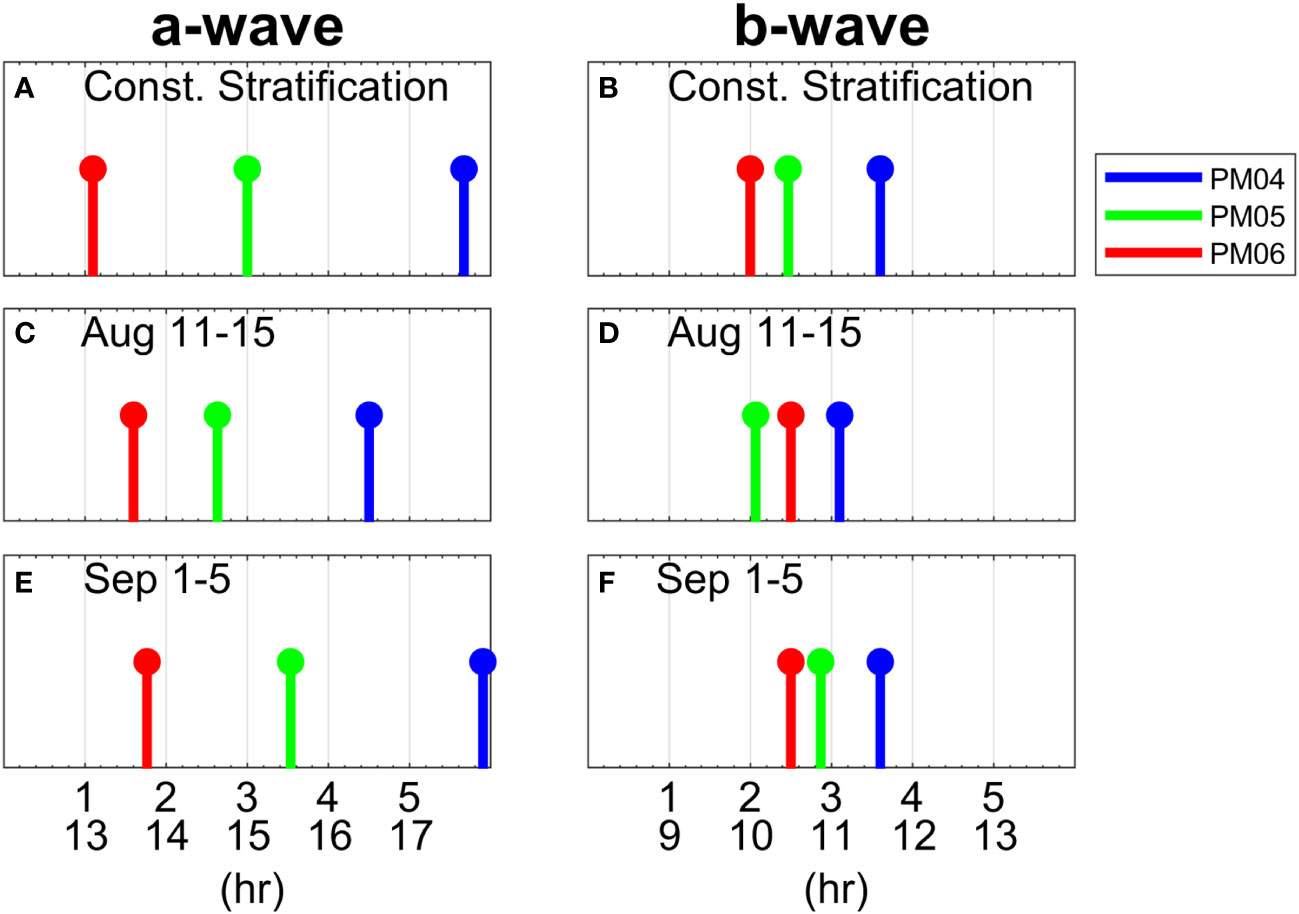
Figure 8 Arrival time of a- and b-waves at PM04, PM05, and PM06 on (A, B) constant stratification, (C, D) August 11th–15th, and (E, F) September 1st–5th obtained from the ray-tracing simulations. First x-axis denotes the arrival time from 7th a-wave front (A, C, E) [5th b-wave front (B, D, F)] and second x-axis indicates the arrival time from 1st wave front.
Typhoons are one of the most powerful energy sources which can change oceanic environments dramatically. We confirmed the remarkable modification of mesoscale structure through the passage of Typhoon Nanmadol and its impact on the NLIWs. The Luzon Strait is one of the most frequent typhoon-pathways and a total of 87 typhoons passed across the western side of the Luzon Strait in the past few decades (1992–2021, the last 30 years); i.e., 2.9 times a year on average (Figure 9A). With the last 30-yr typhoons, we estimate the isopycnal displacement or thermocline shoaling () using the equation of , where is the wind stress, is the water density (=1,022 kg m–3), f is the Coriolis parameter (s–1), and is the typhoon translation speed (Price et al., 1994; Babin et al., 2004; Nam et al., 2012; Jeon et al., 2022); the is calculated based on the formula (Gill, 1982) and drag coefficients (Large and Pond, 1981; Trenberth et al., 1990) with dataset of the typhoon wind speed obtained from JTWC. The estimated thermocline shoaling by Typhoon Nanmadol reaches ~75 m (red asterisk in Figure 9B) as similar to the value reproduced in HYCOM (70–80 m) (Figure 6). The estimation, including a case of Typhoon Nanmadol, presents that approximately 14% typhoons (12 out of 87 typhoons) produce the significant thermocline shoaling (> 50 m) (Figure 9B). This suggests that it is necessary to consider the typhoon-induced oceanic environmental changes to achieve a better understanding of the evolution of NLIWs and their impacts on biogeochemical effects in the South China Sea.
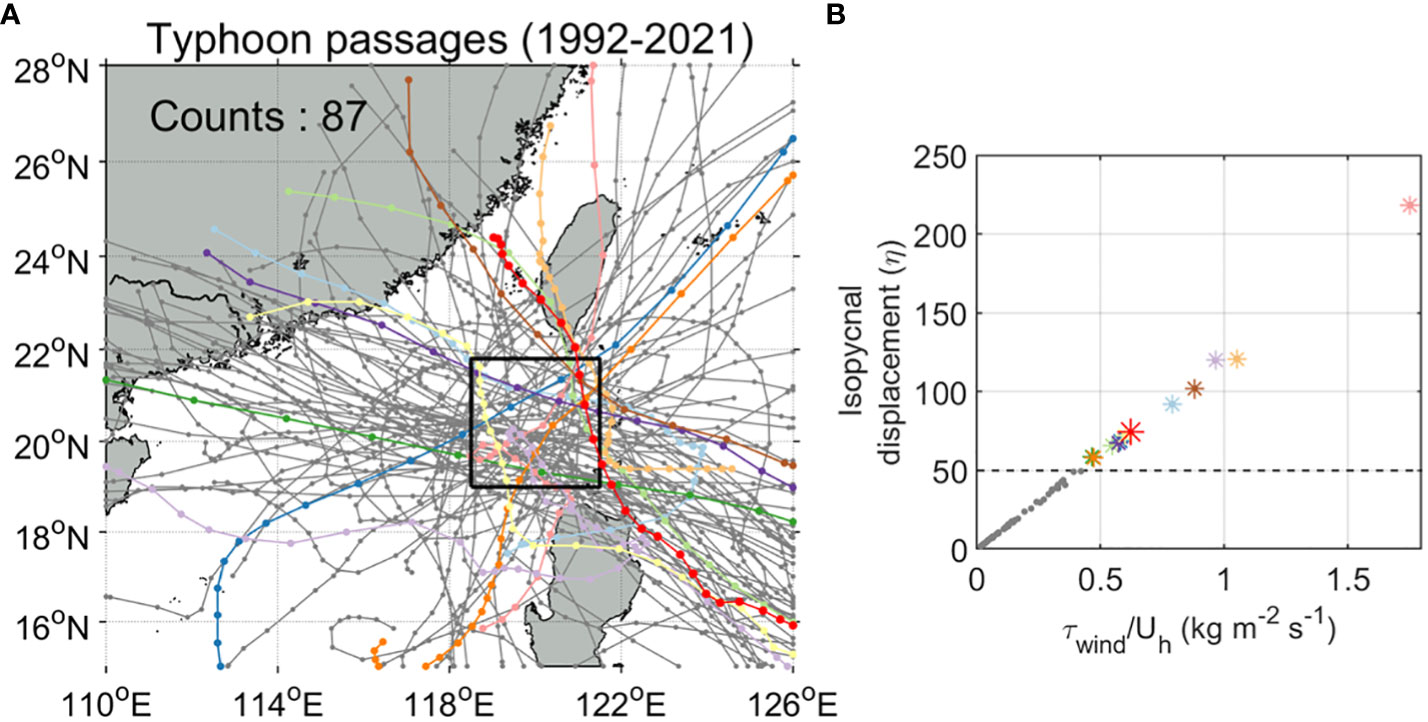
Figure 9 (A) Tracks and number of typhoons that have passed the black box region (western part of the Luzon Strait) from 1992 to 2021 (Tracks were obtained from the best track archive of JTWC). Colored tracks indicate the typhoons which can have vertical displacement higher than 50 m (estimation) in the black box area. (B) Relation between typhoon intensity divided by translation speed () and vertical displacement due to thermocline shoaling by typhoons (see text for detail). Gray dots and colored asterisks indicate typhoons with max vertical displacement when the typhoons pass through the black box area. The colored asterisks denote typhoons which can have vertical displacement higher than 50 m and the red asterisk indicates Typhoon Nanmadol. In panels (A, B), the same typhoons are indicated with the same color.
In this study, we employed in situ measurements from the PIES array, numerical simulations using the non-hydrostatic SUNTANS model which does not account for mesoscale variability, and a ray-tracing method to investigate the behavior of nonlinear internal waves (NLIWs) in the South China Sea, with a focus on the period of Typhoon Nanmadol passage which crosses the PIES array from south to north on the western side of the Luzon Strait. Our findings reveal that significant differences in the arrival times of NLIWs between the observation and numerical simulation following Typhoon Nanmadol passage (early September). Specifically, the observed NLIWs show a delay of 0.5–1.5 h at PM04–PM06 sites compared to the simulated NLIWs in the SUNTANS model. A data-assimilated ocean model output describes that the passage of Typhoon Nanmadol leads to substantial alterations in oceanic environments, creating thermocline shoaling of 70–80 m, which slow down the wave speed. The ray-tracing calculations of internal waves with HYCOM-generated realistic oceanic background fields efficiently account for the delay of wave arrivals at PIES sites. Our results highlight the significant impact of typhoon-induced changes in mesoscale structure on the evolution of NLIWs in the South China Sea.
Our work, as a case study, presents notable changes in NLIWs in response to the typhoon through typhoon-modified mesoscale structure. To better understand and quantify the impact of typhoons with having different intensity, path, size, translation speed, and duration on the fate of NLIW, further observation and modeling are needed. Also, further investigations, including refined modeling and theoretical approaches, are required for estimating the internal wave amplitude changes which may be vital in understanding energy dissipation of internal waves (LeBlond and Mysak, 1978) and their biogeochemical effects across the South China Sea (Hung et al., 2021a; Hung et al., 2021b; Feng et al., 2023).
The datasets presented in this study can be found in online repositories. The names of the repository/repositories and accession number(s) can be found below: The PIES data analyzed here are available at https://doi.org/10.5281/zenodo.10252487.
CJ: Formal Analysis, Funding acquisition, Methodology, Validation, Visualization, Writing – original draft, Writing – review & editing. K-NL: Formal Analysis, Methodology, Validation, Visualization, Writing – review & editing. QL: Formal Analysis, Methodology, Validation, Writing – review & editing. J-HP: Conceptualization, Data curation, Formal Analysis, Funding acquisition, Investigation, Methodology, Supervision, Validation, Visualization, Writing – review & editing.
The author(s) declare financial support was received for the research, authorship, and/or publication of this article. This work was supported by Korea Institute of Marine Science & Technology Promotion (KIMST) funded by the Ministry of Oceans and Fisheries, Korea (RS-2023-00256330, Development of risk managing technology tackling ocean and fisheries crisis around Korean Peninsula by Kuroshio Current), (20220566, Study on Northwestern Pacific Warming and Genesis and Rapid Intensification of Typhoon), and [UN Decade Implementation Research Group project (RS-2023-00256732)]. This research was also supported by Basic Science Research Program through the National Research Foundation of Korea (NRF) funded by the Ministry of Education (NRF-2021R1I1A3057993). This work was also supported by the National Natural Science Foundation of China (41976001).
The authors declare that the research was conducted in the absence of any commercial or financial relationships that could be construed as a potential conflict of interest.
All claims expressed in this article are solely those of the authors and do not necessarily represent those of their affiliated organizations, or those of the publisher, the editors and the reviewers. Any product that may be evaluated in this article, or claim that may be made by its manufacturer, is not guaranteed or endorsed by the publisher.
Alford M. H., Lien R.-C., Simmons H., Klymak J., Ramp S., Yang Y. J., et al. (2010). Speed and evolution of nonlinear internal waves transiting the south China sea. J. Phys. Oceanogr. 40, 1338–1355. doi: 10.1175/2010JPO4388.1
Alford M. H., Peacock T., MacKinnon J. A., Nash J. D., Buijsman M. C., Centurioni L. R., et al. (2015). The formation and fate of internal waves in the South China Sea. Nature 521, 65–69. doi: 10.1038/nature14399
Apel J. R., Ostrovsky L. A., Stepanyants Y. A., Lynch J. F. (2007). Internal solitons in the ocean and their effect on underwater sound. J. Acoust. Soc Am. 121, 695–722. doi: 10.1121/1.2395914
Babin S. M., Carton J. A., Dickey T. D., Wiggert J. D. (2004). Satellite evidence of hurricane-induced phytoplankton blooms in an oceanic desert. J. Geophys. Res. C Ocean. 109, 1–21. doi: 10.1029/2003jc001938
Buijsman M. C., Kanarska Y., McWilliams J. C. (2010a). On the generation and evolution of nonlinear internal waves in the South China Sea. J. Geophys. Res. 115, C02012. doi: 10.1029/2009JC005275
Buijsman M. C., McWilliams J. C., Jackson C. R. (2010b). East-west asymmetry in nonlinear internal waves from Luzon Strait. J. Geophys. Res. Ocean. 115, 2009JC006004. doi: 10.1029/2009JC006004
Chae J.-Y., Jeon C., Park S. J., Park J.-H. (2018). Behavior of diurnal internal waves in the southwestern east/Japan sea. J. Coast. Res. 85, 486–490. doi: 10.2112/SI85-098.1
Chassignet E. P., Hurlburt H. E., Smedstad O. M., Halliwell G. R., Hogan P. J., Wallcraft A. J., et al. (2007). The HYCOM (HYbrid Coordinate Ocean Model) data assimilative system. J. Mar. Syst. 65, 60–83. doi: 10.1016/j.jmarsys.2005.09.016
Duda T. F., Lynch J. F., Irish J. D., Beardsley R. C., Ramp S. R., Chiu C.-S., et al. (2004). Internal tide and nonlinear internal wave behavior at the continental slope in the northern south China sea. IEEE J. Ocean. Eng. 29, 1105–1130. doi: 10.1109/JOE.2004.836998
Farmer D., Alford M., Lien R.-C., Yang Y. J., Chang M.-H., Li Q. (2011). From luzon strait to dongsha plateau: stages in the life of an internal wave. Oceanography 24, 64–77. doi: 10.5670/oceanog.2011.95
Farmer D. M., Li Q., Park J.-H. (2009). Internal wave observations in the South China Sea: The role of rotation and non-linearity. Atmosphere-Ocean 47, 267–280. doi: 10.3137/OC313.2009
Feng X., Wang L., Ji C., Wang H., Zhu C., Jia Y. (2023). The impact of internal solitary waves on deep-sea benthic organisms on the continental slope of the northern South China Sea. Front. Mar. Sci. 10. doi: 10.3389/fmars.2023.1184397
Fringer O. B., Gerritsen M., Street R. L. (2006). An unstructured-grid, finite-volume, nonhydrostatic, parallel coastal ocean simulator. Ocean Model. 14, 139–173. doi: 10.1016/j.ocemod.2006.03.006
Gill A. E. (1982). Atmosphere-ocean dynamics (USA: Academic Press). Available at: https://books.google.co.kr/books?id=h-8fyAEACAAJ.
Helfrich K. R., Melville W. K. (2006). LONG NONLINEAR INTERNAL WAVES. Annu. Rev. Fluid Mech. 38, 395–425. doi: 10.1146/annurev.fluid.38.050304.092129
Huang X., Chen Z., Zhao W., Zheng Z., Zhou C., Yang Q., et al. (2016). An extreme internal solitary wave event observed in the northern South China Sea. Sci. Rep. 6, 1–10. doi: 10.1038/srep30041
Huang X., Huang S., Zhao W., Zhang Z., Zhou C., Tian J. (2022). Temporal variability of internal solitary waves in the northern South China Sea revealed by long-term mooring observations. Prog. Oceanogr. 201, 102716. doi: 10.1016/j.pocean.2021.102716
Hung J.-J., Tung C.-H., Lin Z.-Y., Chen Y. L., Peng S.-H., Lin Y.-H., et al. (2021a). Active and passive fluxes of carbon, nitrogen, and phosphorus in the northern South China Sea. Biogeosciences 18, 5141–5162. doi: 10.5194/bg-18-5141-2021
Hung J.-J., Wang Y.-H., Fu K.-H., Lee I.-H., Tsai S.-S., Lee C.-Y., et al. (2021b). Biogeochemical responses to internal-wave impacts in the continental margin off Dongsha Atoll in the Northern South China Sea. Prog. Oceanogr. 199, 102689. doi: 10.1016/j.pocean.2021.102689
Jeon C., Park J.-H., Nakamura H., Nishina A., Zhu X.-H., Kim D. G., et al. (2019a). Poleward-propagating near-inertial waves enabled by the western boundary current. Sci. Rep. 9, 9955. doi: 10.1038/s41598-019-46364-9
Jeon C., Park J.-H., Park Y.-G. (2019b). Temporal and spatial variability of near-inertial waves in the east/Japan sea from a high-resolution wind-forced ocean model. J. Geophys. Res. Ocean. 124, 6015–6029. doi: 10.1029/2018JC014802
Jeon C., Park J.-H., Varlamov S. M., Yoon J.-H., Kim Y. H., Seo S., et al. (2014). Seasonal variation of semidiurnal internal tides in the East/Japan Sea. J. Geophys. Res. Ocean. 119, 2843–2859. doi: 10.1002/2014JC009864
Jeon C., Watts D. R., Min H. S., Kim D. G., Kang S. K., Moon I., et al. (2022). Weakening of the Kuroshio upstream by cyclonic cold eddies enhanced by the consecutive passages of typhoons Danas, Wipha, and Francisco (2013). Front. Mar. Sci. 9. doi: 10.3389/fmars.2022.884768
Lai Z., Jin G., Huang Y., Chen H., Shang X., Xiong X. (2019). The generation of nonlinear internal waves in the south China sea: A three-dimensional, nonhydrostatic numerical study. J. Geophys. Res. Ocean. 124, 8949–8968. doi: 10.1029/2019JC015283
Large W. G., Pond S. (1981). Open ocean momentum flux measurements in moderate to strong winds. J. Phys. Oceanogr. 11, 324–336. doi: 10.1175/1520-0485(1981)011<0324:OOMFMI>2.0.CO;2
LeBlond P. H., Mysak L. A. (1978). Waves in the Ocean (Amsterdam: Elsevier Scientific Publishing Company).
Li Q., Farmer D. M. (2011). The generation and evolution of nonlinear internal waves in the deep basin of the south China sea. J. Phys. Oceanogr. 41, 1345–1363. doi: 10.1175/2011JPO4587.1
Li Q., Farmer D. M., Duda T. F., Ramp S. (2009). Acoustical measurement of nonlinear internal waves using the inverted echo sounder. J. Atmos. Ocean. Technol. 26, 2228–2242. doi: 10.1175/2009JTECHO652.1
Li Q., Wang B., Chen X., Chen X., Park J.-H. (2016). Variability of nonlinear internal waves in the South China Sea affected by the Kuroshio and mesoscale eddies. J. Geophys. Res. Ocean. 121, 2098–2118. doi: 10.1002/2015JC011134
Lin S., Zhang W.-Z., Shang S.-P., Hong H.-S. (2017). Ocean response to typhoons in the western North Pacific: Composite results from Argo data. Deep Sea Res. Part I Oceanogr. Res. Pap. 123, 62–74. doi: 10.1016/j.dsr.2017.03.007
Nam S., Kim D. J., Moon W. M. (2012). Observed impact of mesoscale circulation on oceanic response to Typhoon Man-Yi, (2007). Ocean Dyn. 62, 1–12. doi: 10.1007/s10236-011-0490-8
Park J.-H., Farmer D. (2013). Effects of Kuroshio intrusions on nonlinear internal waves in the South China Sea during winter. J. Geophys. Res. Ocean. 118, 7081–7094. doi: 10.1002/2013JC008983
Park J.-H., Watts D. R. (2006). Internal tides in the southwestern Japan/east sea. J. Phys. Oceanogr. 36, 22–34. doi: 10.1175/JPO2846.1
Price J. F., Sanford T. B., Forristall G. Z. (1994). Forced stage response to a moving hurricane. J. Phys. Oceanogr. 24, 233–260. doi: 10.1175/1520-0485(1994)024<0233:FSRTAM>2.0.CO;2
Ramp S. R., Park J.-H., Yang Y. J., Bahr F. L., Jeon C. (2019). Latitudinal structure of solitons in the south China sea. J. Phys. Oceanogr. 49, 1747–1767. doi: 10.1175/JPO-D-18-0071.1
Ramp S. R., Tang T. Y., Duda T. F., Lynch J. F., Liu A. K., Chiu C.-S., et al. (2004). Internal solitons in the northeastern south China sea part I: sources and deep water propagation. IEEE J. Ocean. Eng. 29, 1157–1181. doi: 10.1109/JOE.2004.840839
Sherwin T. J., Vlasenko V. I., Stashchuk N., Jeans D. R. G., Jones B. (2002). Along-slope generation as an explanation for some unusually large internal tides. Deep Sea Res. Part I Oceanogr. Res. Pap. 49, 1787–1799. doi: 10.1016/S0967-0637(02)00096-1
Smyth W. D., Moum J. N., Nash J. D. (2011). Narrowband oscillations in the upper equatorial ocean. Part II: properties of shear instabilities. J. Phys. Oceanogr. 41, 412–428. doi: 10.1175/2010JPO4451.1
Trenberth K. E., Large W. G., Olson J. G. (1990). The mean annual cycle in global ocean wind stress. J. Phys. Oceanogr. 20, 1742–1760. doi: 10.1175/1520-0485(1990)020<1742:TMACIG>2.0.CO;2
Yang Y., Huang X., Zhou C., Zhang Z., Zhao W., Tian J. (2022). Three-dimensional structures of internal solitary waves in the northern south China sea revealed by mooring array observations. Prog. Oceanogr. 209, 102907. doi: 10.1016/j.pocean.2022.102907
Zhang H., Chen D., Zhou L., Liu X., Ding T., Zhou B. (2016). Upper ocean response to typhoon Kalmaegi, (2014). J. Geophys. Res. Ocean. 121, 6520–6535. doi: 10.1002/2016JC012064
Zhang Z., Fringer O. B., Ramp S. R. (2011). Three-dimensional, nonhydrostatic numerical simulation of nonlinear internal wave generation and propagation in the South China Sea. J. Geophys. Res. 116, C05022. doi: 10.1029/2010JC006424
Zhao Z. (2014). Internal tide radiation from the Luzon Strait. J. Geophys. Res. Ocean. 119, 5434–5448. doi: 10.1002/2014JC010014
Zhao Z., Alford M. H. (2006). Source and propagation of internal solitary waves in the northeastern South China Sea. J. Geophys. Res. Ocean. 111, 1–14. doi: 10.1029/2006JC003644
Zhao Z., Klemas V., Zheng Q., Yan X.-H. (2004). Remote sensing evidence for baroclinic tide origin of internal solitary waves in the northeastern South China Sea. Geophys. Res. Lett. 31, L06352. doi: 10.1029/2003GL019077
Zhao R., Zhu X.-H., Park J.-H., Li Q. (2018). Internal tides in the northwestern South China Sea observed by pressure-recording inverted echo sounders. Prog. Oceanogr. 168, 112–122. doi: 10.1016/j.pocean.2018.09.019
Keywords: nonlinear internal waves, Typhoon Nanmadol, arrival time, Luzon Strait, South China Sea
Citation: Jeon C, Lee K-N, Li Q and Park J-H (2024) Impact of Typhoon Nanmadol (2011) on the propagation of nonlinear internal waves in the South China Sea. Front. Mar. Sci. 10:1294191. doi: 10.3389/fmars.2023.1294191
Received: 14 September 2023; Accepted: 28 November 2023;
Published: 08 January 2024.
Edited by:
Chunyan Li, Louisiana State University, United StatesReviewed by:
Zhongxiang Zhao, University of Washington, United StatesCopyright © 2024 Jeon, Lee, Li and Park. This is an open-access article distributed under the terms of the Creative Commons Attribution License (CC BY). The use, distribution or reproduction in other forums is permitted, provided the original author(s) and the copyright owner(s) are credited and that the original publication in this journal is cited, in accordance with accepted academic practice. No use, distribution or reproduction is permitted which does not comply with these terms.
*Correspondence: Jae-Hun Park, amFlaHVucGFya0BpbmhhLmFjLmty
Disclaimer: All claims expressed in this article are solely those of the authors and do not necessarily represent those of their affiliated organizations, or those of the publisher, the editors and the reviewers. Any product that may be evaluated in this article or claim that may be made by its manufacturer is not guaranteed or endorsed by the publisher.
Research integrity at Frontiers
Learn more about the work of our research integrity team to safeguard the quality of each article we publish.