 Xiaocheng Tang
 Huayu Liu1
- 1School of Civil Engineering, Jilin Jianzhu University, Changchun, Jilin, China
- 2National Engineering Research Center for Marine Aquaculture, Zhejiang Ocean University, Zhoushan, Zhejiang, China
- 3Construction Engineering Department, State Grid Jilin Power Supply Company, Jilin, China
- 4School of Marine Engineering Equipment, Zhejiang Ocean University, Zhoushan, Zhejiang, China
The Smoothed Particle Hydrodynamics (SPH) method modified by Corrective Smoothed Particle Method (CSPM) and Riemann solution is employed to simulate the interaction between double-chambered perforated caissons and waves. The accuracy and applicability of the numerical method are verified by the theoretical values and experimental data through comparisons. The effects of the top cover height s, the width of the wave dissipation chamber B and the perforated rate μ on the wave surface η or wave pressure p of the caisson are numerically analysis. The results show that under the calculated wave conditions, the top cover height s and perforated rate μ are significant factors affecting the wave dissipation performance of the caisson, while the width of the wave dissipation chamber B has little effect on the wave surface η. In the meanwhile, with the increase of the top cover height s, the wave pressure p on the front perforated plate and the back wall at the static water level gradually decreases, and the wave pressure p on the back perforated plate first decreases and then increases. In addition, the modified SPH method is also used to explore the changes of the pressure field and the velocity field of water particles, tracing the instantaneous velocity of water particles at different positions at different time, and describe the motion state of water particles, which provides effective facilitates for investigating the interaction between double-chambered perforated caissons and waves.
1 Introduction
With the advancement of human societal activities, it is increasingly challenging to satisfy growing demands with limited land resources and space. Consequently, mankind has shifted its focus towards the ocean in order to integrate and utilize the abundant resources it holds. However, whether it pertains to marine resource exploitation and transportation or daily port operations, ensuring the offshore area’s sea surface stability becomes an urgent necessity. A new-type perforated caisson structure was initially proposed by Jarlan and is commonly referred to as the Jarlan-type breakwater (Jarlan, 1961). The perforated caisson structure, as a novel form of breakwater construction, has been extensively researched and implemented in many countries, such Japan, Canada, Italy. However, its initial application in China can be traced back to the East breakwater project of Qinhuangdao Oil Port Phase II in 1975. Its principle of wave dissipation consists of two main components. Firstly, a portion of the wave is fully reflected upon encountering the front perforated plate’s unperforated areas, while another portion passes through the perforated plated enters the wave dissipation chamber. Then the wave reflected by the back wall in wave dissipation chamber meet with the incident wave in front of the caisson, resulting in further energy reduction. Secondly, in the wave dissipation chamber, complex interactions cause a partial dissipation of energy from incoming waves. According to relevant scholars the perforated caisson is described with six main forms: fully perforated breakwaters, partially perforated breakwaters, breakwaters with multiple perforated plates, breakwaters with a top cover, perforated breakwater with rock cores and perforated breakwater with a horizontal porous plate (Huang et al., 2011).
Many scholars have conducted extensive researches on perforated caisson breakwaters with diverse methods. In terms of physical model experiments, A series of comprehensive investigations were conducted on the horizontal force (arm of force) and vertical force experienced by perforated caissons with a top cover under regular and irregular waves through rigorous physical model experiments (Li et al., 2004; Li et al., 2005). They derived relevant empirical formulas and obtained numerous valuable conclusions for follow-up researches. Similarly, another part of the study was conducted by experimental research and theoretical analysis on the pressure distribution of components of perforated caisson with a top cover, identifying the most unfavorable wave load distribution. And further research found that perforated caisson with a top cover experience a higher total horizontal force compared to those without a top cover in regular wave action (Chen et al.,2005a; Chen et al., 2005b). In terms of numerical simulation, the Volume of Fluid (VOF) method was employed to conduct numerical analysis on the wave force acting on a perforated caisson with a top cover, proposing a simplified calculation formula for the total horizontal force and compared it with experimental results (Chen et al., 2006; Chen et al., 2007). The pressure characteristics of a double-chambered perforated caisson breakwater under oblique wave action were investigated using the eigenfunction expansion-matching method (Sun et al., 2014). The VOF method was also employed to investigate the reflection characteristics, the velocity field and distribution of turbulence intensity in proximity of perforated caissons within multi-chambers structure (Liu et al., 2021). Aristodemo et al. (2015) employed the SPH method revised by Molteni and Colagrossi (2009) to investigate the interaction between regular waves and perforated caissons with a top cover through time, space, and frequency domains. The numerical results were compared with experimental findings, revealing that it has a better fit solely underwater. However, limitations were observed in estimating the maximum load near the static water level and horizontal structure. Meanwhile, another revised SPH method was adopted to numerically study the total horizontal force on perforated caissons, described the velocity vector of water particles entering and exiting the wave chamber, and analyzed the distribution of each component of the total horizontal force (Tang et al., 2017b). The open-sourced computational fluid dynamics software (OpenFOAM), is used for investigating the wave loads on boxes and the time series of the free surface of water from their influencing factor, such as spectral peak periods, wave amplitudes, horizontal positions and initial velocities (Gao et al., 2022; Gao et al., 2023). From the microscopic perspective, a series of comparison were made to study the effects of three-dimensional mixed nanofluid flow (Zhang et al., 2022). Lee et al. (2023) discussed the hydraulic performance (i.e. the wave reflection, wave transmission, discharge of wave overtopping, and stability of breakwater) of four perforated breakwaters designed for the southeast coast of Korea measured by physical experiments in a wave flume. Wang et al. (2022) used a pressure-based compressible flow solver investigating the issue of breaking wave impact on perforated caisson breakwaters (PCBs) is comprehensively. Mohammadreza et al. (2023) employed the commercial CFD package FLUENT™ to study the three-dimensional RANS-VOF numerical simulations of a partially perforated caisson on a rubble-mound foundation, and experiment proved that the anastomosis was good. It was also compared with the Takahashi formula and Tabet-Aoul method. A new method was proposed (Zhang et al., 2023) to analyze breakwater reliability, in which marine environmental elements are regarded as random variables in the limit state equation and the environmental loadings are intermediate variables which need not be taken statistical analysis. According to the response of the limit equation to determine whether a breakwater failure, then failure probability and reliability index would be obtained by calculation. Ali et al. (2023) used the FLOW-3D software investigated the interactions of an irregular wave with the caisson breakwater finding that in the new geometry of the caisson breakwater, the amount of the overtopping, wave reflection, imposed pressure on the structure, imposed pressure, and speed in the concrete block at the base of the structure are considerably abated in comparison with the caisson breakwater with a rigid vertical wall.
In recent years, a series of perforated caissons with different designs have emerged. For example, a novel perforated-wall caisson concept, which is so-called low reflection breakwater (LOWREB) within three chambers and an internal weir to enhance reflectivity even at high water levels was developed from the University of Porto in Portugal (Ciocan et al., 2017). An anti-reflection permeable caisson breakwater (ARPEC) was invented, which incorporates a complex arrangement of offset openings in both the exterior and interior walls, facilitating effective wave energy dissipation and enabling hydraulic connectivity between the sea side and port side (Sammarco et al., 2020).
In practical engineering at docks or ports, the perforated caissons are typically not designed as open-top and are usually added some component to form top structures, for example a top cover. Therefore, it is crucial to consider the influence of the top covers on wave interaction with the perforated caisson. Moreover, for further enhancement in wave dissipation performance, a multi-chambered design can be employed in perforated caissons. However, the existing literature and research have provided limited reports on composite research regarding the six fundamental types of perforated caissons which are mentioned in Huang et al. (2011). Considering the practical engineering, this paper numerically investigates the intricate interaction between regular waves and the double-chambered perforated caisson with a top cover using the SPH method modified by CSPM and Riemann solution. The employed modified SPH method is a pure Lagrangian meshless particle adaptive approach that offers significant advantages in handling large deformations, tracking free surface motion, and capturing variable time histories.
This paper adopted modified SPH method for simulating the interaction between forward regular wave and double-chambered caisson with a top cover, which can be used for analyzing and calculating the wave surface conditions and pressure distribution. Therefore, the motion state of water particles in the wave dissipation chamber is investigated under the numerical example.
2 SPH method
2.1 Method introduction
As we all know, based on the grid algorithm, there are two basic methods commonly used to describe the physical governing equations: Euler method and Lagrange method are typically represented by Finite Difference Method (FDM) (Wilkins, 1999) and Finite Element Method (FEM) (Zienkiewicz and Taylor, 2000) respectively. The Euler method assumes that it is difficult to construct a regular grid in a complex or irregular geometry problem domain. If Euler method must be used to deal with such a complex problem, complex mathematical transformation will be needed, which will increase the extra workload. If the complex or irregular geometry problem domain has been successfully meshing, it will be also quite difficult to determine the deformation boundary, deal with the interface of motion, and locate the position between materials. Euler’s method is suitable for studying the fixed material properties to obtain material properties, such as the dynamics of particle flow. In comparison to the Lagrange method, numerical simulation is necessary for studying objects that exhibit large deformation characteristics, which may require secondary grid partitioning. However, when simulating fluid dynamics problems such as underwater explosions or high-speed impacts with highly non-uniform properties and free surfaces, the grid-based approach becomes significantly limited.
It is evident that the aforementioned grid-based numerical methods have their own advantages. However, they also exhibit certain limitations restricting their practical applicability. The utilization of grid methods for solving computational fluid dynamics problems proves to be highly challenging and prone to unforeseen issues. Consequently, there is an urgent need for a novel approach to replace mesh methods in order to address problems involving significant deformation, high non-uniformity, and free surfaces. The meshless method emerges as a promising alternative.
The meshless method surpasses the traditional mesh method in various aspects, representing an approach that approximates boundary conditions or partial differential equations through arbitrary distribution of particles and subsequently achieves numerical solutions with relatively high precision. Unlike conventional numerical methods, these particles are distributed arbitrarily without the need for grid connections. Due to its ability to discretize problem domains into arbitrarily distributed points without requiring a predefined grid, the meshless method has garnered increasing interest among researchers as a means to tackle problems that prove challenging for traditional grid-based approaches.
Smooth particle fluid dynamics (SPH) method is one of the representative meshless methods, SPH method has Lagrangian characteristics, the specific process is to use a series of arbitrarily distributed particles to describe the motion process of the system in the computing domain, and carry out regular physical motion according to the conservation equation. At present, SPH method has been widely used in other fields, such as fluid dynamics problems with large deformation characteristics, dynamic corresponding problems with material strength characteristics, etc.
Compared with many numerical methods, SPH method has its own characteristics, among which adaptability is the most important one. Adaptability means that the field variable of the problem domain can be solved at the initial stage, and the approximation of the field variable is completed on the basis of any particle distribution at the current time within any time step. Therefore, no matter how the particles are distributed in the problem domain, the solution of the SPH equation will not be affected, so the SPH method can be generally used to deal with many problems with extremely large deformation characteristics. In addition, the SPH method does not need to use a defined grid to connect the information of the particles, and does not need to mesh the mesh details as the mesh method, when the finite element method (FEM) and finite difference method (FDM) to solve the problem, SPH method can attract more attention.
However, the accuracy and stability of the traditional SPH method cannot be guaranteed in its application, necessitating further enhancement. This study employs the Riemann solution and Corrected Smoothed Particle Method (CSPM) to refine the treatment of wave-caisson interaction.
2.2 SPH method calculation model
Navier-Stokes equations are used to describe the mass conservation equation and the momentum conservation equation of fluid. Where, the mass conservation equation is expressed as:
Where ρ and u are the density and velocity vectors of water, kg/m3, m/s, respectively; t is time, s; Nabla operator .
In the SPH method, water is considered as a slightly compressible fluid, so the continuity equation (i.e. mass conservation equation) formula (1) can be discretized into particle form as:
Where i and j stand for particles i and j; mj represents the mass of particle j, kg; uij is the relative velocity vector between particles i and j, m/s; Wij=W(Rij, h) (Rij =|xi-xj|/h, xi and xj are the coordinates of particle i and j respectively) is a kernel function that describes the influence of particle j on particle i, which is closely related to the smoothing length h.
The particle density is calculated using a summation method based on the Smoothed Particle Hydrodynamics (SPH) method as (Monaghan, 2005):
A density filtering method were conducted to address two-phase flow problems (Colagrossi and Landrini, 2003), employing an updated particle density representation as:
Where the kernel function is updated as:
The equation describing the momentum conservation of motion in viscous fluids can be expressed as:
Where, p is the pressure, N/m2; F is the volume force, usually the acceleration of gravity, m/s2.
Then, the momentum equation of the SPH method for fluid motion can be described as:
In order to apply the SPH method to the fluid dynamics problem, it is necessary to do some processing to avoid the non-physical shock in the process of fluid dynamic shock. As is well-known, in the process of fluid movement, there is no physical discontinuity and the compressibility of wave particles, so when the three laws of conservation of mass, conservation of momentum and conservation of energy are applied to convert the kinetic energy of fluid motion into heat energy, a parameter needs to be introduced for processing. Usually, this energy transfer is expressed in the form of viscous dissipation. Monaghan (Monaghan, 1985; Monaghan, 1994) proposed artificial viscosity and applied it to the impact problem field as Formula (8), and obtained ideal solution results. Its obvious advantage is that it cannot only solve the problem of converting kinetic energy of molecules into heat energy, but also provide the indispensable energy dissipation of wave front impact processes, and most importantly, solve the problem of non-physical penetration of particle interactions (Messahel and Zisis, 2020). So far, in most of the literature on SPH method papers, Monaghan’s model is the most widely used.
Where ; ; ; uij=ui-uj; xij=xi-xj; u and x are the velocity and coordinates of the particle, m/s, m respectively; For the free surface flow problem, α and β are constants of 0.01 and 0.1, respectively; ; C is the speed of sound in water, 1500m/s. Finally, the momentum equation under SPH method can be described as:
In this case, the pressure p is calculated using the state equation for a free surface:
Where, γ is a constant of 7 in the liquid phase; ρ0 is the initial density of water, which is 1000 kg/m3; Usually the B = (C2ρ0)/γ. The sound velocity C value (usually is 1500m/s) should be taken to ensure that the compressibility of the fluid is less than 1%.
Similarly, the energy governing equation in the form of SPH during fluid motion (Gingold and Monaghan, 2003):
Where ψij is related to the choice of viscous term.
The stability of the computational model is carefully considered, particularly for hydrodynamic problems involving wave propagation, deformation, and breaking, which are characterized by significant deformations and free surface flow. To address these challenges, modifications to the SPH hydrodynamic equation are made using CSPM and Riemann solutions.
The CSPM method proposed by Randles and Libersky can improve the accuracy and effectively solve the problem of particle continuity near the free surface (Randles and Libersky, 2000):
The Riemann solution is employed to describe the interaction between particles, and the corresponding hydrodynamic equation can be expressed as (Parshikov et al., 2000):
Where, , , and are the normal pressure and velocity values on the contact surface of particles i and j respectively, Pa, m/s, ρi, ρj, ci, cj, pi, pj are the density kg/m3, sound velocity m/s, and pressure Pa respectively; , are the projected values of particle i and j velocity ui and uj in their connection directions m/s, respectively.
2.3 SPH method verification
2.3.1 Comparison and selection of particle spacing
In SPH numerical wave flume, the spacing of different particles will not only affect the calculation efficiency, but also have a great influence on the accuracy of the calculation results. In this section, the particle spacing of 0.02m, 0.01m and 0.005m were simulated respectively. The numerical pressure results of different particle spacing waves were analyzed to test the numerical wave flume, and the fluid particle spacing adopted in this paper was determined from two aspects: accuracy and computational efficiency. Figure 1A shows the comparison of the wave pressure time history curve at 2m of the static water level of the wave making plate when the period T=1.2s, wave height H=0.14m and d=0.4m.
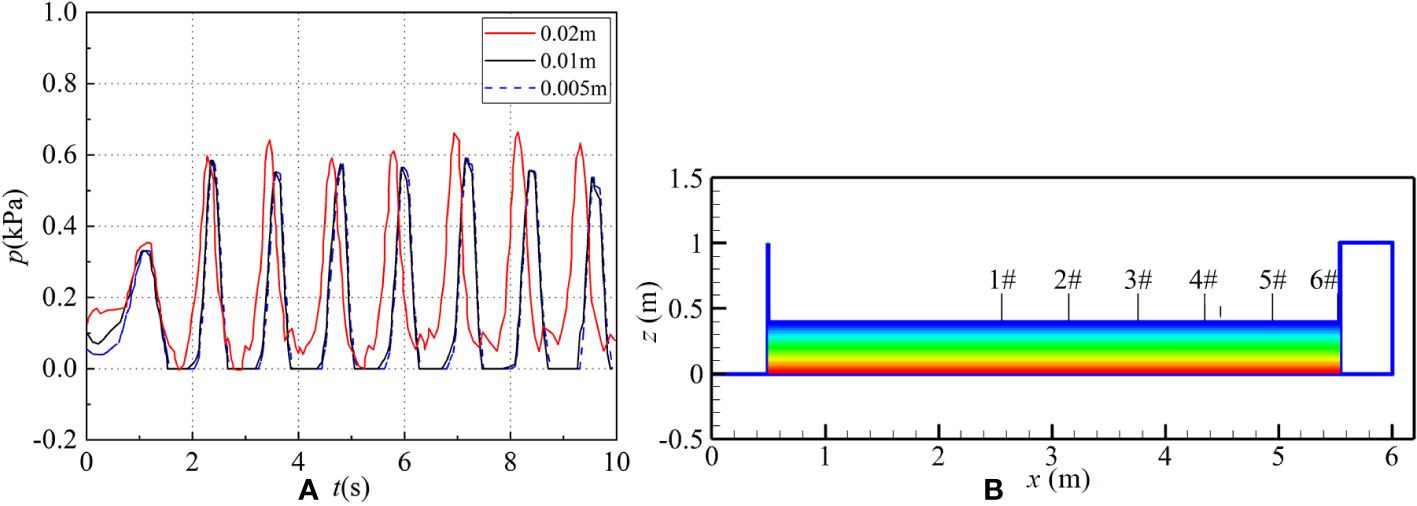
Figure 1 (A) Wave pressure time history series comparison in 10s under different particle spacings 0.02m (red line), 0.01m (black line) and 0.005m (blue dashed line) under wave conditions: T=1.2s, H=0.14m and d=0.4m. (B) The arrangement of value points 1#(x=2.55m, nodal point), 2#(x=3.14m, abdominal point), 3#(x=3.75m, nodal point), 4#(x=4.34m, abdominal point), 5#(x=4.94m, nodal point), 6#(x=5.54m, abdominal point) adopted on wave surface under wave conditions: d=0.4m, H=0.12m, T=1.4s.
As can be seen from Figure 1A, when the particle spacing is 0.02m, the wave pressure is obviously unstable, and there are burrs at the trough position. When the particle spacing is 0.01m, the initial wave pressure is larger than when the particle spacing is 0.005m; however, after approximately 0.5s, the change in wave pressure becomes mainly the same as when the particle spacing is 0.005m. Therefore, considering the time consuming and computational efficiency comprehensively, the numerical simulation with particle spacing of 0.01m is the best choice in this paper.
2.3.2 The verification for wave surface
The SPH method used in this paper has been verified in detail in related articles published by authors in the past (Tang et al., 2017a; Tang, 2016; Tang et al., 2017b), including the boundary conditions of absorbable wave-making plates, wave-breaking boundary of wave flume, Convergence verification, different particle sizes and spacing, flume opening boundary, viscous wave-breaking layer thickness, reflectance, flume wave surface and solid caisson wave pressure. Considering the constraints on article length, only the wave surface and wave pressure utilized in this study have been validated below.
For verifying the accuracy of the wave surface numerical simulation method proposed in this paper, a two-dimensional numerical flume is established using the modified SPH method which has a total length of 6m and a height of 1m, with a solid caisson placed at the right end. An absorbable wave generating plate generates waves at the left end and propagate regular forward incident waves to the right. In the simulated wave conditions, d is water depth, m; H is wave height, m, and T is period, s.
According to the linear wave theory (Zou, 2009), standing waves will arise after the collision of the incident wave with the reflected wave, and the resulting wave surface η can be mathematically expressed as:
If the time series change of the wave surface is taken into account, the temporal factor can be multiplied on the right side. Thus, it can be express as:
Where, is the dispersion equation under finite water depth, is the wave circular frequency, rad/s; g is typically 9.8 m/s2; k is wave number; d is water depth, m; t is time, s; x is the horizontal distance from the caisson, m. cos t is a time factor.
Relevant theories of standing waves reveal that: in the antinodes, x=nπ/k=(n/2)L (n=0,1,2······), the wave surface η and vertical velocity v will reach the maximum, and the η is twice that of the incident wave heigh H; In the nodes, x=(n+1/2)π/k=(n+1/2)L/2 (n=0,1,2······), the amplitude A and vertical velocity v is 0. According to these, choose a wave condition for verifying the accuracy of wave surface η. Figure 1B respectively show the coordinates and locations of partial abdomens and nodes in the chosen condition.
Figure 2 shows the comparison of the time history series of wave surface between the SPH numerical method at points 3# & 4# and the linear wave theory formula (17).
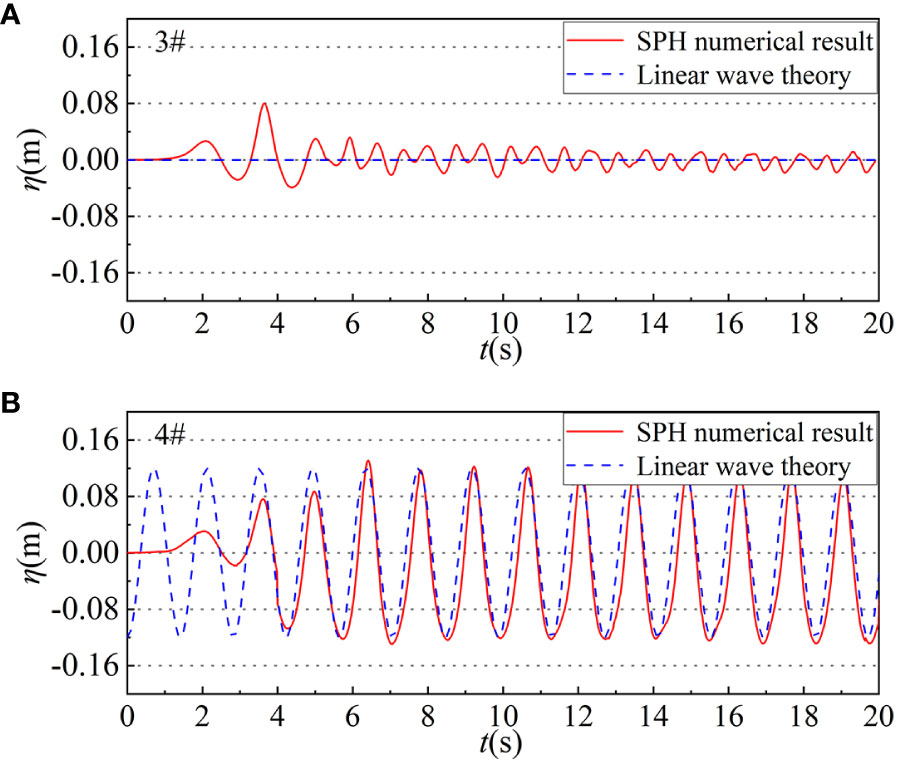
Figure 2 The time history series of wave surface at selected nodal point 3# (A) and abdominal point 4# (B) under wave conditions: d=0.4m, H=0.12m, T=1.4s. The red solid line is the SPH numerical result and the blue dashed line is the linear wave theory results.
2.3.3 The verification for wave pressure
Similarly, in order to verify the accuracy of the wave pressure in the numerical flume, based on the relationship between the wave pressure on the solid caisson and the wave number kd of the incident wave in the linear wave theories, the wave pressure of the perforated caisson in the fluid can be determined by the following equation:
Where p(x, z) represents the wave pressure at a certain point on the solid caisson, kPa; The intersection of the solid caisson and the bottom of the fluid is the intersection of z axis and x axis, and the z axis is positive upward; cos t is also a time factor.
The wave pressure of time history series along the height of solid caisson at different z coordinates. Figure 3 shows the results between SPH method and linear wave theories. For a more clear and intuitive comparison, the dimensionless comparisons of the wave pressure calculated by the SPH numerical method and the linear wave theoretical results under the two conditions are given in Figure 4.
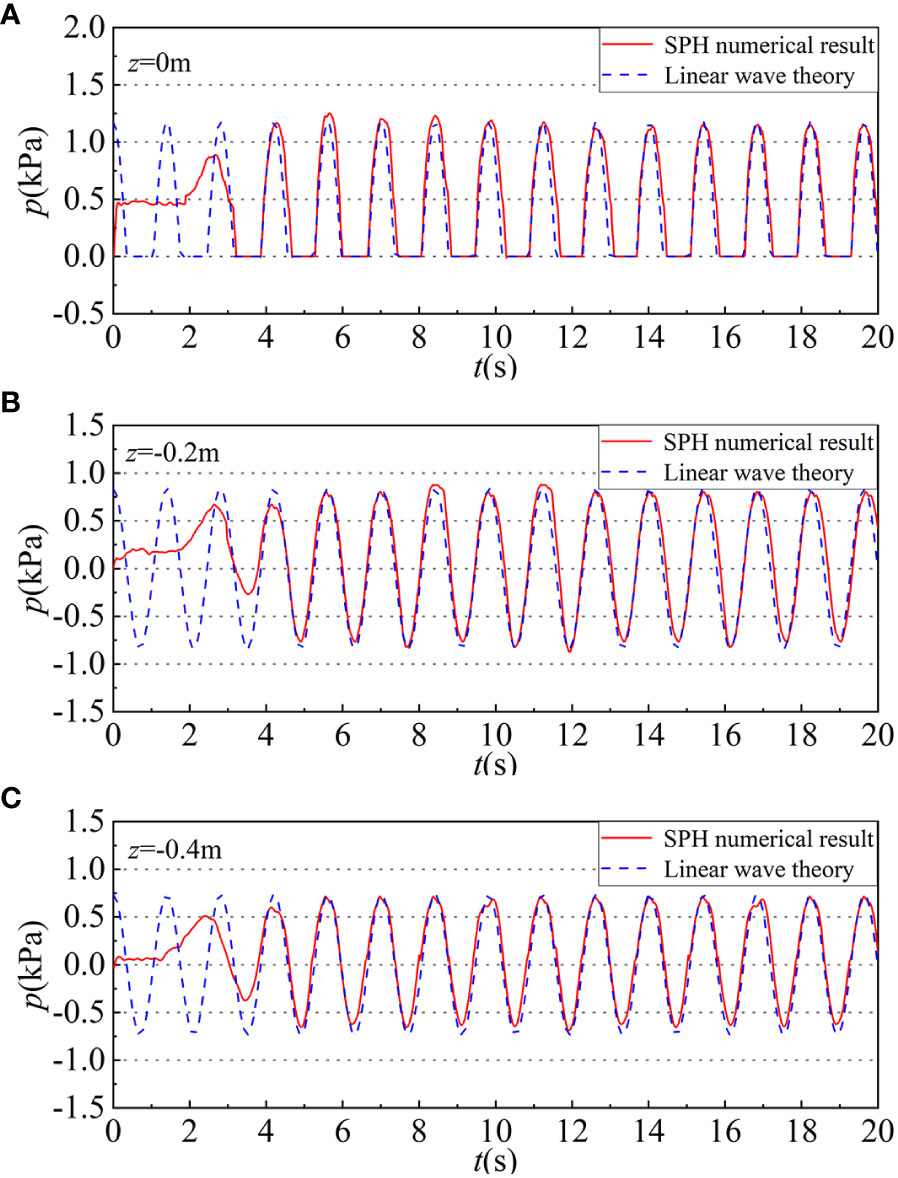
Figure 3 The wave pressure time history series along the height of solid caisson under wave conditions: d=0.4m, H=0.12m, T=1.4s. (A) z=0.4m (static water level), (B) z=0.2m (half of water depth), and (C) z=0m (flume bottom). The red solid line is the SPH numerical result and the blue dashed line is the linear wave theory results.
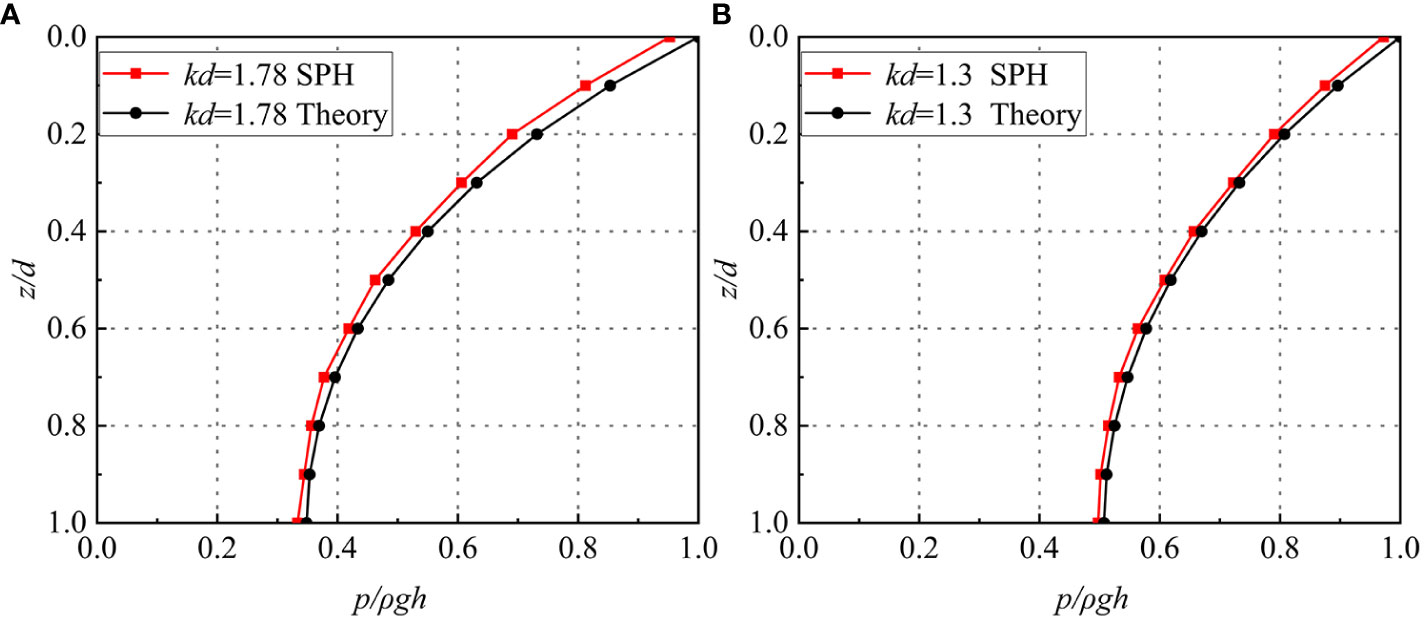
Figure 4 The wave pressure dimensionless comparison between SPH and theoretical value caisson under wave conditions: (A) d=0.4m, T=1.2s, H=0.12m; (B) d=0.6m, T=1s, H=0.1m. The red line-quadrate-line line is the SPH numerical result and the black line-circle-line line is the linear wave theory results.
2.3.4 The verification for perforated caisson
At the same time, based on the experimental data presented in the relevant literature with other authors (Chen et al., 2006; Zhao, 2023), Figure 5 shows the comparison between the numerical results obtained by the SPH method adopted in this paper and the experimental results under the same calculated wave conditions for verifying the applicability of SPH method to study perforated caisson structure. The comparison section includes the results of the wave surface in Figure 5A and the wave pressure distribution along the caisson height direction in Figure 5B.
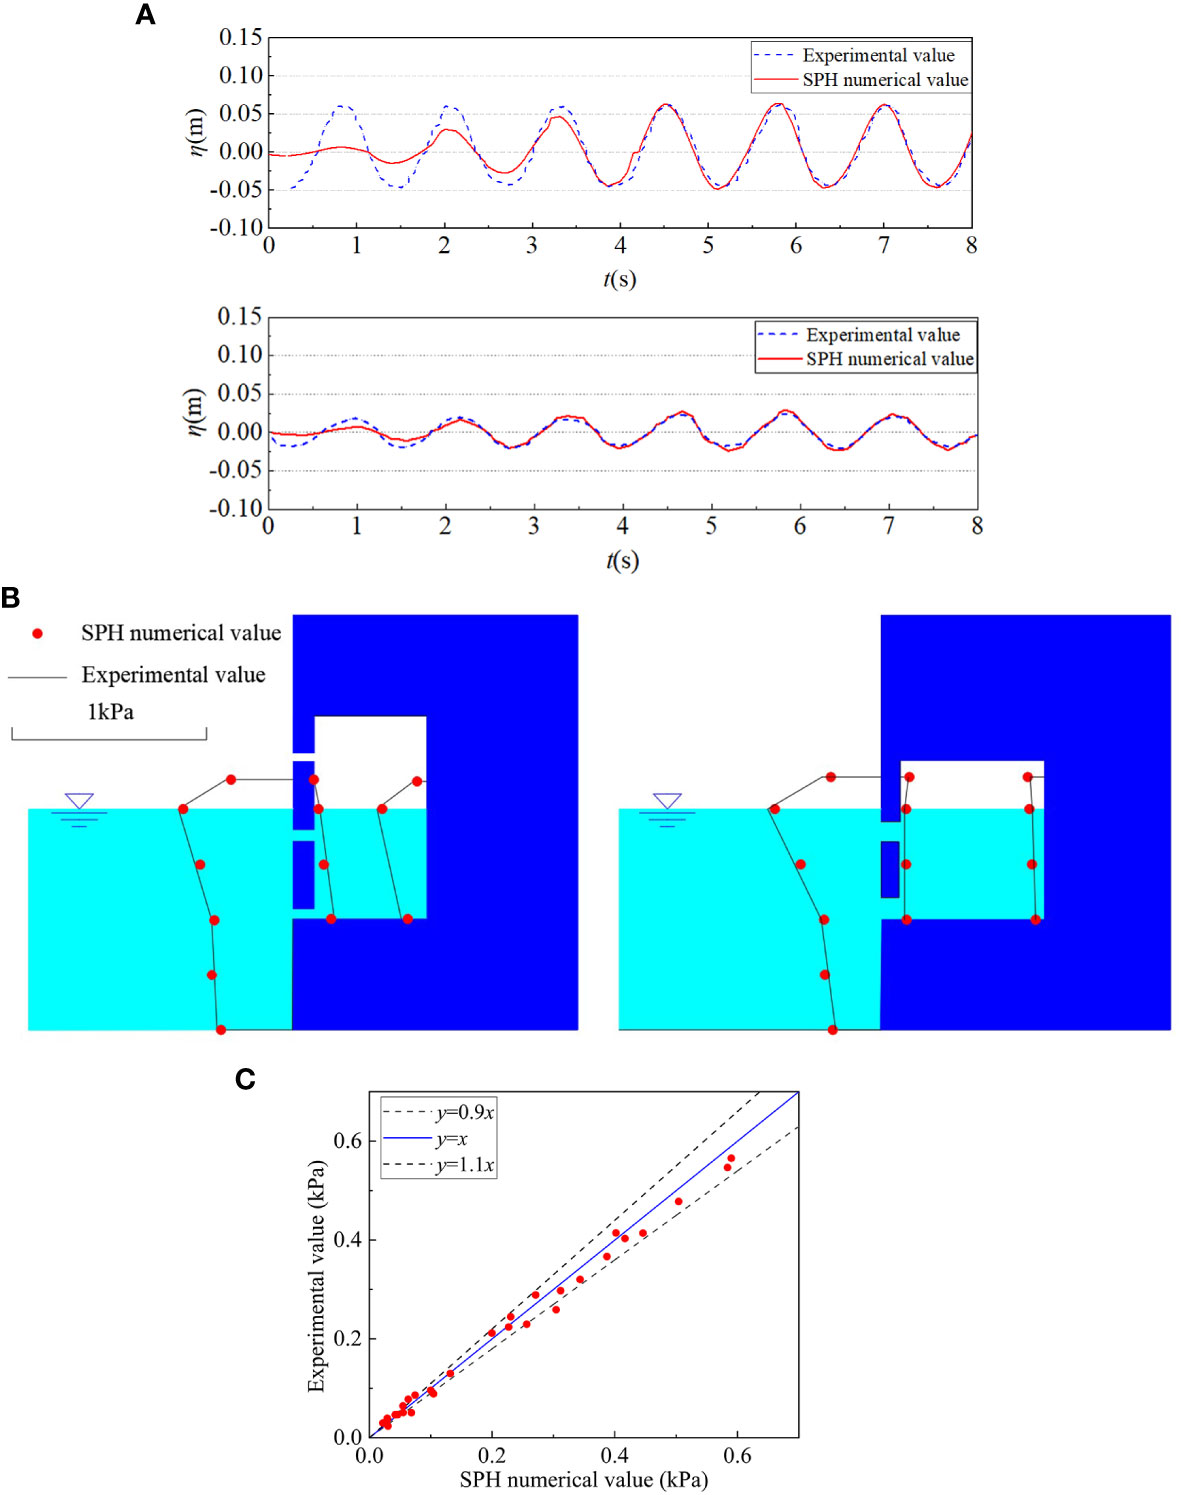
Figure 5 Verification and comparison of wave surface and wave pressure distribution for perforated caissons. (A) is the comparison of wave surface under wave conditions: H=0.1m, μ=0.2, B=0.15m, T=1.2s at two selected location. The blue line is experimental values and the red line is SPH numerical values. (B) is the comparison of wave pressure under two wave conditions (H=0.08m, μ=0.2, B=0.15m, T=1.2s; H=0.12m, μ=0.4, B=0.15m, T=1.4s. Red points are SPH numerical values, and black lines are experimental results; (C) is the comparison of wave pressure between SPH method and experiment solutions. All red points (SPH method values) are mostly distributed within the envelope.
3 Numerical simulation
3.1 Models and conditions
The numerical flume model employed in this study, which simulates the interaction between the regular waves and caissons, has dimensions of 6m in length, 1m in height, and water depths of 0.4m and 0.6m. (see Figure 6). On the right side, there is a double-chambered perforated caisson with a top cover, measuring 0.7m in height and available in various widths. The total width of the wave chamber is B (front wave chamber width is B1, back wave chamber width is B2), and the front plate and the back plate are two perforated plates. They have same perforated rate μ which is defined as the ratio of the total areas of the holes to the total areas of the perforated plates. The perforated ranges are from half of water depth to the top. Therefore, the perforated ranges coefficient q=d1/d=d2/d =0.5, where d1 and d2 are the water depth of the front and back wave dissipation chamber respectively. The back wall is a solid structure and there is a top cover on the top of the caissons. The top cover height s refers to the vertical measurement from the static water level to the top cover. The numerical model is shown in Figure 6, and the values of relevant calculation parameters are shown in Table 1.
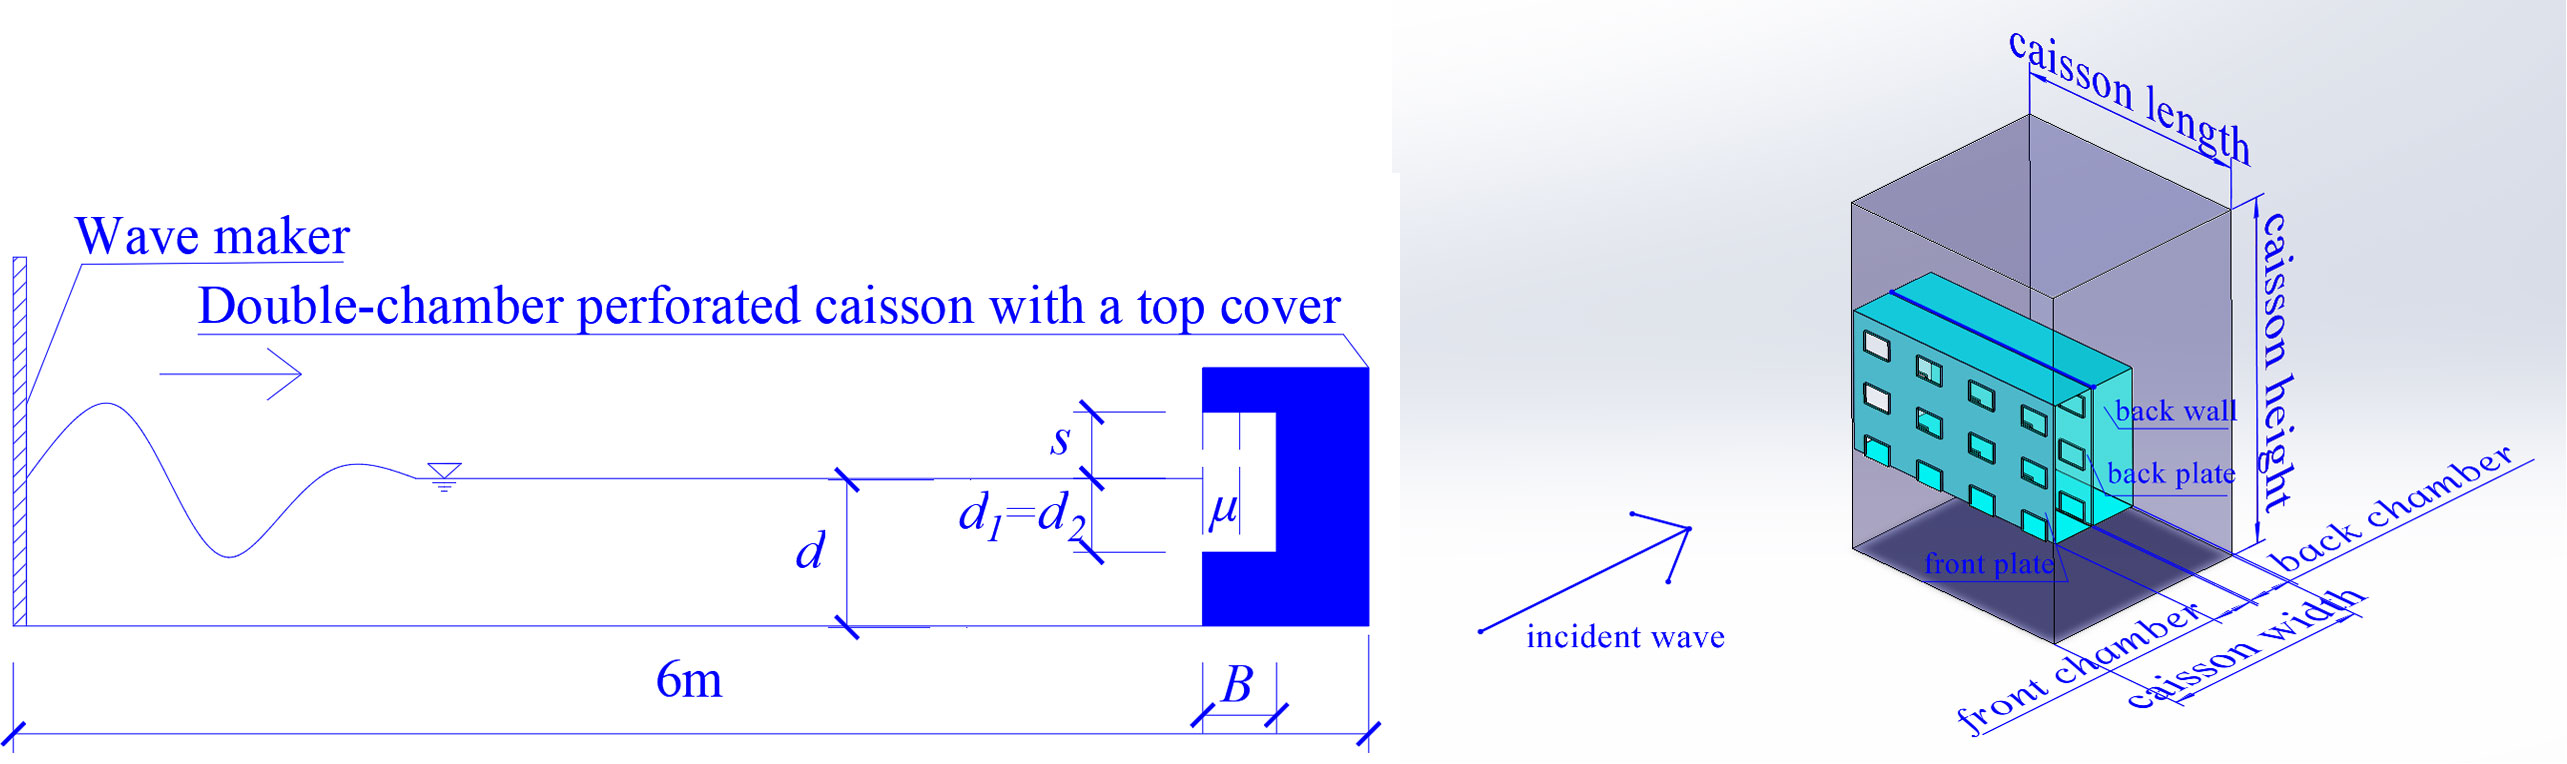
Figure 6 The model of the numerical flume and the 3D double-chambered perforated caisson with a top cover, which have front perforated plate, back perforated plate and back wall from the outside to inside.
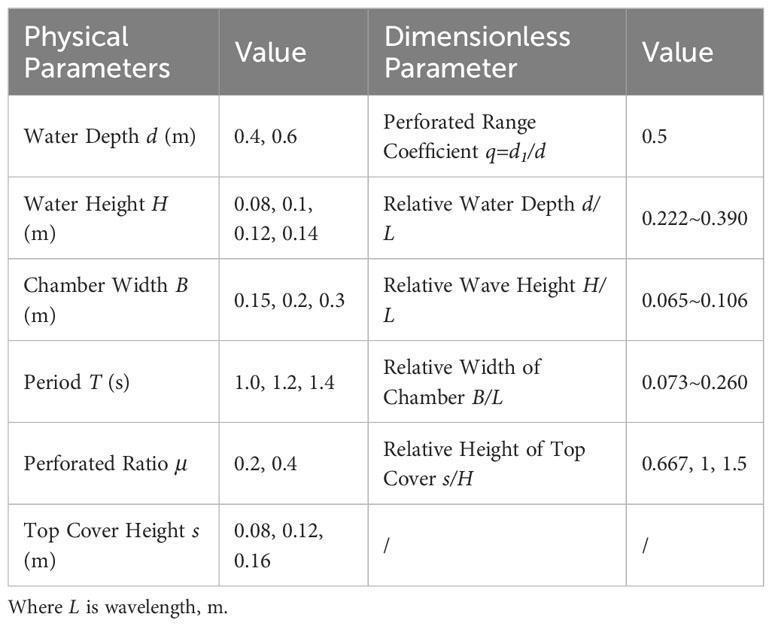
Table 1 Parameters of wave and perforated caisson.
3.2 Wave surface study
According to the research on single-chambered perforated caisson with a top cover (Chen et al., 2006), the total horizontal force on caissons and its main influencing factors can be expressed by the formula as:
where F2 is the total horizontal force on caissons with a top cover, kN; F1 is the total horizontal force on caissons without a top cover, kN. s/H, d/L, B/L, H/L, μ, q are the relative height of the top cover, the relative water depth, the relative dissipation chamber, the relative wave height, perforated rate, and perforated range coefficient respectively.
Similarly, in order to explore the double-chambered perforated caisson with a top cover, it can be investigated from these parameters: s/H, d/L, B/L, H/L, μ, q. However, taking into account the direct influencing factors, s, B, μ these factors directly affect the design of caisson structure. The modified and verified SPH method is employed to investigate the influence of these factors on the wave dissipation performance and pressure of the caisson, developing a series of numerical studies.
Firstly, the impact of top covers height s on wave dissipation effect may vary. Figure 7 illustrates the changes in wave surface duration at four different s under same incident wave parameters. The perforated rate μ is set to 0.2, incident wave period T is 1.4s, wave height H is 0.12m, water depth d is 0.4m, and the chamber width B is 0.2m. Additionally, for comparison purposes, the wave surface conditions at the same position under a solid caisson are also provided.
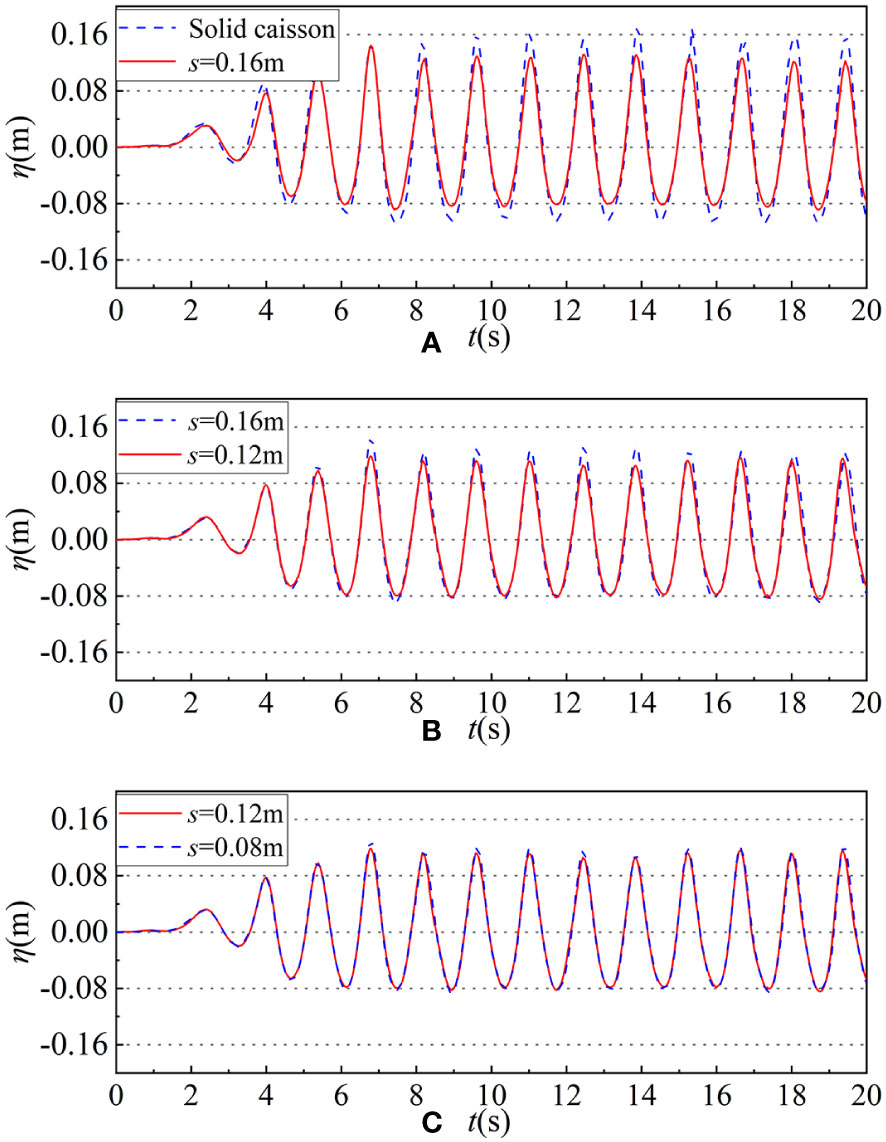
Figure 7 The time history series of wave surface under different s at selected position. (A) The time history series of wave surface of between solid caisson (blue dashed line) and perforated with top cover s=0.16m (red line). (B) The time history series of wave surface of between perforated with top cover s=0.16m (blue dashed line) and s=0.12m (red line); (C) The time history series of wave surface of between perforated with top cover s=0.12m (red line) and s=0.08m (blue dashed line).
The Figure 7 illustrates that the top cover height s of the double-chambered perforated caisson has a certain influence on the wave surface.
The chamber width B and the perforated rate μ may also affect the wave dissipation performance of the double-chambered perforated caisson with a top cover. The influence of different B and μ on the wave surface η is investigated in Figure 8 under the same wave conditions as the previous ones: μ=0.2, T=1.4s, H=0.12m, d=0.4m, s=0.12m.
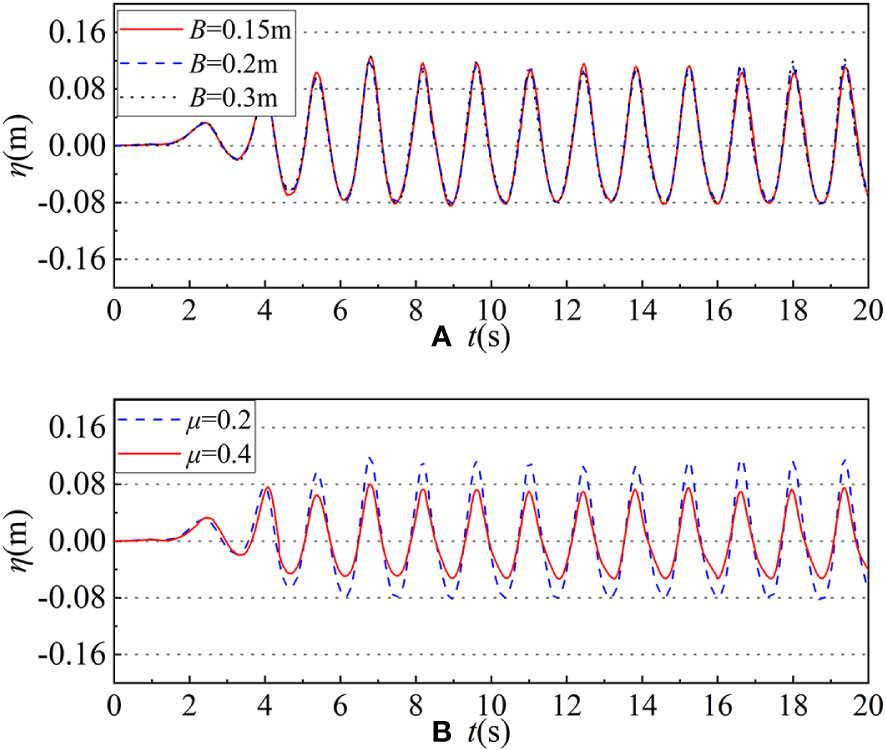
Figure 8 The time history series of wave surface under different B or μ at selected points. (A) The time history series of wave surface under B is 0.15m (red line), 0.2m (blue dashed line) and 0.3m (black dotted line); (B) The time history series of wave surface under μ is 0.2 (blue dashed line) and 0.4 (red line).
3.3 Wave pressure study
The wave acting on the perforated caisson will produce horizontal wave pressure p on the caisson, which will affect the caisson’s balance and stabilization. To investigate the influence of different caisson top cover heights s on horizontal wave pressure p, it conducted a comprehensive study on the horizontal wave pressure distribution along the vertical direction of the caisson for three specific values of s (s=0.08m, 0.12m, 0.16m). Referring to the relevant literature (Chen et al.,2005a; Chen et al., 2005b), the position of still water is the position where the wave pressure of the perforated caisson with a top cover is the largest, that is, the most unfavorable position. Figure 9A shows the schematic diagram of the wave pressure p at selected value points and Figure 9B-D show the wave pressure at each value point along the longitudinal caisson under different top cover heights s when the wave pressure at the most unfavorable position reach maximum (that is when p1 reach maximum). The Table 2 shows the corresponding position and the specific magnitude of the wave pressure at the value points (Figure 9).
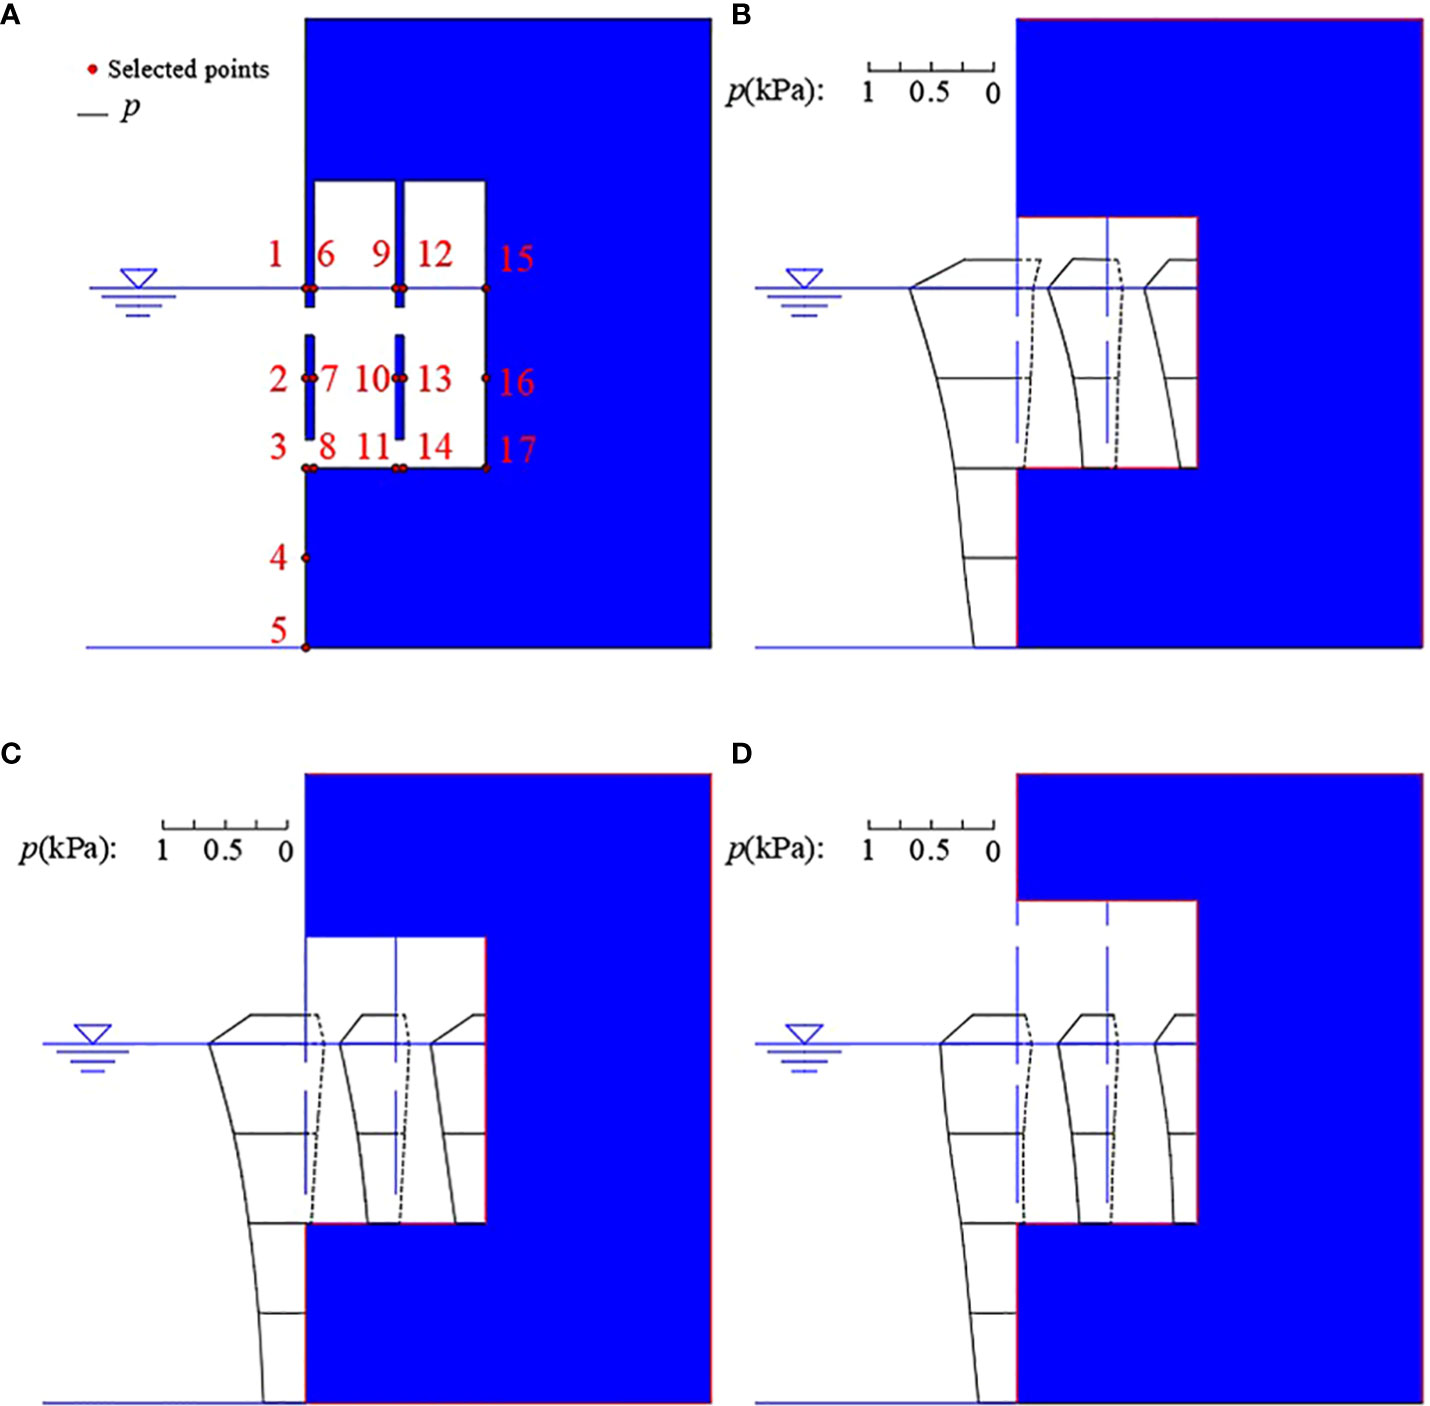
Figure 9 (A) is the wave pressure p value point location diagram. Along the height direction of the caisson, there are 17 value points on the front perforated plate, the back perforated plate and the back wall of the caisson. (B–D) is the wave pressure distribution of caissons with different top cover heights s. (B) s=0.08m; (C) s=0.12m; and (D) s=0.16m.
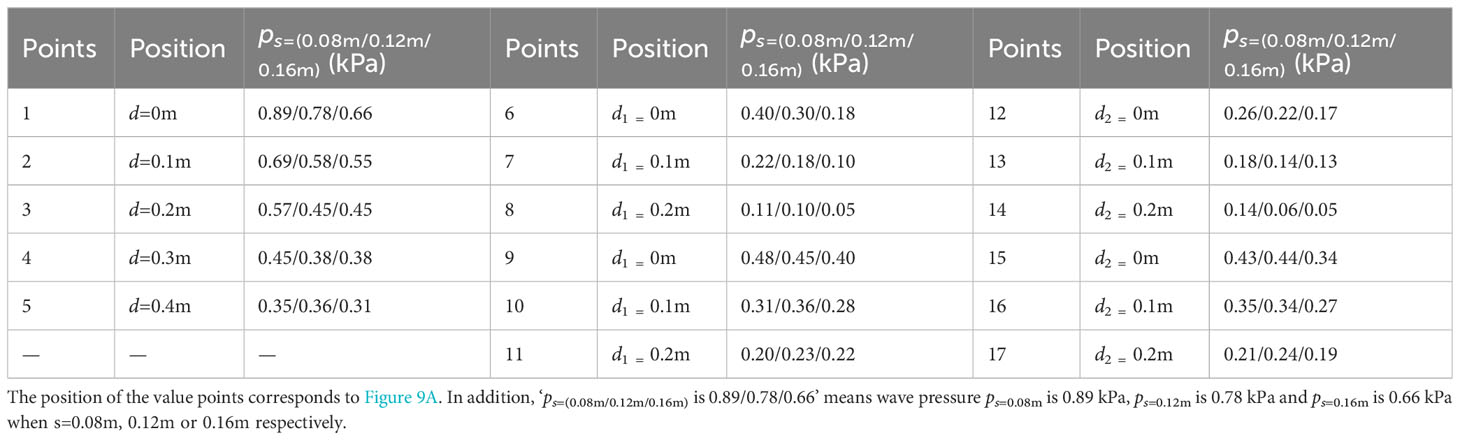
Table 2 Points’ wave pressure of caissons with different s.
Figure 10 shows the comparison of the time history series of wave pressure p on the front perforated plate, the back perforated plate and the back wall of the caisson at the still water position when s change from 0.08m to 0.16m.
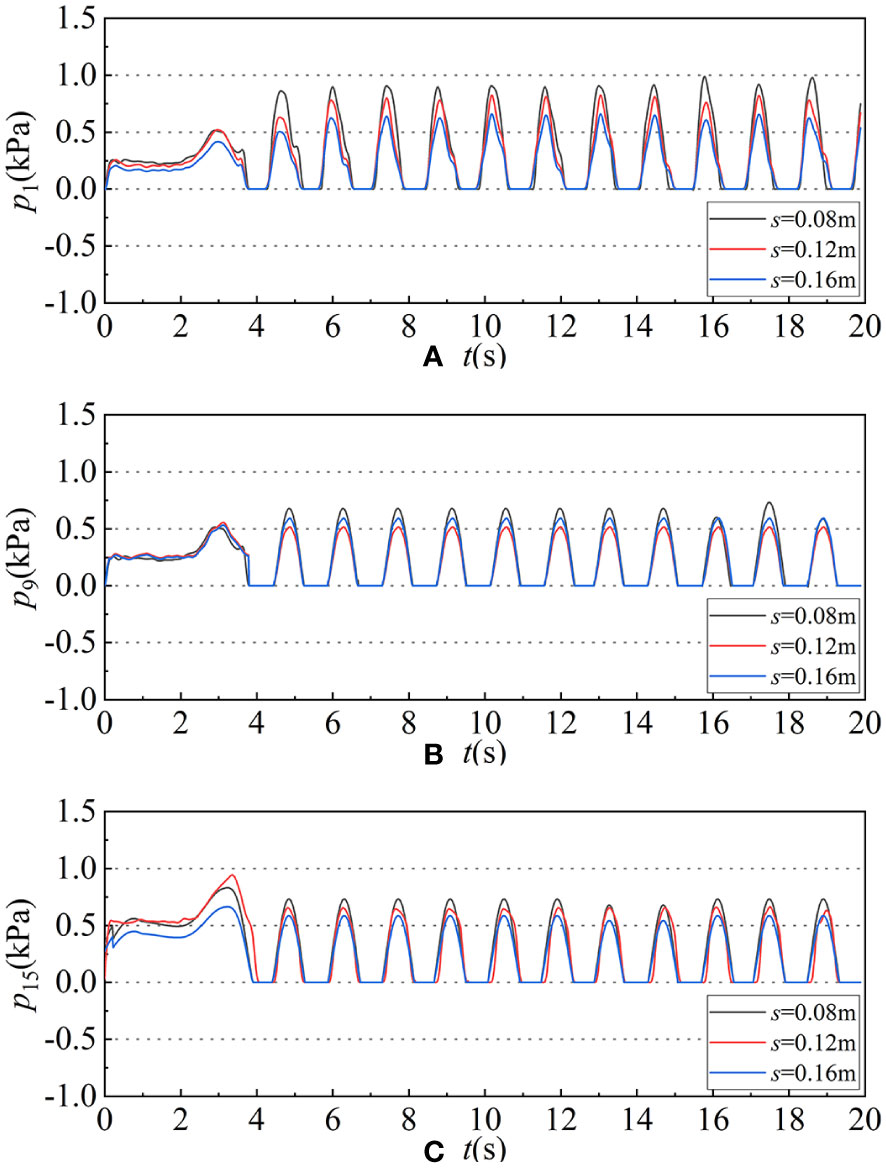
Figure 10 The time history series of wave pressure p at three different surface positions (the positions of the value points 1, 9 and 15 correspond to Figure 10) when change the top cover heights, which (A) wave pressure at front plate static water level p1 in different top cover heights, (B) wave pressure at back plate static water level p9 in different top cover heights and (C) wave pressure at back wall static water level p15 in different top cover heights. The black line, the red line and the blue line represent s=0.08m, 0.12m, 0.16m respectively.
3.4 The pressure field and the velocity field
The complex movement of water particles near the caisson and the collision with the caisson are the key factors that cause the complex changes of wave surface η and wave pressure p. In order to study the influence of the top cover height s and the perforated plate on the wave surface η and the wave pressure p of the caisson in the nearby water area, the motion state and complex changes of the water particles near the caisson were tracked. Figure 11 selected several representative time points to analyze the velocity field and pressure field of water particles.
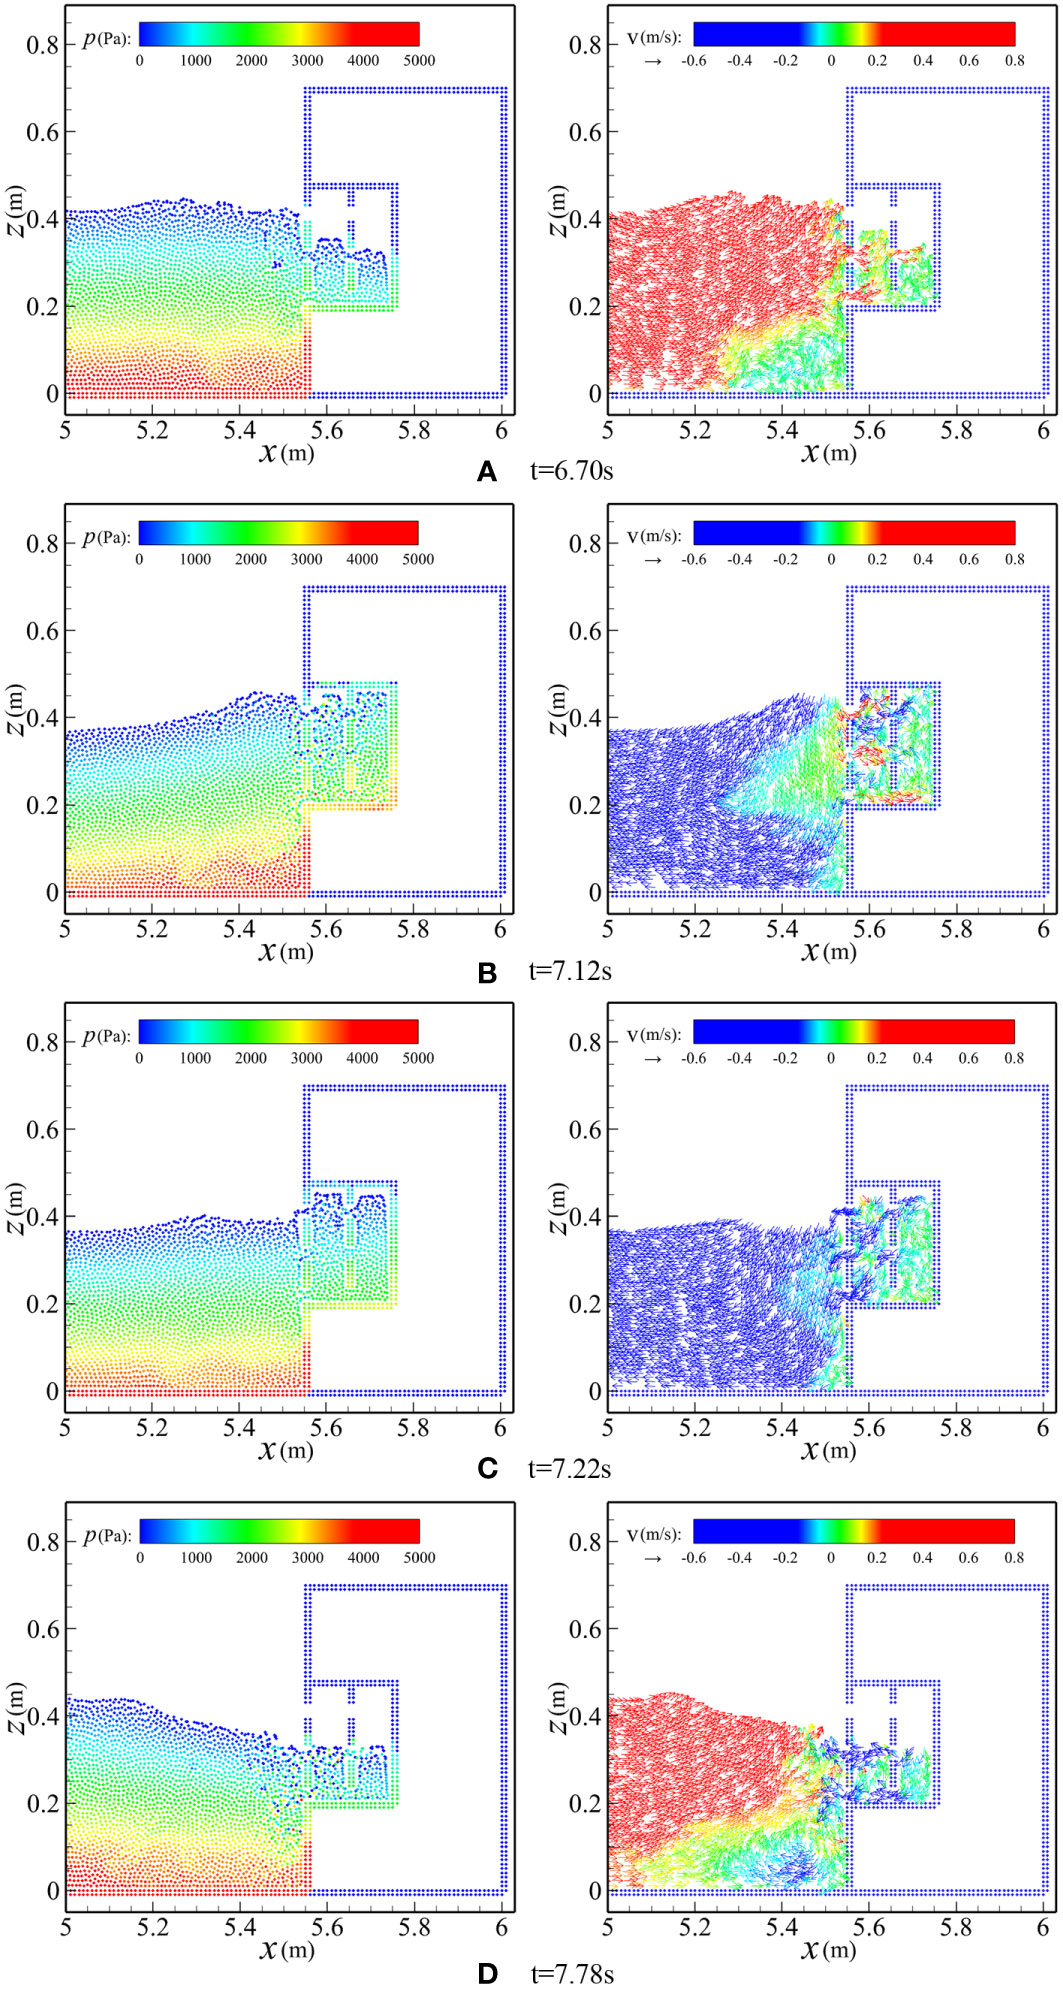
Figure 11 Water particle pressure and velocity field distribution near the wave dissipation chamber of perforated caisson (T=1.2s, H=0.14m, B=0.2m, d=0.4m). The figures on the left of (A–D) correspond to the pressure field of water particles at different selected times, while the figures on the right of (A–D) correspond to the instantaneous velocity of water particles at different selected times.
As shown in Figure 11A, when t=6.70s, the incident wave is transmitted to the caisson, the incident wave propagates towards the caisson, causing water particles outside the caisson flowing into the wave dissipation chamber. The wave surface changes from the outside to the inside as high to low, and the velocity of water particles is larger at the perforated position of the front perforated plate. However, in the back perforated plate, the water particle velocity in the middle of perforated position is obviously faster than that in the lower perforated position. Figure 11B, when t=7.12s, only a small range of water particles near the caisson still move to the right, most of the water particles have been reflected to the left, and the water particles still flow inward at the perforated position of the front perforated plate. Meanwhile, the wave surface in the wave dissipation chamber is raised, and the back chamber is filled with water particles. Water particles moving to the left after reflection have appeared near the perforated position in the middle and upper part. These water particles interact with the water particles moving to the right in the front wave chamber, which makes the velocity and pressure changes of water particles in the front wave dissipation chamber more complicated. Figure 11C, when t=7.22s, water particles in the front and back wave dissipation chambers flow outward and fill the front chambers, the pressure on the caisson is smaller than the previous moment, and the overall water particles are moving to the left. At the same time, the wave surface in the chamber is higher than the static water level and the wave surface outside the caisson. Figure 11D, when t=7.78s, the wave surface in the wave dissipation chamber decreases significantly, but some water particles still move to the left at the perforated position. These outgoing water particles will have an intense interaction with the water particles brought by the incident wave in front of the caisson, which will further play a certain wave dissipation effect.
4 Results
4.1 Method verification results
It can be clearly seen in Figure 2 that the wave surface η at the nodes (point 3#) almost fluctuates around x=0 in a small amplitude after 6s. The amplitude A of the wave surface at the antinodes (point 4#) stabilizes about 0.23m (the theoretical value is 0.24m, which maximum relative error is 4.17%) after 6s, which is approximately twice the incident wave height H. The numerical results fit well with the theoretical results, so the modified SPH method used in this paper can simulate the change of the wave surface in the numerical flume of wave and caisson interaction accurately.
Meanwhile, the results depicted in Figure 3 demonstrate that when the H is 0.12m, d is 0.4m, and T is 1.4s, the wave pressure at the static water surface is approximately 1.13kPa (theoretical value is 1.18kPa) with SPH method. At half of water depth, the wave pressure amounts to around 0.82kPa (theoretical value is 0.84kPa). At bottom of fluid, wave pressure reaches about 0.72kPa (theoretical value is 0.73kPa). The maximum relative error of the whole wave pressure is merely 4.42%. The wave pressure calculated by SPH numerical method is close to the linear wave theoretical solution. The maximum wave pressure’s position is at the static water surface and the minimum’s is at the bottom of the fluid which fits the reality. Through the non-dimensional comparisons in Figure 4, it can be also found that the wave pressure distribution on the solid caisson is relatively uniform. On the whole, the wave pressure value obtained by the SPH method is more accurate and can be used to simulate the interaction between the wave and the caisson structure.
Figures 5A–C show the comparison of the wave surface η and wave pressure p obtained by the SPH method with the experimental results from other author for perforated caissons. From comparison, it can be inferred that the all results are similar and agree well in most places. Most points are within the envelope of y=(1 ± 10%)x in Figure 5D as well. After calculation, the root mean square error between the calculated value and the experimental value is 0.0268, and the correlation coefficient is 0.96, which presented that the SPH numerical solution is in good agreement with the experimental results. To sum up, the accuracy of the modified SPH method is validated through comparisons with experimental data across multiple numerical examples. The modified SPH method enables numerical simulation of caisson’s wave pressure distribution and the variation of wave surface in numerical flume.
4.2 Analysis results of influencing factors of wave surface
In Figure 7A, when the height of the top cover is 0.16m, there is a greater reduction in wave surface fluctuation from 0.16m to 0.12m, which has a 25% decrease compared with solid caisson, indicating that under the calculated conditions, the wave dissipation effect of the double-chambered perforated caisson is obvious. In Figure 7B, when the height of the top cover is reduced to 0.12m, the wave surface fluctuation amplitude continues to decrease from 0.12m to 0.10m, which has a 16.7% decline; However, as shown in Figure 7C, when the top cover height continues to decrease to 0.08 m, the wave surface rises slightly from 0.10m to 0.11m, which only has a 9% increase representing that the wave dissipation effect of the caisson decreases. In summary, with a reduction of the same magnitude of the s from 0.16m to 0.08m, the wave dissipation performance of the double-chambered perforated caissons with a top cover do not always decrease, but show a trend of first rapid growth and then slow decline, exhibiting nonlinear characteristics.
It can be seen from Figure 8 that under the calculated wave conditions, the wave surface is around 0.10m (with less than 3% fluctuation) in the three different chamber widths, which indicate that the chamber width B has a little influence on the wave surface. While the perforated rate μ is one of the main factors affecting the change of the wave surface. When the perforated rate μ is 0.4, the caissons have a better obvious wave dissipation performance than the perforated rate μ is 0.2 (The wave surface decreases from 0.11m to 0.07m, which has 36% decrement).
In general, under the wave conditions in this paper, with the top cover height s gradually decreases, the wave dissipation performance of the double-chambered caisson with a top cover initially increases and then decreases. The wave dissipation performance is the best when s=0.12m. Under the same simulation conditions, the wave dissipation performance of 0.4 perforated ratio is obviously better than that of 0.2 perforated ratio. At the same time, it can be found that the width of the wave dissipation chamber has very little influence on the wave suppression performance.
4.3 Analysis results of influencing factors of wave pressure
From the Figures 10A, C, it can be seen that p1, s=0.08m>p1, s=0.12m>p1, s=0.16m and p15, s=0.08m>p15, s=0.12m>p15, s=0.16m which indicate that with the increase of the top cover height s, the wave pressure p on the front plate and back wall at the still water position both gradually decreases; However, in Figure 10B, p9, s=0.08m>p9, s=0.16m>p9, s=0.12m, that is, with the increase of the top cover height s, the wave pressure p on the back plate at the static water position presents decreases first and then increases and when the s=0.12m, the wave pressure p at the static water level is the smallest in the calculative condition.
Comparing between Table 2, Figures 9, 10, it can be inferred that when wave pressure p1 of the front plate at the static water position reaches the maximum, the wave pressure p9 on the back plate and p15 on the back wall at the static water position have not reached their maximum. There is a certain phase difference between front plate, back plate and back wall when they reach peak wave pressure. With the increase of the top cover height s, the horizontal wave pressure on the value point of the double-chambered perforated caisson with a top cover generally increases. The wave pressure p of behind the perforated plate is smaller than full-face. At the same time, the wave pressure p generally shows a gradually decreasing trend at the same horizontal position from full-face to inside the caisson.
On the whole, through comparison and analysis, there are some general conclusions: with the increase of the top cover heights s, the wave pressure p on the front plate and the back wall gradually decreases at the static water surface, but the wave pressure p on the back plate decreases first and then increases. When s=0.12m, the wave pressure p on the back plate at the static water level is the least. With the increase of the s, the horizontal wave pressure p on the caisson value point tends to increase in general, and the p on the back of the perforated plate is less than that on the front.
4.4 Analysis results of water particle velocity
The motion process of water particles inside and outside the caisson is much more complicated. However, the motion state of water particles is an important factor affecting the wave surface η and wave pressure p. The modified SPH method in this paper can be used to analyze the velocity of water particles in the numerical flume. Figures 12, 13 shows the horizontal and vertical velocity distributions of water particles from the middle of the bottom of the front and back wave dissipation chamber to the top cover respectively.
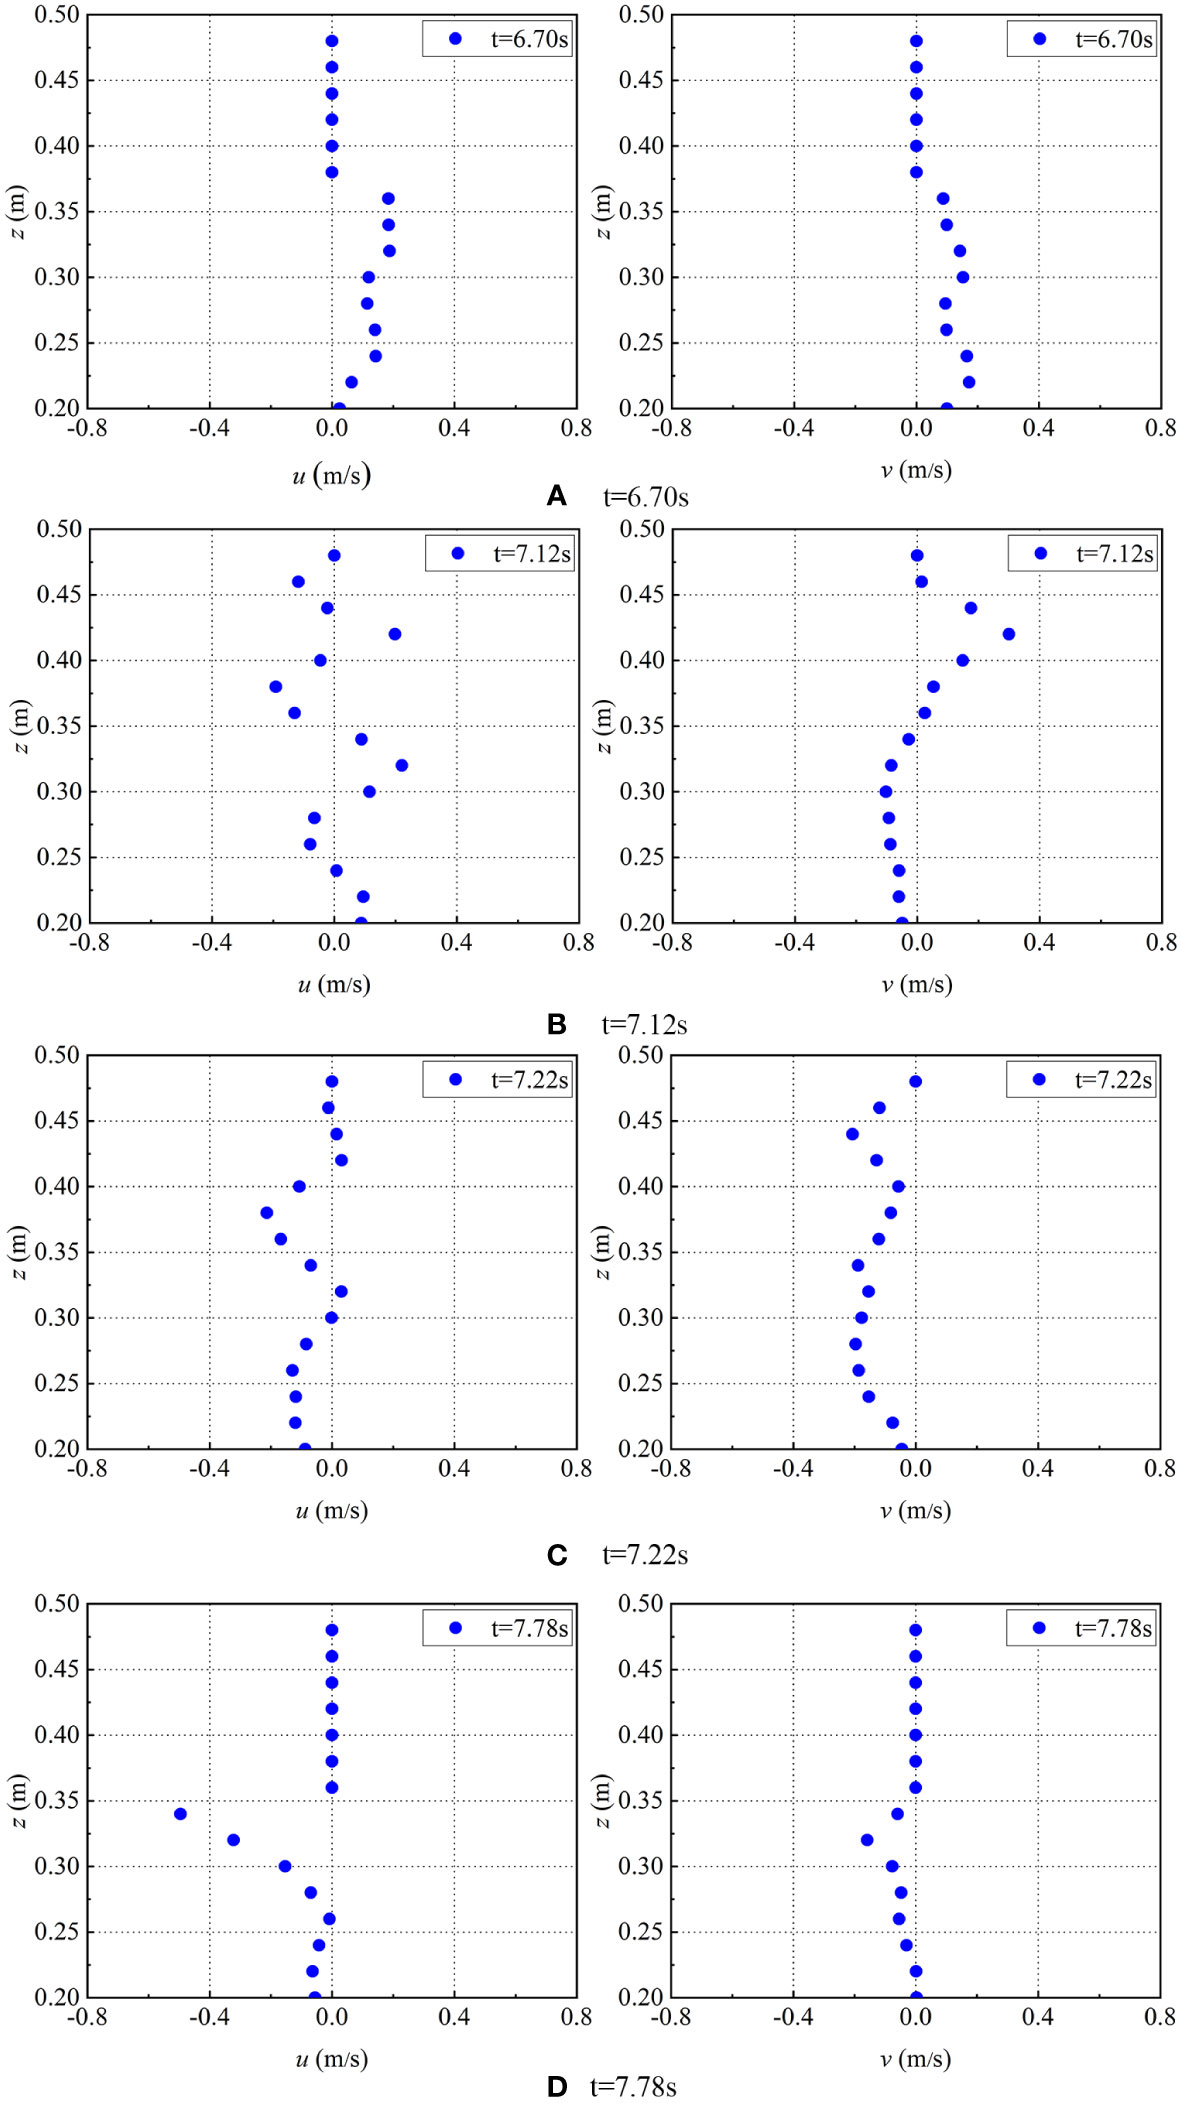
Figure 12 The horizontal and vertical velocities distribution in the middle and vertical section of front wave dissipation chamber (T=1.2s, H=0.14m, B=0.2m, d=0.4m). The figures on the left of (A–D) correspond to the horizontal velocities μ of water particles at selected times in front chamber, while the figures on the right of (A–D) correspond to the vertical velocities v of water particles at selected times in front chamber.
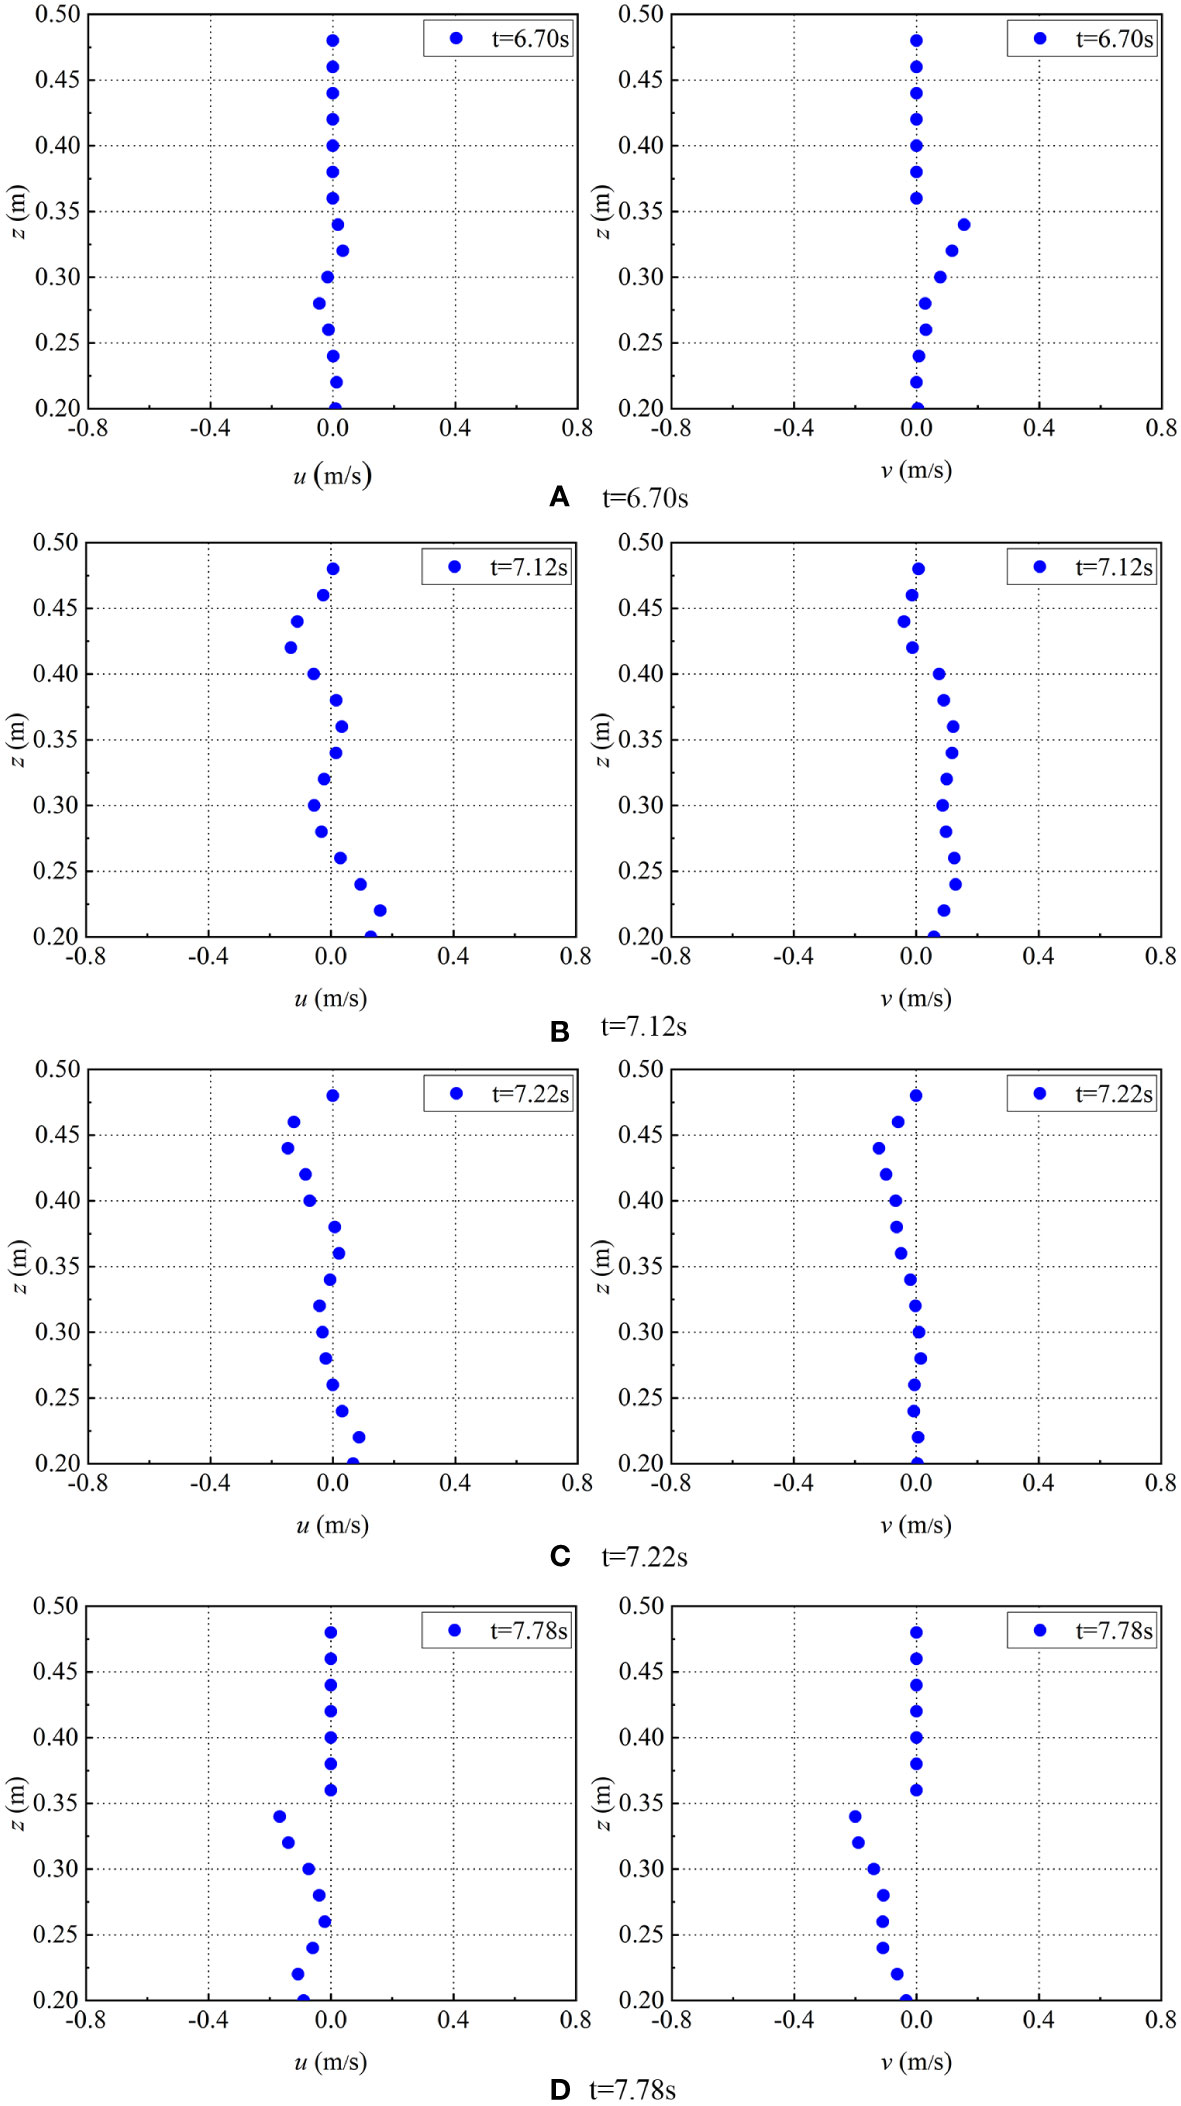
Figure 13 The horizontal and vertical velocities distribution in the middle and vertical section of back wave dissipation chamber (T=1.2s, H=0.14m, B=0.2m, d=0.4m). The figures on the left of (A–D) correspond to the horizontal velocities μ of water particles at selected times in back chamber, while the figures on the right of (A–D) correspond to the vertical velocities v of water particles at selected times in back chamber.
As can be seen from Figure 12, due to the influence of the perforated plate, the velocity changes of water particles in the middle vertical section of the wave dissipation chamber are non-linear at different times. Figure 12A, when t=6.70s, the horizontal velocity and vertical velocity of water particles vary significantly at the parallel horizontal position of the perforated hole. The horizontal velocity u reaches its maximum value at z=0.22m (that is, at the lower perforated position) which is 0.17m/s; the vertical velocity v reaches its maximum value near the wave surface, which is 0.18m/s. Figure 12B, when t=7.12s, the law of speed change is evidently apparent at this moment, and the velocity change is transiently continuous. At the parallel position of the perforated hole, the horizontal velocity u of water particles is positive, while at the non-perforated position, it is negative. The vertical velocity v changes from negative to positive from bottom to top and the vertical velocity v reaches its maximum 0.3m/s; Figure 12C, when t=7.22s, the velocity of water particles is large both at the parallel and upper small range position of the perforated hole. The both horizontal and vertical velocity is negative, showing a trend of increasing-decreasing-increasing-decreasing changing, but they change at different positions of z. Figure 12D, when t=7.78s, the velocity of water particles near the position of the wave surface is large and negative, and the velocity of water particles near the horizontal position of the bottom hole is small.
Figure 13 shows that the velocity of water particles in back dissipation chamber is still affected by the perforated plate. Figure 13A, when t=6.70s, the horizontal velocity of water particles gradually increases along the direction of caisson height and reaches the maximum at the position of the wave surface, the u=0.15m/s. The vertical velocity of water particles changes little, which is basically 0m/s. Figure 13B, when t=7.12s, the change of water particles at the perforated position is obvious, and the horizontal velocity of water particles at the lower perforated position is positive, while the horizontal velocity at the middle and upper perforated position is negative, and the horizontal velocity is larger at the upper and lower positions than other positions. The vertical velocity of water particles increases slightly at the perforated position and is mostly positive. Figure 13C, when t=7.22s, the horizontal velocity variation rule of water particles is the same as that of the previous time, but the relative magnitude of the velocity is smaller. The vertical velocity is basically 0m/s below z=0.3m, and gradually increases and then decreases above z=0.3m, both of which are negative, and the maximum vertical velocity is 0.67m/s. Figure 13D, when t=7.78s, the horizontal velocity and vertical velocity of water particles are always negative, but the horizontal velocity changes greatly at the perforated position, and the velocity increases along the direction of caisson height.
In combination with Figures 11, 12, 13, it is not difficult to find that the modified SPH method can be used to accurately track the motion state of water particles and the distribution of wave pressure. For a caisson with a roof hole in a double wave dissipation chamber, the hole plate has a great influence on the motion state of water particles. In summary, the influence of the front wave dissipation chamber is greater than that of the rear wave dissipation chamber. The velocity of water particles in the parallel position of the lower hole is smaller than that in the middle and upper hole, and the vertical velocity is smaller than that in the horizontal velocity.
5 Discussion
The modified SPH method is employed in this paper to investigate the interaction between waves and double-chambered perforated caissons with a top cover. By varying influential factors such as relative wave height, relative water depth, relative wave chamber width, and top cover height, a comprehensive analysis of the wave surface and wave pressure is conducted. Additionally, the interrelationships among these factors are determined. This research not only bridges the gap in knowledge regarding double-chambered perforated caissons but also introduces a novel numerical approach for studying caissons.
By comparison with experiment and theory, it can be found that the modified SPH method adopted in this paper can not only be used to study the interaction between waves and the double-chambered perforated caissons with a top cover but also can be used in the single-chamber perforated caissons with/without a top cover, solid caisson and many other rectangular box-type structures like a novel perforated-wall caisson concept, the LOWREB (Ciocan et al., 2017). The numerical method can be adapted to various structures only by adjusting some of the influencing parameters, which has a wide range of application. However, the numerical model presented in this paper is limited to two-dimensional space and may not be suitable for three-dimensional models with intricate geometries. In future, it would be beneficial to optimize the model for application in three-dimensional space.
According to research of Twu and Lin (1991); Zhu (2013) and Zhang et al. (2022) in the double-chambered perforated caissons without a top cover, they find the number, spacing and perforated rate of perforated plate are the main factors that affect the wave dissipation performance. For the double-chambered perforated caissons with a top cover in this paper, as presented in Figure 7, perforated rate of perforated plate is one of the main factors that affect the wave dissipation performance, but there is no discernible effect on dissipation performance for spacing of perforated plate (the chamber width B). In addition, the top cover heights s has a certain effect on the wave surface as showing in Figure 6. Besides, Zhao (2023) and Lee et al. (2023) also found that if the perforated rate of the perforated plate of the multi-chamber perforated caisson without a top cover decreases along the direction of the incident wave, the wave dissipation effect will be better. Therefore, it is worth and necessary to conduct further research and analysis on its performance on the double-chamber perforated caisson with a top cover.
Compared with the single-chambered perforated caissons with a top cover, due to the influence of two perforated plates, the movement of waves inside and outside the two wave chambers is more complicated and fuller of uncertainty. However, there are still some characteristics show similar to the single-chambered perforated caissons with a top cover in some aspects. The most unfavorable pressure position of the front perforated plate and the back solid wall of the single-chambered perforated caisson is near the static water level (Chen et al.,2005a). Similarly, the most unfavorable positions of the perforated plate and the back wall of the double-chambered perforated caissons are also located near the static water level. The difference is that with the change of the cop cover heights, the pressure of the front plate and the backplate at the static water level is different, and the changes of pressure of the back plate show more complicated which was also studied and analyzed by Oh et al. (2015). In addition, the force on the back plate and the back wall always lags behind the peak value compared to the front plate.
As shown in Figures 11–13, the SPH numerical method employed in the paper can be applied to explore the state of water particles at different times by tracking the velocity field and pressure field of water particles. From the origin analysis, both the wave dissipation and mechanical properties of caisson can be demonstrated by the state of water particles. Therefore, the method proposed in this paper can be used to further explain and describe the complex interaction between waves and caisson, which can play a certain role in promoting the research. This part of content and method can provide a new idea for the subsequent research work.
At the same time, in the process of numerical simulation, it had an unexpectedly find that the relative position of the static water surface and the open hole will affect the water particles entering or leaving the wave dissipation chamber, and then affect the performance of the wave dissipation of the caisson. Sun et al. (2019) found that the degree of inundation of the wave facing the perforated area will affect the wave force inside the perforated caisson. Thus, it can be speculated that this factor will also have a certain impact on the caisson, which is worth making further research.
Data availability statement
The raw data supporting the conclusions of this article will be made available by the authors, without undue reservation.
Author contributions
XT: data curation, formal analysis, investigation, methodology, software, writing – original draft, writing – review & editing. HL: data curation, formal analysis, investigation, methodology, writing – original draft, writing – review & editing. LM: funding acquisition, project administration, resources, writing – review & editing. PF: conceptualization, investigation, writing – review & editing. ds: conceptualization, investigation, writing – review & editing. HC: funding acquisition, investigation, resources, writing – review & editing.
Funding
The author(s) declare financial support was received for the research, authorship, and/or publication of this article. Funding for this study was provided by the National Natural Science Foundation of China (NSFC): 42376205.
Conflict of interest
The authors declare that the research was conducted in the absence of any commercial or financial relationships that could be construed as a potential conflict of interest.
Publisher’s note
All claims expressed in this article are solely those of the authors and do not necessarily represent those of their affiliated organizations, or those of the publisher, the editors and the reviewers. Any product that may be evaluated in this article, or claim that may be made by its manufacturer, is not guaranteed or endorsed by the publisher.
References
Ali G., Rouhollah A., Ulrich R., Ahmad R. (2023). Numerical modeling investigation of perforated geometry of caisson breakwater under irregular waves by considering porous media. Ocean Engineer. 269, 113558. doi: 10.1016/j.oceaneng.2022.113558
Aristodemo F., Meringolo D. D., Groenenboom P., Schiavo A. L., Veltri P., Veltri M. (2015). Assessment of Dynamic Pressures at Vertical and Perforated Breakwaters through Diffusive SPH Schemes. Math. Prob. Engineer. 2015, 1–10. doi: 10.1155/2015/305028
Chen X., Li Y., Liu Y., Jiang J., Ma B. (2005a). Study of regular wave forces on component of perforated caissons with top cover. China Offshore Platform. 03, 1–10. doi: 10.3969/j.issn.1001-4500.2005.03.001
Chen X., Li Y., Ma B., Jiang J., Lu G. (2005b). Calculating method of irregular wave pressures on components of perforated caissons with top cover. China Offshore Platform. 04, 1–9. doi: 10.3969/j.issn.1001-4500.2005.04.001
Chen X., Li Y., Teng B. (2006). Numerical calculation on the wave forces acting on perforated caisson with top cover. Haiyang Xuebao. 03, 133–138. doi: 10.3321/j.issn:0253-4193.2006.03.016
Chen X., Li Y., Teng B. (2007). Numerical and simplified methods for the calculation of the total horizontal wave force on a perforated caisson with a top cover. Coast. Engineer. 54 (1), 67–75. doi: 10.1016/j.coastaleng.2006.08.002
Ciocan C., Taveira-Pinto F., Neves D., Rosa-Santos P. (2017). Experimental study of the hydraulic efficiency of a novel perforated-wall caisson concept, the LOWREB. Coast. Eng 126, 69–80. doi: 10.1016/j.coastaleng.2017.06.001
Colagrossi A., Landrini M. (2003). Numerical simulation of interfacial flows by smoothed particle hydrodynamics. J. Comput. Phys. 191 (2), 448–475. doi: 10.1016/S0021-9991(03)00324-3
Gao J., Bi W., Zhang J., Zang J. (2023). Numerical investigations on harbor oscillations induced by falling objects. China Ocean Engineer. 37 (3), 458–470. doi: 10.1007/s13344-023-0038-y
Gao J., Jing L., Wang J., Zhang J., Liu Q., Zang J., et al. (2022). Study on transient gap resonance with consideration of the motion of floating body. China Ocean Engineer. 36 (6), 994–1006. doi: 10.1007/s13344-022-0087-7
Gingold R., Monaghan J. (2003). Smoothed particle hydrodynamics: theory and application to non-spherical stars. Month. Notices R. Astronom. Society. 181 (3), 375–389. doi: 10.1093/mnras/181.3.375
Huang Z., Li Y., Liu Y. (2011). Hydraulic performance and wave loadings of perforated/slotted coastal structures: a review. Ocean Engineer. 38 (10), 1031–1053. doi: 10.1016/j.oceaneng.2011.03.002
Lee B., Baek D., Ha T., Lee K., Yoon J. (2023). Experimental study on hydrodynamic performance of partially perforated-wall caisson breakwaters designed for the southeast coast of Korea. J. Coast. Res. 39 (1), 167–174.
Li Y., Chen X., Liu Y., Ma B., jiang J. (2004). The calculation for the horizontal wave forces and their overturning moment on perforated caissons with top cover. China Offshore Platform. 19 (6), 65. doi: 10.3969/j.issn.1001-4500.2004.06.001
Li Y., Chen X., Sun D., Liu Y. (2005). The calculation of horizontal wave forces on perforated caissons with top cover. China Offshore Platform. 01), 3–8. doi: 10.3969/j.issn.1001-4500.2005.01.001
Liu X., Liu Y., Lin Z., Zhao Y. (2021). Numerical simulation of wave absorbing by multi-chamber perforated caissons. Period. Ocean Univ. China. 51 (06), 116–124. doi: 10.16441/j.cnki.hdxb.20190205
Messahel R., Zisis I. (2020). “Conclusion: smoothed particle hydrodynamics modeling of shocks,” in Multiphysics: Advances and Applications. Multiphysics Modelling of Fluid-Particulate Systems (Cambridge, Massachusetts, United States: Academic Press), 293–315. doi: 10.1016/B978-0-12-818345-8.00013-5
Mohammadreza A., Erfan A., Reza A., Reza M. (2023). Contribution of coastal structures to wave force attenuation: A numerical investigation of fluid-structure interaction for partially perforated caissons. Ocean Engineer. 280, 114745. doi: 10.1016/j.oceaneng.2023.114745
Molteni D., Colagrossi A. (2009). A simple procedure to improve the pressure evaluation in hydrodynamic context using the SPH. Comput. Phys. Commun. 180 (6), 861–872. doi: 10.1016/j.cpc.2008.12.004
Monaghan J. (1985). Particle methods for hydrodynamics. Comput. Phys. Rep. 3 (2), 71–124. doi: 10.1016/0167-7977(85)90010-3
Monaghan J. (1994). Simulating free surface flows with SPH. J. Comput. Phys. 110 (2), 399–406. doi: 10.1006/jcph.1994.1034
Monaghan J. (2005). Smoothed particle hydrodynamics. Rep. Prog. Phys 68 (8), 1703. doi: 10.1088/0034-4885/68/8/R01
Oh S., Ji C., Oh Y., Lee D. (2015). “Experimental study of horizontal wave forces on a double chamber perforated caisson,” in Coastal Structures and Solutions to Coastal Disasters Joint Conference Measurement Science and Technology, 604–660 (Reston, VA: American Society of Civil Engineers). doi: 10.1061/9780784480304.064
Parshikov A. N., Medin S. A., Loukashenko I. I., Milekhin V. A. (2000). Improvements in SPH method by means of interparticle contact algorithm and analysis of perforation tests at moderate projectile velocities. Int. J. Impact Engineer. 24 (8), 779–7965. doi: 10.1016/S0734-743X(99)00168-2
Randles P., Libersky L. (2000). Normalized SPH with stress points. Int. J. Numerical Methods Engineer. 48 (10), 1445–1462. doi: 10.1002/1097-0207(20000810)48:103.0.CO;2-9
Sammarco P., Franco L., Bellotti G., Cecioni C., Definis S. (2020). ARPEC: A novel staggered perforated permeable caisson breakwater for wave absorption and harbour flushing. Coast. Eng. Proc. 36v, 26. doi: 10.9753/icce.v36v.structures.26
Sun H., Sun Z., Liang S., Yang J., Chen X. (2019). Experimental study of the wave impact pressure inside perforated caisson. Ocean Engineer. 37 (01), 37–45. doi: 10.16483/j.issn.1005-9865.2019.01.005
Sun L., Zhang T., Liu Y. (2014). Oblique wave action on perforated caisson breakwater with inner horizontal porous plate. Port Waterway Engineer. 10, 1–6. doi: 10.16233/j.cnki.issn1002-4972.2014.10.005
Tang X. (2016). Numerical Analysis of interaction between waves and perforated caisson breakwaters based on SPH method (Dalian, China: Dalian University of Technology).
Tang X., Jiang F., Chen H. (2017a). Time-domain study of the dynamic stress of perforated caisson under wave action. Eng. mechanics. 34 (9), 9. doi: 10.6052/j.issn.1000-4750.2016.05.0349
Tang X., Jiang F., Chen H., Jin Z., Zhang L., Hao D. (2017b). Numerical calculation of total horizontal wave force on a perforated caisson with a top cover based on smoothed particle hydrodynamics method. Proc. Institution Mechanical Eng. Part M: J. Eng. Maritime Environ 231 (1) , 31–45. doi: 10.1177/1475090215614597
Twu S., Lin D. (1991). Wave Reflection by a Number of thin porous plates fixed in a semi-infinitely long flume. ASCE 1 (22), 1046–1059. doi: 10.1061/9780872627765.081
Wang D., Dong S., Fang K. (2022). Breaking wave impact on perforated caisson breakwaters: A numerical investigation. Ocean Engineer. 249, 110919. doi: 10.1016/j.oceaneng.2022.110919
Wilkins M. L. (1999). Computer simulation of dynamic phenomena (Berlin Heidelberg, Germany: Springer-Verlag New York, Inc). doi: 10.1007/978-3-662-03885-7
Zhang R., Ahammad N., Raju C., Upadhya S., Shah N., Yook S. (2022). Quadratic and linear radiation impact on 3D convective hybrid nanofluid flow in a suspension of different temperature of waters: Transpiration and Fourier Fluxes. Int. Commun. Heat Mass Transfer: A Rapid Commun. J 138 (3), 106418. doi: 10.1016/j.icheatmasstransfer.2022.106418
Zhang X., Jiang F., Dong S. (2023). Reliability analysis for vertical breakwater of perforated rectangular caisson. Period. Ocean Univ. China. 53 (07), 137–146. doi: 10.16441/j.cnki.hdxb.20220044
Zhao P. (2023). Wave interaction with perforated caisson sitting on a rubble-mound foundation (Dalian, China: Dalian University of Technology). doi: 10.26991/d.cnki.gdllu.2022.003455
Zhu D. (2013). Nonlinear analysis of hydrodynamic behavior for a double-layer perforated-wall caisson breakwater. J. Ship Mechanics. 17 (1), 12. doi: 10.3969/j.issn.1007-7294.2013.h1.009
Zienkiewicz O. C., Taylor R. L. (2000). The finite element method Volume 3-Fluid dynamics (Oxford: Butterworth-Heinemann).
Keywords: coastal and offshore engineering, double-chambered perforated caissons, smoothed particle hydrodynamics method, numerical simulation, velocity vector of water particles
Citation: Tang X, Liu H, Mei L, Fu P, Song D and Chen H (2023) Numerical study of double-chambered perforated caisson with a top cover based on SPH method. Front. Mar. Sci. 10:1294164. doi: 10.3389/fmars.2023.1294164
Received: 14 September 2023; Accepted: 30 October 2023;
Published: 15 November 2023.
Edited by:
Juan Jose Munoz-Perez, University of Cádiz, SpainReviewed by:
Qiang Chen, Florida International University, United StatesInmaculada Rodríguez-Santalla, Rey Juan Carlos University, Spain
Copyright © 2023 Tang, Liu, Mei, Fu, Song and Chen. This is an open-access article distributed under the terms of the Creative Commons Attribution License (CC BY). The use, distribution or reproduction in other forums is permitted, provided the original author(s) and the copyright owner(s) are credited and that the original publication in this journal is cited, in accordance with accepted academic practice. No use, distribution or reproduction is permitted which does not comply with these terms.
*Correspondence: Lili Mei, bWVpbGlsaWNtQDEyNi5jb20=