- 1State Key Laboratory of Tropical Oceanography, South China Sea Institute of Oceanography, Chinese Academy of Science, Guangzhou, China
- 2College of Marine Science, University of Chinese Academy of Science, Beijing, China
- 3State Key Laboratory of Mariculture Bio Breeding and Sustainable Goods, Yellow Sea Fisheries Research Institute, Chinese Academy of Fishery Sciences, Qingdao, China
- 4Centre for Regional Oceans & Department of Ocean Science and Technology, Faculty of Science and Technology, University of Macau, Macao, Macao SAR, China
- 5Center for Ocean Research in Hong Kong and Macau, Hong Kong University of Science and Technology, Hong Kong, Hong Kong SAR, China
Phytoplankton play significant roles in the carbon cycle in oceans. Phytoplankton biomass and community composition are often mediated by ocean hydrodynamics. It is vital to quantify the phytoplankton carbon content and carbon:Chlorophyll a (C:Chl a) ratio and to better understand the link between hydrodynamics and phytoplankton communities in marine environments, which are important parameters in marine biogeochemical models. Environmental variables, phytoplankton community composition, abundance, particulate organic carbon, and Chl a were determined in summer in the northern South China Sea (SCS), which was influenced by the Pearl River discharge, upwelling, and anticyclonic eddy, to examine the links between hydrodynamics, phytoplankton community, and C:Chl a ratio. Our results showed that the spatial variabilities in phytoplankton community composition, and carbon content, and C:Chl a ratio were driven by hydrodynamics. Nutrient enrichment favored the growth of diatoms, especially small chain-forming diatoms at the Pearl River Estuary stations. From inshore to offshore, the dominant phytoplankton shifted from small-chain diatoms to large diatoms and dinoflagellates, increasing phytoplankton biodiversity from inshore to offshore. Weak upwelling caused an increase in Synechococcus abundance, while an anticyclonic eddy resulted in a high abundance of Prochlorococcus and Trichodesmium spp. in the present study. We found that the relationship between phytoplankton carbon content and the logarithm of Chl a concentration fit an exponential curve. The C:Chl a ratio increased from 72.7 g g−1 at Pearl River Estuary stations, to 101 g g−1 at Pearl River discharge dilution stations and to 131 g g−1 at SCS surface stations due to shifts in phytoplankton community composition. The low C:Chl a ratio was attributed to the high abundance of diatoms in the Pearl River plume-impacted area, whereas a high C:Chl a ratio was related to the dominance of cyanobacteria at SCS surface stations. Our findings provide insights into quantifying phytoplankton carbon content and understanding the links between hydrodynamics, phytoplankton community composition, carbon content, and C:Chl a ratio in oceans.
1 Introduction
Phytoplankton play crucial roles in marine ecosystems, contributing to nearly half of the global primary production (Falkowski et al., 1998). Phytoplankton, as the main primary producers in oceans, shape the planktonic food web and determine the productivity of the whole marine ecosystem (Harrison et al., 2015). Accurate estimates of phytoplankton biomass and community composition are important for better understanding the carbon cycle in the ocean (Stemmann and Boss, 2012). Phytoplankton communities are sensitive to environmental changes (Cheung et al., 2021), hence, they often serve as biological indicators of environmental change (Dembowska et al., 2018). Phytoplankton carbon content is the sole parameter that expresses phytoplankton biomass in ocean biogeochemical models (Wang et al., 2009a). However, it is challenging to accurately quantify phytoplankton carbon content in marine environments because phytoplankton-derived particulate organic carbon (POC) and non-phytoplankton-derived POC can be difficult to separate.
Phytoplankton carbon content is usually estimated by chlorophyll a (Chl a) concentration and the carbon to Chl a ratio (C:Chl a) in oceans. A linear regression model between POC and Chl a has been proposed to estimate the C:Chl a ratio (Banse, 1977) and has been widely used over the past few decades (Chang et al., 2003; Sathyendranath et al., 2009; Yu et al., 2020). However, a statistically significant linear regression between POC and Chl a does not always exist because sources of POC are variable, and C:Chl a ratios vary with phytoplankton composition and environmental conditions in oceans (Cloern et al., 1995; Sathyendranath et al., 2009). Therefore, this approach may not always be robust. Moreover, C:Chl a ratios vary over a wide range (6 g g−1–333 g g−1) based on laboratory and field studies (Sathyendranath et al., 2009; Jakobsen and Markager, 2016; Gui et al., 2020). Light plays an important role in controlling the C:Chl a ratio by regulating phytoplankton pigment composition (Wang et al., 2009a). Phytoplankton synthesize more Chl a to maximize light absorption under low light, while accumulating more carbon in phytoplankton cells under high light (Falkowski and Owens, 1980; Verity, 1981; Markager and Sand-Jensen, 1994; Markager and Sand-Jensen, 1996), resulting in a higher C:Chl a ratio under high light than under low light (Verity, 1981; Wang et al., 2009a). Nutrients also regulate the C:Chl a ratio, with a generally high C:Chl a ratio under nutrient limitations (Hunter and Laws, 1981; Harrison et al., 1990; Taylor et al., 1997). Meanwhile, phytoplankton have a high C:Chl a ratio under high temperatures with consistent nutrient and light conditions (Behrenfeld et al., 2016). In addition, the phytoplankton species have a significant effect on the C:Chl a ratio. It has been reported that the C:Chl a ratios of diatoms are lower than those of other phyla, and cyanobacteria such as Prochlorococcus and Synechococcus, have higher C:Chl a ratios than eukaryotic phytoplankton (Sathyendranath et al., 2009; Yacobi and Zohary, 2010). It is a more accurate way to quantify the phytoplankton carbon content and C:Chl a ratio by calculating phytoplankton cell volume based on the geometrical shape of the cell, but it is time-consuming to calculate the phytoplankton cell volume due to the diverse species and varying cell sizes of phytoplankton communities in natural environments (Menden-Deuer and Lessard, 2000; Harrison et al., 2015). It is vital to determine a robust approach to quantify phytoplankton carbon content.
The South China Sea (SCS), located in the western Pacific, is a semi-closed, secondary large marginal sea around the world that is typically oligotrophic (Xu et al., 2008). The Pearl River carries a large amount of diluted water to the northern SCS (NSCS) (Yin et al., 2000; Cai et al., 2004), resulting in a clear gradient in salinity and nutrients along the inshore-offshore transect, especially in summer (Xu et al., 2008; Xu et al., 2018). In the Yuedong coastal region, the Pearl River Plume (PRP) encounters upwelling caused by monsoons and interacts with hydrology in the NSCS (Shu et al., 2018). Mesoscale eddies are also ubiquitous in the NSCS, especially anticyclonic eddies in summer, which also deepens the complexity of hydrology (Chen and Liu, 2023). Changing environmental conditions shape phytoplankton community composition in the NSCS (Wei et al., 2018; Zhong et al., 2021; Chen and Liu, 2023). Hence, the NSCS provides an ideal area to examine the links between hydrodynamic processes, phytoplankton community composition, carbon content, and C:Chl a ratio.
The objectives of this study were: (1) to determine a robust approach to more accurately quantify phytoplankton carbon content and the C:Chl a ratio in the NSCS and (2) to examine the links between hydrodynamics, phytoplankton community composition, and the C:Chl a ratio in the NSCS.
2 Materials and methods
2.1 Study sites
A cruise in the Pearl River Estuary (PRE) and its adjacent areas in the NSCS was conducted onboard the R/V Shiyan 2 from 24 August to 4 September 2020. A total of 64 stations were visited, including seven cross-shelf transects (Figure 1). The vertical profiles of temperature and salinity were gathered with conductivity–temperature–depth (CTD, Sea Bird 911 Plus). Water samples at all stations were taken at the surface (2 m below the sea surface) for Chl a, nutrients, POC, and phytoplankton analysis using 6-L Go-Flo bottles mounted on the CTD-rosette. Six stations (1, 16, 22, 54, 65, and 79) were selected in three representative oceanographic regimes to determine the phytoplankton cell volume and carbon content (Figure 1). Station 1, with a salinity of 16.14, was in the PRE (Figure 1) and was primarily influenced by the PRP (Figure 2). Stations 16, 22, and 54 with salinity of 29.61 to 31.52 were located along the eastward diffusion direction of the PRP (Shu et al., 2018) (Figure 2). Stations 65 and 79 with high salinity (>33) were on the shelf in the NSCS (Figure 1) and were not influenced by the PRP (Figure 2) (Chen et al., 2018).
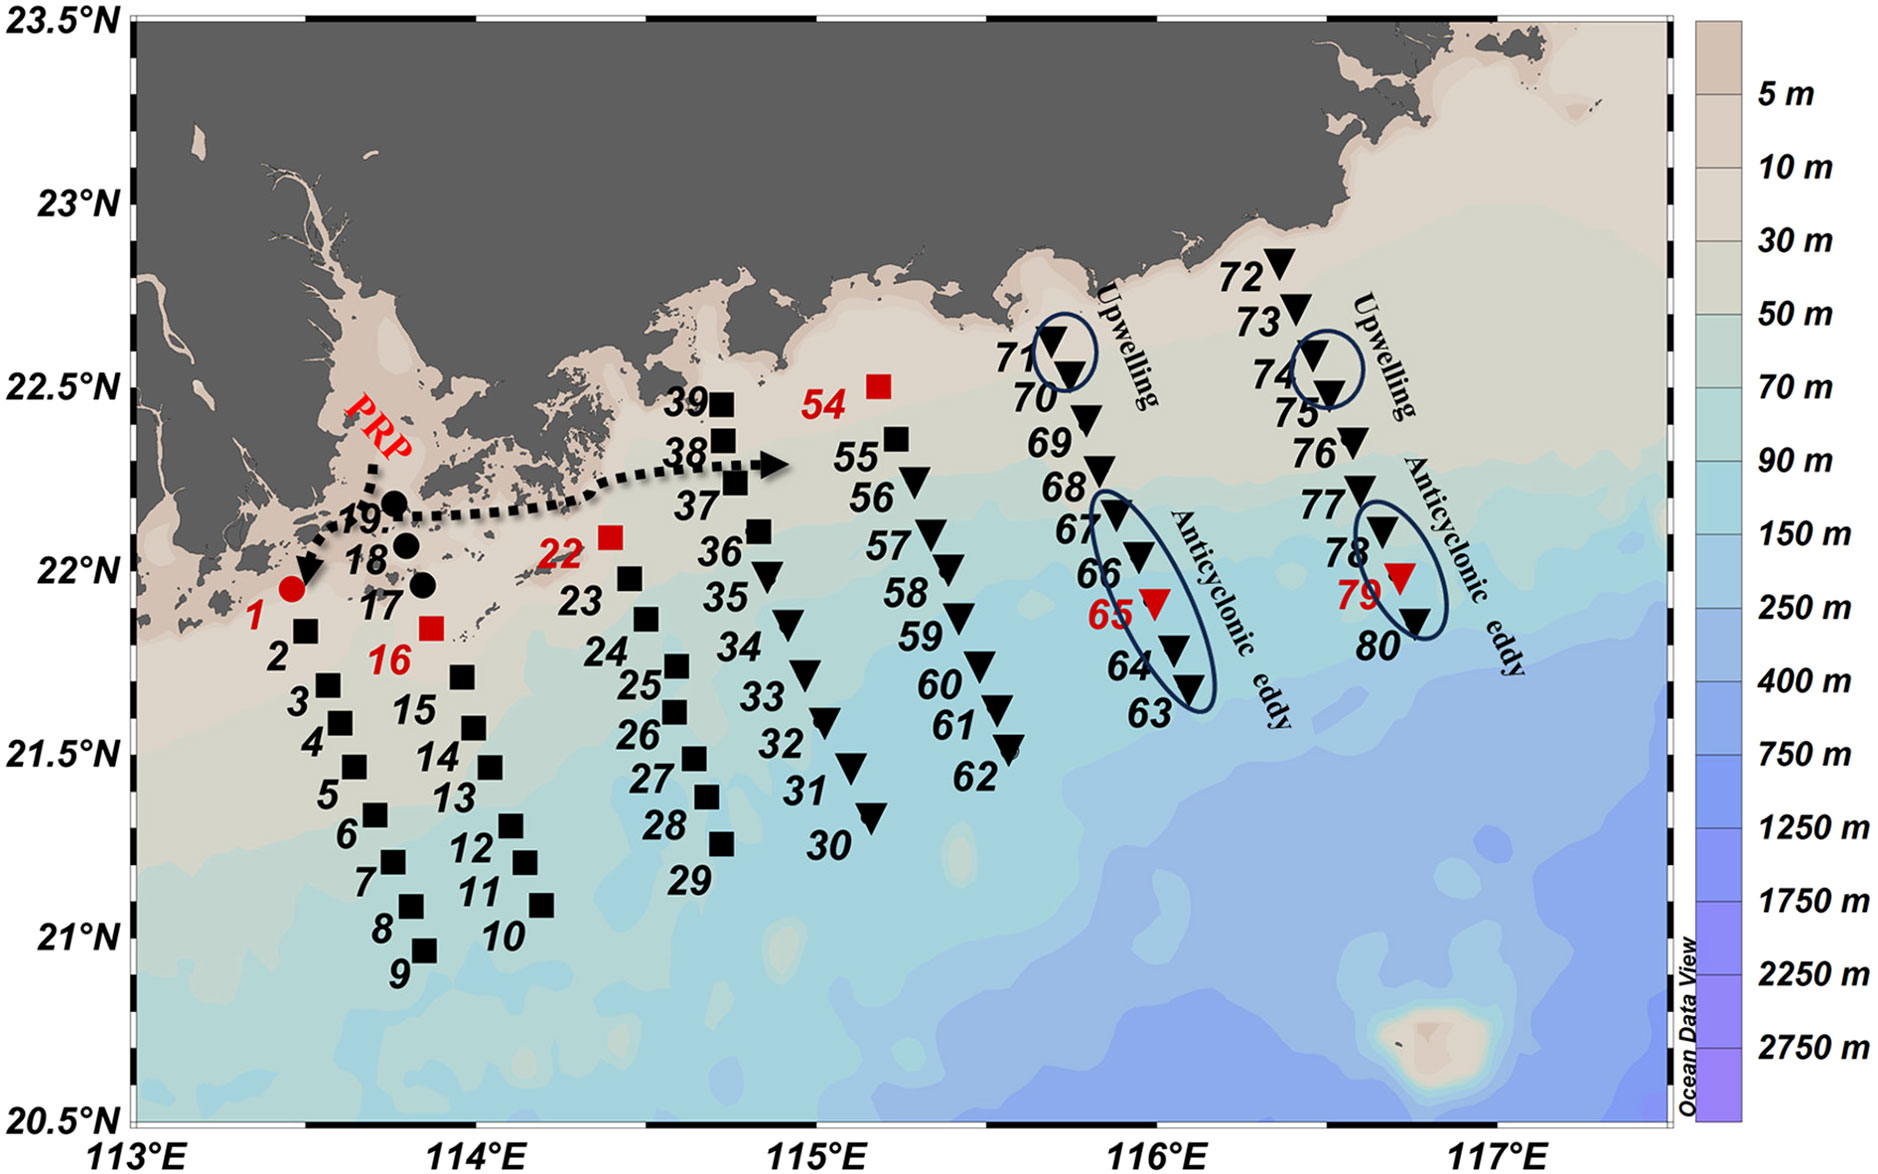
Figure 1 Location of sampling stations in the northern South China Sea. The stations tagged by dots, squares, and inverted triangles denote stations influenced by PRW, PDW, and SSW water masses, respectively. The stations in red denote the stations where the samples were collected for the determination of cell volume and biomass. The dashed arrow indicates the direction of the Pearl River plume (PRP) (Shu et al., 2018). The stations influenced by upwelling and anticyclonic eddies are circled, respectively.
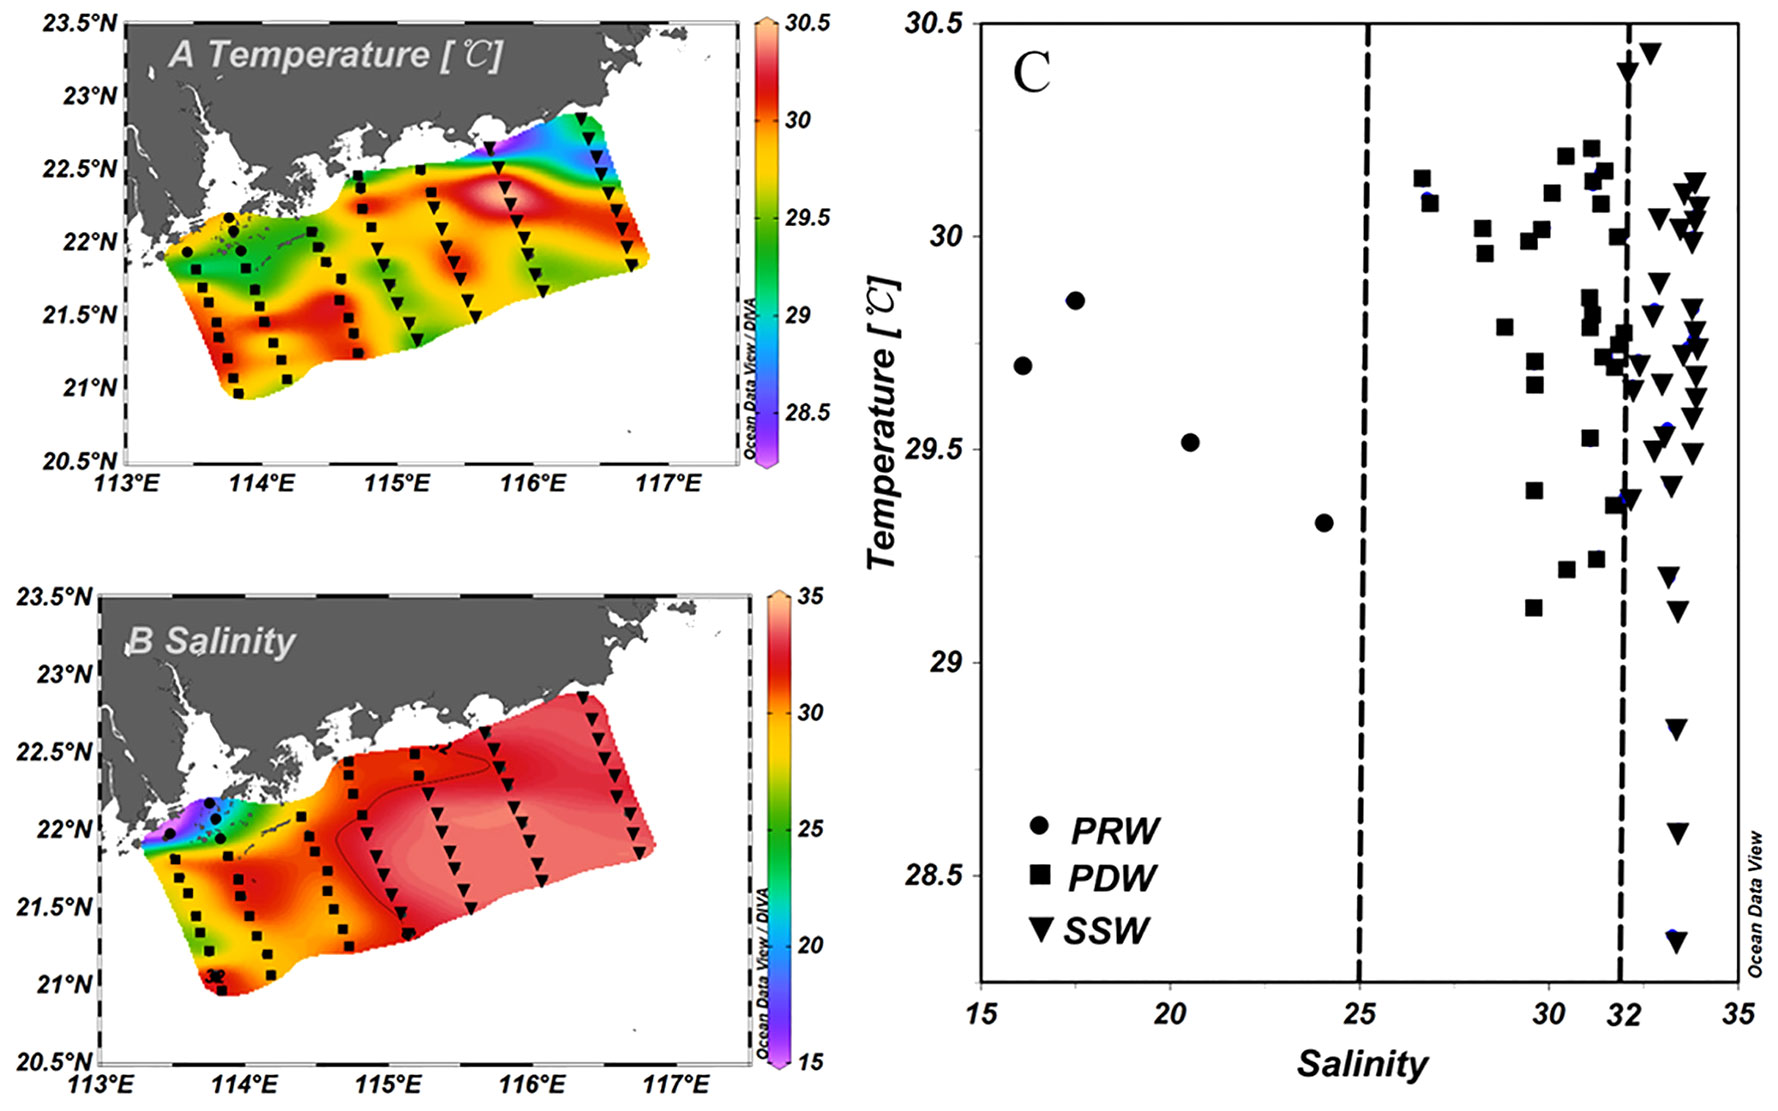
Figure 2 Horizontal distributions of surface temperature (A), salinity (B) and scatter plots of surface temperature and salinity (T–S) (C). The stations tagged by dots, squares, and inverted triangles denote stations influenced by PRW, PDW, and SSW water masses, respectively.
2.2 Nutrients, Chl a, and POC
Water samples (100 mL) for nutrient analysis were filtered through glass fiber filters (GF/F) and stored at −20°C until analysis. Inorganic nutrients, including nitrate, nitrite, ammonium, dissolved inorganic phosphate (DIP), and dissolved inorganic silicate (DSi) were measured with a continuous flow Auto Analyzer (AA3 Bran-Luebbe, GmbH) based on standard procedures (Hansen and Koroleff, 2007). The dissolved inorganic nitrogen (DIN) concentration was defined as the sum of the nitrate, nitrite, and ammonium.
Water samples (500 mL –1,000 mL) for Chl a were filtered onto the glass fiber filters (25 mm, GF/F, Whatman) and immediately stored at −20°C until analysis. In the lab, Chl a filters were extracted with 10 mL 90% acetone and stored in the dark for 24 h at 4°C. Subsequently, Chl a concentration was measured using a Turner-Designs Trilogy fluorometer (Parsons et al., 1984).
For POC samples, 1–3 L of seawater was filtered onto a glass fiber filter (25 mm, GF/F, Whatman) and stored at −20°C until analysis. Before filtration, the filters were pre-combusted at 460°C for 4 h to remove background carbon. The freeze-dried samples were decarbonated with 1 mol/L HCl for 16 h and then dried at 60°C for 36 h. The POC concentration was determined using a CHN analyzer (Elementar, Vario El Cube).
2.3 Phytoplankton abundance and carbon biomass based on microscope
Water samples (1 L) for taxonomic analysis and counting were collected in a sample bottle and then fixed with 3% (final volume concentration) buffered formalin solution. The samples were then stored in the dark. In the laboratory, phytoplankton cells in the water sample were concentrated twice by settling, and the sample volume was reduced to 5 ml. Then, the concentrated samples were identified and counted at the species level using an inverted microscope (Motic, AE2000) at magnifications of ×200 or ×400, according to the method of Utermöhl (1958). Phytoplankton taxonomic identification was performed as described by Tomas (1996) and Yamaji (1966).
Phytoplankton species diversity was calculated using a biorelated version of the Shannon–Wiener diversity index (H’) (Shannon, 1948), and species evenness was calculated using Pielou’s evenness index (J) (Pielou, 1969). The abundance (Dia./Din.A) and species ratios (Dia./Din.S) of diatoms and dinoflagellates were also regarded as indicators of environmental status (Cheung et al., 2021; Francé et al., 2021). The dominant species of phytoplankton were assessed by the dominance index (Y) (Wei et al., 2018).
To estimate phytoplankton carbon biomass, phytoplankton cells were counted using an inverted microscope equipped with a Canon video camera. The dimensions of the phytoplankton cells were measured using a software system (CapStudio, Version 3.0) that comes with the microscope at the same magnification. The thickness of the phytoplankton cells was determined by the differences in the scales engraved on the fine-focus knob between the upper and lower surfaces of the cell (Chang et al., 2003). The cell biovolume of phytoplankton was estimated via geometric approximations for each species (Dembowska et al., 2018). The reported biovolume values (Harrison et al., 2015) were used if needed. Then, the biovolume of individual cells was converted to carbon content using the conversion equations described by Menden-Deuer and Lessard (2000). At least 20 cells and fewer cells (1–18) of each species were captured for numerically dominant and less-dominant species, respectively. The cell volume of phytoplankton was measured within 3 months after the samples were taken.
2.4 Pico-phytoplankton abundance and carbon biomass
For pico-phytoplankton samples, seawater was pre-screened through a 20 µm mesh, 1 mL of which was fixed with 1% glutaraldehyde and stored in a refrigerator at −80°C after being frozen in liquid nitrogen. A total volume of 120 µL (flow rate of 60 µL min−1 running for 2 min) of each sample was analyzed using a Beckman CytoFLEX S Flow Cytometer. Pico-phytoplankton including Prochlorococcus (Pro), Synechococcus (Syn), and Picoeukaryotes (PEuk), have been discriminated based on their size and fluorescence characteristics (Wei et al., 2020).
For the conversion of cell abundance to carbon biomass, factors of 24 fg C cell−1, 67 fg C cell−1, and 293 fg C cell−1 were used for Pro, Syn and PEuk, respectively (Liu et al., 2007b; Wei et al., 2020).
2.5 Phytoplankton C:Chl a ratio and carbon content by two methods
Linear regression of POC and Chl a concentrations was employed to estimate the carbon-to-chlorophyll a (C:Chl a) ratio, and the slope of the regression was used as the mean C:Chl a ratio (Banse, 1977). Model I linear regression was applied to estimate the mean C:Chl a ratio (Sokal and Rohlf, 1995). The linear regression of POC and Chl a concentrations was expressed as follows:
where, A is the slope that was defined as the C:Chl a ratio of phytoplankton, and A × Chl a and intercept (B) represent the phytoplankton carbon (PPC) and non-phytoplankton carbon (PNPC), respectively.
Based on the phytoplankton carbon content estimated by cell volume at the six stations, the relationship between phytoplankton carbon and Chl a was obtained, which is expressed as follows (Buck et al., 1996):
where, CPC is the phytoplankton carbon measured by cell volume, C is a dimensionless coefficient.
CPC was estimated at other stations using this model and the Chl a concentration, and non-phytoplankton carbon based on the cell volume method (CNPC) was obtained from the differences between POC and CPC.
2.6 Date analysis
Salinity, a conservative tracer unaffected by biological activity, has been used to calculate the spatial distribution of other environmental variables (Soria et al., 2017). The PRP-impacted water mass was defined as a station with a surface salinity of<32 (Chen et al., 2018). The relationships between phytoplankton communities and environmental parameters were obtained using canonical correspondence analysis (CCA; Canoco 4.5). Phytoplankton communities were classified into different groups based on similar responses of phytoplankton species to environmental factors, and the chi-square distance of species symbols in the same group was less than 0.8 (Wei et al., 2017; Zhong et al., 2021). Nonmetric multi-dimensional scaling analysis was performed based on phytoplankton abundance, which reduced the dimensionality after 2nd root and the stations were classified by Bray–Curtis similarity matrices with PRIMER 6.0. Horizontal distributions of phytoplankton and other physiochemical variables were performed by Ocean Data View (Version 5.1.2). Histograms with different environmental and ecological variables between different water masses were drawn using Origin 9 software. A univariate ANOVA test was performed to identify differences between different variables using SPSS 14.0, and statistically significant differences were determined at p<0.05.
3 Result
3.1 Temperature, salinity, and determination of water masses
Surface salinity exhibited clear horizontal gradients from inshore to offshore, ranging from 16.1 to 33.9 (31.2 ± 3.58) (Figure 2B). The surface temperature varied within a narrow range from 28.4°C to 30.4°C (29.7 ± 0.39°C) (Figure 2A). Upwelling occurred at Stations 71, 72, 74, and 75, as indicated by the low temperatures at these stations (Figures 1, 2A). Based on the sea surface height anomaly (Figure S1), an anticyclonic eddy occurred on the shelf of the NSCS, which impacted Stations 63–67 and 78–80 (Figure 1).
According to the T–S diagram (Figure 2C), three different types of water masses were identified in the study area: “Pearl River Water” (PRW) that was strongly influenced by the PRP (with salinity<25); “Pearl Diluted Water” that was less influenced by the PRP (with salinity from 25 to 32); and “SCS-Surface Water” (SSW) with high surface salinity (>32), which was not influenced by the PRP (Figure 2C). Surface salinity differed significantly among the three water masses (Figure 3B).
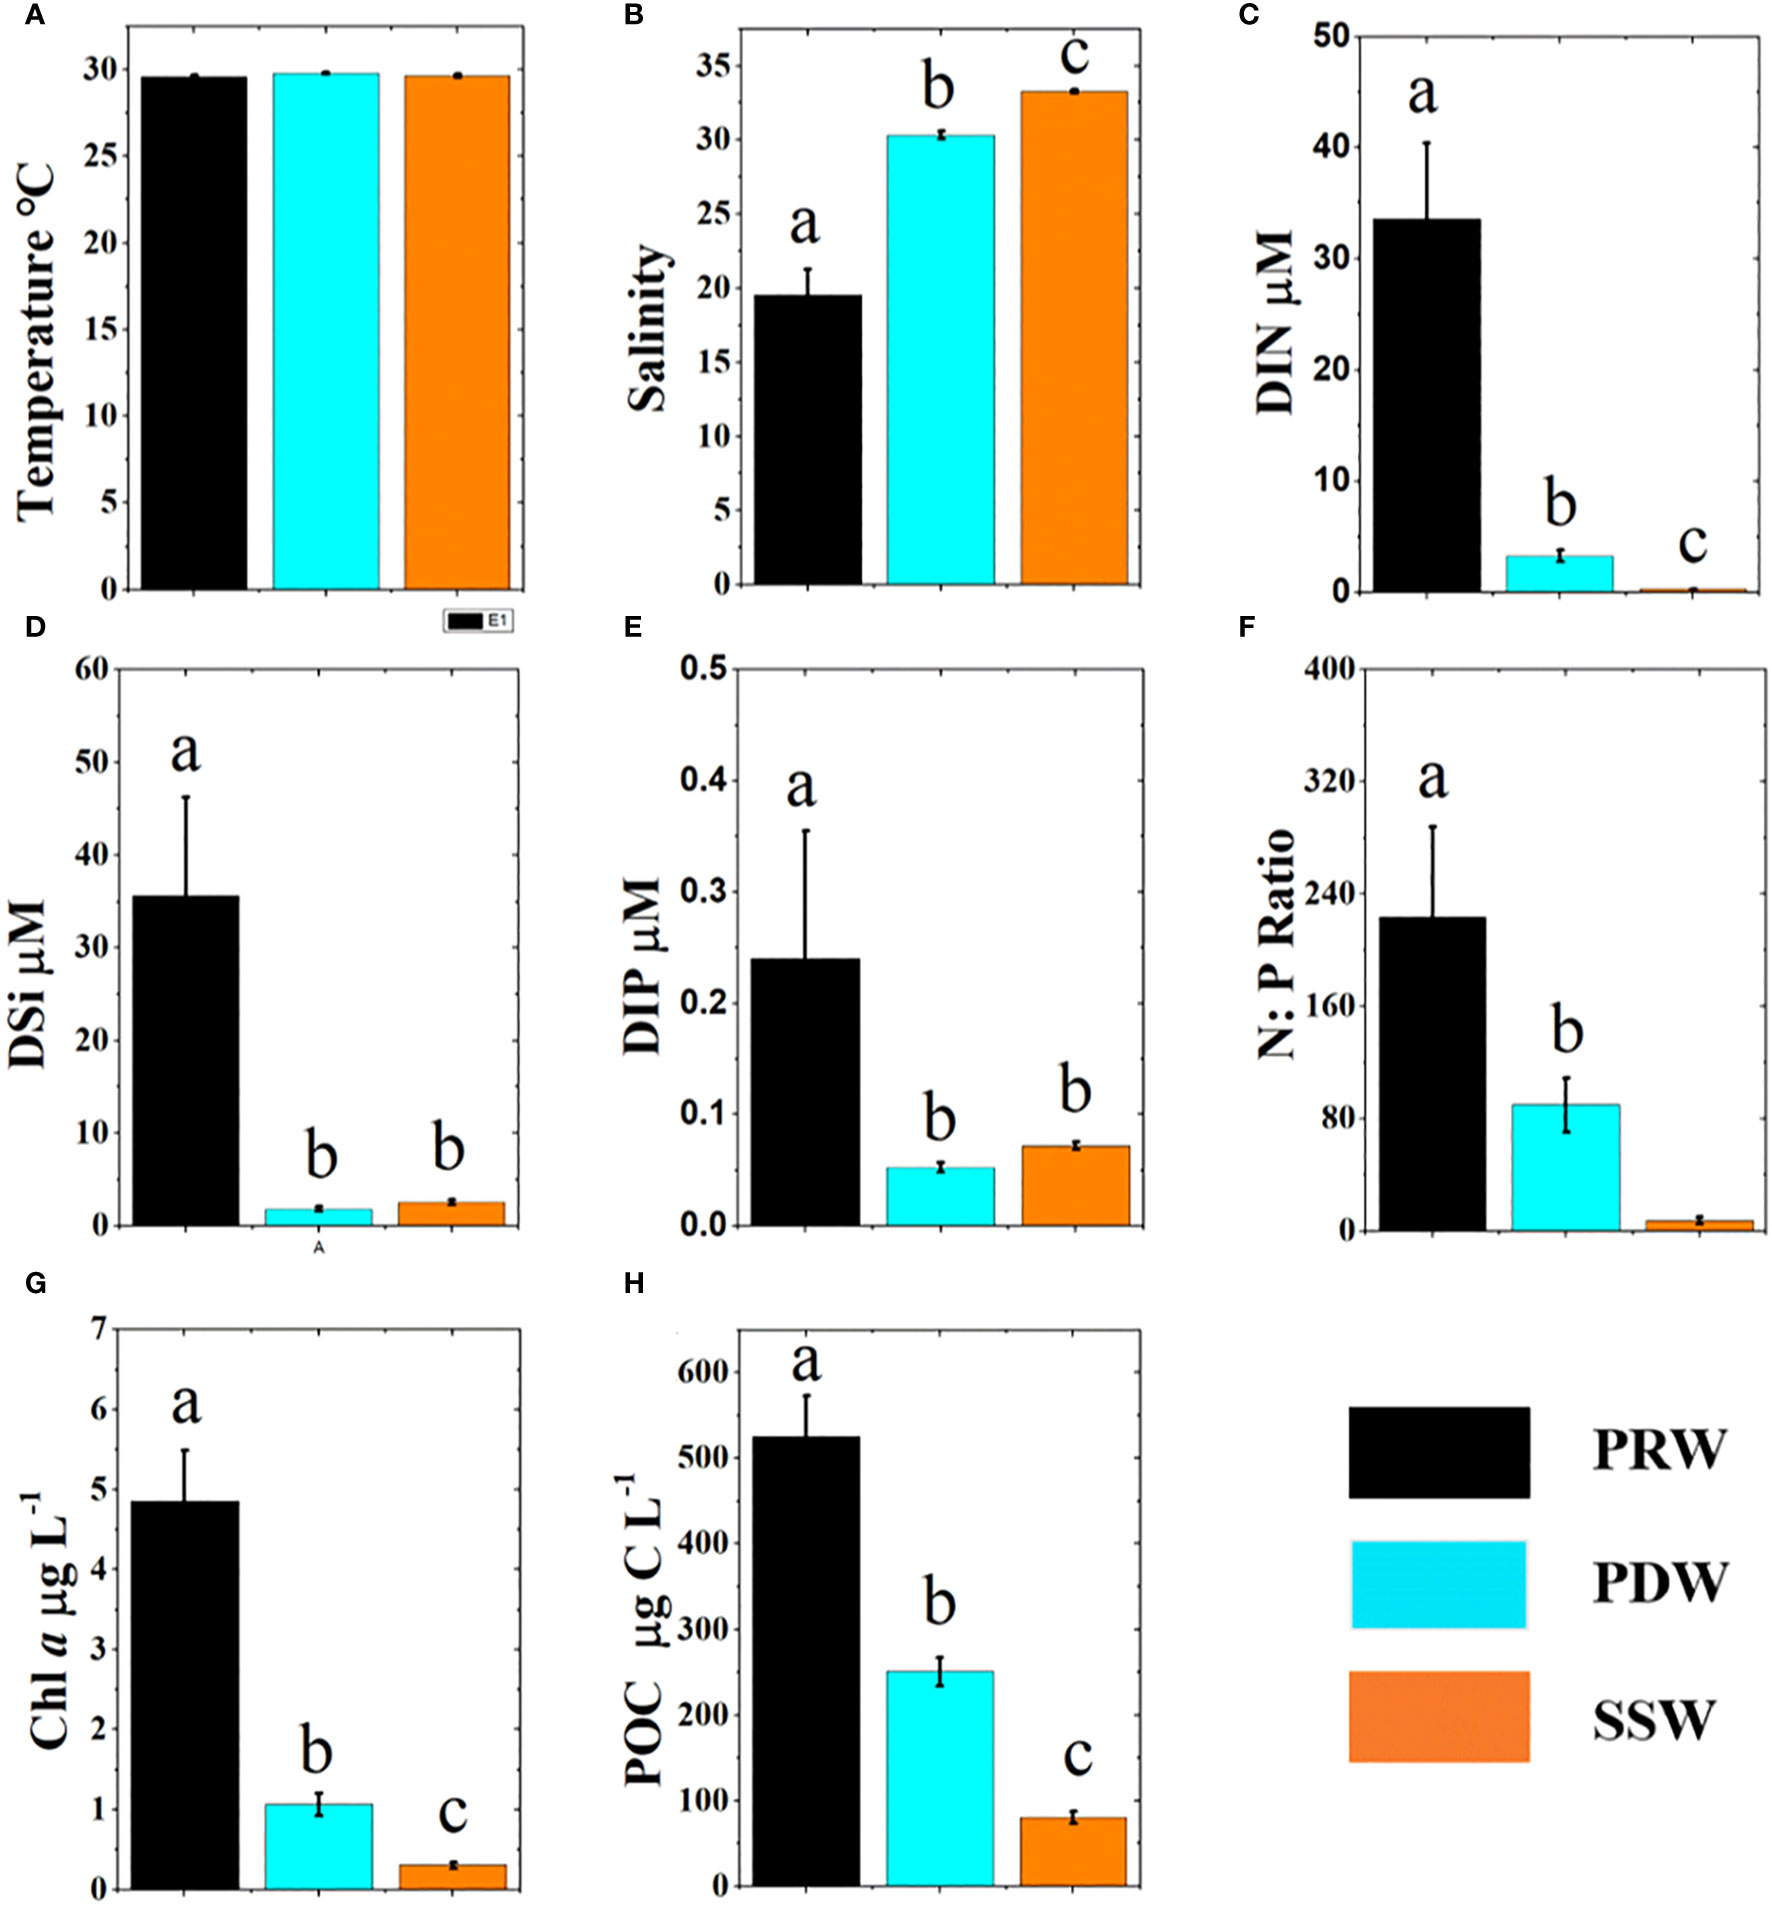
Figure 3 Comparison of environmental parameters (mean ± SE) between three water masses with columns of different colors. The different letters (a, b, c) in each plot indicate significant differences in parameters between the three water masses at least p<0.05. Temperature (A), Salinity (B), DIN (C), DSi (D), DIP (E), N:P Ratio (F), Chl a (G), POC (H).
3.2 Nutrients, Chl a, and POC concentrations
DIN concentrations decreased offshore (Figure S2A), with the highest concentration at PRW stations, moderate concentration at PDW stations, and lowest concentration at SSW stations (Figure 3C). The DSi and DIP concentrations exhibited distribution patterns similar to that of DIN (Figures S2B, C). DSi and DIP concentrations were significantly higher at PRW stations than at PDW and SSW stations, respectively (p<0.01), but there was no significant difference between SSW and RDW stations for DSi (p = 0.587) and DIP (p = 0.229) (Figures 3D, E). DSi concentrations were relatively high at upwelling stations (Figure S2A). The N:P ratios (DIN:DIP) differed significantly (p<0.01) among the water masses, with the highest at PRW stations (224 ± 64.5), moderate at PDW stations (89.7 ± 19.3), and lowest at SSW stations (7.73 ± 2.57) (Figure 3F).
Chl a and POC decreased significantly from inshore to offshore (Figures S2E, F). The concentrations of Chl a and POC were significantly different (p<0.01) between three water masses (Figures 3G, H). POC and Chl a concentrations were low (Figures S2E, F) at stations influenced by the anticyclonic eddy.
3.3 Phytoplankton species composition, abundance, and biodiversity
3.3.1 Phytoplankton species composition based on microscope
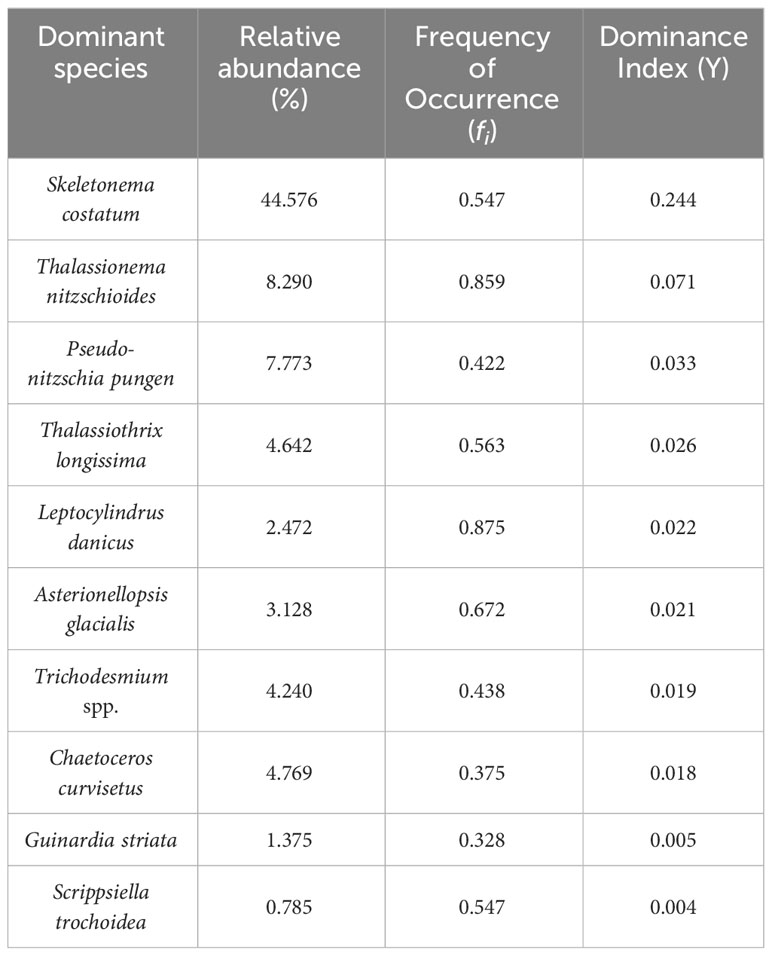
A total of 211 species of phytoplankton belonging to five classes and 71 genera were identified with microscopy. In phytoplankton assemblages, Bacillariophyceae were the most diversified group with 43 genera and 112 species, which accounted for 53.1% of the species richness. Dinophyceae was the second most diversified group, including 91 species belonging to 23 genera, with a species richness of 43.1%. Only four species from three genera of Cyanophyta and three species from two genera of Chrysophyta were identified. In addition, Scenedesmus quadricauda within the Chlorophyta group appeared only at Stations 1 and 19. In addition, the dominant phytoplankton species were mostly diatoms, except Trichodesmium spp. (Cyanophyta) and Scrippsiella trochoidea (Dinophyceae) (Table 1).
3.3.2 Phytoplankton abundance based on microscope
Phytoplankton abundance, based on microscopy, decreased from inshore to offshore (Figure 4). The cell abundance of phytoplankton assemblages ranged from 2.10 × 10³ to 2.46 × 10⁶ cells L−1 (2.28 ± 0.88 × 10⁵ cells L−1). Diatom abundance ranged from 1.00 ×10³ to 2.40 × 10⁶ cells L−1 (2.14 ± 0.85 × 10⁵ cells L−1), accounting for 94.3% of the total cell abundance, followed by dinoflagellates (1.00 ± 0.21 × 10⁴ cells L−1) with 4.43% of the total cell abundance. Chrysophyta appeared throughout the study area, but their contribution to phytoplankton abundance was negligible (Figure 4D). Cyanobacteria mainly appeared at SSW stations. There was a high abundance of Trichodesmium spp. at the stations affected by anticyclonic eddies (Figure 4E).
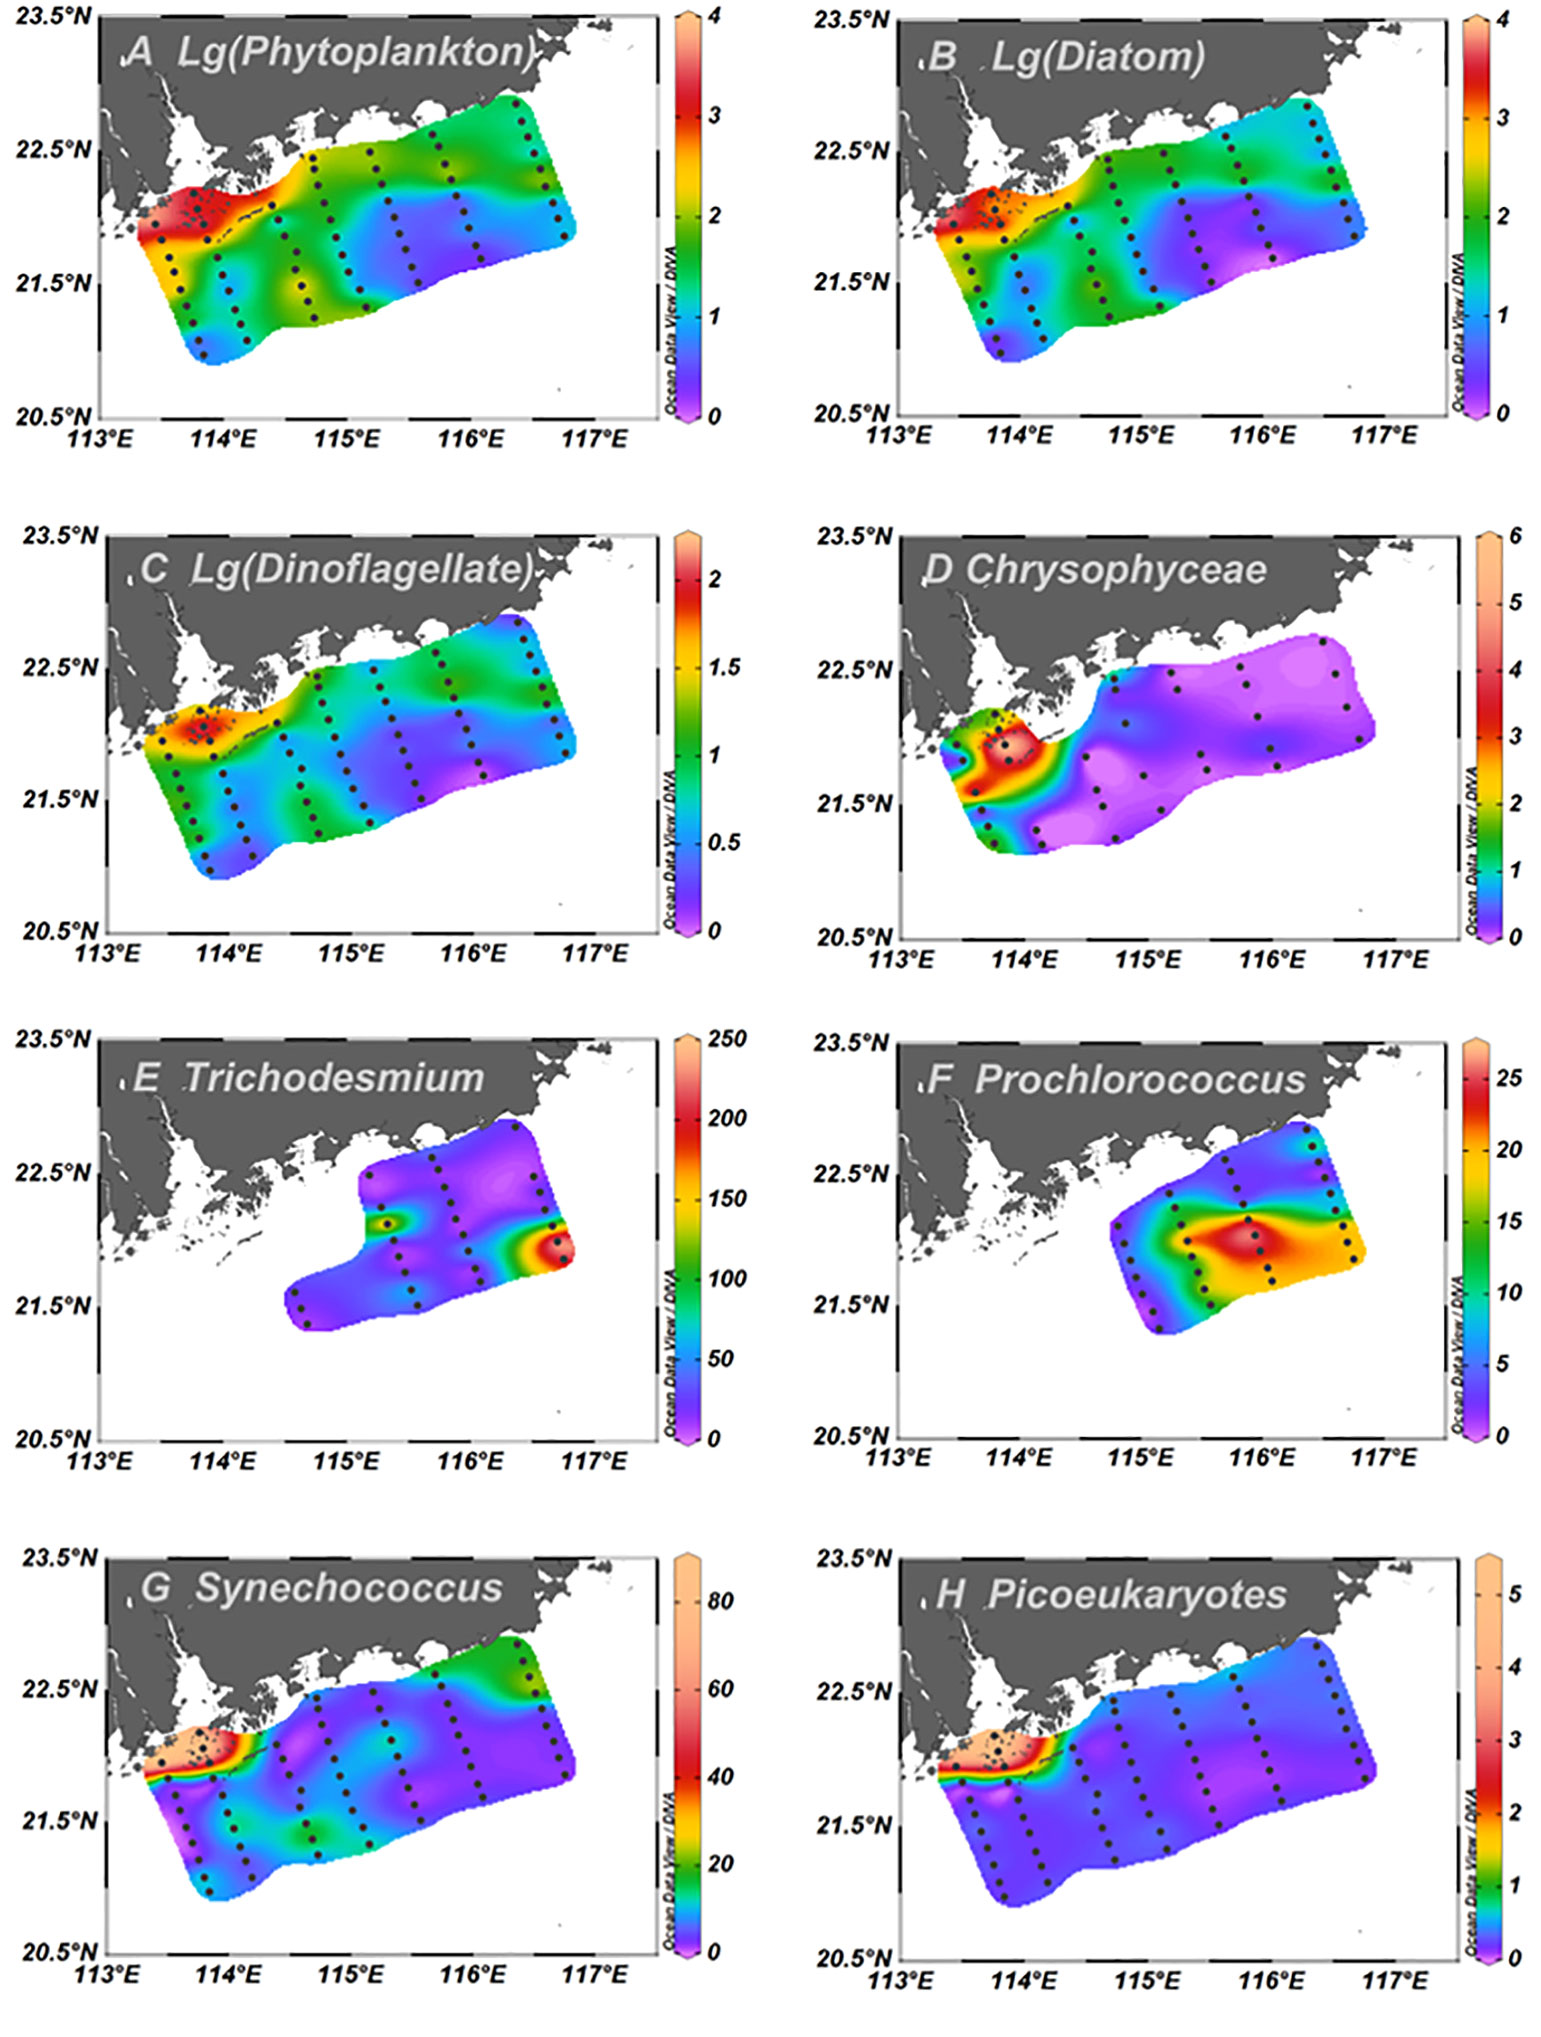
Figure 4 Horizontal distributions of surface phytoplankton abundance based on microscopy (103 Cells L−1) and pico-phytoplankton (107 Cells L−1). logarithmic transformations of total phytoplankton (A), logarithmic transformations of diatom (B), logarithmic transformations of dinoflagellate (C), Chrysophyta (D), Trichodesmium spp. (E), Prochlorococcus (F), Synechococcus (G), Picoeukaryotes (H).
Among the water masses, the diatom abundance at PRW stations was the highest, which was almost 23-fold higher than that at PDW stations and 124-fold higher than that at SSW stations (Figure 5A). Dinoflagellate abundance at PRW stations was also significantly (p<0.01) higher than those at PDW stations and SSW stations (Figure 5B). Although the abundance of diatoms and dinoflagellates at PDW stations was higher than those at SSW stations, no statistically significant difference was observed between the two water masses (Figures 5A, B).
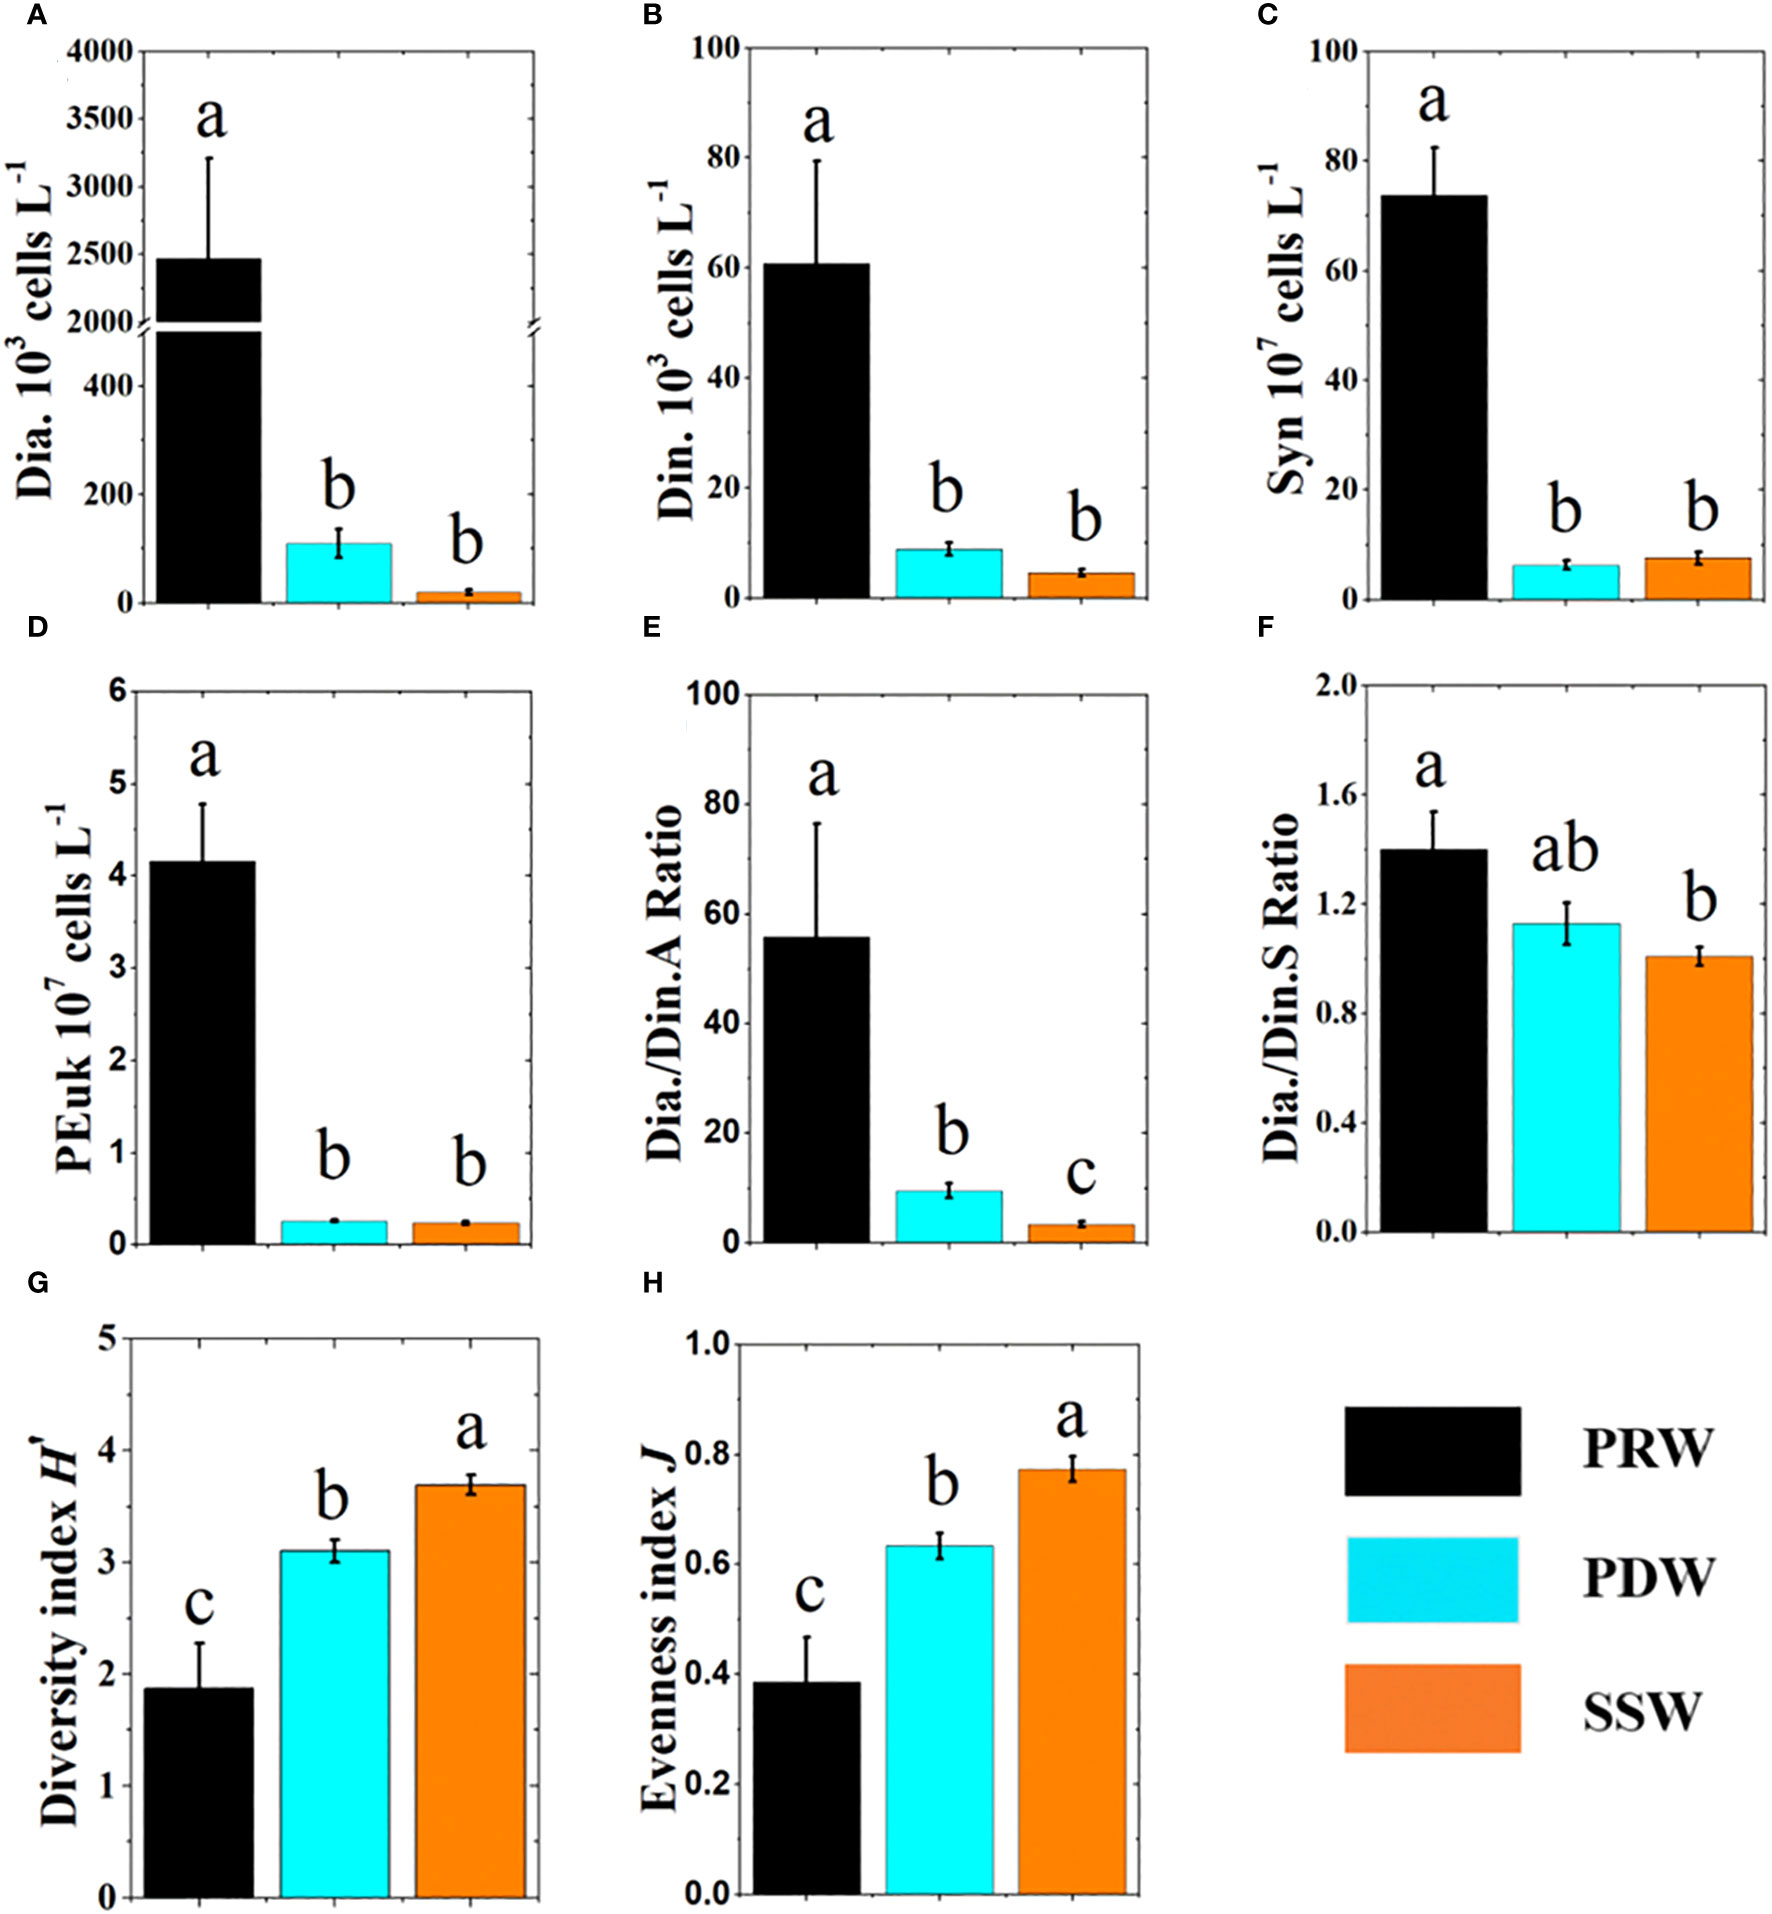
Figure 5 Comparison of ecological parameters (mean ± SE) between three water masses with different color columns. The different letters (a, b, c) in each plot indicate significant differences in parameters between three water masses at least p<0.05. Dia., Diatom abundance (A), Din., Dinoflagellate abundance (B), Syn: Synechococcus abundance (C), PEuk, Picoeukaryotes abundance (D), Dia./Din.A, Abundance ratio of diatom and dinoflagellate (E), Dia./Din.S ratio, Species ratio of diatom and dinoflagellate (F), Diversity index (G), Evenness index (H).
3.3.3 Pico-phytoplankton species composition and abundance
The horizontal distributions of pico-phytoplankton, including Prochlorococcus (Pro), Synechococcus (Syn), and Picoeukaryotes (PEuk), are illustrated in Figure 4. Pro was detected only at stations with salinity >32 (Figures 2B, 4F). Pro abundance was significantly higher at stations influenced by the anticyclonic eddy than at the other stations (Figure 4F). Syn and PEuk appeared at all stations with abundance of 1.11 ± 0.22 × 10⁸ cells L−1 and 4.91 ± 1.23 × 10⁶ cells L−1, respectively. The horizontal distributions of Syn and PEuk were similar to those of diatoms (Figure 4), and a high Syn abundance was also observed at the upwelling stations (Figure 4G).
Among the water masses, the abundances of Syn and PEuk at PRW stations were significantly (p<0.01) higher than those at PDW and SSW stations, respectively, but no significant difference was observed between PDW and SSW stations (Figures 5C, D).
3.3.4 Phytoplankton biodiversity indicators
Dia./Din.A (abundance ratio of diatoms and dinoflagellates) decreased offshore (Figure S3A), with the highest value at PRW stations, moderate value at PDW stations and lowest value at PRW stations (Figure 5E). However, there was no significant difference in the Dia./Din.S (species ratio of diatoms and dinoflagellates) between the PDW and the other two water masses, Dia./Din.S at PRW stations was significantly (p<0.01) higher than that at SSW stations (Figure 5F). The horizontal distributions of the diversity index (H’) (3.31 ± 0.09) and evenness index (J) (0.68 ± 0.02) were opposite to those of Dia./Din.A (Figures S3C, D), with an increase from PRW to PDW to SSW stations (Figures 5G, H).
3.4 Environmental influence on phytoplankton community composition
Canonical correspondence analysis (CCA) was applied based on the top 25 dominant species (including Pro, Syn, and PEuk) and eight environmental variables to determine the effects of environmental parameters on the phytoplankton community (Figure 6). Eigenvalues of CCA axis 1 and axis 2 were 0.72 and 0.31, respectively, and the species-environment correlation coefficients were 0.96 and 0.88, respectively. Meanwhile, the correlation coefficient of environmental axis 1 and axis 2 was 0, which indicated that the degree of a linear combination of the CCA axis and environmental factors could properly reflect the relationship between dominant species and environmental factors. Thus, the ordination results were reliable.
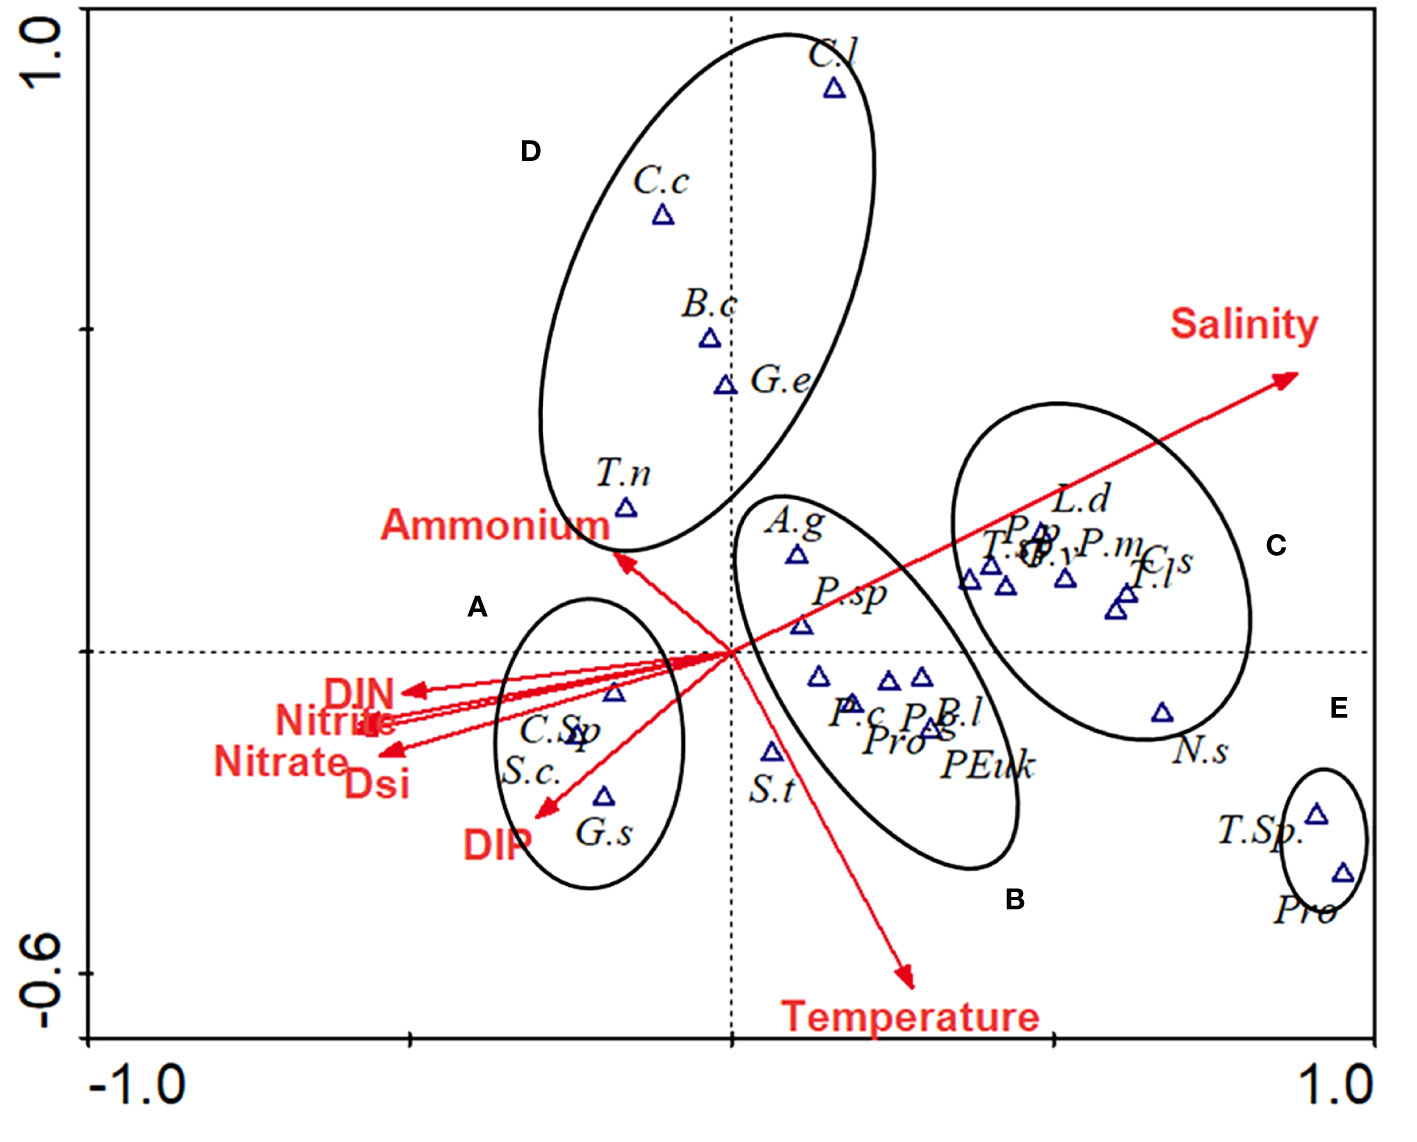
Figure 6 CCA scatter bi-plot for phytoplankton dominant species and environmental factors. Environmental parameters presented as red arrows, while biological variables in triangles. A. g, Asterionellopsis glacialis; B.a, Bacteriastrum comosum; C.c, Chaetoceros curvisetus; C.l, Chaetoceros lorenzianus; C.s, Coscinodiscus subtilis; C.sp, Chaetoceros sp.; G.d, Guinardia deicatula; G.f, Guinardia flaccida; G.p, Gonyaulax polyedra; G.s, Guinardia striata; G.v, Gymnodinium viridescens; L.a, Lauderia annulate; L.d, Leptocylindrus danicus; N.sp, Nitzschia spp.; P.c, Protocentrum compressum; P.g, Prorocentrum gracile; P.m, Prorocentrum minimum; P.n, Pseudo-nitzschia pungens; P.r, Protoperidinium rotundata; P.sp., Protoperidinium sp.; S.c, Skeletonema costatum; S.s, Synedra spp.; S.t, Scrippsiella trochoidea; T.l, Thalassiothrix longissimi; T.n, Thalassionema nitzschioides; T.s, Trichodesmium spp.; T.sp, Thalassiosira spp.; Pro, Prochlorococcus; Syn, Synechococcus; PEuk, Picoeukaryotes.
Species, including Skeletonema costatum, Guinardia striata, and Chaetoceros sp., gathered in Class A showed a negative relationship with salinity, but a positive correlation with nutrients (without ammonium), which dominated at PRW stations (Figure 6). Class B includes small diatoms (e.g., Asterionellopsis glacialis, Pseudo-nitzschia pungen) and dinoflagellates (Protoperidinium spp.), and Class C, which includes large diatoms (e.g., Coscinodiscus subtilis, Thalassiothrix longissimi) and dinoflagellates (Prorocentrum spp.) were distinguished by salinity, which dominated at PDW and SSW stations, respectively (Figure 6). Species in Class D were negatively correlated with temperature and were mainly detected at the stations influenced by upwelling (Figure 6). Meanwhile, Pro and Trichodesmium spp., as separate Class E, were significantly negatively correlated with nutrients (in particular ammonium) (Figure 6) and were highly abundant at stations influenced by the anticyclonic eddy (Figures 4E, F).
Nonmetric multidimensional scaling analysis showed that all samples were classified into six groups with at least a 40% similarity level (Figure S4), which were grouped according to water masses except for Station 11 (Figure 7). Groups 1, 2, and 6 were completely affected by PRW, PDW, and SSW water masses, respectively, and Groups 3, 4, and 5 were affected by a combination of PDW and SSW water masses, owing to the existence of transitions from PDW to SSW in geographical location (Figures 1, 7).
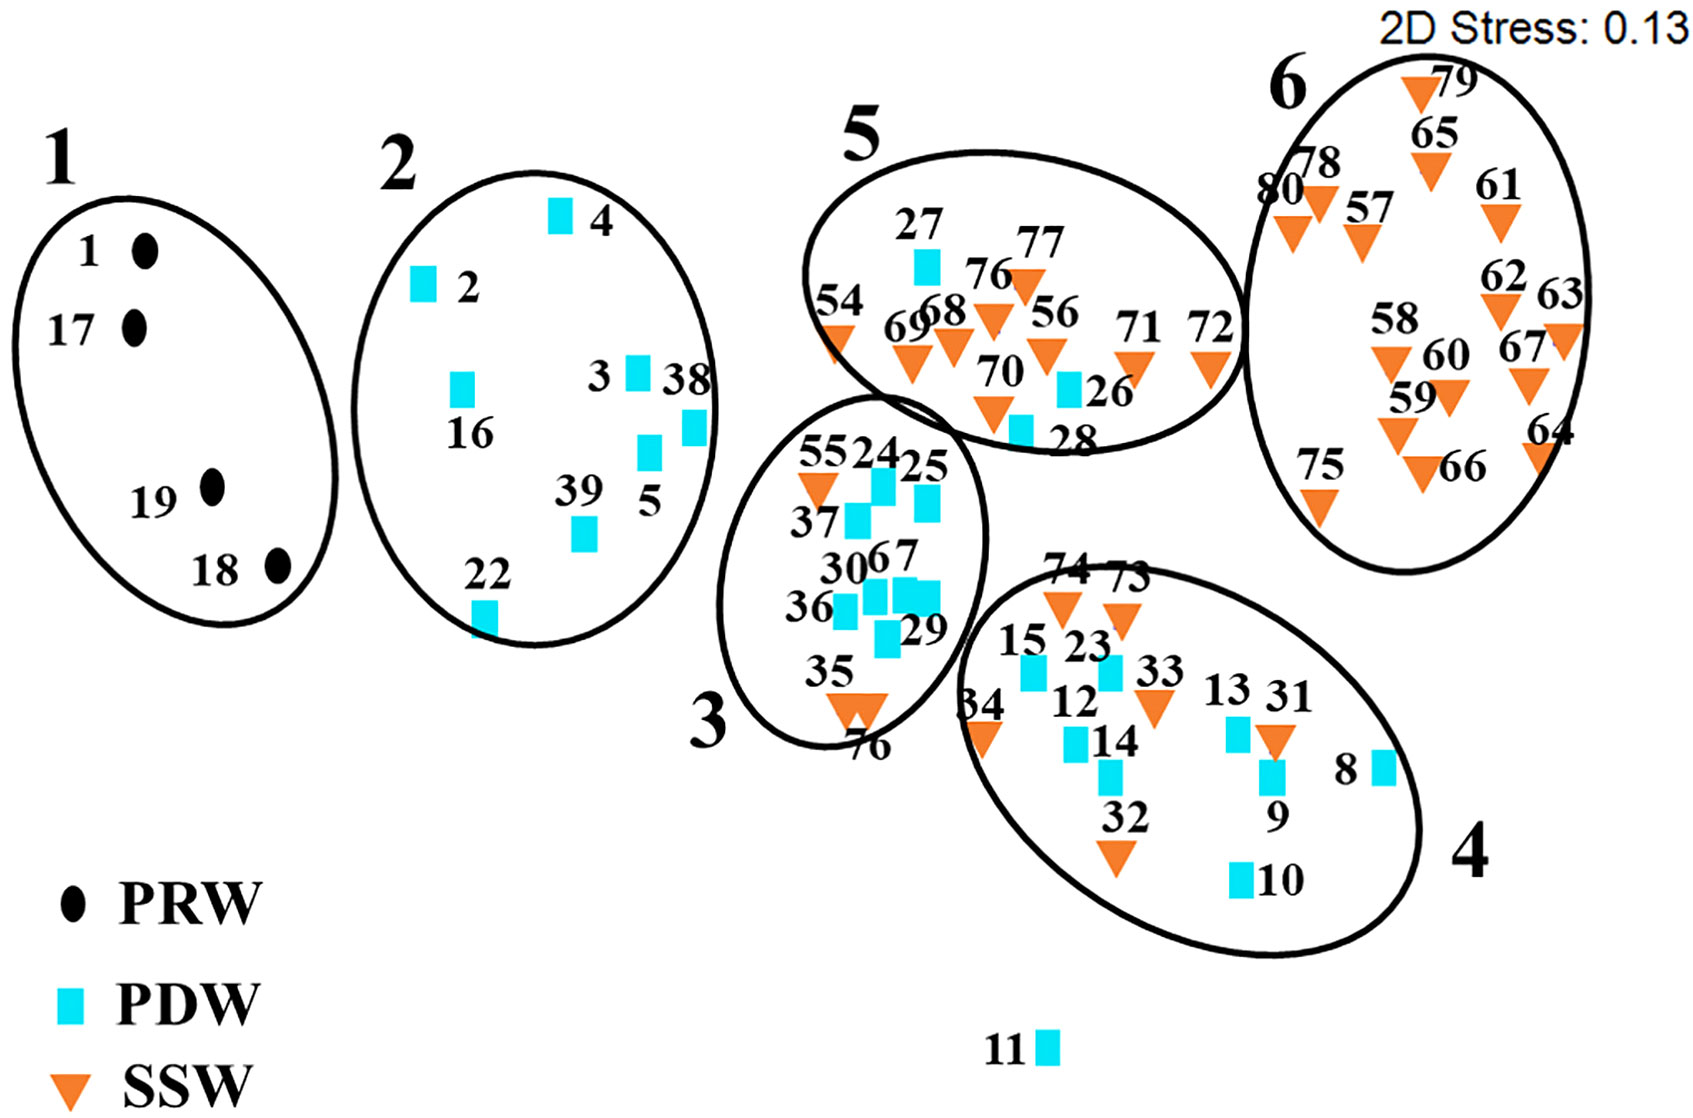
Figure 7 Phytoplankton community composition was classified into six groups based on the nonmetric multidimensional scaling analysis. The stations tagged by dots, squares, and inverted triangles denote stations influenced by PRW, PDW, and SSW water masses, respectively.
3.5 Phytoplankton carbon content and carbon-to-chlorophyll a ratio
3.5.1 Phytoplankton carbon-to-chlorophyll a ratio from regression
The mean C:Chl a ratio was 82.1 g g−1 throughout the study area, which was derived from the relationship between POC and Chl a at all stations (Figure 8A; Table 2). The C:Chl a ratios based on the linear relationships between POC and Chl a concentrations differed among the three water masses, which increased from the PRW (66.7 g g-1) to PDW (96.4 g g−1), to SSW (155 g g−1) stations (Figure 8; Table 2).
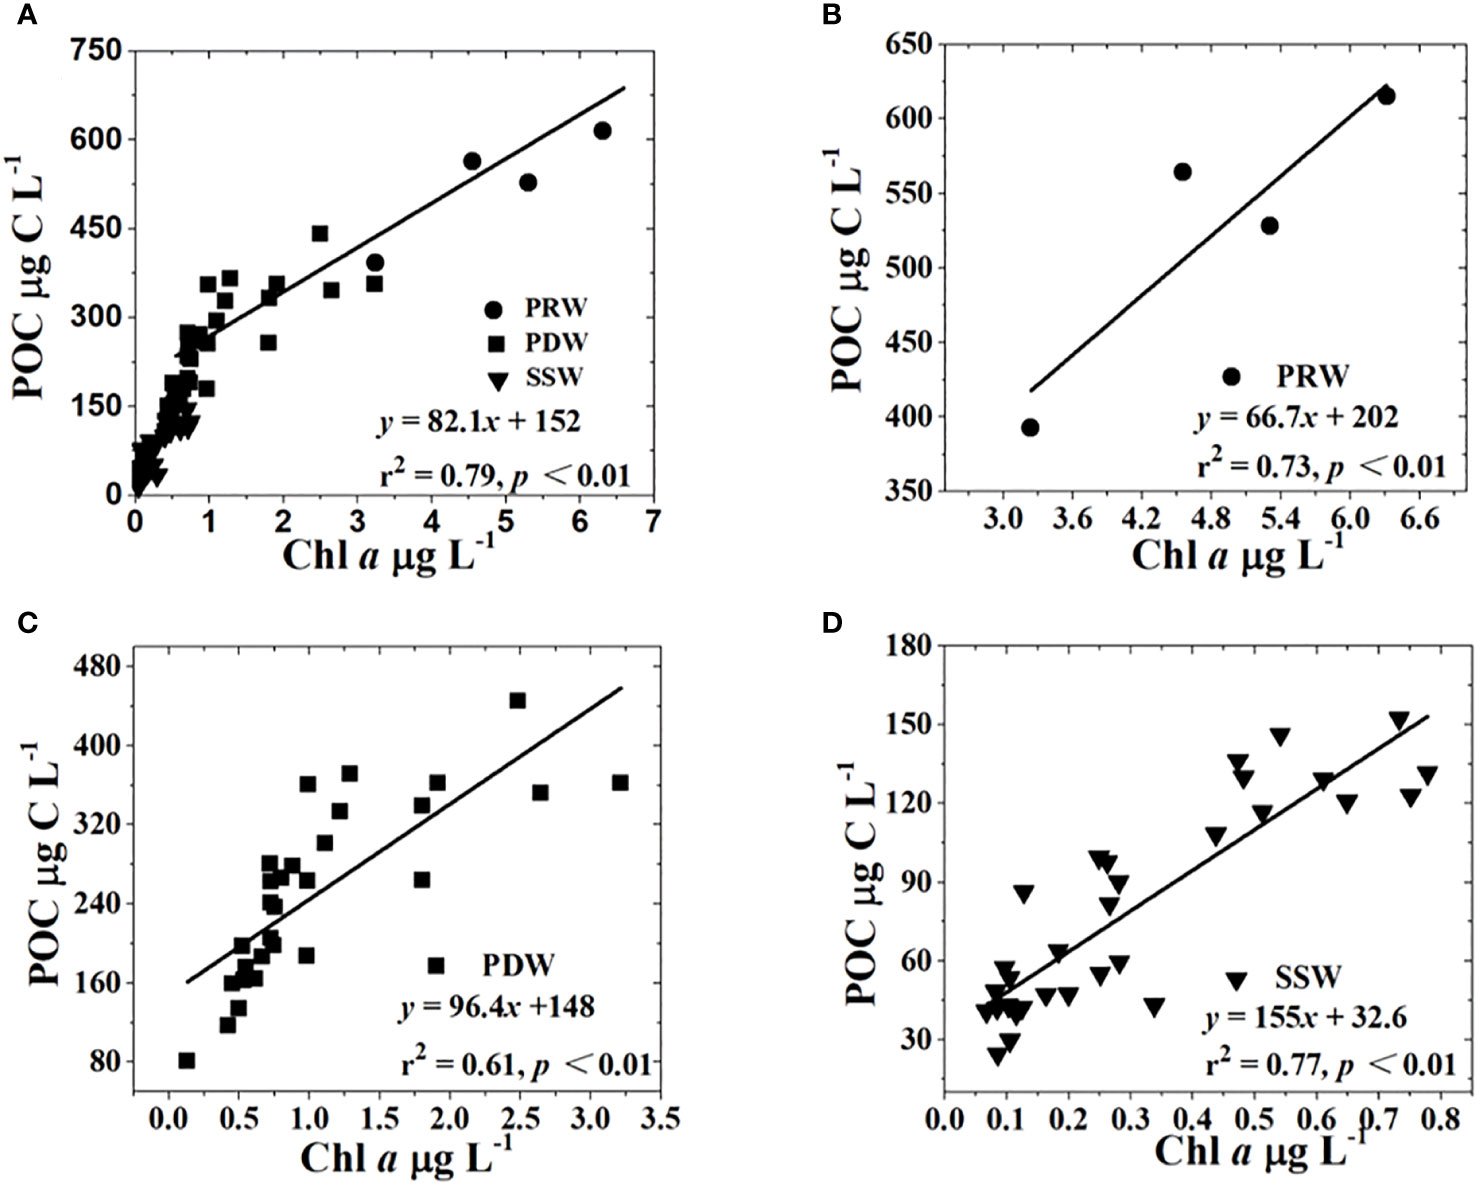
Figure 8 Relationships between POC and Chl a concentrations at the study stations. The symbols tagged by dots, squares, and inverted triangles denote stations influenced by PRW, PDW, and SSW water masses, respectively. All stations (A), PRW stations (B), PDW stations (C), SSW stations (D).

Table 2 Carbon-to-chlorophyll a ratios estimated using the POC regression method and the cell volume method at the study stations.
3.5.2 Phytoplankton carbon-to-chlorophyll a ratio from cell volume
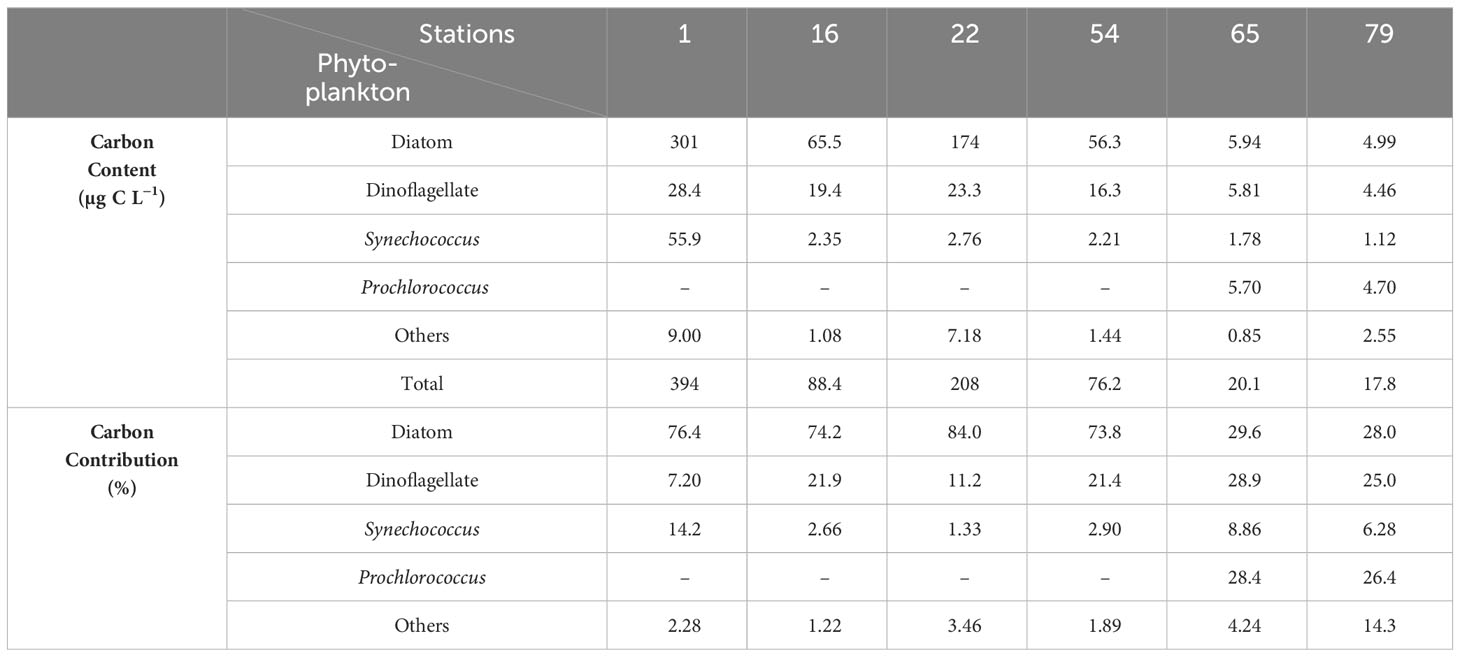
Phytoplankton abundance and carbon content based on microscopy declined from PRW station (Station 1) to PDW stations (Stations 16, 22, and 54), to SSW stations (Stations 65 and 79) (Table 3; Table S1). Diatoms contributed 73.8%–84.0% of the total phytoplankton carbon content in the PRP-affected area (PRW and PDW), but only 28.0%–29.6% at SSW stations (Table 3). The contributions of dinoflagellate carbon content increased from 7.20% at PRW station (Station 1) to 11.2%–21.9% at PDW stations (Stations 16, 22 and 54), to 25.0%–28.9% at SSW stations (Stations 65 and 79) (Table 3). Cyanobacteria contributed to more than 38% of the total phytoplankton carbon content at SSW stations (Stations 65 and 79) (Table 3; Table S1).
The relationship between phytoplankton carbon content by cell volume (CPC) and the logarithm of Chl a concentration fitted well with the exponential curve at the six selected stations (r2 = 0.99, p<0.01) (Figure 9). The mean C:Chl a ratio among three water masses derived from the relationship between CPC and the logarithm of Chl a concentration was 72.7 ± 2.00 g g−1, 101 ± 2.42 g g−1 and 131 ± 3.48 g g−1 for PRW, PDW and SSW stations, respectively (Table 2).
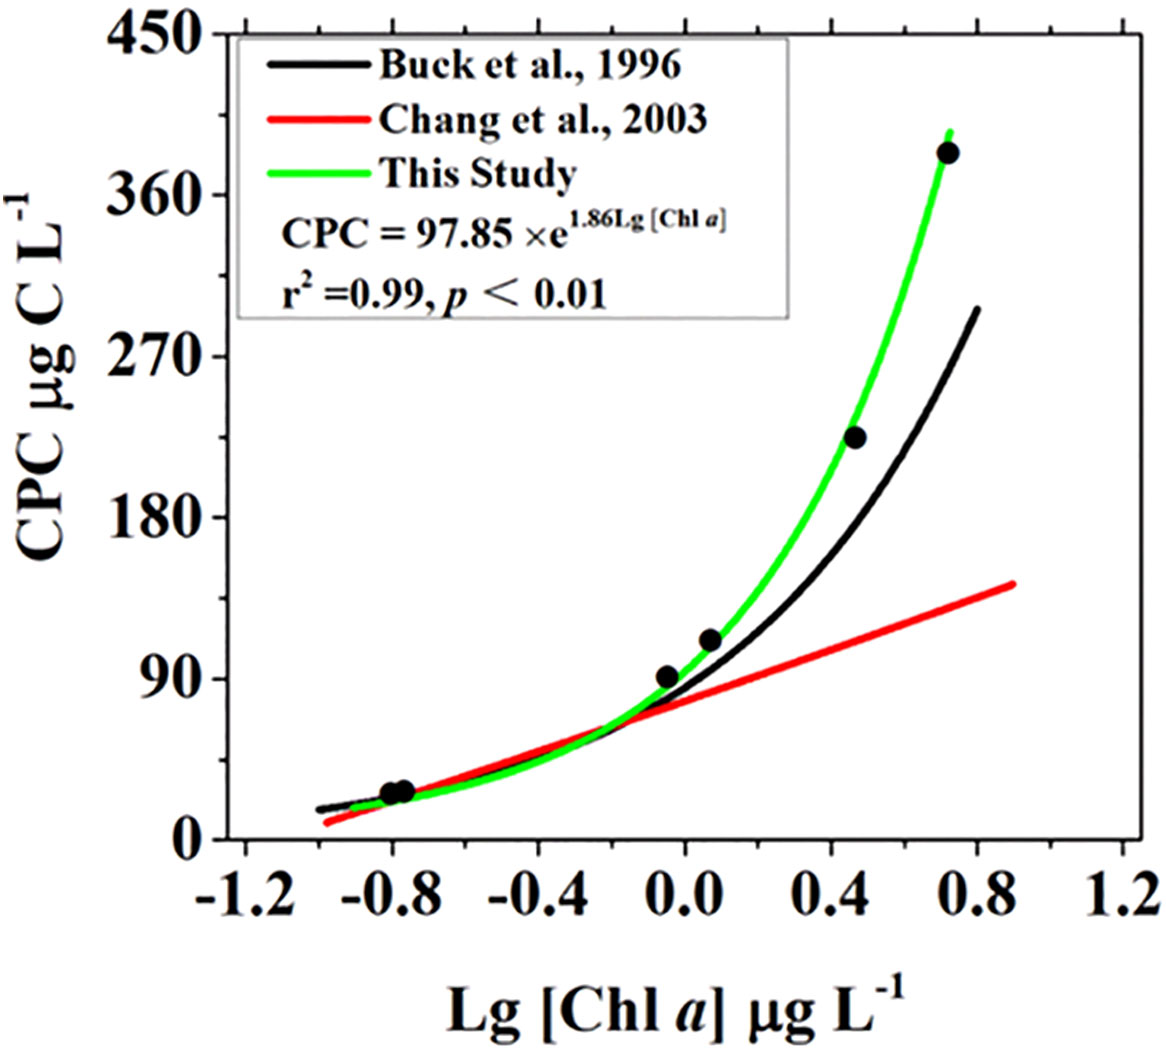
Figure 9 Relationship between phytoplankton carbon based on cell volume (CPC) and logarithmic transformation Chl a concentration in the present study. The logarithmic model (curve in green and formula) was the results in the present study, and curves in black and red were the results in the studies by Buck et al. (1996) and Chang et al. (2003), respectively.
3.5.3 Phytoplankton carbon content
Estimated CPC by exponential relationship in Figure 9 ranged from 11.0 µg C L−1 to 433 µg C L−1 (84.7 µg C L−1 ± 10.3 µg C L−1), which was slightly lower than NPC (89.9 µg C L−1 ± 10.4 µg C L−1), which was derived from the linear regression of POC and Chl a, in the whole study area (Figures 10A, C). Phytoplankton carbon and non-phytoplankton carbon based on the two methods were very high in the PRE and gradually decreased toward the open sea (Figure 10). Among the water masses, the phytoplankton carbon content estimated using the two methods was similar, decreasing from PRW to PDW to SSW (Figures 11A, D). Meanwhile, the contribution of phytoplankton carbon to POC was significantly higher at PRW stations than at PDW stations based on the two methods, respectively, but no significant difference was observed between PDW and SSW stations (Figures 11C, F).
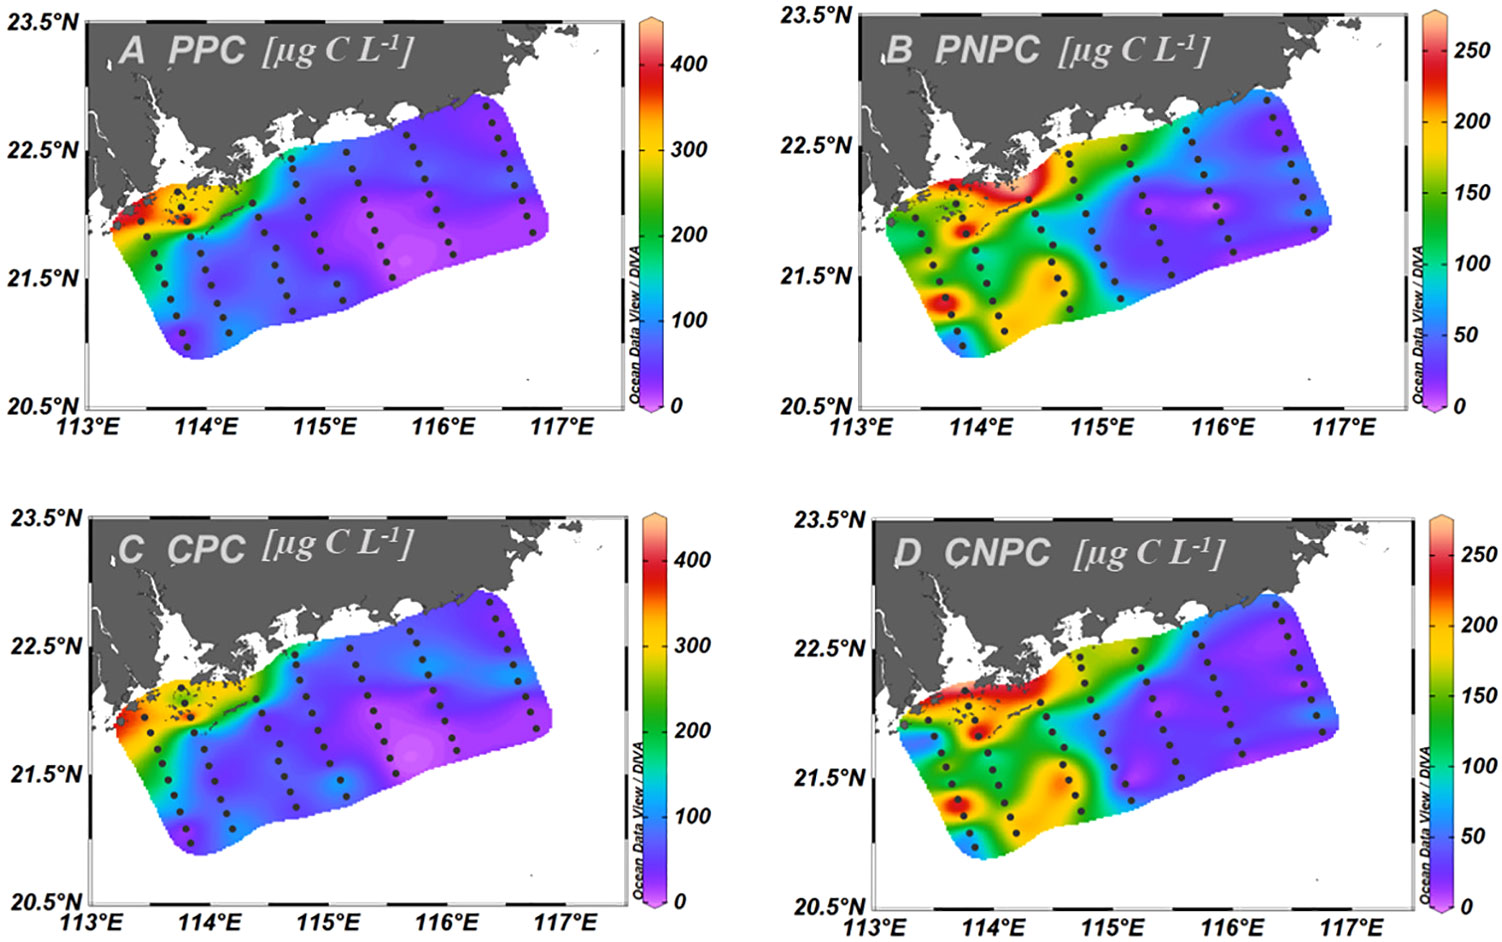
Figure 10 Horizontal distributions of phytoplankton and non-phytoplankton carbon contents based on two methods. PPC (A) and PNPC (B) represented estimated phytoplankton and non-phytoplankton carbon by the linear regression of POC and Chl a, respectively; CPC (C) and CNPC (D) represented estimated phytoplankton and non-phytoplankton carbon by the exponential regression of phytoplankton carbon by cells volume and the logarithm of Chl a, respectively.
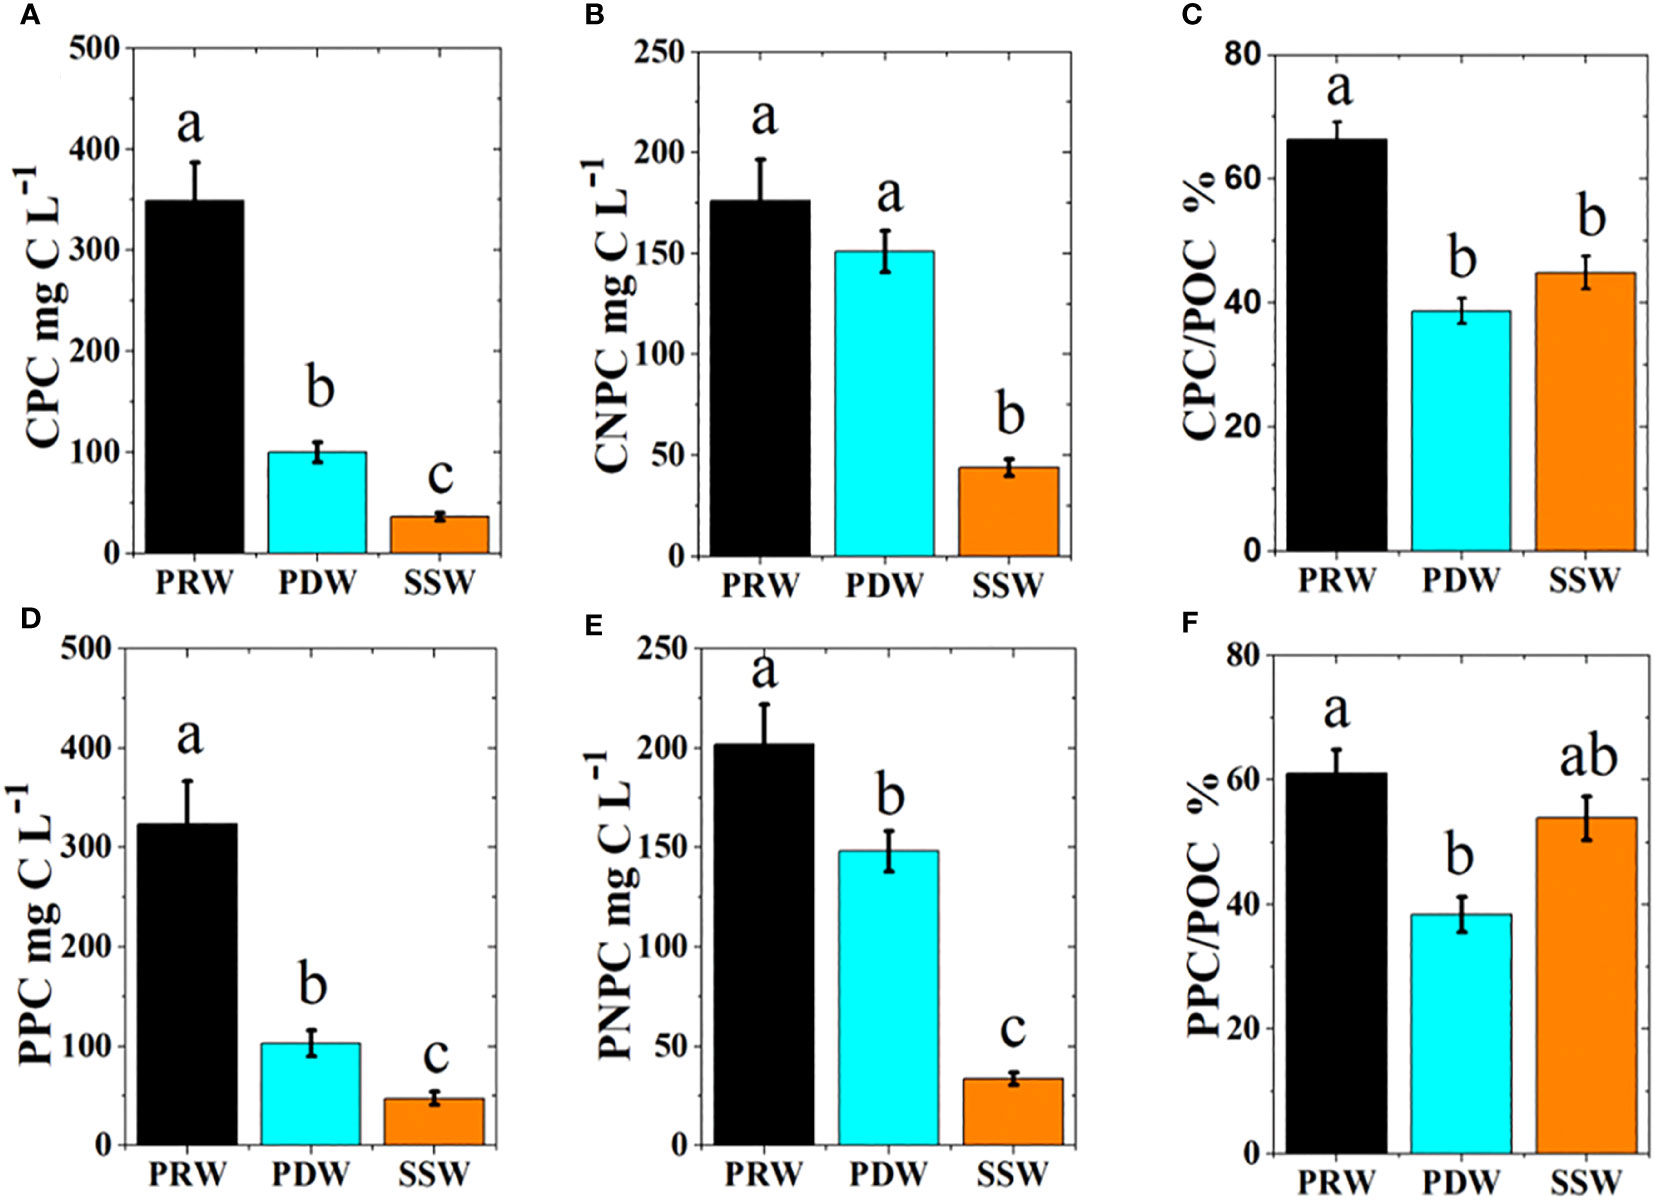
Figure 11 Comparison of phytoplankton and non-phytoplankton carbon contents (mean ± SE) based on two methods between three water masses with different color columns. The different letters (a, b, c) in each plot indicate significant differences in parameters between three water masses at least p<0.05. CPC (A) and CNPC (B) represented estimated phytoplankton and non-phytoplankton carbon by the exponential regression of phytoplankton carbon by cells volume and the logarithm of Chl a, respectively; The contribution CPC to POC (C); PPC (D) and PNPC (E) represented phytoplankton and non-phytoplankton carbon by the linear regression of POC and Chl a, respectively; The contribution PPC to POC (F).
4 Discussion
4.1 Hydrodynamics influence on physiochemical parameters
The physiochemical parameters exhibited clear horizontal gradients at the surface from inshore to offshore in the NSCS during summer (Figures 2, 3; Figure S2), which were subjected to the effect of the PRP (Xu et al., 2008; Xu et al., 2018). The PRP discharge with high nutrients (Yin et al., 2000; Cai et al., 2004) and particulate organic matter (Ye et al., 2017) flowed out of the estuary and moved eastward, resulting in a decrease in nutrient, Chl a, and POC concentrations from inshore to offshore (Figure 3; Figure S2). Meanwhile, the N:P ratio varied spatially (Figure 3F; Figure S2D), suggesting that limiting nutrients shifted from potential phosphorus limitation (P limitation) in the PRP-impacted regime to nitrogen limitation (N limitation) in the oligotrophic regime with no influence of PRP in the NSCS (Yin et al., 2001; Xu et al., 2008).
Upwelling occurs in the Yuedong coastal area in the NSCS, which can bring low-temperature and high-nutrient bottom water to the surface (Shu et al., 2018). Weak upwelling was detected with a strong influence on the hydrodynamics in the subsurface layer (Figures S5, S6), but less effect on the surface layer (Figure S2), indicating that there was little influence on surface Chl a and POC concentrations at upwelling stations (Figure S2). Meanwhile, the anticyclonic eddy originating from the continental shelf can cause low surface nutrient concentrations (Wang et al., 2017; Chen and Liu, 2023), which was responsible for the lower Chl a and POC concentrations compared to the surrounding area (Figure S2).
4.2 Estimate of carbon content and C:Chl a ratio of phytoplankton
Currently, there is no consistent approach to quantify the phytoplankton carbon content and C:Chl a ratio of phytoplankton. Phytoplankton carbon content derived from the cell volume of phytoplankton (CPC) was thought to be more accurate than PPC, which was derived from the linear regression of POC and Chl a, although there is uncertainty induced by differences in the geometric shape of phytoplankton, particularly for cells with complex shapes and the carbon density per cell volume (Menden-Deuer and Lessard, 2000; Dembowska et al., 2018). The relationship between CPC and the logarithm of Chl a concentrations fit well with the exponential curve (Figure 9), suggesting that the cell volume-based method was robust in quantifying phytoplankton carbon content and that the estimated CPC was rational, likely because this method mitigated the errors of the C:Chl a ratio caused by differences in phytoplankton species in marine environments (Buck et al., 1996). Our results showed that the C:Chl a ratio derived from the linear regression of POC and Chl a varied spatially over a broad range and had large deviations between all stations and different water masses (Figure 8, Table 2), which was most likely related to shifts in phytoplankton community composition among water masses (Figures 6, 7). Previous studies have shown that the phytoplankton community composition plays an important role in mediating the C:Chl a ratio (Sathyendranath et al., 2009; Yacobi and Zohary, 2010). As a result, the mean C:Chl a ratio derived from the linear regression of POC and Chl a was biased over a certain area where phytoplankton community composition was highly variable in the present study. Although the C:Chl a ratio obtained by the exponential relationship between CPC and the logarithm of Chl a concentrations fit into the 95% confidence interval of the results derived from the linear regression of POC and Chl a (Table 2), PPC and C:Chl a based on the linear regression of POC and Chl a were greatly overestimated in oligotrophic waters with low phytoplankton carbon contents (Figure 12). Our study area spans a large environmental gradient from eutrophic to oligotrophic waters. Hence, the relationship between CPC and the logarithm of Chl a concentrations obtained in the present study, in combination with ambient Chl a concentrations, could be robust in predicting phytoplankton carbon content in the NSCS.
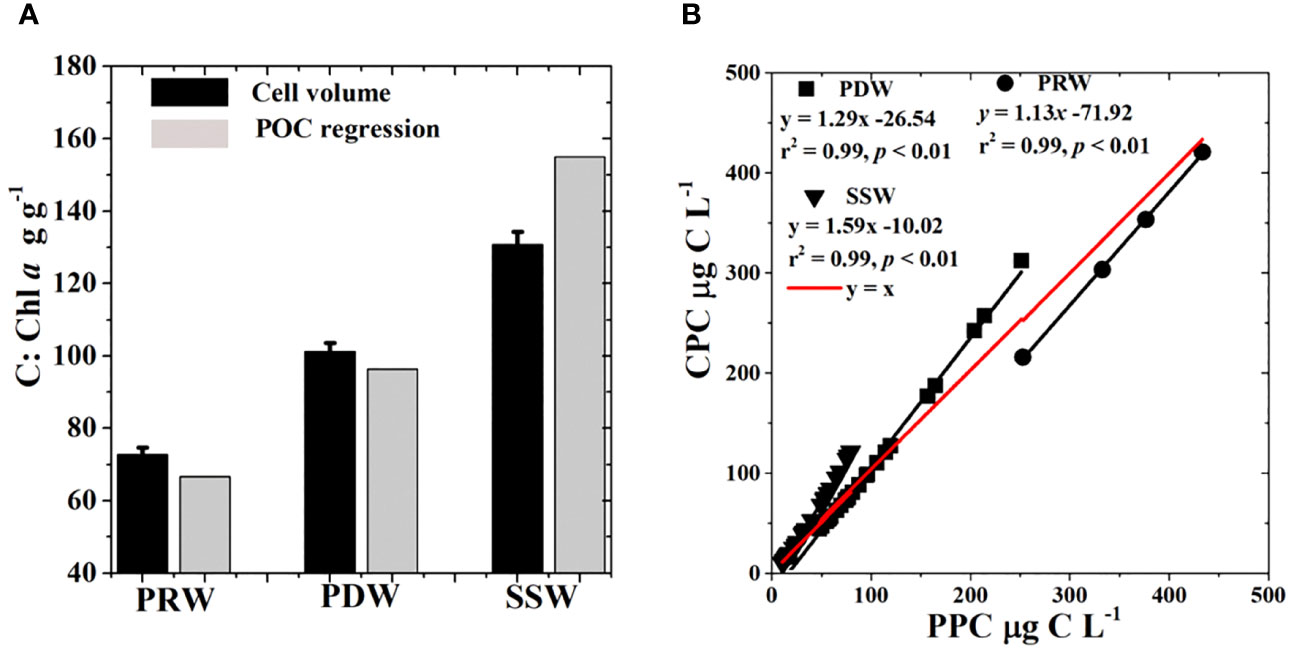
Figure 12 Comparisons of mean C:Chl a ratios (mean ± SE) by two methods (A) and relationships between CPC and PPC (B) among different water masses. CPC, Estimated phytoplankton carbon by the exponential regression of phytoplankton carbon by cells volume and the logarithm of Chl a; PPC, Estimated phytoplankton carbon by the linear regression of POC and Chl a.
4.3 Hydrodynamics shapes phytoplankton community, carbon content, and C:Chl a ratio
The PRP delivered a large amount of nutrients to the coastal waters, resulting in a high abundance of micro-phytoplankton (e.g., diatoms and dinoflagellates) and carbon content at the PRW stations (Figures 4, 5, 10, 11). Diatoms prefer to grow in nearshore areas with high nutrients (Liu et al., 2007a; Wei et al., 2018; Zhong et al., 2021), which is responsible for the extremely high contribution (96%) of diatoms to the total phytoplankton abundance based on microscopy at PRW stations (Figures 4, 5). High nutrients accelerated the growth of small diatoms and led to the predominance of small chain-forming diatoms (Wang et al., 2009b), especially in S. costatum (Qiu et al., 2010; Zhong et al., 2021), which resulted in the growth preponderance of species in Class A (Figures 6, 7) and a high contribution of the diatom carbon content (Station 1, Table S1, Table 3) at PRW stations. The predominance of chain-forming diatom species in Class B, such as Asterionella glacialis and Pseudo-nitzschia pungen, has been documented in coastal areas with low salinity at PDW stations (Liu et al., 2007a; Wei et al., 2018). In contrast, dinoflagellates tend to be more competitive in relatively oligotrophic environments because of their ability to migrate and graze as heterotrophic organisms (Wells et al., 2020; Cheung et al., 2021). Dinoflagellates were classified as Class B and Class C, which were negatively correlated with the nutrient concentrations in this study (Figure 6). As a result, the contributions of dinoflagellate carbon content increased from PRW to PDW, and to SSW stations (Table S1, Table 3), whereas diatom growth advantages gradually decreased from inshore to offshore, as indicated by a decline in the ratios of Dia./Din.A and Dia./Din.S from in shore to offshore (Figure 5; Figure S3). Pro and Trichodesmium spp. in Class E (Figure 6) only appeared at oligotrophic SSW stations, especially at stations influenced by the anticyclonic eddy (Figure 4; Table 3). In general, Prochlorococcus (Pro) is the most abundant in the high temperature and salinity, oligotrophic oceans (Chen et al., 2011; Wei et al., 2020). Hence, shifts in phytoplankton community composition are closely linked to changes in the environmental conditions induced by hydrodynamics. Meanwhile, the phytoplankton diversity index H’ and evenness index J gradually increased from inshore to offshore (Figure 5; Figure S3), indicating an increase in phytoplankton community stability.
The C:Chl a ratios increased from the averages of 72.7 ± 2.00 g g−1 at PRW stations, to 101 ± 2.42 g g−1 at PDW stations and to 131 ± 3.48 g g−1 at SSW stations, accompanied by a shift in phytoplankton community composition and carbon contribution (Tables 2, 3), in agreement with previous reports (Chang et al., 2003). A shift from high diatom carbon contribution in the PRP-impacted area (PRW and PDW), to increased dinoflagellate carbon contribution at PDW stations and to the dominance of cyanobacterial carbon contribution at SSW stations was responsible for the spatial variability in the C:Chl a ratio (Tables 2, 3). Based on laboratory experiments (Verity, 1981; Liu et al., 2023) and field observations (Sathyendranath et al., 2009), diatoms tend to have low C:Chl a ratios. In contrast, dinoflagellates usually have higher C:Chl a ratios because of their lower pigment content than that of diatoms (Chan, 1980; Sathyendranath et al., 2009; Liu et al., 2021). Cyanobacteria (Pro and Syn) are reported to have higher C:Chl a ratios than diatoms and dinoflagellates, because Pro and Syn take divinyl chlorophyll a and phycobiliprotein as the major photosynthetic pigments instead of Chl a, respectively (Sathyendranath et al., 2009; Yacobi and Zohary, 2010). The C:Chl a ratio of Trichodesmium trichomes has been reported to be up to 200 g g−1 (Carpenter, 1983).
Phytoplankton generally exhibit high C:Chl a ratios in the senescent stage but low C:Chl a ratios in the exponential stage (Cloern et al., 1995). Hence, nutrient limitation also regulates the C:Chl a ratio. N:P ratio varied spatially from 224 ± 64.5 at PRW stations to 89.7 ± 19.3 at PDW stations, to 7.73 ± 2.57 at SSW stations (Figure 3F), indicating a shift from potential P limitation at PRW and PDW stations to N limitation at SSW stations, in agreement with previous reports (Yin et al., 2001; Xu et al., 2008). Trichodesmium spp. are considered indicators of N limitation in oceans (Heimann and Cirés, 2015). The occurrences of Trichodesmium spp. and low N:P ratios occurred only at SSW stations (Figures 3F, 4E) showing N limitation at the SSW stations. A shift from P limitation at PRW and PDW stations to N limitation at SSW stations, as indicated by N:P ratios, was possibly partly responsible for an increase in the C:Chl a ratios from PRW stations to PDW stations, to SSW stations, because phytoplankton tend to have high C:Chl a ratios under nutrient limitation (Hunter and Laws, 1981; Taylor et al., 1997), particularly under N limitation (Harrison et al., 1990). Although potential P limitation occurred at PRW and PDW stations, different DIP levels (Figure 3E) were partly responsible for the different phytoplankton community compositions and resultant C:Chl a ratios in these two oceanographic regimes (Table 2).
The dominant species were clustered into Class D (Figure 6) in response to low temperatures at the upwelling stations (Figure 2). Weak upwelling had little effect on phytoplankton abundance (Figure 4A) and carbon content (Figure 10) but enhanced Syn abundance during the sampling period (Figure 4G). Similar results have been reported previously (Zhong et al., 2019). In general, anticyclonic eddies cause low nutrient concentrations in the photic zone (Wang et al., 2017; Chen and Liu, 2023), which was responsible for the low phytoplankton abundance and carbon content in the present study (Figures 4, 10). High abundances of Pro and Trichodesmium spp. were detected at stations influenced by the anticyclonic eddy (Figures 4E, F), in agreement with previous reports in anticyclonic eddies (Hernández et al., 2020; Karnan et al., 2021).
The community composition and biomass of phytoplankton are also mediated by predators. Chen et al. (2013) suggested that micro-zooplankton graze 73% of the daily primary production in the NSCS in summer. Phytoplankton of different size fractions are subjected to different grazing pressures, ultimately leading to shifts in the phytoplankton community in the PRE (Dong et al., 2021). Meso-zooplankton grazing also regulates phytoplankton biomass, which consumed 0.7%–21.5% of phytoplankton Chl a standing stocks daily, with a higher percentage in the plume-impact area than in the open sea in summer in the NSCS (Chen et al., 2015). Viral lysis also affects the phytoplankton community and biomass. For example, a study in the North Atlantic Ocean showed that virus-induced mortality is an important factor for phytoplankton loss in low- and mid-latitude oceans (Mojica et al., 2016). In the Southern Ocean, viral lysis is responsible for approximately half (58%) of the seasonal phytoplankton carbon losses and shifts in phytoplankton community through selective viral infection in different species (Biggs et al., 2021).
5 Conclusions
The phytoplankton community and C:Chl a ratio varied spatially in response to alterations in hydrodynamics in the NSCS in summer. Nutrient enrichment favored the growth of small-chain diatoms in the PRE, resulting in a high abundance of diatoms and enhanced phytoplankton carbon content. Shifts in the phytoplankton community and carbon content were closely linked to the hydrodynamic processes from nearshore to offshore. A shift in the dominant phytoplankton species from small-chain diatoms to large diatoms and dinoflagellates was driven by reduced nutrient concentrations and increased salinity from nearshore to offshore, leading to an increase in phytoplankton community stability from nearshore to offshore. The exponential relationship between phytoplankton carbon content derived from the cell volume (CPC) and the logarithm of Chl a concentrations obtained, which mitigated the errors induced by differences in phytoplankton community composition, was more robust in estimating phytoplankton carbon content and the C:Chl a ratio than that derived from the linear regression between POC and Chl a concentrations. The phytoplankton C:Chl a ratio gradually increased from nearshore to offshore, which was attributed to shifts in phytoplankton communities across marine environments. The high C:Chl a ratio was attributed to nitrogen limitation and dominance of cyanobacteria at oligotrophic SCS surface stations. The low C:Chl a ratio was attributed to the high abundance of diatoms at the eutrophic PRE stations. The relationship between CPC and Chl a concentrations obtained in this study might be useful for more accurate estimations of phytoplankton carbon content and the C:Chl a ratio in marine environments with diverse phytoplankton species. Our findings deepen our understanding of the links between hydrodynamics, phytoplankton community composition, and the C:Chl a ratio in oceans.
Data availability statement
The original contributions presented in the study are included in the article/Supplementary Material. Further inquiries can be directed to the corresponding author.
Author contributions
DC: Investigation, Writing – original draft, Data curation, Software, Writing – review & editing. ZS: Data curation, Investigation, Writing – review & editing. RL: Investigation, Software, Writing – original draft. XL: Data curation, Investigation, Writing – review & editing. YC: Investigation, Writing – original draft. JX: Funding acquisition, Methodology, Resources, Writing – review & editing.
Funding
The author(s) declare financial support was received for the research, authorship, and/or publication of this article. This research was financially supported by the National Natural Science Foundation of China (U20A20103, 42049907), CORE project (EF012/FST-XJ/2023/HKUST), UM internal fund (MYRG 2022-00184-FST, SP2023-00002-CRO, and SRG 2022-00017-FST), and GuangDong Basic and Applied Basic Research Foundation (2021A1515012577).
Acknowledgments
We thank the captains and crew of R/V ShiYan 2 and all scientists and technicians who helped with sample collection and CTD data during the cruise.
Conflict of interest
The authors declare that the research was conducted in the absence of any commercial or financial relationships that could be construed as a potential conflict of interest.
The author(s) declared that they were an editorial board member of Frontiers, at the time of submission. This had no impact on the peer review process and the final decision.
Publisher’s note
All claims expressed in this article are solely those of the authors and do not necessarily represent those of their affiliated organizations, or those of the publisher, the editors and the reviewers. Any product that may be evaluated in this article, or claim that may be made by its manufacturer, is not guaranteed or endorsed by the publisher.
Supplementary material
The Supplementary Material for this article can be found online at: https://www.frontiersin.org/articles/10.3389/fmars.2023.1293354/full#supplementary-material
References
Banse K. (1977). Determining the carbon-to-chlorophyll ratio of natural phytoplankton. Mar. Biol. 41, 199–212. doi: 10.1007/BF00394907
Behrenfeld M. J., O’Malley R. T., Boss E. S., Westberry T. K., Graff J. R., Halsey K. H., et al. (2016). Revaluating ocean warming impacts on global phytoplankton. Nat. Climate Change. 6 (3), 323–330. doi: 10.1038/NCLIMATE2838
Biggs T. E. G., Huisman J., Brussaard C. P. D. (2021). Viral lysis modifies sea sonal phytoplankton dynamics and carbon flow in the Southern Ocean. ISME J. 15 (12), 3615–3622. doi: 10.1038/s41396-021-01033-6
Buck K. R., Chavez F. P., Campbell L. (1996). Basin-wide distributions of living carbon components and the inverted trophic pyramid of the central gyre of the North Atlantic Ocean, Summer 1993. Aquat. Microbial Ecology. 10 (3), 283–298. doi: 10.3354/ame010283
Cai W. J., Dai M. H., Wang Y. C., Zhai W. D., Huang T., Chen S. T., et al. (2004). The biogeochemistry of inorganic carbon and nutrients in the Pearl River estuary and the adjacent Northern South China Sea. Continental Shelf Res. 24 (12), 1301–1319. doi: 10.1016/j.csr.2004.04.005
Carpenter E. J. (1983). Physiology and ecology of marine planktonic Ocsillatoria (Trichodesmium). Mar. Biol. Letters. 4 (2), 69–85.
Chan A. T. (1980). Comparative physiological study of marine diatoms and dinoflag-ellates in relation to irradiance and cell size. II. relationship between photosynthesis, growth, and carbon/chlorophyll a ratio. J. Phycology. 16 (3), 428–432. doi: 10.1111/j.1529-8817.1980.tb03056.x
Chang J., Shiah F. K., Gong G. C., Chiang K. P. (2003). Cross-shelf variation in carbon-to-chlorophyll a ratios in the east China sea, summer 1998. Deep Sea Res. Part II. 50 (6-7), 1237–1247. doi: 10.1016/S0967-0645(03)00020-1
Chen B. Z., Wang L., Song S. Q., Huang B. Q., Sun J., Liu H. B. (2011). Com-parisons of picophytoplankton abundance, size, and fluorescence between summer and winter in northern South China Sea. Continental Shelf Res. 31 (14), 1527–1540. doi: 10.1016/j.csr.2011.06.018
Chen B., Zheng L., Huang B., Song S., Liu H. (2013). Seasonal and spatial comparisons of phytoplankton growth and mortality rates due to microzooplankton grazing in the northern South China Sea. Biogeosciences. 10 (4), 2775–2785. doi: 10.5194/bg-10-2775-2013
Chen J. Z., Liu F. F. (2023). Effects of mesoscale eddies in the Northern South China Sea on phytoplankton size and physiological status. Remote Sens. 15, 245. doi: 10.3390/rs15010245
Chen M. R., Liu H. B., Song S. Q., Sun J. (2015). Size-fractionated mesozoo-plankton biomass and grazing impact on phytoplankton in northern South China Sea during four seasons. Deep-Sea Res. Part II. 117, 108–118. doi: 10.1016/j.dsr2.2015.02.026
Chen X. R., Zhu J., Sun Z. Y., Hu J. Y. (2018). Observation and analysis of the extension characteristics of the Pearl River diluted water from July to August in 2015. J. Xiamen University. 57 (6), 841–848. doi: 10.6043/j.issn.0438-0479.201805030
Cheung Y. Y., Cheung S. Y., Mak J. L., Liu K. L., Xia X. M., Zhang X. D., et al. (2021). Distinct interaction effects of warming and anthropogenic input on diatoms and dinoflagellates in an urbanized estuarine ecosystem. Global Change Biol. 27 (15), 3463–3473. doi: 10.1111/gcb.15667
Cloern J. E., Grenz C., Vidergar L. L. (1995). An empirical model of the phyto-plankton chlorophyll: carbon ratio-the conversion factor between productivity and growth rate. Limnol. Oceanogr. 40, 1313–1321. doi: 10.4319/lo.1995.40.7.1313
Dembowska E. A., Mieszczankin T., Napiorkowski P. (2018). Changes of the phytoplankton community as symptoms of deterioration of water quality in a shallow lake. Environ. Monit. Assess. 190 (2), 95. doi: 10.1007/s10661-018-6465-1
Dong Y., Li Q., Wu Z. C., Shui Y. P., Liu Z. J., Ge Z. M., et al. (2021). Biophysical controls on seasonal changes in the structure, growth, and grazing of the size-fractionated phytoplankton community in the northern South China Sea. Biogeosciences. 18 (24), 6423–6434. doi: 10.5194/bg-18-6423-2021
Falkowski P. G., Barber R. T., Smetacek V. (1998). Biogeochemical controls and feedbacks on ocean primary production. Science. 281, 200–206. doi: 10.1126/science.281.5374.200
Falkowski P. G., Owens T. G. (1980). Light shade adaptation-2 strategies in marine phytoplankton. Plant Physiol. 66, 592–595. doi: 10.1104/pp.66.4.592
Francé J., Varkitzi I., Stanca E., Cozzoli F., Skejic S., Ungaro N., et al. (2021). Large-scale testing of phytoplankton diversity indices for environmental assessment in Mediterranean sub-regions (Adriatic, Ionian and Aegean Seas). Ecol. Indicators. 126, 107630. doi: 10.1016/j.ecolind.2021.107630
Gui J., Wei Y. Q., Sun J., Le F. F., Cai Y. M., Ning X. R. (2020). Summer phytoplankton assemblages and carbon biomass in the northern South China Sea. Continental Shelf Res. 210, 104276. doi: 10.1016/j.csr.2020.104276
Hansen H. P., Koroleff F. (2007). “Determination of nutrients,” in Methods of seawater analysis, 3rd ed. Germany: WILEY-VCH Verlag GmbH159–228. doi: 10.1002/9783527613984.ch10
Harrison P. J., Thomsen H. A., Calderwood G. S. (1990). Effects of nutrient and light limitation on the biochemical composition of phytoplankton. J. Appl. Phycol. 2, 45–56. doi: 10.1007/BF02179768
Harrison P. J., Zingone A., Mickelson M. J., Lehtinen S., Ramaiah N., Kraberg A. C., et al. (2015). Cell volumes of marine phytoplankton from globally distributed coastal data sets. Estuarine Coast. Shelf Science. 162, 130–142. doi: 10.1016/j.ecss.2015.05.026
Heimann K., Cirés S. (2015). “N2-fixing cyanobacteria: ecology and biotechnological applications,” in Handbook of marine microalgae: biotechnolgy advances. Ed. Kim S.-K. (London, UK: Academic Press), 501–515. doi: 10.1016/B978-0-12-800776-1.00033-9
Hernández H. N., Arístegui J., Montero M. F., Velasco-Senovilla E., Baltar F., Marrero-Díaz Á., et al. (2020). Drivers of plankton distribution across mesoscale eddies at submesoscale range. Front. Mar. Sci. 7. doi: 10.3389/fmars.2020.00667
Hunter B. L., Laws E. A. (1981). ATP and chlorophyll a as estimators of phytoplankton carbon biomass. Limnology Oceanography. 26 (5), 944–956. doi: 10.4319/lo.1981.26.5.0944
Jakobsen H. H., Markager S. (2016). Carbon-to-chlorophyll ratio for phytoplankton in temperate coastal waters: Seasonal patterns and relationship to nutrients. Limnology Oceanography. 61, 1853–1868. doi: 10.1002/lno.10338
Karnan C., Retnamma J., Arunpandi N., Subramanian P. R., Singaram P., Shoba S. (2021). Microplankton size structure induced by a warm-core eddy in the western Bay of Bengal: Role of Trichodesmium abundance. Oceanologia. 63 (24), 283–300. doi: 10.1016/j.oceano.2021.02.003
Liu H., Chang J., Tseng C. M., Wen L. S., Liu K. K. (2007b). Seasonal variability of picoplankton in the Northern South China Sea at the SEATS station. Deep Sea Res. II. 54, 1602–1616. doi: 10.1016/j.dsr2.2007.05.004
Liu K. K., Chen Y. J., Tseng C. M., Lin L. L., Hong B. L., Snidvongs A. (2007a). The significance of phytoplankton photo-adaptation and benthic–pelagic coupling to primary production in the South China Sea: Observations and numerical investigations. Deep-Sea Res. II. 54, 1546–1574. doi: 10.1016/j.dsr2.2007.05.009
Liu X. F., Liu. Y., Noman A., Sun J. (2021). Physiological changes and elemental ratio of Scrippsiella trochoidea and Heterosigma akashiwo in different growth phase. Water. 12 (2), 132. doi: 10.3390/W13020132
Liu X. F., Sun J., Wei Y. Q., Liu Y. (2023). Relationship between cell volume and particulate organic matter for different size phytoplankton. Mar. pollut. Bulletin. 194, 115298. doi: 10.1016/j.marpolbul.2023.115298
Markager S., Sand-Jensen K. (1994). The physiology and ecology of light-growth relationship in macroalgae. Prog. Phycological Res. 10, 209–298.
Markager S., Sand-Jensen K. (1996). Implications of thallus thickness for growth irradiance relationships of marine macroalgae. Eur. J. Phycol. 31, 79–87. doi: 10.1080/0967026960065123
Menden-Deuer S., Lessard E. J. (2000). Carbon to volume relationships for dinoflagellates, diatoms, and other protist plankton. Limnology Oceanography. 45 (3), 569–579. doi: 10.4319/lo.2000.45.3.0569
Mojica K. D. A., Huisman J., Wilhelm S. W., Brussaard C. P. D. (2016). Latitudinal variation in virus-induced mortality of phytoplankton across the North Atlantic Ocean. ISME J. 10 (2), 500–513. doi: 10.1038/ismej.2015.130
Parsons T. R., Maita Y., Lalli C. M. (Eds.) (1984). A manual of chemical and biological methods for seawater analysis (Oxford: Pergamum Press).
Pielou E. C. (1969). An introduction to mathematical ecology (New York, US: Wiley-Interscience), 286p.
Qiu D., Huang L., Zhang J., Lin S. (2010). Phytoplankton dynamics in and near the highly eutrophic Pearl River Estuary, South China Sea. Continental Shelf Res. 30 (2), 177–186. doi: 10.1016/j.csr.2009.10.015
Sathyendranath S., Stuart V., Nair A., Oka K., Nakane T., Bouman H., et al. (2009). Carbon-to-chlorophyll ratio and growth rate of phytoplankton in the sea. Mar. Ecol. Prog. Ser. 383, 73–84. doi: 10.3354/meps07998
Shannon C. E. (1948). A mathematical theory of communication. Bell System Tech. J. 27 (3), 379–423. doi: 10.1002/j.1538-7305.1948.tb01338.x
Shu Y. Q., Wang Q., Zu T. T. (2018). Progress on shelf and slope circulation in the northern South China Sea. Sci. China Earth Sci. 61, 560–571. doi: 10.1007/s11430-017-9152-y
Soria P. S., García R. E., Papaspyrou S., Aguilar V., Seguro I., Acuna J., et al. (2017). Size fractionated phytoplankton biomass and net metabolism along a tropical estuarine gradient. Limnology Oceanography. 62, S309–S326. doi: 10.1002/lno.10562
Stemmann L., Boss E. (2012). Plankton and particle size and packaging: from determining optical properties to driving the biological pump. Ann. Rev. Mar. Sci. 4, 263–290. doi: 10.1146/annurev-marine-120710-100853
Taylor A. H., Geider R. J., Gilbert F. J. H. (1997). Seasonal and latitudinal dependencies of phytoplankton carbon-to-chlorophyll a ratios: results of a modelling study. Mar. Ecol. Prog. Series. 152, 51–66. doi: 10.3354/meps152051
Tomas C. R. (1996). Identifying marine diatoms and dinoflagellates (San Diego: Academic Press), 598 pp.
Utermöhl H. (1958). Zur Vervollkommnung der quantitativen Phytoplankton-Methodik Mitteilungen Internationale Vereinigung Theoretische und Angewandte. Limnologie. 9 (1), 1–38.
Verity P. G. (1981). Effects of temperature, irradiance, and daylength on the marine diatom Leptocylindrus danicus Cleve.1. Photosynthesis and cellular composition. J. Exp. Mar. Biol. Ecol. 55, 79–91. doi: 10.1016/0022-0981(81)90094-0
Wang X. J., Behrenfeld M., Borgne R. L., Murtugudde R., Boss E. (2009a). Regulation of phytoplankton carbon to chlorophyll ratio by light, nutrients and temperature in the equatorial Pacific Ocean: a basin-scale model. Biogeosciences. 6 (3), 391–404. doi: 10.5194/bg-6-391-2009
Wang C., Guo W., Li Y., Stubbins A., Li Y., Song G., et al. (2017). Hydrological and biogeochemical controls on absorption and fluorescence of dissolved organic matter in the northern South China Sea. J. Geophysical Research: Biogeosciences. 122, 3405–3418. doi: 10.1002/2017JG004100
Wang Z. H., Zhao J. G., Zhang Y. J., Cao Y. (2009b). Phytoplankton community structure and environmental parameters in aquaculture areas of Daya Bay, South China Sea. J. Environ. Sci. 21 (9), 1268–1275. doi: 10.1016/S1001-0742(08)62414-6
Wei Y., Huang D., Zhang G., Zhao Y., Sun J. (2020). Biogeographic variations of picophytoplankton in three contrasting seas: the bay of bengal, South China Sea and western Pacific Ocean. Aquat. Microb. Ecol. 84, 91–103. doi: 10.3354/ame01928
Wei Y. Q., Liu H. J., Zhang X. D., Xue B., Munir S., Sun J. (2017). Physicochemical conditions in affecting the distribution of spring phytoplankton community. Chin. J. Oceanology Limnology. 35 (6), 1342–1361. doi: 10.1007/s00343-017-6190-6
Wei N., Satheeswaran T., Jenkinsone I. R., Xue B., Wei Y. Q., Liu H. J., et al. (2018). Factors driving the spatiotemporal variability in phytoplankton in the Northern South China Sea. Continental Shelf Res. 162, 48–55. doi: 10.1016/j.csr.2018.04.009
Wells M. L., Karlson B., Wulff A., Kudela R., Trick C., Asnaghi V., et al. (2020). Future HAB science: Directions and challenges in a changing climate. Harmful Algae. 91, 101632. doi: 10.1016/j.hal.2019.101632
Xu J., Li X. F., Shi Z., Li R. H., Li Q. (2018). Bacterial carbon cycling in the river plume in the northern South China sea during summer. J. Geophysical Res. 123 (11), 8106–8121. doi: 10.1029/2018JC014277
Xu J., Yin K. D., He L., Yuan X. C., Ho A. Y. T., Harrison P. J. (2008). Phosphorus limitation in the northern South China Sea during late summer: Influence of the Pearl River. Deep Sea Res. Part I. 55 (10), 1330–1342. doi: 10.1016/j.dsr.2008.05.007
Yacobi Y., Zohary T. (2010). Carbon: chlorophyll a ratio, assimilation numbers and turnover times of Lake Kinneret phytoplankton. Hydrobiologia. 639 (1), 185–196. doi: 10.1007/s10750-009-0023-3
Yamaji I. (1966). Illustrations of the marine plankton of Japan (Osaka: Hoikusha Publishing Co.Ltd.), 1–538.
Ye F., Guo W., Shi Z., Jia G. D., Wei G. J. (2017). Seasonal dynamics of particulate organic matter and its response to flooding in the pearl river estuary, China, revealed by stable isotope (δ13C and δ15N) analyses. J. Geophysical Research: Oceans. 122 (8), 6835–6856. doi: 10.1002/2017JC012931
Yin K. D., Qian P. Y., Chen J. C., Hsieh D. P. H., Harrison P. J. (2000). Dynamics of nutrients and phytoplankton biomass in the Pearl River estuary and adjacent waters of Hong Kong during summer: preliminary evidence for phosphorus and silicon limitation. Mar. Ecol. Prog. Series. 194, 295–305. doi: 10.3354/meps194295
Yin K. D., Qian P. Y., Wu M. C. S., Chen J. C., Huang L. M., Song X. Y. (2001). Shift from P to N limitation of phytoplankton growth across the Pearl River estuarine plume during summer. Mar. Ecol. Prog. Series. 221, 17–28. doi: 10.3354/meps221017
Yu X. Y., Xu J., Long A. M., Li R. H., Shi Z., Li Q. P. (2020). Carbon-to-chlorophyll ratio and carbon content of phytoplankton community at the surface in coastal waters adjacent to the zhujiang river estuary during summer. Acta Oceanologica Sinica. 39 (2), 123–131. doi: 10.1007/s13131-020-1556-6
Zhong Y. P., Hu J., Laws E. A., Liu X., Chen J. X., Huang B. Q. (2019). Plankton community responses to pulsed upwelling events in the southern Taiwan Strait. ICES J. Mar. Science. 76 (7), 2374–2388. doi: 10.1093/icesjms/fsz142
Keywords: hydrodynamics, Pearl River plume, phytoplankton community, phytoplankton carbon, C:Chl a ratio
Citation: Chen D, Shi Z, Li R, Li X, Cheng Y and Xu J (2023) Hydrodynamics drives shifts in phytoplankton community composition and carbon-to-chlorophyll a ratio in the northern South China Sea. Front. Mar. Sci. 10:1293354. doi: 10.3389/fmars.2023.1293354
Received: 13 September 2023; Accepted: 21 November 2023;
Published: 15 December 2023.
Edited by:
Alessandro Bergamasco, National Research Council (CNR), ItalyReviewed by:
Kwang Young Kim, Chonnam National University, Republic of KoreaSuzana Leles, University of Southern California, United States
Copyright © 2023 Chen, Shi, Li, Li, Cheng and Xu. This is an open-access article distributed under the terms of the Creative Commons Attribution License (CC BY). The use, distribution or reproduction in other forums is permitted, provided the original author(s) and the copyright owner(s) are credited and that the original publication in this journal is cited, in accordance with accepted academic practice. No use, distribution or reproduction is permitted which does not comply with these terms.
*Correspondence: Jie Xu, eHVqaWVzdEB1bS5lZHUubW8=
†These authors have contributed equally to this work
 Dawei Chen
 Zhen Shi
 Ruihuan Li
 Xiangfu Li
 Yuanyue Cheng
 Jie Xu