
95% of researchers rate our articles as excellent or good
Learn more about the work of our research integrity team to safeguard the quality of each article we publish.
Find out more
ORIGINAL RESEARCH article
Front. Mar. Sci. , 30 January 2024
Sec. Marine Biogeochemistry
Volume 10 - 2023 | https://doi.org/10.3389/fmars.2023.1290625
This article is part of the Research Topic Hydrothermal and Submarine Volcanic Activity: Impacts on Ocean Chemistry and Plankton Dynamics View all 10 articles
 Fatima-Ezzahra Ababou1
 Frédéric A. C. Le Moigne1,2*
 Véronique Cornet-Barthaux1
 Vincent Taillandier3
 Sophie Bonnet1*
Diazotrophs regulate marine productivity in the oligotrophic ocean by alleviating nitrogen limitation, contributing to particulate organic carbon (POC) export to the deep ocean. Yet, the characterization of particles composing the sinking POC flux has never been explored in such ecosystems. Moreover, the contribution of the direct gravitational export of diazotrophs to the overall flux is seldom assessed. Here we explore the composition of the sinking POC flux in a hot spot of N2 fixation (the western sub-tropical South Pacific) using polyacrylamide gel-filled traps deployed at two stations (S05M and S10M) and three depths (170 m, 270 m, 1000 m) during the TONGA expedition (November-December 2019). Image analyses of particles collected in the gels was used to classify them into 5 categories (fecal aggregates, phytodetrital aggregates, mixed aggregates, cylindrical fecal pellets, and zooplankton carcasses). Fecal aggregates were the most abundant at both stations and all depths and dominated the flux (average of 56 ± 28% of the POC flux), followed by zooplankton carcasses (24 ± 19%), cylindrical fecal pellets (15 ± 14%) and mixed aggregates (5 ± 4%), whereas phytodetrital aggregates contributed less (<1%). Since N isotope budgets show that export is mainly supported by diazotrophy at these stations, these results suggest that the diazotroph-derived N has been efficiently transferred to the foodweb up to zooplankton and fecal pellets before being exported, pleading for an indirect export of diazotrophy. However, random confocal microscopy examination performed on sinking particles revealed that diazotrophs were present in several categories of exported particles, suggesting that diazotrophs are also directly exported, with a potential contribution to overall POC fluxes increasing with depth. Our results provide the first characterization of particle categories composing the sinking flux and their contribution to the overall flux in a hot spot of N2 fixation.
The oceans play a critical role in regulating atmospheric CO2 concentrations by sequestering a fraction of the photosynthetically fixed carbon [called primary production (PP)] to the deep ocean over geological time scales (Eppley and Peterson, 1979). Long-term sequestration of this PP requires the organic matter to be exported to the deep ocean through a myriad of processes collectively referred to as the biological carbon pump (BCP) (Eppley and Peterson, 1979). The global range of organic carbon export is very large and estimated at 5–21 Gt C yr−1 (Laws et al., 2000; Henson et al., 2011; Siegel et al., 2014; Wang et al., 2023). The pathways for carbon export from the surface to the deep ocean by the BCP are multiple (Boyd et al., 2019; Le Moigne, 2019). They mainly include the biological gravitational pump (BGP), that exports aggregated organic matter out of the euphotic zone (~0-100 m) via sinking marine snow (Burd and Jackson, 2009; Boyd et al., 2019; Le Moigne, 2019; Iversen, 2023), and the particle injection pumps (Omand et al., 2015; Dall’Olmo et al., 2016; Boyd et al., 2019) recently defined by Boyd et al. (2019). The latters can be separated into three physical subduction pumps (Levy et al., 2013; Omand et al., 2015; Dall’Olmo et al., 2016; Stukel et al., 2017) including: (1) the mixed-layer pump (shallow export ~10 m and short-term sequestration), (2) the eddy-subduction pump (~100 km export and hundreds of years scales) and (3) the large-scale subduction pump (1,000 km and 1,000 years scales). Besides, two pumps associated with zooplankton migration (Bianchi et al., 2013; Steinberg and Landry, 2017) are at work, with organisms feeding at night in surface waters and defecating deeper into the mesopelagic zone during the day, termed the migration pump (Stukel et al., 2017; Aumont et al., 2018), and zooplankton hibernation at depth during winter at high latitudes, termed the seasonal lipid pump (Steinberg et al., 2008; Jónasdóttir et al., 2015; Steinberg and Landry, 2017; Iversen, 2023). Finally, the fraction of particulate organic carbon (POC) flux exported out of the euphotic zone relative to PP, referred to as the export efficiency (Buesseler et al., 1992), and the fraction of the exported POC flux relative to the deep (>1000 m) POC flux, referred to as the transfer efficiency (Francois et al., 2002), are both widely used to determine the strength of the BGP. The export efficiency depends on the sinking velocity of particles and their remineralization rate (De La Rocha and Passow, 2007; Bach et al., 2019), as well as on the lateral advection and the time lag between PP and organic matter export (Stange et al., 2017; Laws and Maiti, 2019). The export efficiency is generally high in polar waters (0.1-1.3) (Le Moigne et al., 2015) compared to temperate (0.05-0.65) (Buesseler et al., 1998; Haskell II et al., 2017) and (sub)-tropical oligotrophic waters (0.01-0.2) (Quay et al., 2010; Henson et al., 2012; Maiti et al., 2016; Buesseler et al., 2020; Karl et al., 2021). In fact, in Low Nutrient Low Chlorophyll (LNLC) ecosystems, the export efficiency is deemed to be weak because of low nutrient inputs and high recycling processes in the surface pelagic food web (Buesseler et al., 2008; Buesseler and Boyd, 2009). Therefore, these ecosystems have received less attention than mid/high latitudes ones with respect to the BGP, although they account for ~60% of the global ocean surface.
In these vast LNLC ecosystems, atmospheric dinitrogen (N2) fixing organisms, called diazotrophs, provide new bioavailable N to non-diazotrophic organisms, support >50% of new PP (Berthelot et al., 2015; Bonnet et al., 2015; Bonnet et al., 2016b; Caffin et al., 2018b), and the export of organic matter through the N2-primed prokaryotic carbon pump (Karl et al., 2003). Geochemical ∂15N budgets reported that N2 fixation contributes to ~25-50% of export production in the subtropical North Pacific (ALOHA, Hawaii) (Karl et al., 1998; Böttjer et al., 2017), ~10% in the subtropical North Atlantic (BATS) (Knapp et al., 2005), and 50-80% in the subtropical South Pacific (Knapp et al., 2018; Bonnet et al., 2023b). N2 fixation is now recognized to indirectly support the BGP through the use of the diazotrophic-derived N (DDN) by non-diazotrophic plankton that get finally exported (Berthelot et al., 2016; Bonnet et al., 2016b; Caffin et al., 2018b). Alternatively, diazotrophs can also be directly exported down to >1000 m (Agusti et al., 2015; Pabortsava et al., 2017; Caffin et al., 2018a; Poff et al., 2021; Benavides et al., 2022) and account for a significant part of the export flux (Bonnet et al., 2023a). The mechanisms involved in the gravitational export of diazotrophs has recently been experimentally investigated by Ababou et al. (2023) who showed that both filamentous and unicellular diazotrophs sink at velocities of ~100 to 400 meters per day through the formation of large (7,000–32,014 µm) aggregates. However, these studies are still at their infancy, and the role of diazotrophs in the BGP, in particular the relative contribution of the direct export of diazotrophs versus the indirect export pathways after transfer of the DDN to the food web, remains to be elucidated. Therefore, determining the composition of the sinking flux and the contribution of different particle types (including diazotrophs) to the overall flux is crucial to understand the underlying mechanisms that control the magnitude and efficiency of the BCP in these LNLC ecosystems.
Sinking particles are heterogenous. Capturing their diversity and determining who constitute and drive the flux in a given region is therefore challenging. Sediment traps allow to collect particles and to assess the relationship between PP, particle export and attenuation in the mesopelagic zone (Buesseler and Boyd, 2009; Baker et al., 2020; Baumas and Bizic, 2023). Polyacrylamide gels mounted on sediment traps enable the composition of the sinking flux to be estimated by collecting and preserving and preservation of their morphological characteristics during deposition in the gel (Jannasch et al., 1980; Lundsgaard, 1995; Waite et al., 2000). Studies in different regions have found either fecal pellets (Wassmann et al., 2000; Turner, 2002; Ebersbach and Trull, 2008; Laurenceau-Cornec et al., 2015; Durkin et al., 2021) or large organic aggregates (Alldredge and Gotschalk, 1988; De La Rocha and Passow, 2007; Burd and Jackson, 2009) to be the main drivers of the particle flux. However, this kind of gel traps have repeatedly been deployed in temperate and polar regions, but have never been used to assess the sinking flux in LNLC ecosystems in which primary, secondary and export productions are primarily supported by N2 fixation.
Here we deployed gel traps in the western subtropical South Pacific (WTSP), a LNLC ecosystem recognized as a hot spot of N2 fixation activity, with an estimated contribution of ~21% to 40% to the global fixed N input and average fluxes >600 μmol N m-2 d-1 (Bonnet et al., 2017; Shao et al., 2023). This hot spot has been attributed, among other factors, to the Fe fertilization by shallow hydrothermal sources along the Tonga-Kermadec arc (Bonnet et al., 2023b), resulting in dissolved Fe concentrations up to ~10 nmol L-1 in the euphotic layer (Tilliette et al., 2022). Here we used a gel traps approach to characterize the composition of the sinking flux and estimate the contribution of each particle category to the overall POC fluxes inside of this hot spot of N2 fixation. We also explored the interior of sinking particles using confocal microscopy to detect the possible presence of diazotrophs and evaluate their potential contribution to the overall POC flux.
Samples were collected during TONGA expedition (GEOTRACES GPpr14, https://doi.org/10.17600/18000884) onboard the R/V L’Atalante from November 1st to December 5th of 2019 (beginning of austral summer) in the WTSP (Figure 1). A surface-tethered mooring line (~1000 m) equipped with sediment traps was deployed at 2 stations: S05M (21.157°S; 175.153°W) and S10M (19.423°S; 175.133°W) (Figure 1) for 5 and 3.8 days respectively and at 3 depths: 170 m (below the base of the euphotic layer), 270 m and 1000 m. Each trap was made up of four particle interceptor tubes (PITs) of a collecting area of 0.0085 m2 (aspect ratio of 6.7) that were attached to a cross frame (KC Denmark®). At each depth, tubes were dedicated to either optical (gel traps), biogeochemical, microbiological or molecular analyses (Benavides et al., 2022; Bonnet et al., 2023a). In this study, the optical tubes containing polyacrylamide gels were used to collect intact sinking particles: gels provide a slow deceleration of particles, isolate them in their original forms and therefore provide a direct ‘picture’ of the sinking flux (Ebersbach and Trull, 2008). The biogeochemical tubes were used to measure bulk carbon fluxes, and the microbiological tubes were used to visualize phycoerythrin-containing organisms by confocal microscopy (see details below).
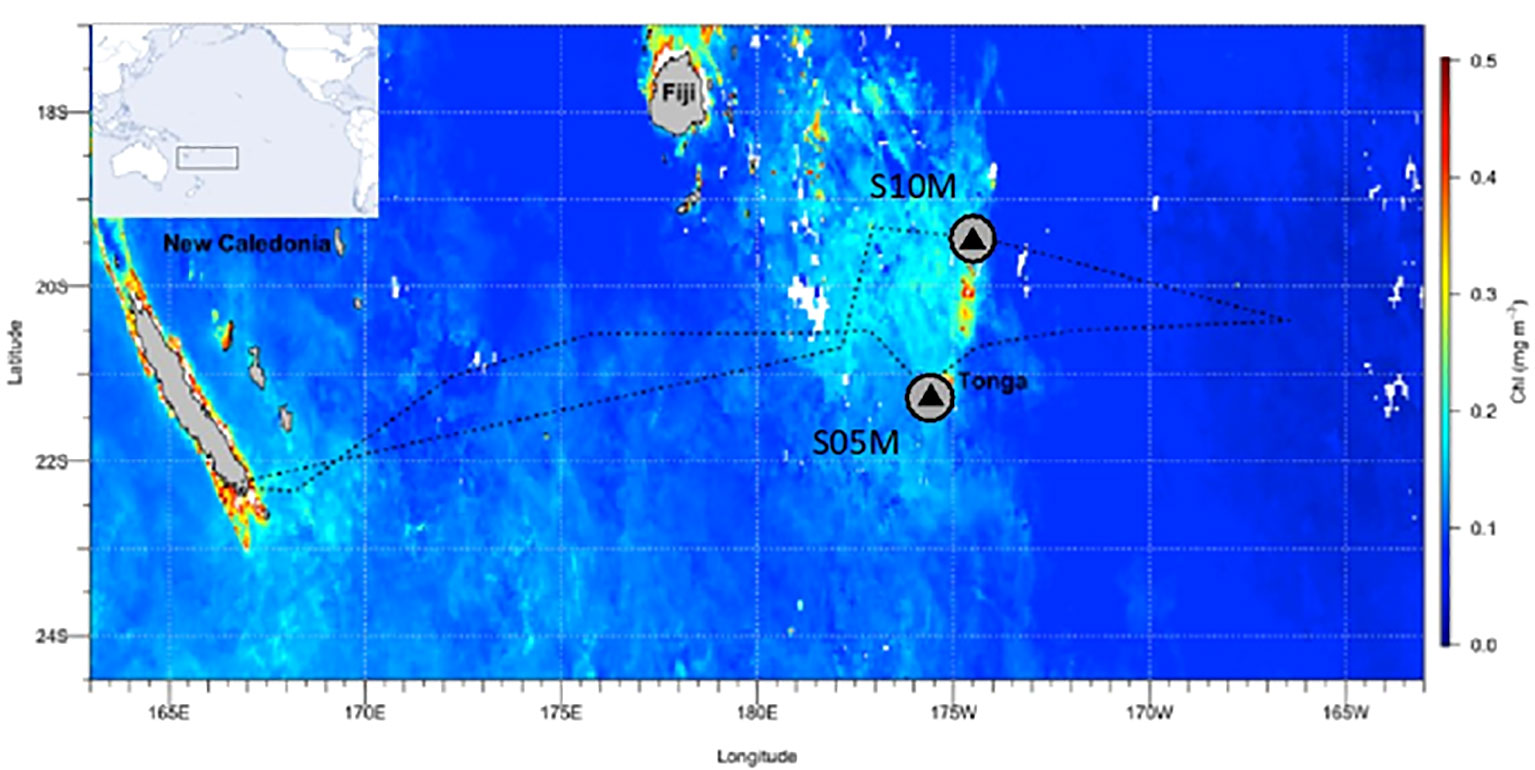
Figure 1 |Transect of the TONGA GPpr14 cruise. Satellite-derived surface chlorophyll a concentrations during the cruise (1 November-5 December 2019) (MODIS Aqua, 4 km, 8-days composite, level 3 product). Black triangles correspond to stations where surface-tethered sediment traps were deployed (170 m, 270 m, 1000 m).
Polyacrylamide gels were prepared as described in Ebersbach and Trull (2008) and Laurenceau-Cornec et al. (2015) and poured into a transparent cups. Prior to deployments of the mooring line, polyacrylamide gel cups were fixed to the bottom of the tube. Brine (salinity of ~50 g L-1) with formalin (2%) was carefully added to the surface of the gel to decelerate the sinking velocity of particles and prevent them from breaking on contact with the gel. The tube was then entirely filled with 0.2 μm filtered seawater. Immediately after recovery of the mooring line, the seawater covering the gels was removed using a peristaltic pump and the gel cups were recovered, carefully covered with parafilm and stored at 4°C until laboratory optical analysis back in the laboratory.
For the biogeochemical tube, the density gradient was visually inspected immediately after removal of the mooring line. The tubes were stabilized for two hours before the supernatant seawater was gently removed using a peristaltic pump. The sinking material in the remaining water was transferred to a hydrochloric acid-washed container, while being sieved with a 500 μm mesh to remove zooplankton that actively entered the traps (swimmers). After homogenization with a magnetic stir bar, a triplicate set of aliquots were filtered onto 25-mm diameter combusted (4h, 450°C) glass microfiber filters (Whatman GF/F), dried for 24 h at 60°C, pelleted and analyzed for POC and PON by EA-IRMS (Elemental Analyzer-Isotope Ratio Mass Spectrometry) using an Integra 2 (Sercon) mass spectrometer (Bonnet et al., 2018).
Polyacrylamide gels were visualized under a binocular magnifier and imaged using a Leica 165C camera (Figure 2). Particles were lit by placing a cold light illuminated plate below the gel cups, then images were captured at a 6.5 magnification to visualize particles. The whole gel cup surface area was imaged following horizontal transects. Approximately 24 to 26 images in a single focal plan were obtained for each gel at each depth. Images of incomplete grid cells were removed from the analysis to avoid bias. The average surface analyzed per gel was 0.0035 ± 0.0004 m2, corresponding to 41 ± 5% of the gel collection area (0.0085 m2). Images were analyzed using the FIJI software (the US National Institutes of Health’s free software ImageJ) (Schindelin et al., 2015) that allows the measurement of particles shape descriptors (area, angle, circularity, perimeter, fit ellipse and aspect ratio among others). In each processed image, the particles were delineated and numbered, and then individually identified according to their typical shapes and colors, thus indicating the category where they will be classified. Particles were classified into five categories: fecal aggregates (hereafter FA), phytodetrital aggregates (hereafter PA), mixed aggregates (hereafter Mix, which are aggregates containing both PA and FA or FA and zooplankton carcasses), cylindrical fecal pellets (hereafter CFP) and zooplankton carcasses (hereafter zoo carcasses). Routine one-to-one particle identification was applied on 125 images in total.
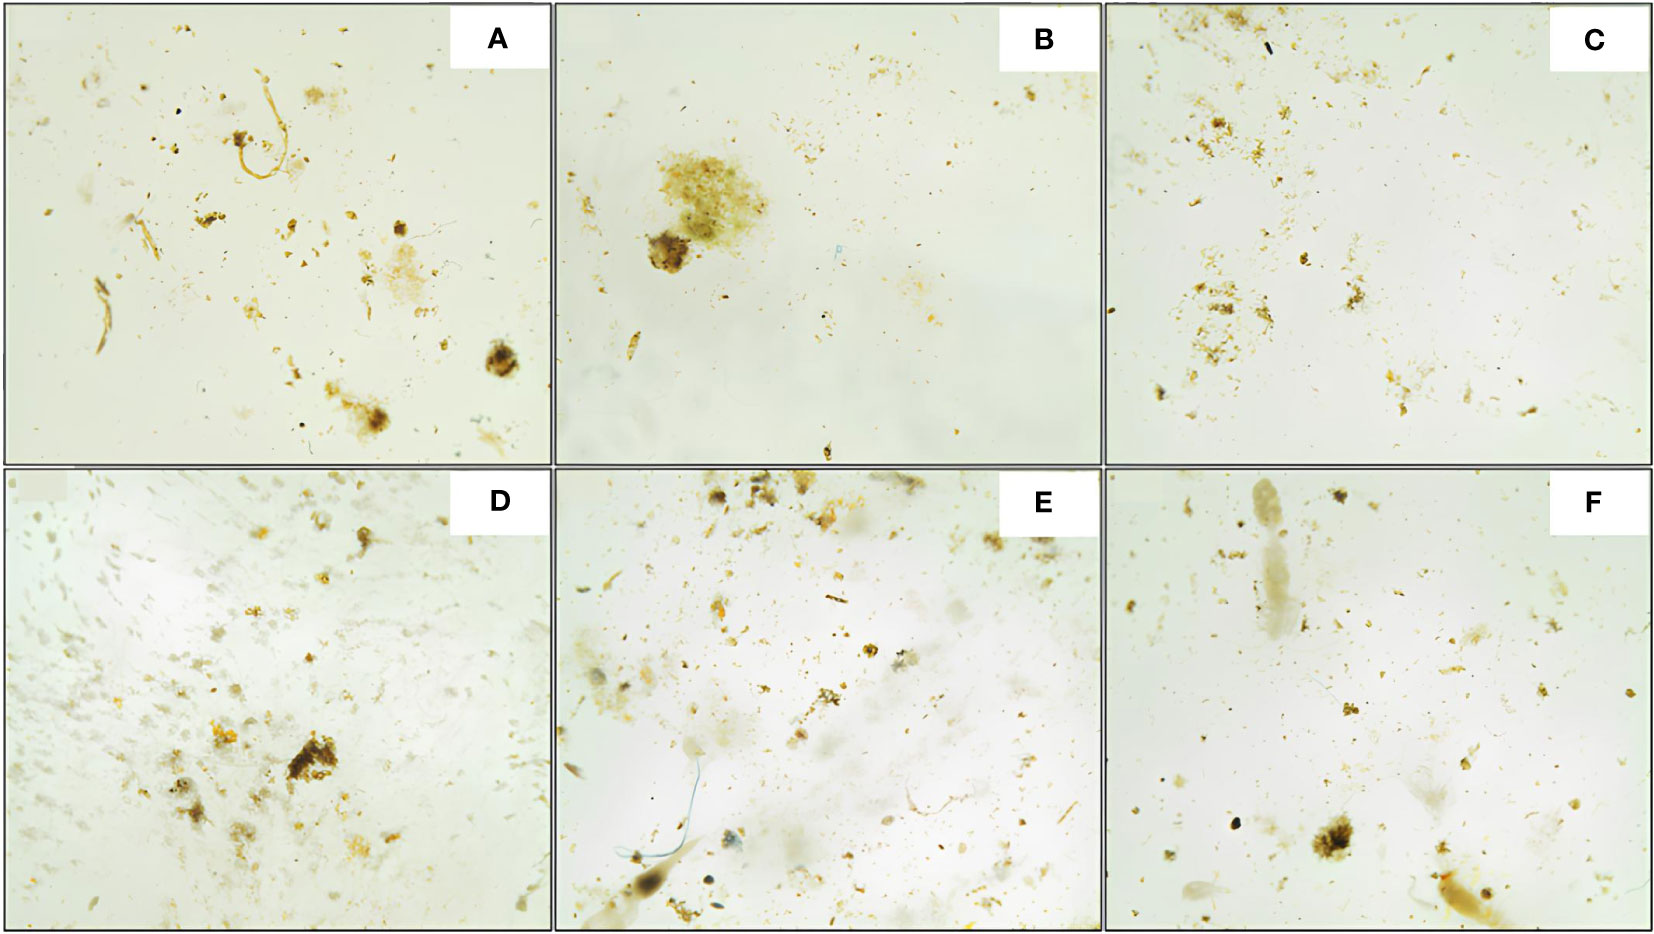
Figure 2 Images of sinking particles embedded in polyacrylamide gels, collected at station S05M at 170 m (A), 270 m (B) and 1000 m (C), and station S10M (D–F) at the same depths respectively. Image analysis of particles collected at 170 m at S10M was not possible due to the damaged aspect of the gel, this depth was thus excluded from this study.
With the sinking particle projected areas obtained with FIJI, we first identified their size spectra and then their number and volume flux spectra. Finally, we estimated the number, volume and carbon fluxes associated with each particle category (described below).
The projected areas of sinking particles provided by FIJI (Figure 3) enabled to calculate their Equivalent Spherical Diameter (ESD) by assuming spheres (Equation 1).
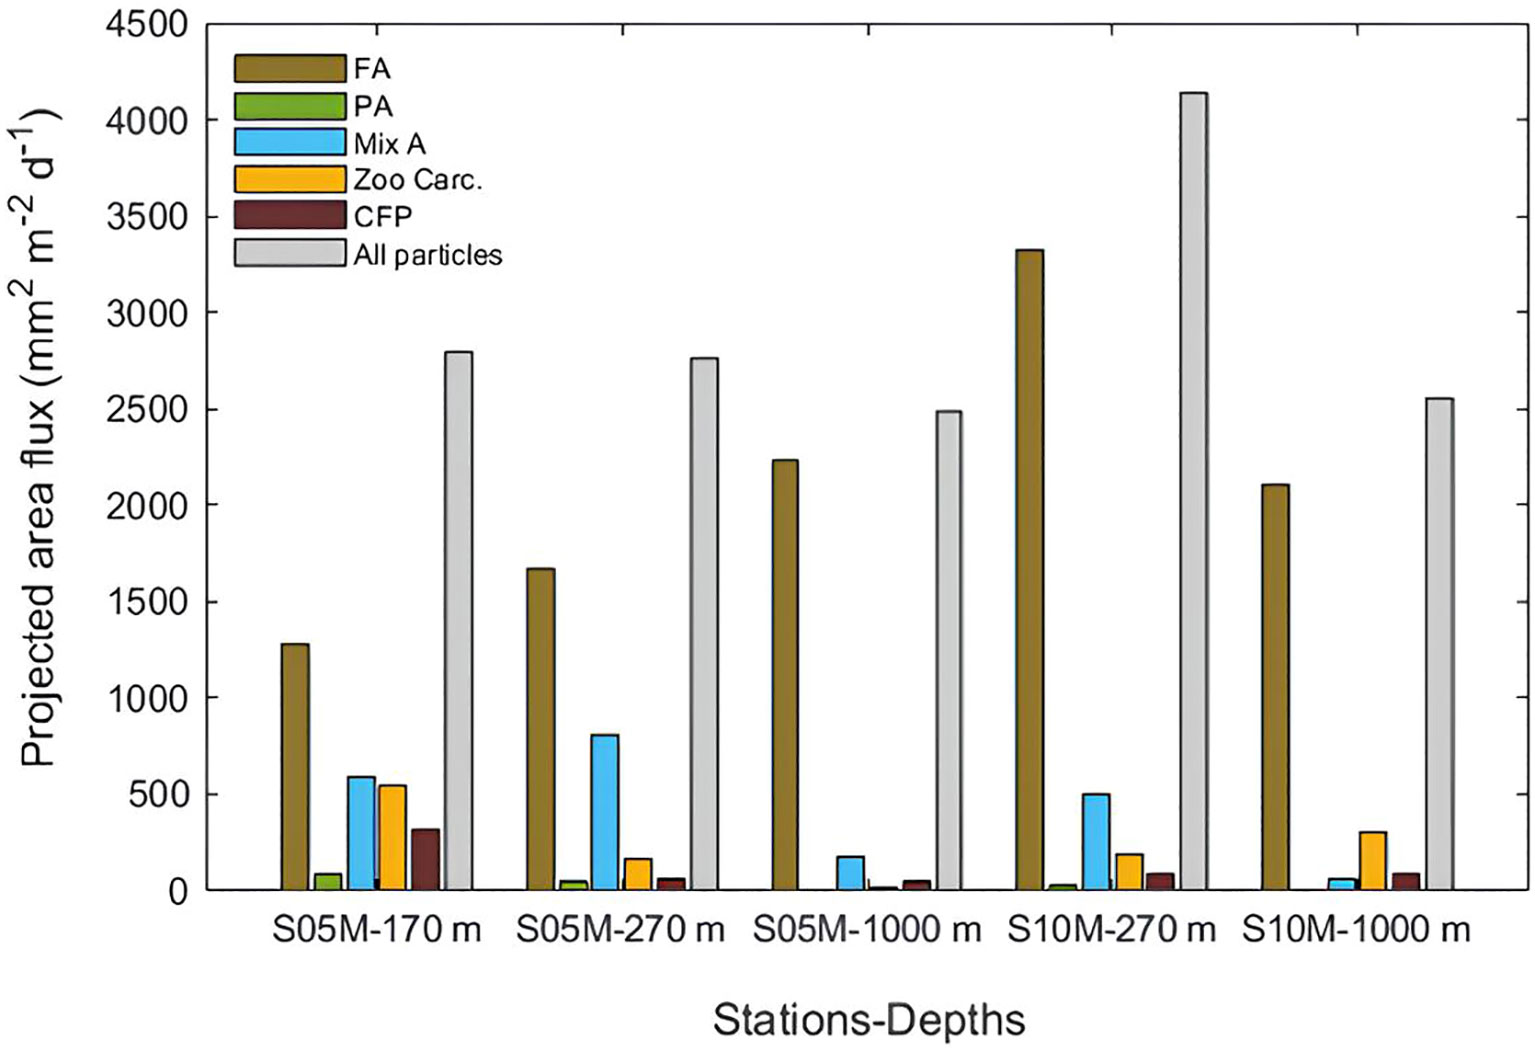
Figure 3 Projected area flux of sinking particles reconstructed from image analysis at each station and depth (mm2 m−2 d−1). FA, fecal aggregates; PA, phytodetrital aggregates; Mix A, mixed aggregates; CFP, cylindrical fecal pellets; Zoo Carc., zooplankton carcasses.
Where the projected area is the surface area occupied by a particle in mm2.
The ESD allowed to determine the size spectra of the sinking particles by binning them into 9 logarithmically spaced size classes (Table 1) (Laurenceau-Cornec et al., 2015) that cover the whole size range of particles detected in our gels (0.1-1.7 mm). All particle shape descriptors and fluxes considered in this study and their units are reported in Table 1. A cut-off of particles with projected areas<0.009 mm2 (equivalent to 0.1 mm ESD) was applied to exclude small and spurious particles arising from gel imperfections, and to avoid misidentification as their size did not allow to identify them correctly. This cut-off removed hundreds of particles at both stations but represents an average loss of 25 ± 5% of the total projected area of particles at S05M and 25 ± 0.2% at S10M.
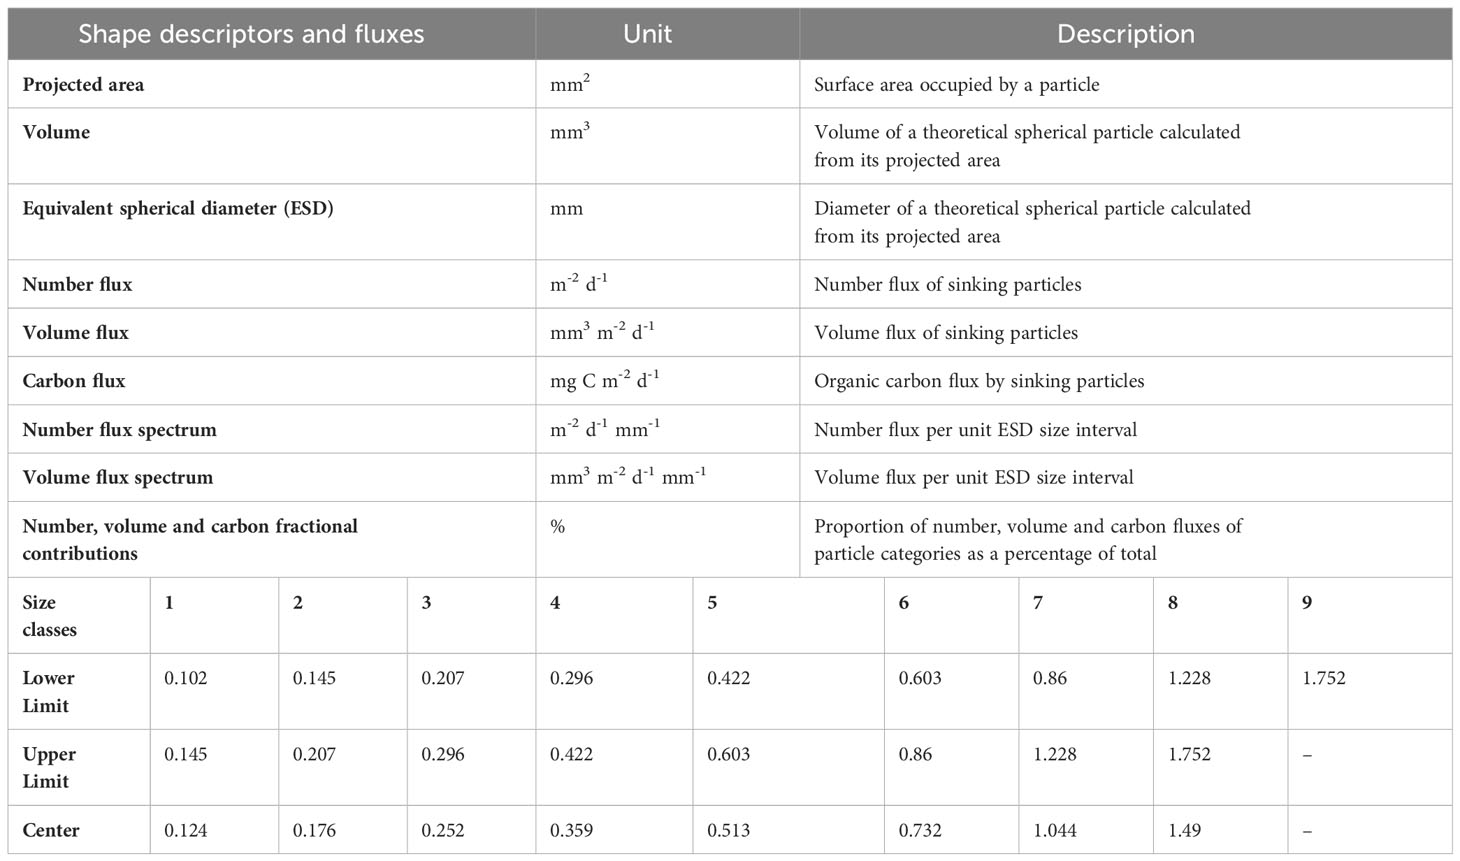
Table 1 Units and definitions of particle shape descriptors and calculated fluxes (upper table), and size classes (ESD, mm) (lower table) of particle categories: phytodetrital aggregates, fecal aggregates, mixed aggregates, cylindrical fecal pellets and zooplankton carcasses.
Particle number (m-2 d-1 mm-1) (Equation 2) (Figure 4, left) and volume flux spectra (mm3 m-2 d-1 mm-1) (Equation 3) (Figure 4, right) allowed to determine the abundance of particles and their corresponding volumes in each size class. The particle number flux spectra was calculated as follows:
Where ∑particle number is the sum of particles within a size class, the surface area is the total imaged surface area of the gel in m2, the trap deployment duration in days (5 for S05M and 3.8 for S10M) and the size of the size class is the difference between upper and lower limits ESD in mm.
The volume flux spectra (mm3 m-2 d-1 mm-1) was calculated as for the number flux spectra as follows:
Where ∑particle volume is the sum of volumes within a size class in mm3, the surface area is the total imaged surface area of the gel in m2, the trap deployment duration in days (5 for S05M and 3.8 for S10M) and the size of the size class is the difference between upper and lower limits ESD in mm.
The particles projected areas were first converted into volumes according to geometric assumptions as in Ebersbach and Trull (2008) and Laurenceau-Cornec et al. (2015). Fecal and phytodetrital aggregates were considered spherical, mixed aggregates, zooplankton carcasses as ellipsoids and cylindrical fecal pellets as cylinders. Volumes were then converted to carbon content by using relationships provided in the literature for each particle type (Equation 4): carbon content of fecal aggregates was obtained using fecal marine snow power relationship (Alldredge, 1998):
Where POC is the carbon content of fecal aggregates in µg and V is their corresponding volumes in mm3.
POC content of phytodetrital aggregates was obtained using diatom marine snow relationship (Equation 5) (Alldredge, 1998):
Where POC is the carbon content of phytodetrital aggregates in µg and V is their corresponding volumes in mm3.
Carbon content of cylindrical fecal pellets was obtained from their volumes using a value of 0.057 mg C mm-3 (Gonzalez and Smetacek, 1994). For zooplankton carcasses, we first estimated their dry weight using the correlation (r2 = 0.967) of subtropical copepods with a size range of body area of 0.1-8.3 mm2 (Lehette and Hernández-León, 2009) (Equation 6), as follows:
Where projected area is the surface area occupied by the zooplankton carcasses in mm2.
Then, carbon content of zooplankton carcasses was thus calculated as 45% of the estimated dry weight (Billones et al., 1999). Only identifiable particles and zooplankton carcasses were considered in estimates of POC flux. Unidentified particles and healthy-looking swimmers accidentally caught in the gel (not carcasses) were excluded from the data set. All relationships used in volume and POC conversions are listed in Table 2.
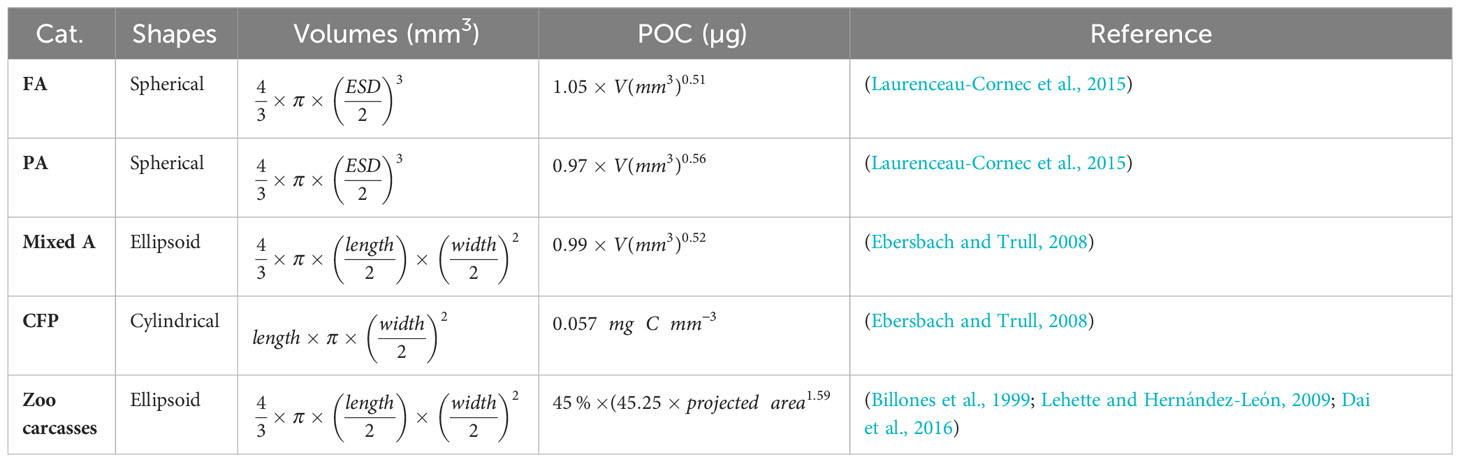
Table 2 Relationships used to estimate volumes and carbon contents of sinking particles according to their shapes. Lengths and widths used corresponds to major and minor lengths provided by FIJI.
Number, (Figure 4, left), volume (Figure 4, right) and carbon fluxes (Figure 5) of particles were estimated at each station and depth by dividing their respective total counted particles number, volume (mm3) or carbon (mg) by the analyzed surface area of the gel (m2) and the trap collection duration (days). Contributions of each particle category in number, volume and carbon fluxes were calculated as a percentage of a total and are presented in Table 3.
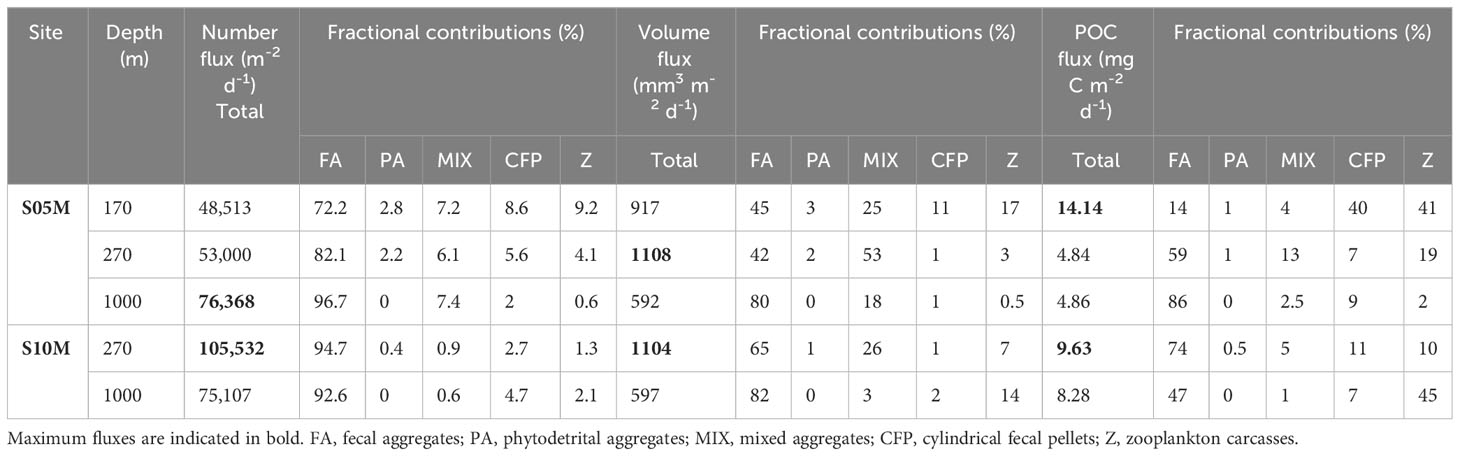
Table 3 Number, volume and POC fluxes reconstructed from polyacrylamide gel traps with fractional contributions of each category of particle.
The presence of diazotrophs within the sinking aggregates was evaluated at only one station (S05M) as both stations were quite similar in composition and because such method is time consuming. For that, the interior of the aggregates collected in tubes dedicated to microbiological analyses was visualized using confocal microscopy. 250 mL of the traps material were filtered onboard onto 0.8 µm polycarbonate filters and fixed with 4% paraformaldehyde. Filters obtained were then carefully inverted onto clean transparent glass slides and freezed using a cooling spray to instantly transfer all the traps material from the filter to the glass slide. The filter was then carefully removed and inspected to ensure that no particles remained after transfer. Without covering the slides to avoid flattening the aggregates, they were directly placed under the microscope and visualized at a x10 magnification using the microscope lasers. The visualized aggregates here were from several categories, i.e. either fecal, mixed or phytodetrical aggregates and we were not able to clearly discriminate them with this method. Organic matter was visualized with ultraviolet (UV, wavelength= 405 nm) and phycoerythrin was used as a relative indictor of cyanobacterial diazotrophs as Trichodesmium spp., unicellular diazotrophic cyanobacteria from Group B (UCYN-B) and C (UCYN-C) and endosymbiotic nitrogen fixers possess this accessory pigment (Grabowski et al., 2008; White et al., 2018; Bonnet et al., 2023a) (phycoerythrin, wavelength= 455 nm), while UCYN-A do not (Zehr et al., 2008). Twelve focal plans with evenly distributed aggregates were randomly selected from each depth. Before starting the imaging, parameters (slices thickness, pinhole diameter, gain and contrasts) of the images were set using the microscope software. The two lasers used enabled the excitation of the aggregates organic matter in blue color and the phycoerythrin pigments in red/pink color. An average of 15 images (slices) with a thickness of 5.9 µm per focal plan (Figure 6) was needed to explore the aggregate’s interior (total of 180 images per depth at S05M). The high resolution of images allowed the reconstruction of the aggregates (Figure 6) and the quantification of the phycoerythrin proportion area in these aggregates (Table 4). With many marine diazotrophs being cyanobacteria (although not all cyanobacteria are diazotrophs), phycoerythrin was used as a relative indicator of the cyanobacterial diazotrophs in the sinking material. Two potential pitfalls of this method are that 1/other (non-diazotrophic) cyanobacteria, notably Synechococcus spp., also contain phycoerythrin. However, the morphology of Synechococcus and cyanobacterial diazotrophs is very different: Synechococcus spp. are picoplantonic in size (~1 µm), while Trichodesmium spp. are long filaments or colonies (>100 µm), and unicellular diazotrophs (UCYN) are spherical/ovoid (5-8 µm). According to our observations in the exported material, Synechococcus spp. were in the minority compared with diazotrophs. Moreover, because of their small size, their carbon content is 10-100 times lower than that of diazotrophs. We therefore considered the phycoerythrin zones reported below to be a relative indicator of diazotrophs, but the results reported below may be slightly overestimated. 2/UCYN-A do not contain pigments and cannot be visualized with this method, which may on the opposite underestimate the contribution of cyanobacterial diazotrophs to export. This method was compared in the discussion to another method based on quantitative PCR.
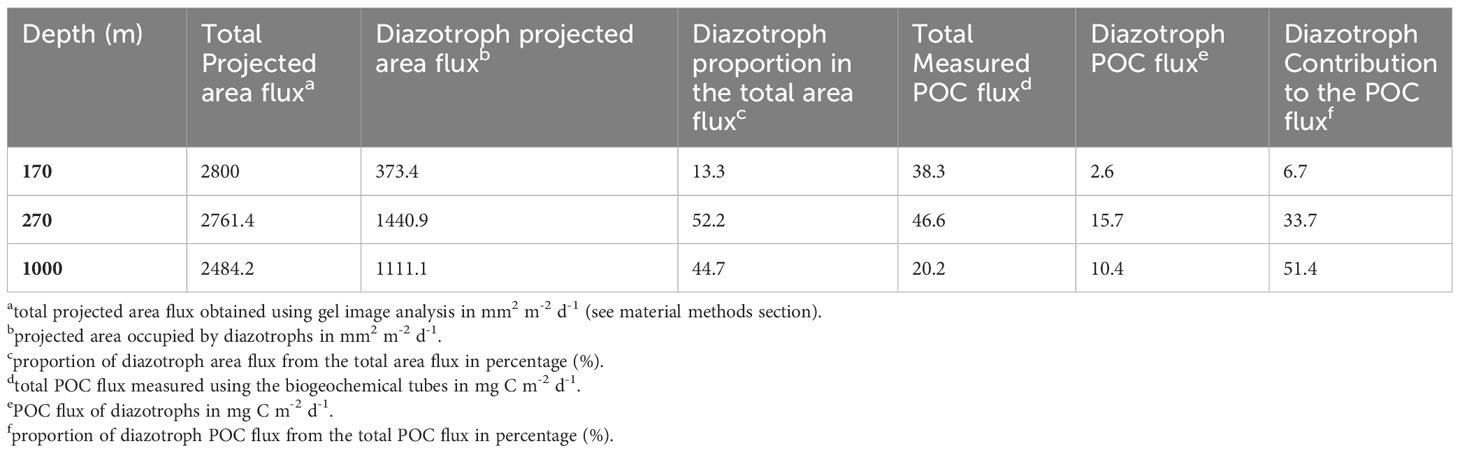
Table 4 Diazotroph projected area and specific reconstructed POC fluxes at S05M.
The confocal images were analyzed using FIJI (Figure 6). First, each group of focal images (slices) was combined to be analyzed as a stack. Then, the contrast of the images stack was adjusted for a better visualization of the aggregates before selecting and measuring each fluorescent area separately (blue for organic matter and red/pink for phycoerythrin-containing organisms) using the color threshold function of FIJI.
Total projected areas of each fluorescence were obtained. This allowed to measure the proportion of phycoerythrin-containing organisms in the sinking material over the total fluorescent projected area (blue+pink) as follows (Table 4) (Equation 7):
where phycoerythrin area proportion is the area mostly occupied by cyanobacteria (essentially attributed to cyanobacterial diazotrophs, see above) over the total fluorescent area in percentage (%).The diazotroph projected area fluxes were obtained by summing the projected areas of diazotrophs in all slices of the twelve images analyzed and by converting them into fluxes in mm2 m-2 d-1.
The contribution of diazotrophs to the POC flux was roughly estimated by calculating the volumes (µm3) from their projected areas (mm2) assuming spheres by using the ESD (Eq. 1) cited above. Further, we estimated the POC content (pg) of diazotrophs by plotting the volumes and carbon contents provided in Goebel et al. (2008) and Luo et al. (2012) and those measured in Dron et al. (2012) (Supplementary Table, Supplementary Figure 1).
Surface Chlorophyll a concentrations were assessed by satellite (MODIS Aqua, 4 442 km, 8-days composite, level 3 product) (http://oceancolor.gsfc.nasa.gov). Primary production was measured in triplicates at the locations of the traps deployments (S05M and S10M) as described in Lory et al. (In prep.).
Figure 2 shows the different categories of sinking particles identified in this study. Fecal aggregates are compact and dark brown, whereas phytodetrital aggregates are diffuse and green. Mixed aggregates are relatively large in size with irregular colors i.e. brownish with some green inclusions when they are made of fecal and phytodetrital materials; and shapes i.e. spherical to elongated when zooplankton carcasses are attached to the fecal aggregates. Cylindrical fecal pellets are brown and long with a relatively high aspect ratio (i.e. length over width ratio >2) with rounded or conical edges.
At S05M, the total number flux spectra, corresponding to the sum of all particle categories within all the size classes (ESD), was 8.16 105 m-2 d-1 mm-1 at 170 m, 9.53 105 m-2 d-1 mm-1 at 270 m and 1.38 106 ± 2 104 mm3 m-2 d-1 mm-1 at 1000 m (Figure 4). At S10M, no data are available at 170 m because the gel was not exploitable (see Figure 2). The number flux spectra at 270 m was higher (1.75 106 m-2 d-1 mm-1) compared to S05M, and almost similar to S05M at 1000 m (Figure 4).
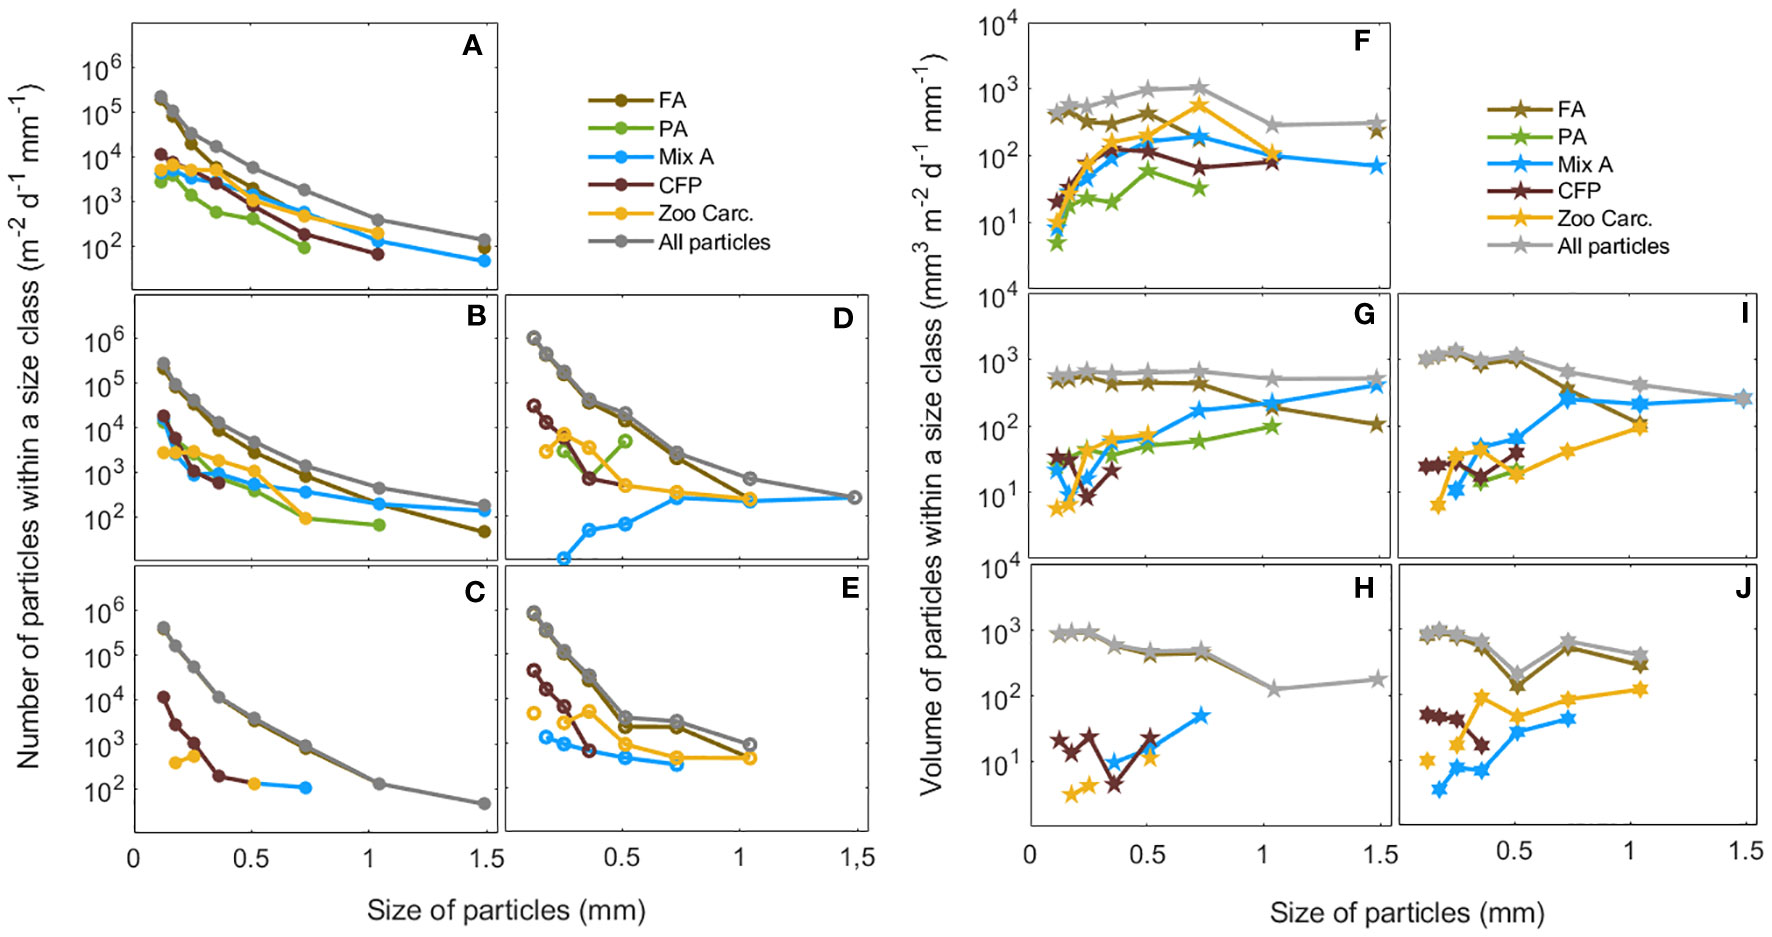
Figure 4 Total number (m-2 d-1 mm-1) and volume fluxes (mm3 m-2 d-1 mm-1) of particles binned in 9 size classes (Table 1). Number flux spectra are shown at (A) S05M-170 m, (B) S05M-270 m, (C) S05M-1000 m, (D) S10M-270 m, (E) S10M-1000 m, and volume flux spectra at (F) S05M-170 m, (G) S05M-270 m, (H) S05M-1000 m, (I) S10M-270 m, (J) S10M-1000 m, for each category of particles FA, fecal aggregates; PA, phytodetrital aggregates; Mix A, mixed aggregates; CFP, cylindrical fecal pellets; Zoo Carc., zooplankton carcasses.
Most of the number flux spectra at all depths and both stations was dominated by fecal aggregates, in particular of small and medium size (0.1-1 mm ESD), which contribution was close to the total number flux spectra, especially at 1000 m at both stations (Figure 4). Cylindrical fecal pellets were the second most numerous particles at all depths at both stations averaged, with a maximum flux of 6.64 104 m-2 d-1 mm-1 of particles (0.1-0.4 mm ESD) observed at S10M at 1000 m. Zooplankton carcasses were the third most numerous particles at all depths at both stations averaged, except at S05M at 270 m, where phytodetrital and mixed aggregates were the more numerous. No phytodetrital aggregates were observed at 1000 m at any station (Figure 4). Aggregates were rather mixed at this depth, with values ranging from 1.3 to 3.7 103 m-2 d-1 mm-1 at S05M and S10M respectively. Overall, particles with a size range 0.1-0.5 mm ESD were the most numerous at both stations and their number increased progressively with depth (Figure 4), likely due to fragmentation, leading to smaller but more numerous aggregates.
At S05M, the total volume flux spectra, corresponding to the sum of volumes of all particle categories within all the size classes (ESD), was 4880 mm3 m-2 d-1 mm-1 at 170 m and 4752 mm3 m-2 d-1 mm-1 at 270 m (Figure 4). At S10M, no data are available at 170 m (see Figure 2). However, as for the total number flux spectra, the total volume flux spectra at this station was higher (6949 mm3 m-2 d-1 mm-1) at 270 m and almost similar (4532 ± 20 mm3 m-2 d-1 mm-1) at 1000 m at both stations. Overall, the total volume flux spectra decreased with depth at both stations. However, the decrease was more pronounced between 270 and 1000 m at S10M than at S05M (Figure 4).
As for the number flux spectra, most of the volume flux spectra at all depths and both stations was carried out by fecal aggregates, especially those between 0.1 and 0.7 mm ESD (Figure 4). Fecal aggregates of size range 0.1-1 mm ESD were the most voluminous particles, with volumes almost equivalent to the total volume flux spectra at all depths of both stations. This is due to their higher abundance compared to larger fecal aggregates (>1 mm) and to other particle categories.
Particle number and projected area fluxes of all depths averaged were higher at S10M (90320 m-2 d-1 and 3342 mm2 m-2 d-1, respectively) than at S05M (59294 m-2 d-1 and 2682 mm2 m-2 d-1, respectively) (Table 3; Figure 3). Volumes fluxes were almost similar at both stations in an average stations and depths of 861 ± 15 mm3 m-2 d-1 (Table 3).
Fecal aggregates were the most numerous and voluminous particle category at the three depths at both stations. They represented 88 ± 10% of the total number flux, 72 ± 18% of the total projected area flux and 63 ± 19% of the total volume flux (stations and depths averaged) (Table 3; Figures 4, 3). Mixed aggregates were the second contributors to the projected area (14 ± 11% of the total, stations and depths averaged) and volume fluxes (25 ± 18% of the total) despite their low abundance. The remaining fraction is distributed among the other particle categories, the lowest contribution to the fluxes being for phytodetrital aggregates that contributed for 1.1 ± 1.3% to the total number flux, 1.2 ± 1.4% of the total projected area and 1.2 ± 1.3% of the total volume flux (Table 3; Figures 4, 3).
Fecal aggregates dominated the total reconstructed POC flux at 270 and 1000 m at both stations, with 67 ± 17% of the total POC flux (Table 3; Figure 5). At S05M, zooplankton carcasses and cylindrical fecal pellets drove the reconstructed POC flux at 170 m with a similar contribution of 40% each, whereas no data are available for S10M at this depth (see Figure 2). Phytodetrital and mixed aggregates contribution to the total POC flux was low at both stations and all depths with an average of 0.5 ± 0.5% and 5 ± 1%, respectively (Table 3; Figure 5).
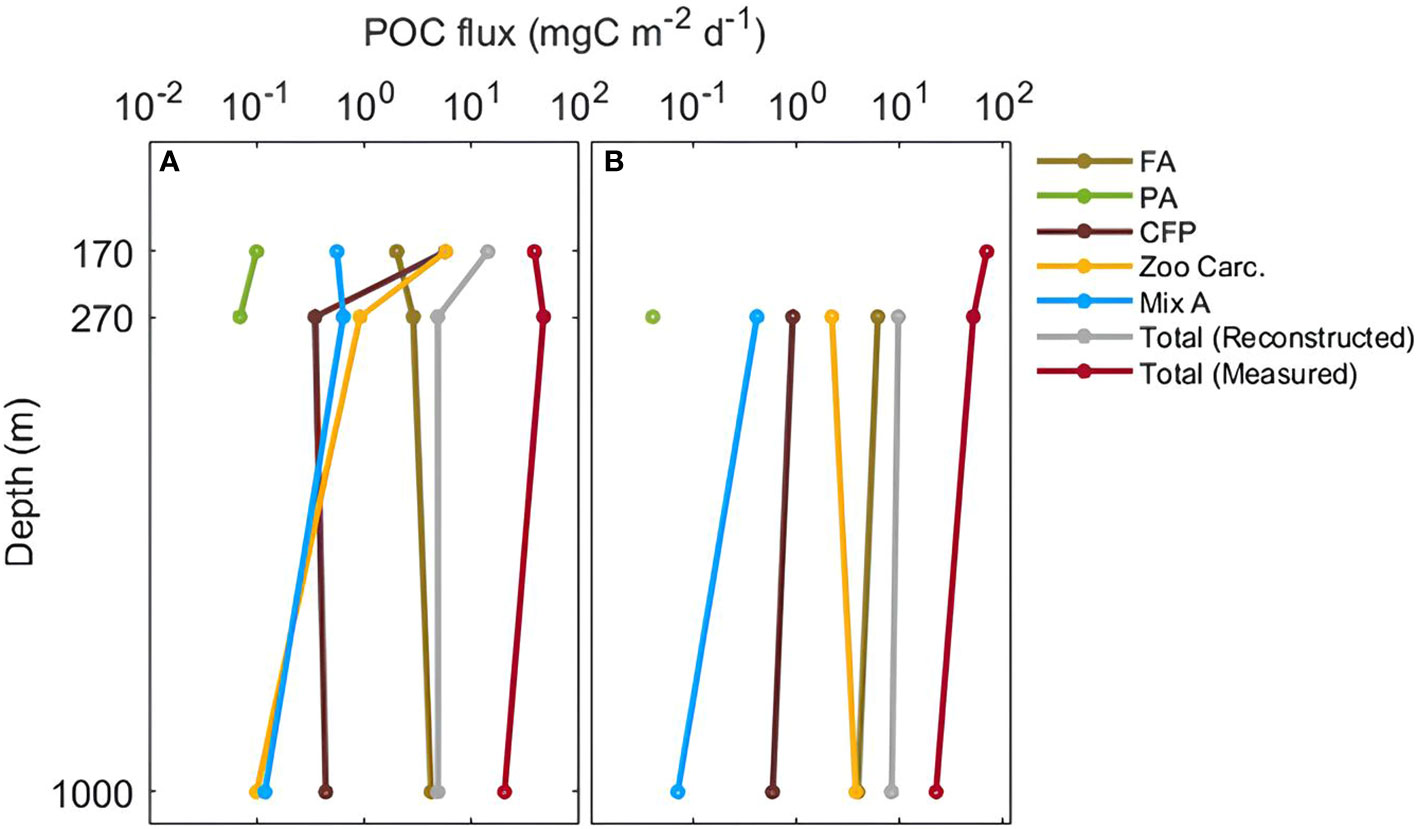
Figure 5 Reconstructed POC fluxes of FA= fecal aggregates, PA= phytodetrital aggregates, Mix A= mixed aggregates, CFP= cylindrical fecal pellets, and Zoo Carc.= zooplankton carcasses, total reconstructed and measured POC fluxes at 170 m, 270 m and 1000 m. POC fluxes are presented in mg C m-2 d-1 at S05M (A) and S10M (B).
The total reconstructed POC flux was higher at S10M than at S05M (Figure 5). At S05M, reconstructed POC fluxes decreased by 65.8% between 170 and 270 m and remained constant between 270 and 1000 m (Table 3; Figure 5). This is mainly due to the decrease of cylindrical fecal pellets and zooplankton carcasses fluxes by 94 and 84% respectively between these two depths, while other particle category fluxes remained constant. However, at 1000 m, phytodetrital and mixed aggregates fluxes were almost zero and fecal aggregate fluxes increased by 32%, while other particle category fluxes remained constant. This led to a constant total reconstructed POC fluxes between 270 and 1000 m (Table 3; Figure 5). At S10M, all particle category fluxes decreased between 270 and 1000 m, by 84% for mixed aggregates fluxes and by 36% for cylindrical fecal pellets and fecal aggregate fluxes, whereas fluxes attributed to zooplankton carcasses almost doubled between these two depths (Table 3; Figure 5).
The total POC flux measured in the biogeochemical tubes was generally higher at S10M compared to S05M at all depths (Figure 5). The total measured POC flux was almost twice as much at S10M (69.6 mg C m-2 d-1) than at S05M (38.4 mg C m-2 d-1) at 170 m. However, it decreases more intensely at S10M (67.78%) than at S05M (47.22%) between 170 and 1000 m. Overall, our reconstructed POC fluxes were 3 to 9-fold lower than the measured POC flux at both stations (Figure 5).
Particle export efficiencies (Eeff), estimated using gel image analysis, were 0.03 at 170 m at S05M and were similar (0.01) at 270 and 1000 m at both stations (Table 5). However, the Eeff measured using the biogeochemical tubes, were systematically higher than estimated ones and were comparable between both stations and depths (Table 5).
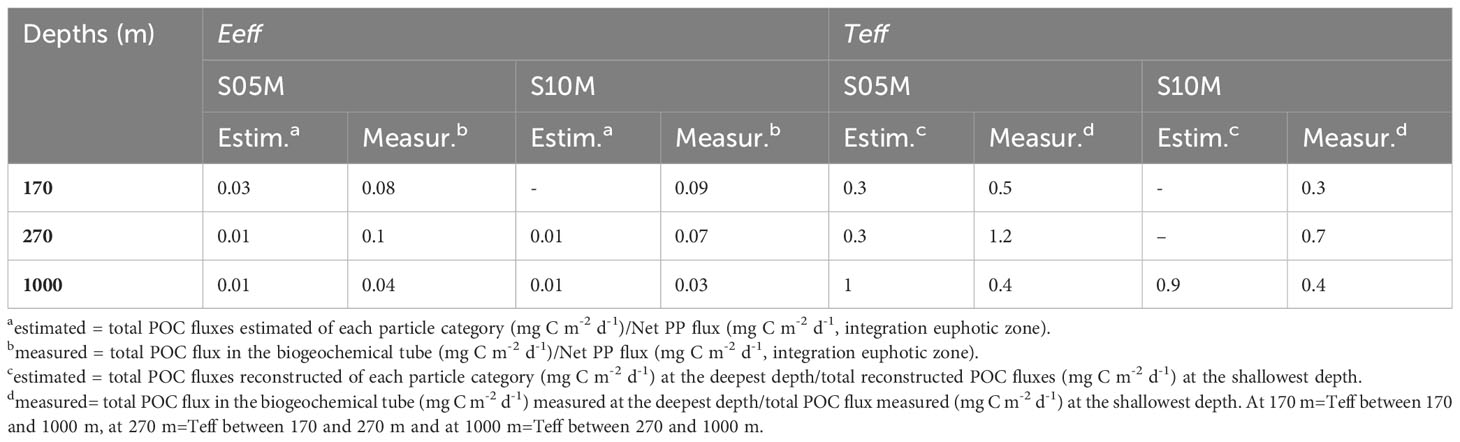
Table 5 Comparison of total estimated and measured export (Eeff) and particle transfer efficiencies (Teff) at the two stations (S05M and S10M).
Particle transfer efficiencies (Teff), estimated using gel image analysis, were similar between 270 and 1000 m at both stations (average of 0.95 ± 0.07) (Table 5). Teff measured using the biogeochemical tubes, were higher at S05M compared to S10M between 170 and 1000 m and between 170 and 270 m, whereas they were similar at both stations between 270 and 1000 m (0.4). Overall, Eeff were comparable at both stations but a more efficient transfer of C to depth occurred at S05M compared to S10M (Table 5).
Phycoerythrin occupied 13%, 52% and 45% at 170, 270 and 1000 m respectively of the total projected area flux at S05M (Table 4). Despite approximations (see Method section), we considered phycoerythrin as a relative indicator of diazotrophs in this study. The POC fluxes attributable to diazotrophs were relatively low (2.6 mg C m-2 d-1) at the shallowest depth (170 m), increased by 6-fold at 270 m (15.7 mg C m-2 d-1), then decreased at 1000 m (10.39 mg C m-2 d-1) (Table 4). However, due to the attenuation of total POC fluxes with depth, the evaluated contribution of diazotrophs to this flux increased with depth, potentially accounting for 7% at 170 m, 34% at 270 m and 51% to the overall POC flux at 1000 m (Table 4).
LNLC ecosystems are deemed to be poorly efficient at exporting C due to intense recycling of PP in surface waters (Buesseler et al., 2008; Buesseler and Boyd, 2009). Past studies using delta 15N budgets revealed that N2 fixation supports 50-80% of export production in the WTSP (Knapp et al., 2018), which has been recently confirmed during the TONGA cruise at our two studied stations on the same traps (64-76 ± 86% and 90-92 ± 50% at stations S05M and S10M, respectively, Bonnet et al., 2023b). Yet, the precise pathways by which diazotrophs are exported in this hot spot are poorly understood. Diazotrophs may be exported to the deep ocean through two major pathways: the direct gravitational sinking of diazotrophic organisms (Benavides et al., 2022; Bonnet et al., 2023a) and/or the transfer of their DDN to non-diazotrophic phytoplankton, zooplankton, and bacteria (Berthelot et al., 2016; Bonnet et al., 2016a; Caffin et al., 2018a), which are subsequently exported to the deep ocean as aggregates or fecal pellets (Siegel et al., 2016; Le Moigne, 2019). Consequently, the nature of organic matter derived from diazotrophy may be diazotrophs themselves, phytoplankton and/or zooplankton that have consumed DDN, detritus, fecal pellets, or a mixture of these.
Here we show that the POC fluxes were primarily driven by zooplankton derived particles (fecal pellets and aggregates, and zooplankton carcasses), with fecal aggregates dominating at 1000 m, while cylindrical fecal pellets and zooplankton carcasses dominated at 170 m (Table 3; Figure 5). The dominance of zooplankton derived particles is in line with the plankton community composition present in surface waters during the same expedition (Mériguet et al., 2023). This latter study reports that grazers, dominated by gelatinous carnivores, chaetognatha, copepoda, and other larger species, account for 34% (average abundance of 329 ind. m-3) of the total mesozooplankton community (>200 µm) between 0 and 200 m depth. The high POC fluxes derived from zooplankton particles suggest that the Fe-rich hydrothermal inputs from the Tonga arc have stimulated N2 fixation (Bonnet et al., 2023b), that in turn stimulated primary and secondary productions in this LNLC ecosystem. Mériguet et al. (2023) showed that diazotrophs dominated the microplankton (20-200 µm) community in the area of trap deployment (69% of the total community abundance of 5.105 ind.m-3) and that >80% of diazotrophs were Trichodesmium spp. In this ecosystem, diazotrophy supports >80% of export production (Bonnet et al., 2023b). The high POC flux derived from zooplankton particles suggest that the DDN has been efficiently transferred to the food web up to zooplankton and fecal pellets before being exported, pleading for an indirect export of diazotrophs. Previous studies based on 15N isotopic measurements on zooplankton reported that the DDN contribution to zooplankton biomass was estimated at ~25% in the Southern Baltic Sea (Wannicke et al., 2013), 30-40% in the tropical Atlantic (Montoya et al., 2002; Loick-Wilde et al., 2016), and 67-75% in the WTSP (Carlotti et al., 2018). Other studies based on direct observations, grazing experiments, or nifH detection in full-gut copepods, report that several copepod species graze on diverse diazotrophs such as Trichodesmium (O’Neil et al., 1996; O’Neil, 1999; Koski and Lombard, 2022), UCYN from groups A, B and C (Scavotto et al., 2015; Hunt et al., 2016; Conroy et al., 2017), Richelia (Hunt et al., 2016; Conroy et al., 2017), and Aphanizomenon (Wannicke et al., 2013; Koski and Lombard, 2022). Finally, 15N-labelling experiments revealed that diazotrophs can be a direct source of N supporting the metabolism of zooplankton (Loick-Wilde et al., 2012; Wannicke et al., 2013; Adam et al., 2016; Hunt et al., 2016; Caffin et al., 2018a). Altogether, these studies suggest that the pool of DDN can be efficiently transferred to zooplankton, which seems to be the case in the WTSP.
POC fluxes reconstructed in this study through the image analyses and conversion factors were 3 to 9-fold lower than those actually measured in the replicate biogeochemical tubes (Figure 6). We propose two main hypotheses to explain such differences. First, the volume-to-carbon conversion factors used here were originally determined for diatoms or fecal marine snow collected in temperate regions (Alldredge, 1998). However, because the composition of sinking particles varies across coastal, open ocean, temperate and subtropical environments (Durkin et al., 2021), carbon contents of particles -relative to their volumes- originating from different environments may also vary. Moreover, similar volume-to-carbon ratios are generally used to determine the carbon content of cylindrical fecal pellets. This likely did not accurately represent the diversity of cylindrical fecal pellets identified in our study, especially that it is highly dependent on the feeding behavior of zooplankton species and on ecosystem structure (Cavan et al., 2017). Durkin et al. (2021) showed that carbon contents obtained using the classical Alldredge’s conversion factors (Alldredge, 1998) and those they optimized were comparable for aggregates of sizes up to 709 µm ESD. This may suggest that our POC fluxes are coherent, as most of particles analyzed in our study have sizes between 120 and 700 µm ESD (Figure 4). Second, the cut-off we applied in one-to-one particle identification removed hundreds of small particles (<0.009 mm2). This cutoff has probably underestimated the small particle flux and, by extension, the total reconstructed flux. However, single particle identification is less biased than other approaches, such as automated identification, although it is time consuming and labor intensive. It allows to accurately identify sinking particles by visualizing them one by one.

Figure 6 Confocal microscopy images of random aggregates (blue, wavelength= 405 nm) (S05M) with diazotrophs and phycoeryhtrin-containing organisms (pink/red, wavelength= 555 nm) visualized at x10 magnification, at 170 m (A), 270 m (B) showing UCYN-like aggregates and 1000 m (C) showing Trichodesmium filaments.
Equations 4 to 6 are used for converting a given particle volume (mm3) into POC content (g). In our study, we used three different equations to take into account the variability of carbon content relative to size in three different categories of particles, namely, fecal aggregates, phytodetrital aggregates and cylindrical fecal pellets. These equations were taken from previous literature looking at particles carbon content, mainly from the two following references (Alldredge, 1998; Lehette and Hernández-León, 2009). The few previous papers looking at particles imaging and attempting to reconstruct POC flux from imaging (Ebersbach and Trull, 2008; Ebersbach et al., 2011; Laurenceau-Cornec et al., 2015) have used a similar set of equations. Likewise, Durkin et al., 2015 have used simpler approach by using a single equation directly relating carbon content to particle volume without no further distinction between particle types.
Such equations do not provide uncertainties unfortunately bacause they are empirically defined. They are based on field measurements that do not allow sufficient reproducibility to provide robust uncertainties. Collecting intact particles at sea is a challenge because large particles (which can be clearly identified as certain category and are the main contributor to the overall POC flux) are scarce and very fragile. For instance, defining uncertainties on such equations would require to have a several contiguous cohorts of particles of similar size (for example: 10 fecal pellets of exactly 300 µm, 10 fecal pellets of exactly 500 µm, 10 fecal pellets of exactly 1000 µm and so on) and measure their individual carbon content. In the field, particles size spectra are more complex than that, and the sampling strategy described in the sentence above is simply not possible to find. Currently, the sampling capacity of intact particles (enabling sizing and POC content measurement) is very limited to a few particles at the time suing the Marine Snow Catcher for instance (Riley et al., 2012). Therefore, uncertainties cannot be assessed at present.
The total reconstructed and measured POC fluxes decreased with depth by 66 and 47% at S05M and by 67% of the measured POC fluxes at S10M (Table 3; Figure 5). This is consistent with the decrease of POC by 46 and 55% between 150 and 500 m at station ALOHA assessed using neutrally buoyant sediment traps (Lamborg et al., 2008). In our study, the decrease of the total reconstructed POC flux was mainly due to the decrease of cylindrical fecal pellets and zooplankton carcasses fluxes by 94 and 84%, respectively between 170 and 270 m, while the particle flux of the categories of particles remained constant or even increased for fecal aggregates at S05M (Table 3; Figure 5). This suggests that a fragmentation of fecal material occurred at shallow depths, likely by bacterial activity or zooplankton coprorhexy (Lampitt et al., 1990; Suzuki et al., 2003; Iversen and Poulsen, 2007), followed by a reaggregation at depth by physical processes. For physical aggregation to occur, high particle concentrations are required (Jackson, 1990). Thus, the high fecal pellet flux at 170 m and its decrease at depth suggest that sufficient fragmented particles were released to allow a reaggregation into fecal aggregates at depth.
In addition, both estimated and measured export efficiencies (Eeff)(Table 5) were within the range of those reported in LNLC ecosystems (0.02-0.2) (Henson et al., 2019) but lower than those reported in the WTSP (0.2-0.4) using a mesocosm experiments (Berthelot et al., 2015), likely due to shallow depth of the mesocosms (15 m). Estimated Eeff and transfer efficiencies (Teff) were similar at both stations at 1000 m, whereas measured ones showed a more efficient export and transfer of POC at shallower depths at S05M and similar at 1000 m (Table 5). The similarities between the two stations may be explained by their geographical proximity and their belonging to the same biogeochemical province i.e. both are Fe fertilized by the shallow hydrothermal sources along the Tonga-Kermadec arc (Figure 1) (Bonnet et al., 2023b).
In addition to export pathways mediated by zooplankton partly sustained by DDN, our results also emphasize that diazotrophs gravitationally sink to the deep ocean as they are retrieved in sediment traps. With our method based on confocal microscopy, we were not able to accurately determine in which type of aggregates they were embedded, but the aggregates containing recognizable diazotrophs often looked fecal or mixed aggregates, with the exception of Trichodesmium colonies, which were often present as single filaments or entire colonies and were thus likely phytodetrital aggregates. We attempted to estimate the potential contribution of diazotrophs to the total POC export flux, and estimated that they could contribute from 7 to 51%, with a potential contribution increasing with depth. Although our method includes biases associated with the use of phycoerythrin as a relative indicator of the presence of diazotrophs (see details in method section) and the use of conversion factors, the trend obtained here is comparable with that obtained in a parallel study carried out in the same traps during the same campaign using quantitative PCR (Bonnet et al., 2023a). In the latter study, the authors estimated that the direct export of diazotrophs would contribute ~1% (at 170 m) to 85% (at 1000 m) of total PON export, and thus also report this trend of increasing contribution with depth, mostly due to the presence at 1000 m of large amounts of intact Trichodesmium spp. filaments and colonies having high carbon and nitrogen contents due to their large size (this study, Bonnet et al., 2023a). Finally, we also used nitrogen isotope budget to infer the contribution of N2 fixation to export production in the same traps (Bonnet et al., 2023b; Forrer et al., 2023). This approach reports that N2 fixation supports 77 to 84 ± 159% and 64 to 76 ± 86% of exported production at 170 and 270 m, respectively at the same station (S05M) (no data were available at 1000 m). These estimates are therefore comparable to those based on confocal microscopy (this study) and quantitative PCR (Bonnet et al., 2023a study), but are higher at the two shallowest depths. This seems logical as the approach based on nitrogen isotopes do not discriminate the direct export of diazotrophs, to the export of non-diazotrophic organisms which growth was supported by N2 fixation in surface waters (indirect export), and give the sum of both. In all, these three independant approaches indicate that diazotrophs leave the euphotic layer and are exported up to 1000 m depth, thus contributing to carbon export fluxes to the deep ocean.
The increasing contribution of diazotroph to the POC fluxes with depth may be explained by a temporal decoupling between surface production and export. MODIS satellite estimates of surface chlorophyll concentrations during the TONGA expedition (Supplementary Figure 2) indicate that the peak of chlorophyll occurred approximately two weeks before the traps deployment at this station (S05M). Thus, considering sinking velocities of filamentous and UCYN diazotroph aggregates (100 and 400 m d-1 respectively) measured in the laboratory by Ababou et al. (2023), they would reach the depth of 270 m within 0.67 to 3 days, and the depth of 1000 m within 2 to 10 days, which supports our hypothesis. Another hypothesis that could explain the higher contribution of diazotrophs to POC fluxes at 1000 m compared to that at is the high abundance of zooplankton carcasses (Table 3) at 170 m (thus increasing total POC, and decreasing the contribution of POC associated with diazotrophs) and gelatinous organisms (329 ind m-3) in shallow (0-200 m) waters (Mériguet et al., 2023). This suggests that these organisms may have ingested diazotrophs between 0 and 200 m, consequently decreasing their export flux at 170 m. Trichodesmium spp. has traditionally been considered as a food source for only few zooplankton species, mainly harpacticoid copepods (O’Neil and Roman, 1994) due to its toxicity (O’Neil, 1998), but recent studies suggest that they are grazed by other zooplankton species (Hunt et al., 2016; Koski and Lombard, 2022), although Trichodesmium spp. produces sulfuric compounds repulsive to grazers in Fe deficiency conditions (Bucciarelli et al., 2013). Because Fe was highly available in this area (Tilliette et al., 2022; Bonnet et al., 2023b) and Trichodesmium spp. has an efficient Fe uptake system (Lory et al., 2022), the hypothesis that Trichodesmium spp. would escape grazing by releasing zooplankton repulsive compounds is unlikely.
This study explored for the first time the composition of the sinking flux in the oligotrophic ocean. It was conducted in a hot spot of N2 fixation, in which diazotrophy supports the majority of export based on nitrogen isotopic budgets (Knapp et al., 2018; Bonnet et al., 2023b). Here we explored pathways though which diazotrophs support the export of organic matter. We reveal that fecal aggregates dominated the particles flux between 170 and 1000 m, suggesting that the DDN in the euphotic layer has been efficiently transferred to the food web up to zooplankton and fecal pellets before being exported, pleading for an indirect export of diazotrophs. Additionally, our study report that diazotrophic cells, filaments and colonies are present embedded in different categories of particles, mostly fecal and mixed aggregates, and account for a direct i.e. gravitational export pathways of diazotrophs. This indicates that diazotroph biomass can escape short-term sub-surface and mesopelagic remineralization and reach the deep ocean, where a fraction will be sequestered for long time scales. Additional investigation is needed in other oligotrophic regions to determine the contribution of diazotrophs to export fluxes at larger scales, and eventually integrate direct and indirect export pathways in biogeochemical models.
The datasets presented in this study can be found in online repositories. The names of the repository/repositories and accession number(s) can be found below: http://www.obs-vlfr.fr/proof/php/TONGA/tonga.php.
F-EA: Formal Analysis, Investigation, Methodology, Software, Writing – original draft, Writing – review & editing. FM: Conceptualization, Investigation, Methodology, Software, Supervision, Writing – review & editing. VC-B: Methodology, Software. VT: Conceptualization, Data curation, Investigation, Software. SB: Conceptualization, Data curation, Funding acquisition, Investigation, Methodology, Project administration, Resources, Supervision, Validation, Writing – review & editing.
The author(s) declare financial support was received for the research, authorship, and/or publication of this article. This work was performed in the framework of the TONGA project (TONGA cruise GEOTRACES GPpr14, November 2019, https://doi.org/10.17600/18000884) managed by the M.I.O (SB) and LOV (Cécile Guieu). The project was funded by the TGIR Flotte Océanographique Française, the A-MIDeX of Aix-Marseille University, the LEFE-CYBER and GMMC program and the Agence Nationale de Recherche (ANR-18-CE01-0016).
We warmly thank all the scientists, the captain, and the crew of the R/V L’Atalante for their cooperative work at sea during the TONGA cruise.
The authors declare that the research was conducted in the absence of any commercial or financial relationships that could be construed as a potential conflict of interest.
All claims expressed in this article are solely those of the authors and do not necessarily represent those of their affiliated organizations, or those of the publisher, the editors and the reviewers. Any product that may be evaluated in this article, or claim that may be made by its manufacturer, is not guaranteed or endorsed by the publisher.
The Supplementary Material for this article can be found online at: https://www.frontiersin.org/articles/10.3389/fmars.2023.1290625/full#supplementary-material
Ababou F., Le Moigne F. A. C., Grosso O., Guigue C., Nunige S., Camps M., et al. (2023). Mechanistic understanding of diazotroph aggregation and sinking: “A rolling tank approach. Limnol. Oceanogr. 68 (3), 666–677. doi: 10.1002/lno.12301
Adam B., Klawonn I., Svedén J. B., Bergkvist J., Nahar N., Walve J., et al. (2016). N2-fixation, ammonium release and N-transfer to the microbial and classical food web within a plankton community. ISME J. 10, 450–459. doi: 10.1038/ismej.2015.126
Agusti S., González-Gordillo J. I., Vaqué D., Estrada M., Cerezo M. I., Salazar G., et al. (2015). Ubiquitous healthy diatoms in the deep sea confirm deep carbon injection by the biological pump. Nat. Commun. 6, 7608. doi: 10.1038/ncomms8608
Alldredge A. (1998). The carbon, nitrogen and mass content of marine snow as a function of aggregate size. Deep Sea Res. Part Oceanogr. Res. Pap. 45, 529–541. doi: 10.1016/S0967-0637(97)00048-4
Alldredge A. L., Gotschalk C. (1988). In situ settling behavior of marine snow1: Sinking rates of marine snow. Limnol. Oceanogr. 33, 339–351. doi: 10.4319/lo.1988.33.3.0339
Aumont O., Maury O., Lefort S., Bopp L. (2018). Evaluating the potential impacts of the diurnal vertical migration by marine organisms on marine biogeochemistry. Glob. Biogeochem. Cycles 32, 1622–1643. doi: 10.1029/2018GB005886
Bach L. T., Stange P., Taucher J., Achterberg E. P., Algueró-Muñiz M., Horn H., et al. (2019). The influence of plankton community structure on sinking velocity and remineralization rate of marine aggregates. Glob. Biogeochem. Cycles 33, 971–994. doi: 10.1029/2019GB006256
Baker C. A., Estapa M. L., Iversen M., Lampitt R., Buesseler K. (2020). Are all sediment traps created equal? An intercomparison study of carbon export methodologies at the PAP-SO site. Prog. Oceanogr. 184, 102317. doi: 10.1016/j.pocean.2020.102317
Baumas C., Bizic M. (2023). Did you say marine snow? Zooming into different types of organic matter particles and their importance in the open ocean carbon cycle. EarthArXiv. doi: 10.31223/X5RM1T
Benavides M., Bonnet S., Le Moigne F. A. C., Armin G., Inomura K., Hallstrøm S., et al. (2022). Sinking Trichodesmium fixes nitrogen in the dark ocean. ISME J. 16, 2398–2405. doi: 10.1038/s41396-022-01289-6
Berthelot H., Bonnet S., Grosso O., Cornet V., Barani A. (2016). Transfer of diazotroph-derived nitrogen towards non-diazotrophic planktonic communities: a comparative study between Trichodesmium erythraeum, Crocosphaera watsonii and Cyanothece sp. Biogeosciences 13, 4005–4021. doi: 10.5194/bg-13-4005-2016
Berthelot H., Moutin T., L’Helguen S., Leblanc K., Hélias S., Grosso O.. (2015). Dinitrogen fixation and dissolved organic nitrogen fueled primary production and particulate export during the VAHINE mesocosm experiment (New Caledonia lagoon). Biogeosciences 12, 4099–4112. doi: 10.5194/bg-12-4099-2015
Bianchi D., Stock C., Galbraith E. D., Sarmiento J. L. (2013). Diel vertical migration: Ecological controls and impacts on the biological pump in a one-dimensional ocean model. Glob. Biogeochem. Cycles 27, 478–491. doi: 10.1002/gbc.20031
Billones R. G., Tackx M. L. M., Flachier A. T., Zhu L., Daro M. H. (1999). Image analysis as a tool for measuring particulate matter concentrations and gut content, body size, and clearance rates of estuarine copepods: validation and application. J. Mar. Syst. 22, 179–194. doi: 10.1016/S0924-7963(99)00040-8
Bonnet S., Berthelot H., Turk-Kubo K., Cornet-Barthaux W., Fawcett S., Berman-Frank I., et al. (2016a). Diazotroph derived nitrogen supports diatom growth in the South West Pacific: A quantitative study using nanoSIMS. Limnol. Oceanogr. 61, 1549–1562. doi: 10.1002/lno.10300
Bonnet S., Berthelot H., Turk-Kubo K., Fawcett S., Rahav E., L’Helguen S., et al. (2016b). Dynamics of N2 fixation and fate of diazotroph-derived nitrogen in a low-nutrient, low-chlorophyll ecosystem: results from the VAHINE mesocosm experiment (New Caledonia). Biogeosciences 13, 2653–2673. doi: 10.5194/bg-13-2653-2016
Bonnet S., Caffin M., Berthelot H., Grosso O., Benavides M., Helias-Nunige S., et al. (2018). In-depth characterization of diazotroph activity across the western tropical South Pacific hotspot of N 2 fixation (OUTPACE cruise). Biogeosciences 15, 4215–4232. doi: 10.5194/bg-15-4215-2018
Bonnet S., Caffin M., Berthelot H., Moutin T. (2017). Hot spot of N 2 fixation in the western tropical South Pacific pleads for a spatial decoupling between N 2 fixation and denitrification. Proc. Natl. Acad. Sci. 114 (14), E2800–E2801. doi: 10.1073/pnas.1619514114
Bonnet S., Benavides M., Le Moigne F. A. C., Camps M., Torremocha A., Grosso O. (2023a). Diazotrophs are overlooked contributors to carbon and nitrogen export to the deep ocean. ISME J. 17, 47–58. doi: 10.1038/s41396-022-01319-3
Bonnet S., Guieu C., Taillandier V., Boulart C., Bouruet-Aubertot P., Gazeau F. (2023b). Natural iron fertilization by shallow hydrothermal sources fuels diazotroph blooms in the ocean. Science 380, 812–817. doi: 10.1126/science.abq4654
Bonnet S., Rodier M., Turk-Kubo K. A., Germineaud C., Menkes C., Ganachaud A. (2015). Contrasted geographical distribution of N2 fixation rates and nifH phylotypes in the Coral and Solomon Seas (southwestern Pacific) during austral winter conditions. Glob. Biogeochem. Cycles 29, 1874–1892. doi: 10.1002/2015GB005117
Böttjer D., Dore J. E., Karl D. M., Letelier R. M., Mahaffey C., Wilson S. T., et al. (2017). Temporal variability of nitrogen fixation and particulate nitrogen export at Station ALOHA. Limnol. Oceanogr. 62, 200–216. doi: 10.1002/lno.10386
Boyd P. W., Claustre H., Levy M., Siegel D. A., Weber T. (2019). Multi-faceted particle pumps drive carbon sequestration in the ocean. Nature 568, 327–335. doi: 10.1038/s41586-019-1098-2
Bucciarelli E., Ridame C., Sunda W. G., Dimier-Hugueney C., Cheize M., Belviso S. (2013). Increased intracellular concentrations of DMSP and DMSO in iron-limited oceanic phytoplankton Thalassiosira oceanica and Trichodesmium erythraeum. Limnol. Oceanogr. 58, 1667–1679. doi: 10.4319/lo.2013.58.5.1667
Buesseler K. O., Bacon M. P., Cochran J. K., Livingston H. D. (1992). Carbon and nitrogen export during the JGOFS North Atlantic Bloom Experiment estimated from 234Th: 238U disequilibria. Deep Sea Res. Part Oceanogr. Res. Pap. 39, 1115–1137. doi: 10.1016/0198-0149(92)90060-7
Buesseler K., Ball L., Andrews J., Benitez-Nelson C., Belastock R., Chai F., et al. (1998). Upper ocean export of particulate organic carbon in the Arabian Sea derived from thorium-234. Deep Sea Res. Part II Top. Stud. Oceanogr. 45, 2461–2487. doi: 10.1016/S0967-0645(98)80022-2
Buesseler K. O., Boyd P. W. (2009). Shedding light on processes that control particle export and flux attenuation in the twilight zone of the open ocean. Limnol. Oceanogr. 54, 1210–1232. doi: 10.4319/lo.2009.54.4.1210
Buesseler K. O., Boyd P. W., Black E. E., Siegel D. A. (2020). Metrics that matter for assessing the ocean biological carbon pump. Proc. Natl. Acad. Sci. 117, 9679–9687. doi: 10.1073/pnas.1918114117
Buesseler K. O., Trull T. W., Steinberg D. K., Silver M. W., Siegel D. A., Saitoh S.-I. (2008). VERTIGO (VERtical Transport In the Global Ocean): A study of particle sources and flux attenuation in the North Pacific. Deep Sea Res. Part II Top. Stud. Oceanogr. 55, 1522–1539. doi: 10.1016/j.dsr2.2008.04.024
Burd A. B., Jackson G. A. (2009). Particle aggregation. Annu. Rev. Mar. Sci. 1, 65–90. doi: 10.1146/annurev.marine.010908.163904
Caffin M., Berthelot H., Cornet-Barthaux V., Barani A., Bonnet S. (2018b). Transfer of diazotroph-derived nitrogen to the planktonic food web across gradients of N2 fixation activity and diversity in the western tropical South Pacific Ocean. Biogeosciences 15, 3795–3810. doi: 10.5194/bg-15-3795-2018
Caffin M., Moutin T., Foster R. A., Bouruet-Aubertot P., Doglioli A. M., Berthelot H. (2018a). N2 fixation as a dominant new N source in the western tropical South Pacific Ocean (OUTPACE cruise). Biogeosciences 15, 2565–2585. doi: 10.5194/bg-15-2565-2018
Carlotti F., Pagano M., Guilloux L., Donoso K., Valdés V., Grosso O., et al. (2018). Meso-zooplankton structure and functioning in the western tropical South Pacific along the 20th parallel south during the OUTPACE survey (February–April 2015). Biogeosciences 15, 7273–7297. doi: 10.5194/bg-15-7273-2018
Cavan E. L., Henson S. A., Belcher A., Sanders R. (2017). Role of zooplankton in determining the efficiency of the biological carbon pump. Biogeosciences 14, 177–186. doi: 10.5194/bg-14-177-2017
Conroy B. J., Steinberg D. K., Song B., Kalmbach A., Carpenter E. J., Foster R. A. (2017). Mesozooplankton graze on cyanobacteria in the Amazon River plume and western tropical North Atlantic. Front. Microbiol. 8. doi: 10.3389/fmicb.2017.01436
Dai L., Li C., Yang G., Sun X. (2016). Zooplankton abundance, biovolume and size spectra at western boundary currents in the subtropical North Pacific during winter 2012. J. Mar. Syst. 155, 73–83. doi: 10.1016/j.jmarsys.2015.11.004
Dall’Olmo G., Dingle J., Polimene L., Brewin R. J. W., Claustre H. (2016). Substantial energy input to the mesopelagic ecosystem from the seasonal mixed-layer pump. Nat. Geosci. 9, 820–823. doi: 10.1038/ngeo2818
De La Rocha C. L., Passow U. (2007). Factors influencing the sinking of POC and the efficiency of the biological carbon pump. Deep Sea Res. Part II Top. Stud. Oceanogr. 54, 639–658. doi: 10.1016/j.dsr2.2007.01.004
Dron A., Rabouille S., Claquin P., Chang P., Raimbault V., Talec A., et al. (2012). Light:dark (12:12 h) quantification of carbohydrate fluxes in Crocosphaera watsonii. Aquat. Microb. Ecol. 68, 43–55. doi: 10.3354/ame01600
Durkin C. A., Buesseler K. O., Cetinić I., Estapa M. L., Kelly R. P., Omand M. (2021). A visual tour of carbon export by sinking particles. Glob. Biogeochem. Cycles 35, e2021GB006985. doi: 10.1029/2021GB006985
Durkin C. A., Margaret L. E., Buesseler K. O. (2015). Observations of carbon export by small sinking particles in the upper mesopelagic. Mar. Chem. 175, 72–81. doi: 10.1016/j.marchem.2015.02.011
Ebersbach F., Trull T. W. (2008). Sinking particle properties from polyacrylamide gels during the KErguelen Ocean and Plateau compared Study (KEOPS): Zooplankton control of carbon export in an area of persistent natural iron inputs in the Southern Ocean. Limnol. Oceanogr. 53, 212–224. doi: 10.4319/lo.2008.53.1.0212
Ebersbach F., Trull T. W., Davies D. M., Bray S. G. (2011). Controls on mesopelagic particle fluxes in the Sub-Antarctic and Polar Frontal Zones in the Southern Ocean south of Australia in summer—Perspectives from free-drifting sediment traps. Deep Sea Res. Part II: Topical Stud. Oceanography 58 (21-22), 2260–2276. doi: 10.1016/j.dsr2.2011.05.025
Eppley R. W., Peterson B. J. (1979). Particulate organic matter flux and planktonic new production in the deep ocean. Nature 282, 677–680. doi: 10.1038/282677a0
Forrer H. J., Bonnet S., Thomas R. K., Grosso O., Guieu C., Knapp A. N. (2023). Quantifying N2 fixation and its contribution to export production near the Tonga-Kermadec Arc using nitrogen isotope budgets. Front. Mar. Sci. 10. doi: 10.3389/fmars.2023.1249115
Francois R., Honjo S., Krishfield R., Manganini S. (2002). Factors controlling the flux of organic carbon to the bathypelagic zone of the ocean: FACTORS CONTROLLING ORGANIC CARBON FLUX. Glob. Biogeochem. Cycles 16, 34-1-34–20. doi: 10.1029/2001GB001722
Goebel N. L., Edwards C. A., Carter B. J., Achilles K. M., Zehr J. P. (2008). GROWTH AND CARBON CONTENT OF THREE DIFFERENT-SIZED DIAZOTROPHIC CYANOBACTERIA OBSERVED IN THE SUBTROPICAL NORTH PACIFIC 1. J. Phycol. 44, 1212–1220. doi: 10.1111/j.1529-8817.2008.00581.x
Gonzalez H. E., Smetacek V. (1994). The possible role of the cyclopoid copepod Oithona in retarding vertical flux of zooplankton faecal material. Mar. Ecol. Prog. Ser. 113, 233–246. doi: 10.3354/meps113233
Grabowski M. N. W., Church M. J., Karl D. M. (2008). Nitrogen fixation rates and controls at Stn ALOHA. Aquat Microb. Ecol. 52, 175–183. doi: 10.3354/ame01209
Haskell W. Z. II, Prokopenko M. G., Hammond D. E., Stanley R. H. R., Sandwith Z. O. (2017). Annual cyclicity in export efficiency in the inner Southern California Bight. Glob. Biogeochem. Cycles 31, 357–376. doi: 10.1002/2016GB005561
Henson S., Le Moigne F., Giering S. (2019). Drivers of carbon export efficiency in the global ocean. Glob. Biogeochem. Cycles 33, 891–903. doi: 10.1029/2018GB006158
Henson S. A., Sanders R., Madsen E. (2012). Global patterns in efficiency of particulate organic carbon export and transfer to the deep ocean: EXPORT AND TRANSFER EFFICIENCY. Glob. Biogeochem. Cycles 26. doi: 10.1029/2011GB004099
Henson S. A., Sanders R., Madsen E., Morris P. J., Le Moigne F., Quartly G. D. (2011). A reduced estimate of the strength of the ocean’s biological carbon pump. Geophys. Res. Lett. 38. doi: 10.1029/2011GL046735
Hunt B. P. V., Bonnet S., Berthelot H., Conroy B. J., Foster R. A., Pagano M. (2016). Contribution and pathways of diazotroph-derived nitrogen to zooplankton during the VAHINE mesocosm experiment in the oligotrophic New Caledonia lagoon. Biogeosciences 13, 3131–3145. doi: 10.5194/bg-13-3131-2016
Iversen M. H. (2023). Carbon export in the ocean: A biologist’s perspective. Annu. Rev. Mar. Sci. 15, 357–381. doi: 10.1146/annurev-marine-032122-035153
Iversen M. H., Poulsen L. K. (2007). Coprorhexy, coprophagy, and coprochaly in the copepods Calanus helgolandicus, Pseudocalanus elongatus, and Oithona similis. Mar. Ecol. Prog. Ser. 350, 79–89. doi: 10.3354/meps07095
Jackson G. A. (1990). A model of the formation of marine algal flocs by physical coagulation processes. Deep Sea Res. Part Oceanogr. Res. Pap. 37, 1197–1211. doi: 10.1016/0198-0149(90)90038-W
Jannasch H. W., Zafiriou O. C., Farrington J. W. (1980). A sequencing sediment trap for time-series studies of fragile particles 1, 2. Limnol. Oceanogr. 25, 939–943. doi: 10.4319/lo.1980.25.5.0939
Jónasdóttir S. H., Visser A. W., Richardson K., Heath M. R. (2015). Seasonal copepod lipid pump promotes carbon sequestration in the deep North Atlantic. Proc. Natl. Acad. Sci. 112, 12122–12126. doi: 10.1073/pnas.1512110112
Karl D. M., Bates N. R., Emerson S., Harrison P. J., Jeandel C., Llinás O. (2003). “Temporal studies of biogeochemical processes determined from ocean time-series observations during the JGOFS era,” in Ocean biogeochemistry. Ed. Fasham M. J. R. (Ocean Biogeochemistry: Springer Berlin Heidelberg), 239–267. doi: 10.1007/978-3-642-55844-3_11
Karl D. M., Hebel D. V., Björkman K., Letelier R. M. (1998). The role of dissolved organic matter release in the productivity of the oligotrophic North Pacific Ocean. Limnol. Oceanogr. 43, 1270–1286. doi: 10.4319/lo.1998.43.6.1270
Karl D. M., Letelier R. M., Bidigare R. R., Björkman K. M., Church M. J., Dore J. E., et al. (2021). Seasonal-to-decadal scale variability in primary production and particulate matter export at Station ALOHA. Prog. Oceanogr. 195, 102563. doi: 10.1016/j.pocean.2021.102563
Knapp A. N., McCabe K. M., Grosso O., Leblond N., Moutin T., Bonnet S. (2018). Distribution and rates of nitrogen fixation in the western tropical South Pacific Ocean constrained by nitrogen isotope budgets. Biogeosciences 15, 2619–2628. doi: 10.5194/bg-15-2619-2018
Knapp A. N., Sigman D. M., Lipschultz F. (2005). N isotopic composition of dissolved organic nitrogen and nitrate at the Bermuda Atlantic Time-series Study site: N ISOTOPES OF DON AND NITRATE AT BATS. Glob. Biogeochem. Cycles 19. doi: 10.1029/2004GB002320
Koski M., Lombard F. (2022). Functional responses of aggregate-colonizing copepods. Limnol. Oceanogr. 67, 2059–2072. doi: 10.1002/lno.12187
Lamborg C. H., Buesseler K. O., Valdes J., Bertrand C. H., Bidigare R., Manganini S. (2008). The flux of bio-and lithogenic material associated with sinking particles in the mesopelagic “twilight zone” of the northwest and North Central Pacific Ocean. Deep Sea Res. Part II Top. Stud. Oceanogr. 55, 1540–1563. doi: 10.1016/j.dsr2.2008.04.011
Lampitt R. S., Noji T., Von Bodungen B. (1990). What happens to zooplankton faecal pellets? Implications for material flux. Mar. Biol. 104, 15–23. doi: 10.1007/BF01313152
Laurenceau-Cornec E. C., Trull T. W., Davies D. M., Bray S. G., Doran J., Planchon F. (2015). The relative importance of phytoplankton aggregates and zooplankton fecal pellets to carbon export: insights from free-drifting sediment trap deployments in naturally iron-fertilised waters near the Kerguelen Plateau. Biogeosciences 12, 1007–1027. doi: 10.5194/bg-12-1007-2015
Laws E. A., Falkowski P. G., Smith W. O. Jr., Ducklow H., McCarthy J. J. (2000). Temperature effects on export production in the open ocean. Glob. Biogeochem. Cycles 14, 1231–1246. doi: 10.1029/1999GB001229
Laws E. A., Maiti K. (2019). The relationship between primary production and export production in the ocean: Effects of time lags and temporal variability. Deep Sea Res. Part Oceanogr. Res. Pap. 148, 100–107. doi: 10.1016/j.dsr.2019.05.006
Lehette P., Hernández-León S. (2009). Zooplankton biomass estimation from digitized images: a comparison between subtropical and Antarctic organisms. Limnol. Oceanogr. Methods 7, 304–308. doi: 10.4319/lom.2009.7.304
Le Moigne F. A. C. (2019). Pathways of organic carbon downward transport by the oceanic biological carbon pump. Front. Mar. Sci. 6. doi: 10.3389/fmars.2019.00634
Le Moigne F. A., Poulton A. J., Henson S. A., Daniels C. J., Fragoso G. M., Mitchell E. (2015). Carbon export efficiency and phytoplankton community composition in the A tlantic sector of the Arctic Ocean. J. Geophys. Res. Oceans 120, 3896–3912. doi: 10.1002/2015JC010700
Levy M., Bopp L., Karleskind P., Resplandy L., Ethe C., Pinsard F. (2013). Physical pathways for carbon transfers between the surface mixed layer and the ocean interior: PHYSICAL CARBON FLUXES. Glob. Biogeochem. Cycles 27, 1001–1012. doi: 10.1002/gbc.20092
Loick-Wilde N., Dutz J., Miltner A., Gehre M., Montoya J. P., Voss M. (2012). Incorporation of nitrogen from N2 fixation into amino acids of zooplankton. Limnol. Oceanogr. 57, 199–210. doi: 10.4319/lo.2012.57.1.0199
Loick-Wilde N., Weber S. C., Conroy B. J., Capone D. G., Coles V. J., Medeiros P. M., et al. (2016). Nitrogen sources and net growth efficiency of zooplankton in three A mazon River plume food webs. Limnol. Oceanogr. 61, 460–481. doi: 10.1002/lno.10227
Lory C., Van Wambeke F., Fourquez M., Barani A., Guieu C., Tilliette C. (2022). Assessing the contribution of diazotrophs to microbial Fe uptake using a group specific approach in the Western Tropical South Pacific Ocean. ISME Commun. 2, 41. doi: 10.1038/s43705-022-00122-7
Lundsgaard C. (1995). Use of a high viscosity medium in studies of aggregates, in Sediment trap studies in the Nordic countries 3. Proceedings of the Symposium on Seasonal Dynamics of Planktonic Ecosystems and Sedimentation in Coastal Nordic Waters. Eds. Floderus S., Heisakanen A. S., Oleson M., Wassman P. (Helsinki: Finnish Environment Agency), 141–152.
Luo Y.-W., Doney S. C., Anderson L. A., et al. (2012). Database of diazotrophs in global ocean: abundance, biomass and nitrogen fixation rates. Earth Syst. Sci. Data 4, 47–73. doi: 10.5194/essd-4-47-2012
Maiti K., Bosu S., D’sa E. J., Adhikari P. L., Sutor M., Longnecker K. (2016). Export fluxes in northern Gulf of Mexico-Comparative evaluation of direct, indirect and satellite-based estimates. Mar. Chem. 184, 60–77. doi: 10.1016/j.marchem.2016.06.001
Mériguet Z., Vilain M., Baudena A., Tilliette C., Habasque J., Lebourges-Dhaussy A. (2023). Plankton community structure in response to hydrothermal iron inputs along the Tonga-Kermadec arc. Front. Mar. Sci. 10. doi: 10.3389/fmars.2023.1232923
Montoya J. P., Carpenter E. J., Capone D. G. (2002). Nitrogen fixation and nitrogen isotope abundances in zooplankton of the oligotrophic North Atlantic. Limnol. Oceanogr. 47, 1617–1628. doi: 10.4319/lo.2002.47.6.1617
Omand M. M., D’Asaro E. A., Lee C. M., Perry M. J., Briggs N., Cetinić I., et al. (2015). Eddy-driven subduction exports particulate organic carbon from the spring bloom. Science 348, 222–225. doi: 10.1126/science.1260062
O’Neil J. M. (1998). The colonial cyanobacterium Trichodesmium as a physical and nutritional substrate for the harpacticoid copepod Macrosetella gracilis. J. Plankton Res. 20, 43–59. doi: 10.1093/plankt/20.1.43
O’Neil J. M. (1999). Grazer interactions with nitrogen-fixing marine Cyanobacteria: adaptation for N-acquisition? Bull.-Inst. Oceanogr. MONACO-NUMERO Spec., 293–318.
O’Neil J. M., Metzler P. M., Glibert P. M. (1996). Ingestion of 15N2-labelled Trichodesmium spp. and ammonium regeneration by the harpacticoid copepod Macrosetella gracilis. Mar. Biol. 125, 89–96. doi: 10.1007/BF00350763
O’Neil J. M., Roman M. R. (1994). Ingestion of the cyanobacterium Trichodesmium spp. by pelagic harpacticoid copepods Macrosetella, Miracia and Oculosetella. Hydrobiologia 292, 235–240. doi: 10.1007/BF00229946
Pabortsava K., Lampitt R. S., Benson J., Crowe C., McLachlan R., Le Moigne F. A. C., et al. (2017). Carbon sequestration in the deep Atlantic enhanced by Saharan dust. Nat. Geosci. 10, 189–194. doi: 10.1038/ngeo2899
Poff K. E., Leu A. O., Eppley J. M., Karl D. M., DeLong E. F. (2021). Microbial dynamics of elevated carbon flux in the open ocean’s abyss. Proc. Natl. Acad. Sci. 118, e2018269118. doi: 10.1073/pnas.2018269118
Quay P. D., Peacock C., Björkman K., Karl D. M. (2010). Measuring primary production rates in the ocean: Enigmatic results between incubation and non-incubation methods at Station ALOHA. Glob. Biogeochem. Cycles 24. doi: 10.1029/2009GB003665
Riley J. S., Sanders R., Marsay C., Le Moigne F. A. C., Achterberg E. P., Poulton A. J. (2012). The relative contribution of fast and slow sinking particles to ocean carbon export. Global Biogeochemical Cycles 26 (1). doi: 10.1029/2011GB004085
Scavotto R. E., Dziallas C., Bentzon-Tilia M., Riemann L., Moisander P. H. (2015). Nitrogen-fixing bacteria associated with copepods in coastal waters of the N orth A tlantic O cean. Environ. Microbiol. 17, 3754–3765. doi: 10.1111/1462-2920.12777
Schindelin J., Rueden C. T., Hiner M. C., Eliceiri K. W. (2015). The ImageJ ecosystem: An open platform for biomedical image analysis. Mol. Reprod. Dev. 82, 518–529. doi: 10.1002/mrd.22489
Shao Z., Xu Y., Wang H., Luo W., Wang L., Huang Y., et al. (2023). Global oceanic diazotroph database version 2 and elevated estimate of global oceanic N2 fixation. Earth Syst. Sci. Data 15 (8 ESSD), 3673–3709. doi: 10.5194/essd-2023-13
Siegel D. A., Buesseler K. O., Behrenfeld M. J., Benitez-Nelson C. R., Boss E., Brzezinski M. A., et al. (2016). Prediction of the export and fate of global ocean net primary production: the EXPORTS science plan. Front. Mar. Sci. 3. doi: 10.3389/fmars.2016.00022
Siegel D. A., Buesseler K. O., Doney S. C., Sailley S. F., Behrenfeld M. J., Boyd P. W. (2014). Global assessment of ocean carbon export by combining satellite observations and food-web models. Glob. Biogeochem. Cycles 28, 181–196. doi: 10.1002/2013GB004743
Stange P., Bach L. T., Le Moigne F. A., Taucher J., Boxhammer T., Riebesell U. (2017). Quantifying the time lag between organic matter production and export in the surface ocean: Implications for estimates of export efficiency. Geophys. Res. Lett. 44, 268–276. doi: 10.1002/2016GL070875
Steinberg D. K., Cope J. S., Wilson S. E., Kobari T. (2008). A comparison of mesopelagic mesozooplankton community structure in the subtropical and subarctic North Pacific Ocean. Deep Sea Res. Part II Top. Stud. Oceanogr. 55, 1615–1635. doi: 10.1016/j.dsr2.2008.04.025
Steinberg D. K., Landry M. R. (2017). Zooplankton and the ocean carbon cycle. Annu. Rev. Mar. Sci. 9, 413–444. doi: 10.1146/annurev-marine-010814-015924
Stukel M. R., Aluwihare L. I., Barbeau K. A., Chekalyuk A. M., Goericke R., Miller A. J., et al. (2017). Mesoscale ocean fronts enhance carbon export due to gravitational sinking and subduction. Proc. Natl. Acad. Sci. 114, 1252–1257. doi: 10.1073/pnas.1609435114
Suzuki H., Sasaki H., Fukuchi M. (2003). Loss processes of sinking fecal pellets of zooplankton in the mesopelagic layers of the Antarctic marginal ice zone. J. Oceanogr. 59, 809–818. doi: 10.1023/B:JOCE.0000009572.08048.0d
Tilliette C., Taillandier V., Bouruet-Aubertot P., Grima N., Maes C., Montanes M., et al. (2022). Dissolved iron patterns impacted by shallow hydrothermal sources along a transect through the Tonga-Kermadec Arc. Glob. Biogeochem. Cycles 36, e2022GB007363. doi: 10.1029/2022GB007363
Turner J. (2002). Zooplankton fecal pellets, marine snow and sinking phytoplankton blooms. Aquat. Microb. Ecol. 27, 57–102. doi: 10.3354/ame027057
Waite A. M., Safi K. A., Hall J. A., Nodder S. D. (2000). Mass sedimentation of picoplankton embedded in organic aggregates. Limnol. Oceanogr. 45, 87–97. doi: 10.4319/lo.2000.45.1.0087
Wang W. L., Fu W., Le Moigne F. A.C., Letscher R. T., Liu Y., Tang J. -M., et al. (2023). Biological carbon pump estimate based on multidecadal hydrographic data. Nature 624, 579–585. doi: 10.1038/s41586-023-06772-4
Wannicke N., Korth F., Liskow I., Voss M. (2013). Incorporation of diazotrophic fixed N2 by mesozooplankton—Case studies in the southern Baltic Sea. J. Mar. Syst. 117, 1–13. doi: 10.1016/j.marsys.2013.03.005
Wassmann P., Ypma J. E., Tselepides A. (2000). Vertical flux of faecal pellets and microplankton on the shelf of the oligotrophic Cretan Sea (NE Mediterranean Sea). Prog. Oceanogr. 46, 241–258. doi: 10.1016/S0079-6611(00)00021-5
White A. E., Watkins-Brandt K. S., Church M. J. (2018). Temporal variability of Trichodesmium spp. and diatom-diazotroph assemblages in the North Pacific subtropical gyre. Front. Mar. Sci. 5. doi: 10.3389/fmars.2018.00027
Keywords: biological carbon pump, carbon export, export efficiency, transfer efficiency, diazotrophs
Citation: Ababou F-E, Le Moigne FAC, Cornet-Barthaux V, Taillandier V and Bonnet S (2024) Composition of the sinking particle flux in a hot spot of dinitrogen fixation revealed through polyacrylamide gel traps. Front. Mar. Sci. 10:1290625. doi: 10.3389/fmars.2023.1290625
Received: 07 September 2023; Accepted: 26 December 2023;
Published: 30 January 2024.
Edited by:
Hiroaki Saito, The University of Tokyo, JapanReviewed by:
Fuminori Hashihama, Tokyo University of Marine Science and Technology, JapanCopyright © 2024 Ababou, Le Moigne, Cornet-Barthaux, Taillandier and Bonnet. This is an open-access article distributed under the terms of the Creative Commons Attribution License (CC BY). The use, distribution or reproduction in other forums is permitted, provided the original author(s) and the copyright owner(s) are credited and that the original publication in this journal is cited, in accordance with accepted academic practice. No use, distribution or reproduction is permitted which does not comply with these terms.
*Correspondence: Sophie Bonnet, c29waGllLmJvbm5ldEBtaW8ub3N1cHl0aGVhcy5mcg==; Frédéric A. C. Le Moigne, ZmxlbW9pZ25lMUB1bml2LWJyZXN0LmZy
Disclaimer: All claims expressed in this article are solely those of the authors and do not necessarily represent those of their affiliated organizations, or those of the publisher, the editors and the reviewers. Any product that may be evaluated in this article or claim that may be made by its manufacturer is not guaranteed or endorsed by the publisher.
Research integrity at Frontiers
Learn more about the work of our research integrity team to safeguard the quality of each article we publish.