 Xiu-Mei Fu
 Yan-Xin Tan1
 Chun-Yu Lin
- 1School of Economics, Ocean University of China, Qingdao, China
- 2Ocean College, Zhejiang University, Zhoushan, China
- 3Ocean Research Center of Zhoushan, Zhejiang University, Zhoushan, China
As one of the important forces promoting the development of the marine economy, the marine biomedical industry (MBI) shows typical knowledge and technology-intensive characteristics. It is of great significance to explore the industrial innovation dynamic mechanism for breaking through the bottleneck of innovative development as well as achieving high-quality development. This paper constructed a system dynamics model for scientific and technological innovation (STI) in the MBI and then explored the dynamic mechanism of STI in the industry through simulation. The study found that, in the innovation environment subsystem, the two factors of the intellectual property protection intensity and the government’s scientific research funding input had the most significant positive driving effects on STI of the MBI; the promotion of government education funding input showed a significant strengthening trend over time, while the marine environmental regulation intensity had comparatively little effect on the level of STI. In the subsystem of innovation input, both innovation funding input and innovation personnel input were the direct driving forces for the improvement of the STI level. And enterprises played a dominant role in STI because the STI level of the MBI was more sensitive to the changes in enterprise innovation input. Compared with the individual factor input, the synergistic promotion effect of multiple factors is more significant. In addition, it was found that there was a low conversion rate of scientific research achievements in China’s MBI by analyzing the influence of various factors changing on technological output and economic output. Based on the research results, this paper puts forward corresponding policy suggestions in order to provide theoretical support and a practical basis for promoting the technological innovation level of China’s MBI as well as references for other countries.
1 Introduction
In recent years, the marine economy has attracted high attention from various countries (Stebbings et al., 2020; Pace et al., 2023a). The marine biomedical industry (MBI), as a strategic emerging industry with great development potential, its rapid development is of great significance for fully utilizing marine medicinal biological resources and promoting sustainable development of the marine economy. Under the condition of continuous threats to human health and constraints of resources and environment, the United Nations has proposed to improve global health to enhance human well-being and promote sustainable utilization of marine resources and the environment through scientific and technological innovation (STI) (United Nations, 2014; Pace et al., 2023b). As early as the 1990s, major marine countries put forward international major plans such as the “Marine Biotechnology Plan”, and the MBI has developed rapidly, making important contributions to solving major difficult diseases such as diabetes, cardiovascular and cerebrovascular diseases, and improving human health. China’s MBI has developed rapidly under the background of the “Marine Power” strategy. According to the “China Marine Economic Bulletin”, the average annual growth rate of China’s MBI has exceeded 40% from 2010 to 2021. The MBI has become an important engine for promoting the transformation and upgrading of the marine industry and realizing high-quality development of the marine economy in China (Li et al., 2023). However, there is still a big gap between China’s MBI and developed countries. The overall development level of the industry is not high with the lagging progress of drug research and development (R&D) in China, so the problem of disconnection between drug R&D and production & sales needs to be solved urgently. The STI is the key to solving the above problems and achieving high-quality development of the MBI (Fu et al., 2022). Therefore, it is of great theoretical value and practical significance to explore the dynamic mechanism of STI in China’s MBI for solving the problem of insufficient innovation capability in the development of the industry.
The MBI has become one of the key topics of concern for scholars around the world. Previous studies have mainly involved, for example, the application status of marine organisms in the field of medicine (Araújo et al., 2021; Hu et al., 2023; Gozari et al., 2021), the influencing factors and path of industrial development (Dai and Han, 2017; Fu et al., 2018a), the elements allocation of industrial development and the function mechanism (Fu et al., 2018b), and the evolution of related policies (Ji et al., 2022). The MBI is a technology-intensive industry, and STI is an important driving factor for the high-quality development of the MBI (Fu et al., 2022). In recent years, the innovation efficiency of China’s MBI has been continuously improved, but it is still at a low level in general with a regional imbalance (Fu et al., 2020). As the first link in the innovation chain, basic research is the source of independent innovation. China’s basic research activity in the MBI is on the rise, but there is still a big gap between China and advanced countries (Zhang and Meng, 2019b). In addition, there is still a “disconnect” phenomenon in the cooperation and interaction between enterprises and research institutions in the field of China’s MBI (Zhang and Long, 2019a). The breadth and depth of cooperation between various innovation subjects need to be strengthened in the industry-university-research cooperation network (Zhang et al., 2019c). In order to solve the current problems and realize the breakthrough development of the MBI in China, some scholars put forward suggestions on increasing dynamic factors and strengthening technological innovation based on the perspective of the industrial innovation ecosystem (Bai and Wu, 2020).
The research methods to explore innovation in other fields can be referenced to the MBI. The existing research methods mainly included data enveloping analysis (DEA) (Qian et al., 2022), stochastic frontier analysis (SFA) (Li et al., 2021), and regression analysis (Wang et al., 2022; Yang et al., 2022) to measure innovation efficiency and study its influencing factors. In addition, the spatial econometric method was also adopted to explore the spatio-temporal evolution characteristics of STI levels (Duan and Du, 2022). To explore the dynamic mechanism of industrial technological innovation, some scholars explored the mechanism of key factors through gray correlation analysis (Fang et al., 2021). These studies can provide scientific methods for measuring the efficiency of industrial innovation and exploring the dynamic mechanism of industrial STI in the MBI.
To sum up, in terms of research content, the relevant research mainly focused on the measurement and calculation of the innovation efficiency of the MBI, which could not clearly explain the dynamic mechanism of STI, and thus could not establish a logical framework for its innovation study. In terms of research methods, the existing research was mostly in the static perspective, which could not be used to analyze the interaction mechanism between various factors within the dynamic system of STI in the MBI from a dynamic perspective. In order to solve the problems above, this paper analyzed the dynamic mechanism of STI through simulation based on the construction of the dynamic model of the STI system of the MBI. And then the corresponding countermeasures and suggestions were put forward to provide scientific guidance for improving the innovation level of the MBI to realize the high-quality development of the industry.
2 Theoretical analysis of the dynamic mechanism of STI in China’s MBI
In the 1990s, Breschi and Malerba first proposed the concept of sectoral innovation system, which is mainly composed of enterprises involved in the development, production, and research of products and technologies in specific industries (Breschi and Malerba, 1997). Malerba (2002) further suggested that an sectoral innovation system should also include other innovation subjects, knowledge and technology, and institutional environment apart from enterprises. The STI of the MBI is the process in which relevant enterprises, universities, and research institutes transform innovation inputs into innovation outputs through technological R&D, achievement transformation and so on in innovative environments such as policies and markets, thereby constituting the STI system of the MBI. According to the theory of complex systems, a complex system comprises multiple subsystems whose interactions collectively propel the overall evolution of the complex system. Therefore, this paper divides the STI system of the MBI into three subsystems: the innovation environment subsystem, the innovation input subsystem, and the innovation output subsystem from the perspective of the innovation process based on the theoretical analysis above and existing literature (Hu et al., 2020). On this basis, a diagram of the dynamic mechanism of the STI of the MBI was constructed according to the innovation system theory, technological innovation theory, and production factor theory, as shown in Figure 1. The specific analysis is as follows:
(1) Innovation input is the direct driving factor of STI. Innovation input includes two parts: innovation funding input and innovation personnel input, which cover all links of the innovation chain of the MBI. Among them, drug discovery, development, and transformation of innovative achievements rely heavily on infrastructure such as high-tech equipment. Innovation funds provide financial guarantees and infrastructure for them, which is the most direct driving force for STI (Xue et al., 2023). From basic research on product development, the main body of each link in the innovation chain is “people”. Innovative talents learn, master, and apply new knowledge and technologies, and then transform them into innovative output. The innovation of the MBI is ultimately conducted by innovative talents (Li et al., 2014). As the most flexible factor of innovation, innovative talents are a necessary condition for conducting basic research and realizing the transformation of scientific research achievements, hence they are one of the important sources of STI. Therefore, innovation input is the basic factor of innovation and the prerequisite for innovation output (Liu et al., 2018), which provides the material basis for innovation while being the direct driving factor of innovation.
(2) A good innovation environment is a necessary condition for STI. While offering a good environment for the development of innovation in terms of policies, funds, and intellectual property protection, it also stimulates innovation subjects to make innovation investment decisions. The theory of the national innovation system points out that policy factors play an important role in the development of STI. Among them, the government’s fiscal STI policy can not only directly provide financial support for innovation subjects, but also encourage innovation subjects to increase innovation funding input with subsidies, taxes, and other measures. The government’s educational STI policy can cultivate more high-quality professionals so as to provide talent support for the development of STI (Zhang et al., 2019). According to the traditional intellectual property theory, increasing the intellectual property protection intensity can promote innovation efficiency by maintaining market order and promoting technological competition (Han et al., 2019). Intellectual property protection can reduce R&D risks by enabling enterprises to privatize innovative achievements within a certain period and can also help the realization of technology transactions by improving product competitiveness and reducing transaction costs (Yang et al., 2023). Therefore, the protection of intellectual property rights is an important external factor affecting the STI level of the MBI. Environmental regulation plays an important role in marine innovation (Zhang and Wang, 2021). In the process of its development, the marine industry may cause marine environmental pollution characterized by negative externality, which needs to be solved by the government formulating relevant policies to increase the marine environmental regulation intensity. Marine environmental regulatory policies will affect the cost and benefits of STI for enterprises. Consequently, enterprises need to reallocate technological innovation resources. Thus, the marine environmental regulatory policy stimulates enterprises to increase innovation input with the anti-driving mechanism, thereby improving the STI level of enterprises and industrial competitiveness (Ren and Wang, 2023).
(3) The improvement of innovation output level has a positive feedback effect on both innovation input and innovation environment. The increase in industrial innovation output will bring about the growth of innovation and economic benefits. Both the increase in enterprise innovation profits and the growth of government innovation investment income will in return stimulate enterprises and the government to increase innovation input so that universities and marine research institutes can also obtain more innovation funding support. Thus, the entire innovation system forms a spiral upward virtuous circle.
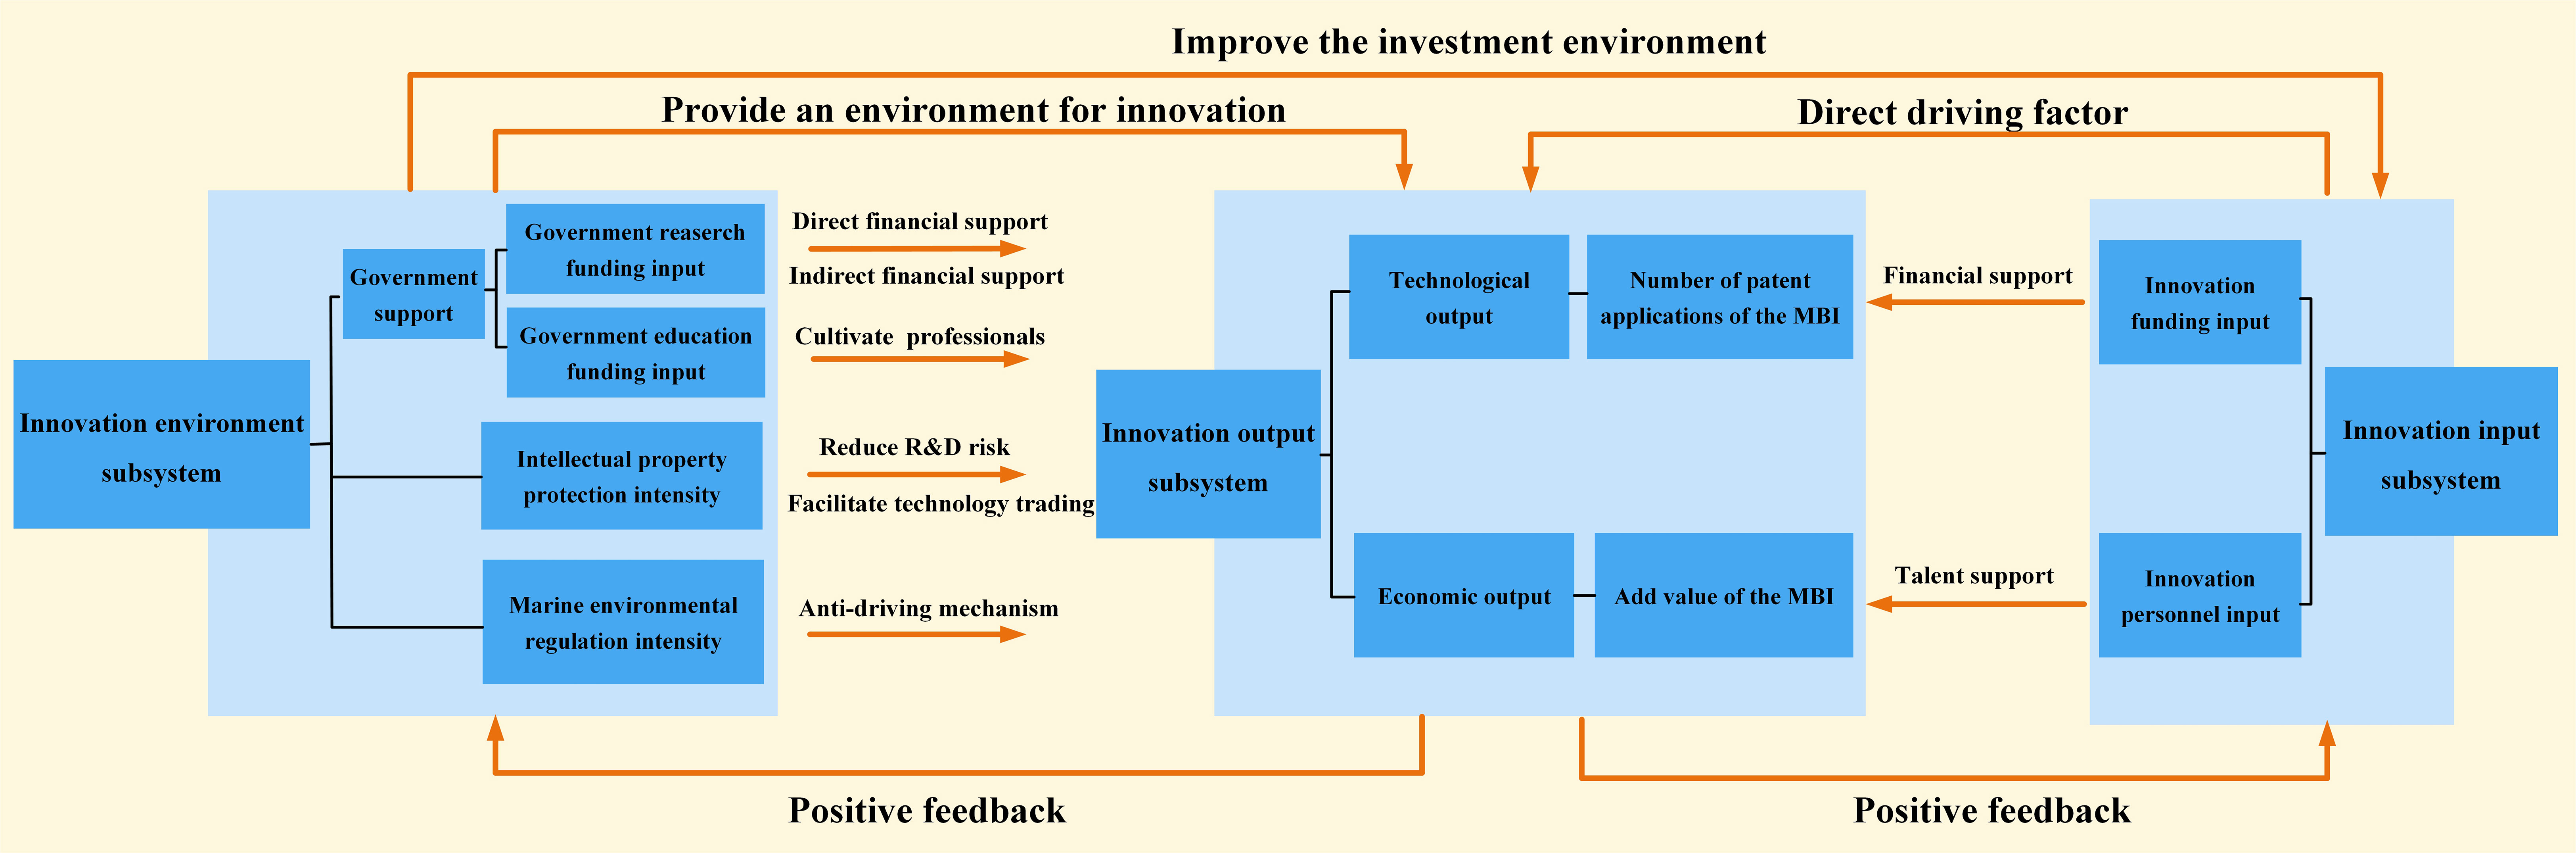
Figure 1 Diagram of the dynamic mechanism of the STI system of the MBI. MBI, marine biomedical industry; STI, scientific and technological innovation; R&D research and development.
3 System dynamics model construction
3.1 Research methods
System dynamics provides a method to study the dynamic behavior of the system with mathematical models and computer simulation techniques, based on the feedback mechanism of various factors within the system (Wang, 2009). System dynamics believes that system behavior is determined by the internal structure of the system and the interaction mechanism among various parts. On the basis of fully exploring and analyzing the causal relationship among various factors, this method constructs a system dynamics model and conducts simulation analysis according to the principles of data availability and operability as well as the dynamic changes of each element. The simulation results can reveal the content and characteristics of the system dynamic mechanism.
The STI of the MBI is a dynamic and complex system, which is affected by many factors such as the innovation environment and the innovation input. The method of system dynamics can effectively overcome many problems, such as some data missing, and some indicators being difficult to quantify in the research process. System dynamics has been well applied to study the dynamic mechanism of industrial innovation (Xiong and Zang, 2015) and the factors affecting the level of industrial or national STI (Samara et al., 2012) and other aspects. Based on this, this paper uses the system dynamics method to explore the dynamic mechanism of the STI in China’s MBI.
3.2 System boundary determination
In the system dynamics model, the behavior of the system is determined by the internal factors of the system and the interaction among various factors while the external factors cannot play a decisive role. Therefore, the boundary of the system should first be determined when using this method. According to the theoretical analysis above, this paper divided the STI system of the MBI into three subsystems: innovation environment, innovation input, and innovation output. According to the sectoral innovation system theory, industrial innovation is mainly related to the innovation subject, knowledge and technology, and institutional environment (Malerba, 2002). Moreover, as a knowledge and technology-intensive industry with a high level of STI, the innovation level of the MBI is mainly influenced by factors such as talent, funds, and technology (Di Paola and Spena, 2019; Fu et al., 2020; Lai and Shi, 2021). Therefore, in the innovation environment subsystem, this paper selected factors such as government research funding input, government education funding input, intellectual property protection intensity, and marine environmental regulation intensity; the innovation input subsystem included two parts: innovation funding input and innovation personnel input from various subjects of industry, university, and research institution; the innovation output subsystem included technological output and economic output. The technological output is usually characterized by the number of patent grants or patent applications in the existing literature. Since the patent authorization process is complex and easily affected by human factors (Wang and Tan, 2014), this paper used the number of patent applications of the MBI as a characterization factor of the innovation level by referencing existing literature. At the same time, this paper selected the added value of the MBI to represent the economic output. The system boundary was finally determined, and its internal influencing factors are shown in Table 1.
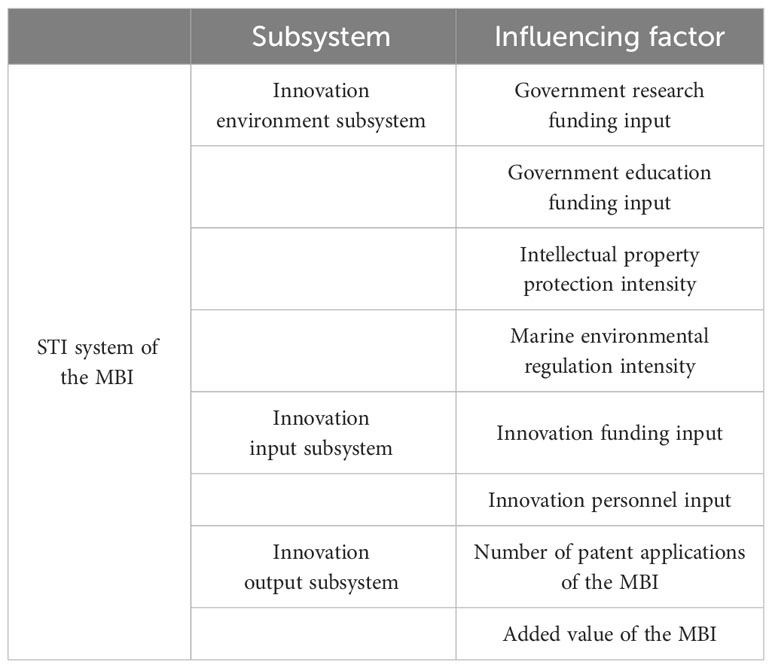
Table 1 Determination of system boundaries.
3.3 Basic hypotheses
The STI of the MBI has the characteristics of long-term and continuity. In order to highlight the research objects and modeling purposes, the basic hypotheses made in this paper are as follows:
H1: The STI of the MBI is a continuous and gradual process.
H2: The influence of force majeure factors such as natural disasters and war is not considered in the operation of the system.
3.4 Causal loop diagram establishment and causality analysis
The STI of the MBI is the result of the mutual influence and interaction of various factors in multiple paths. On the basis of analyzing the causal feedback relationships among various factors within the system, factors including gross domestic product (GDP) were added to maintain the integrity and rationality of the system. The causal loop diagram of the system dynamics of STI of the MBI was constructed as shown in Figure 2.
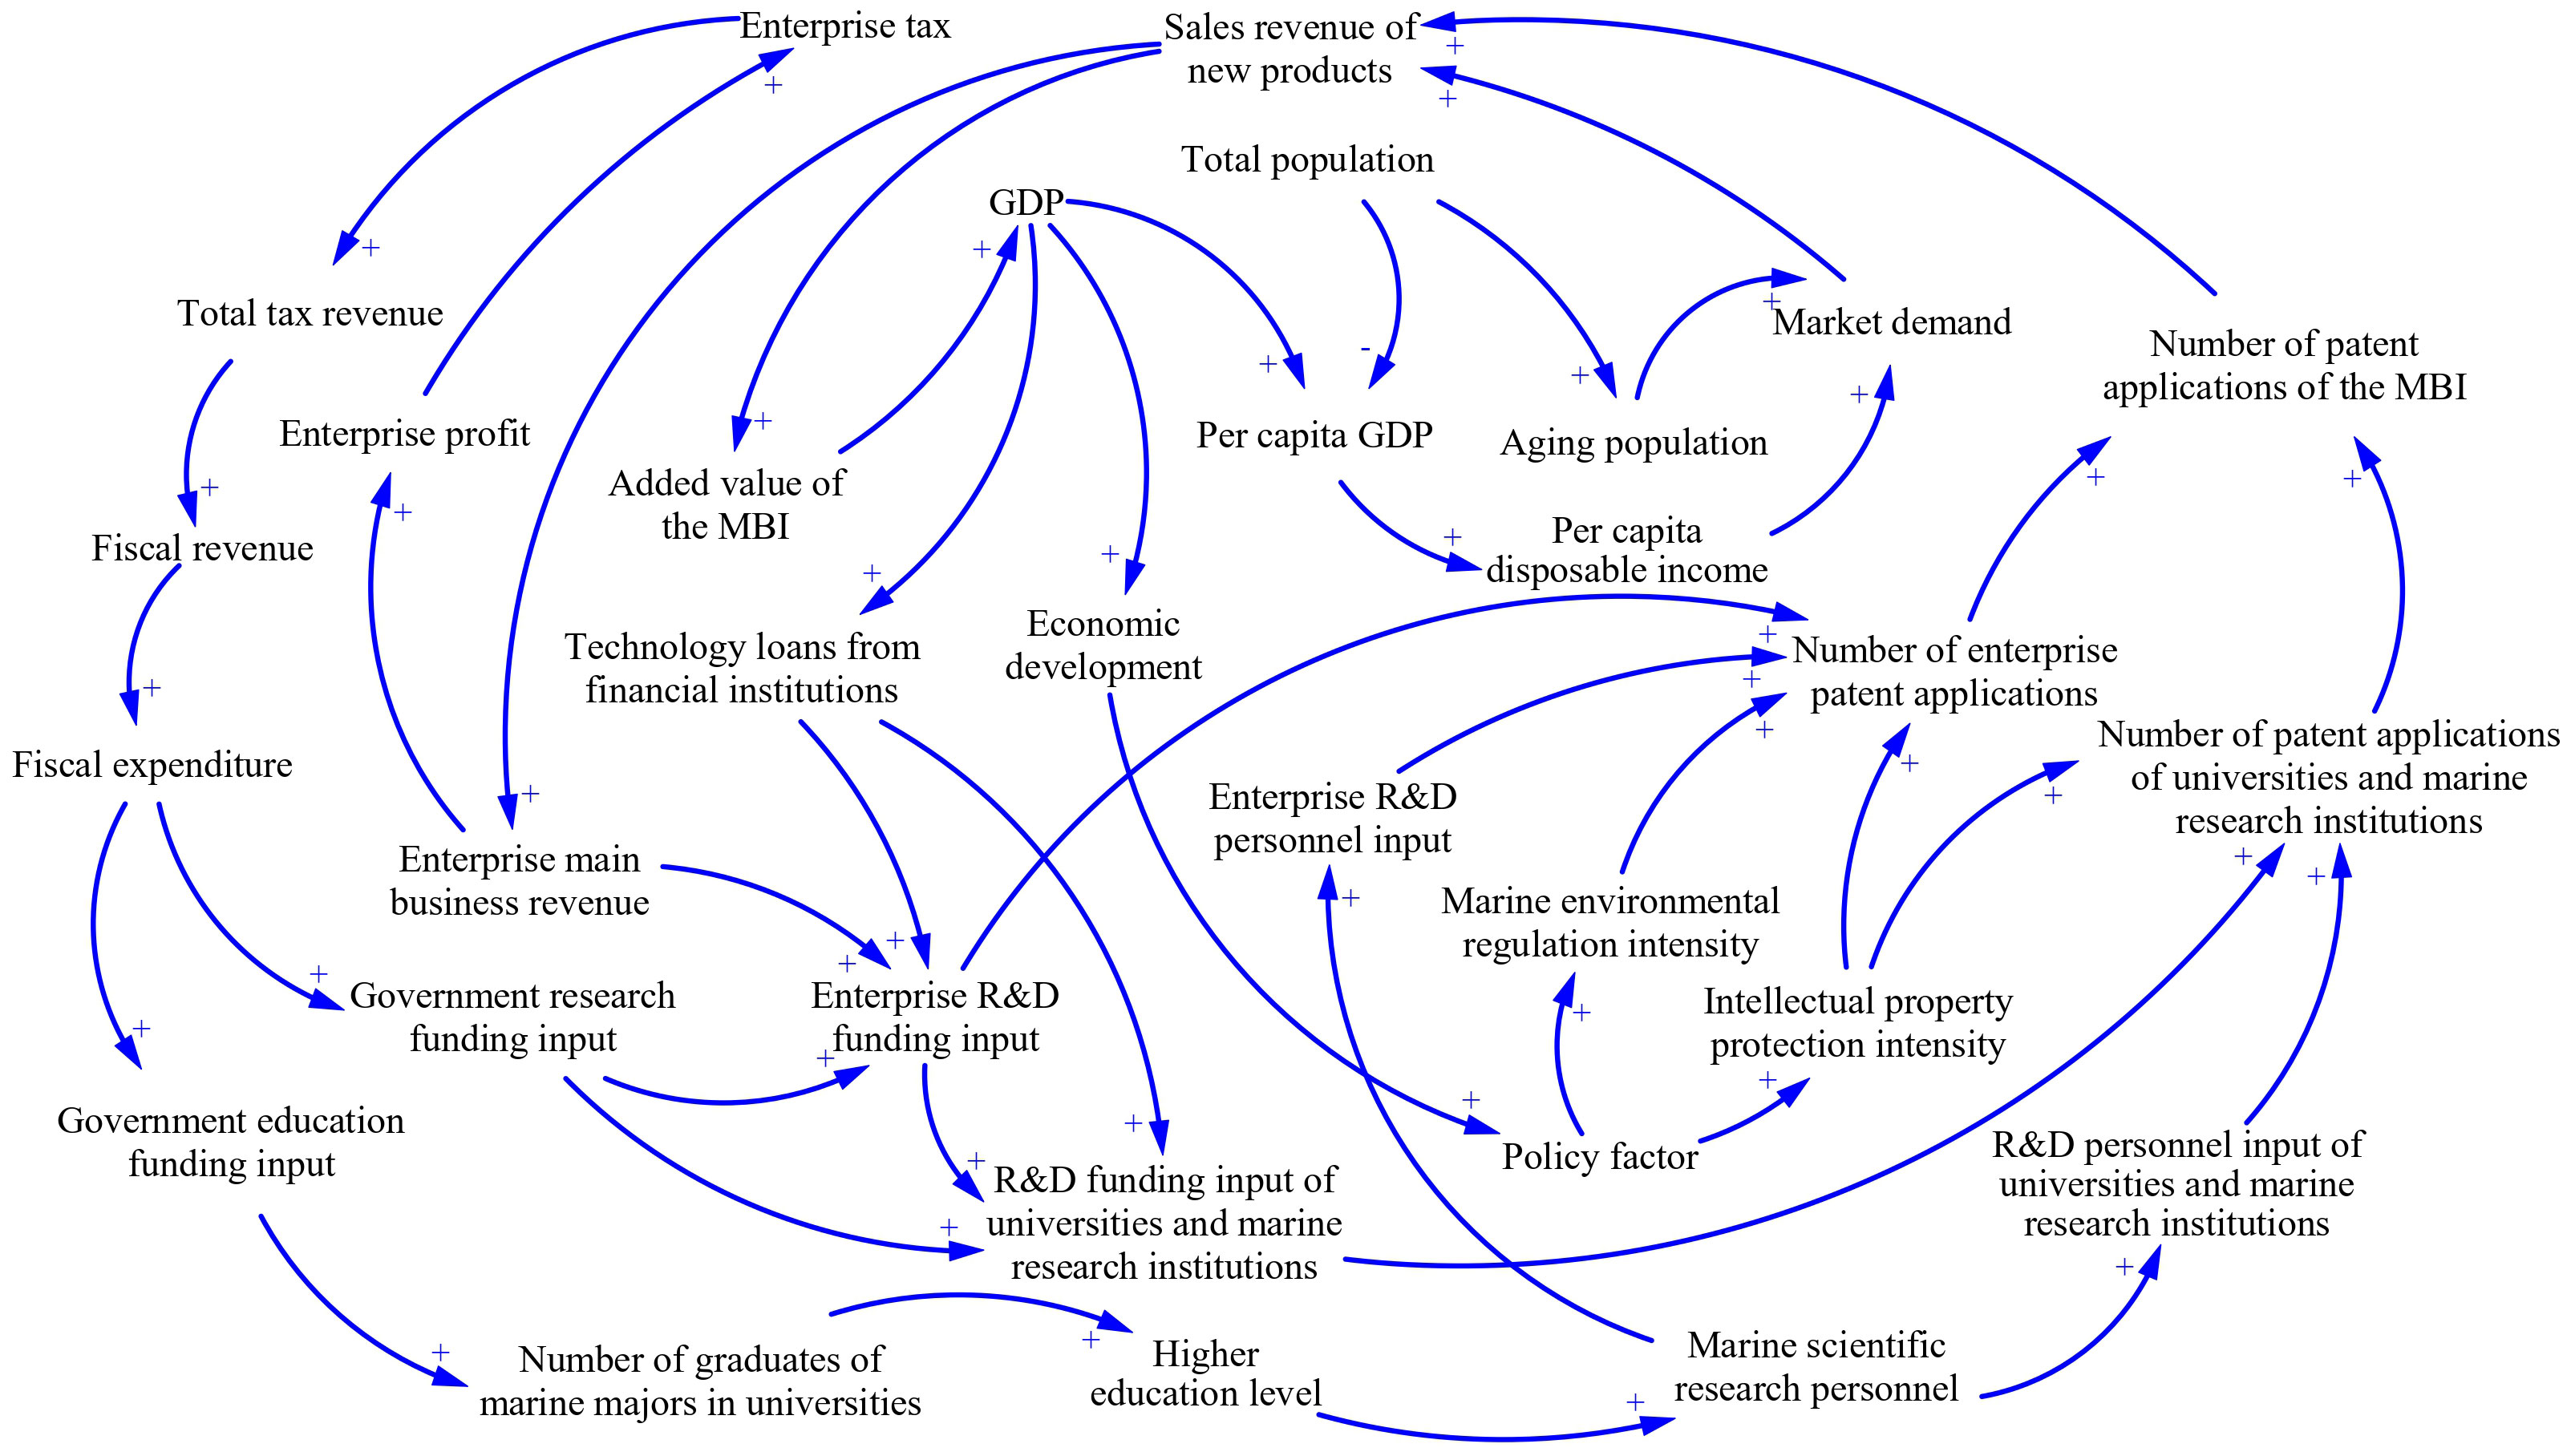
Figure 2 Causal loop diagram of the STI system of the MBI. GDP, gross domestic product.
There were many causal relationship loops in the causal loop diagram shown in Figure 2, and eight typical loops were selected for analysis here.
Among them, the following four loops were selected based on the administrative driving force of the government in the STI of the MBI in the innovation environment subsystem.
Loop 1: Fiscal expenditure → Government research funding input → Enterprise R&D funding input → Number of enterprise patent applications → Number of patent applications of the MBI → Sales revenue of new products → Enterprise main business revenue → Enterprise profit → Enterprise tax → Total tax revenue → Fiscal revenue → Fiscal expenditure.
Loop 2: Fiscal expenditure → Government research funding input → R&D funding input of universities and marine scientific research institutions → Number of patent applications of universities and marine scientific research institutions → Number of patent applications of the MBI → Sales revenue of new products → Enterprise main business revenue → Enterprise profit → Enterprise tax → Total Tax revenue → Fiscal revenue → Fiscal Expenditure.
Loop 3: Policy factor → Intellectual property protection intensity → Number of enterprise patent applications → Number of patent applications of the MBI → Sales revenue of new products → Added value of the MBI → GDP → Economic development → Policy factor.
Loop 4: Policy factor → Intellectual property protection intensity → Number of patent applications of universities and marine scientific research institutions → Number of patent applications of the MBI → Sales revenue of new products → Added value of the MBI → GDP → Economic development → Policy factor.
The four loops above are all positive feedback loops. Loop 1 and Loop 2 show that the government can provide financial support to relevant enterprises, universities, and marine scientific research institutions with a supply-driven innovation policy, which can stimulate the innovation vitality of each subject while reducing the risk of STI. Loop 3 and Loop 4 show that the government can improve the intellectual property protection intensity in society and standardize the market, in order to provide a good innovation environment based on the environment-impacting innovation policy. In this way, the government can improve innovation capability by improving relevant laws and regulations.
Then, the following four loops were selected based on the direct driving role of various innovation subjects in the innovation input subsystem.
Loop 5: Enterprise R&D funding input → Number of enterprise patent applications → Number of patent applications of the MBI → Sales revenue of new products → Enterprise main business revenue → Enterprise R&D funding input.
Loop 6: R&D funding input of universities and marine scientific research institutions → Number of patent applications of universities and marine scientific research institutions → Number of patent applications of the MBI → Sales revenue of new products → Enterprise main business revenue → Enterprise profits → Enterprise tax → Total tax revenue → Fiscal revenue → Fiscal expenditure → Government research funding input → R&D funding input of universities and marine scientific research institutions.
Loop 7: Enterprise R&D personnel input → Number of enterprise patent applications → Number of patent applications of the MBI → Sales revenue of new products → Enterprise main business revenue → Enterprise profit → Enterprise tax → Total tax revenue → Fiscal revenue → Fiscal expenditure → Government education funding input → Number of graduates of marine majors in universities → Higher education level → Marine scientific research personnel → Enterprise R&D personnel input.
Loop 8: R&D personnel input of universities and marine scientific research institutions → Number of patent applications of universities and marine scientific research institutions → Number of patent applications of the MBI → Sales revenue of new products → Enterprise main business revenue → Enterprise profits → Enterprise tax → Total tax revenue → Fiscal revenue → Fiscal expenditure → Government research funding input → Number of graduates of marine majors in universities → Higher education level → Marine scientific research personnel → R&D personnel input of universities and marine scientific research institutions.
Loop 5-8 above are also positive feedback loops. Loop 5 and Loop 6 show that in the innovation input subsystem, the enhancement in the innovation funds of each innovation subject will increase the number of patent applications, which leads to the growth of the enterprise’s main business revenue accordingly as well as better returns of government’s innovation input. This will in return encourage enterprises and the government to increase input in innovation, forming a virtuous circle. Loops 7 and 8 show that increasing the input of innovation personnel in the MBI can provide more talent support for its innovation, forming the more powerful direct driving force of industrial innovation. The improvement of the innovation level will promote the development of the industry and lead to a growth in fiscal revenue. In return, the government will increase expenditures on financial education to train more high-quality talents in related fields, bringing stronger talent utility and finally improving innovation capability.
3.5 Establishment of the stock flow diagram and main equations
3.5.1 Establishment of stock flow diagram
The STI system dynamics flow diagram of the MBI was drawn by simplifying and supplying Figure 2 on the basis of the quantifiability of indicators and the availability of data. Then, according to the nature of the variables in the system, they were divided into state variables, rate variables, auxiliary variables, and constants, and finally got the system dynamics flow diagram of the STI activities of the MBI as shown in Figure 3, which provided the basis for the following simulation.
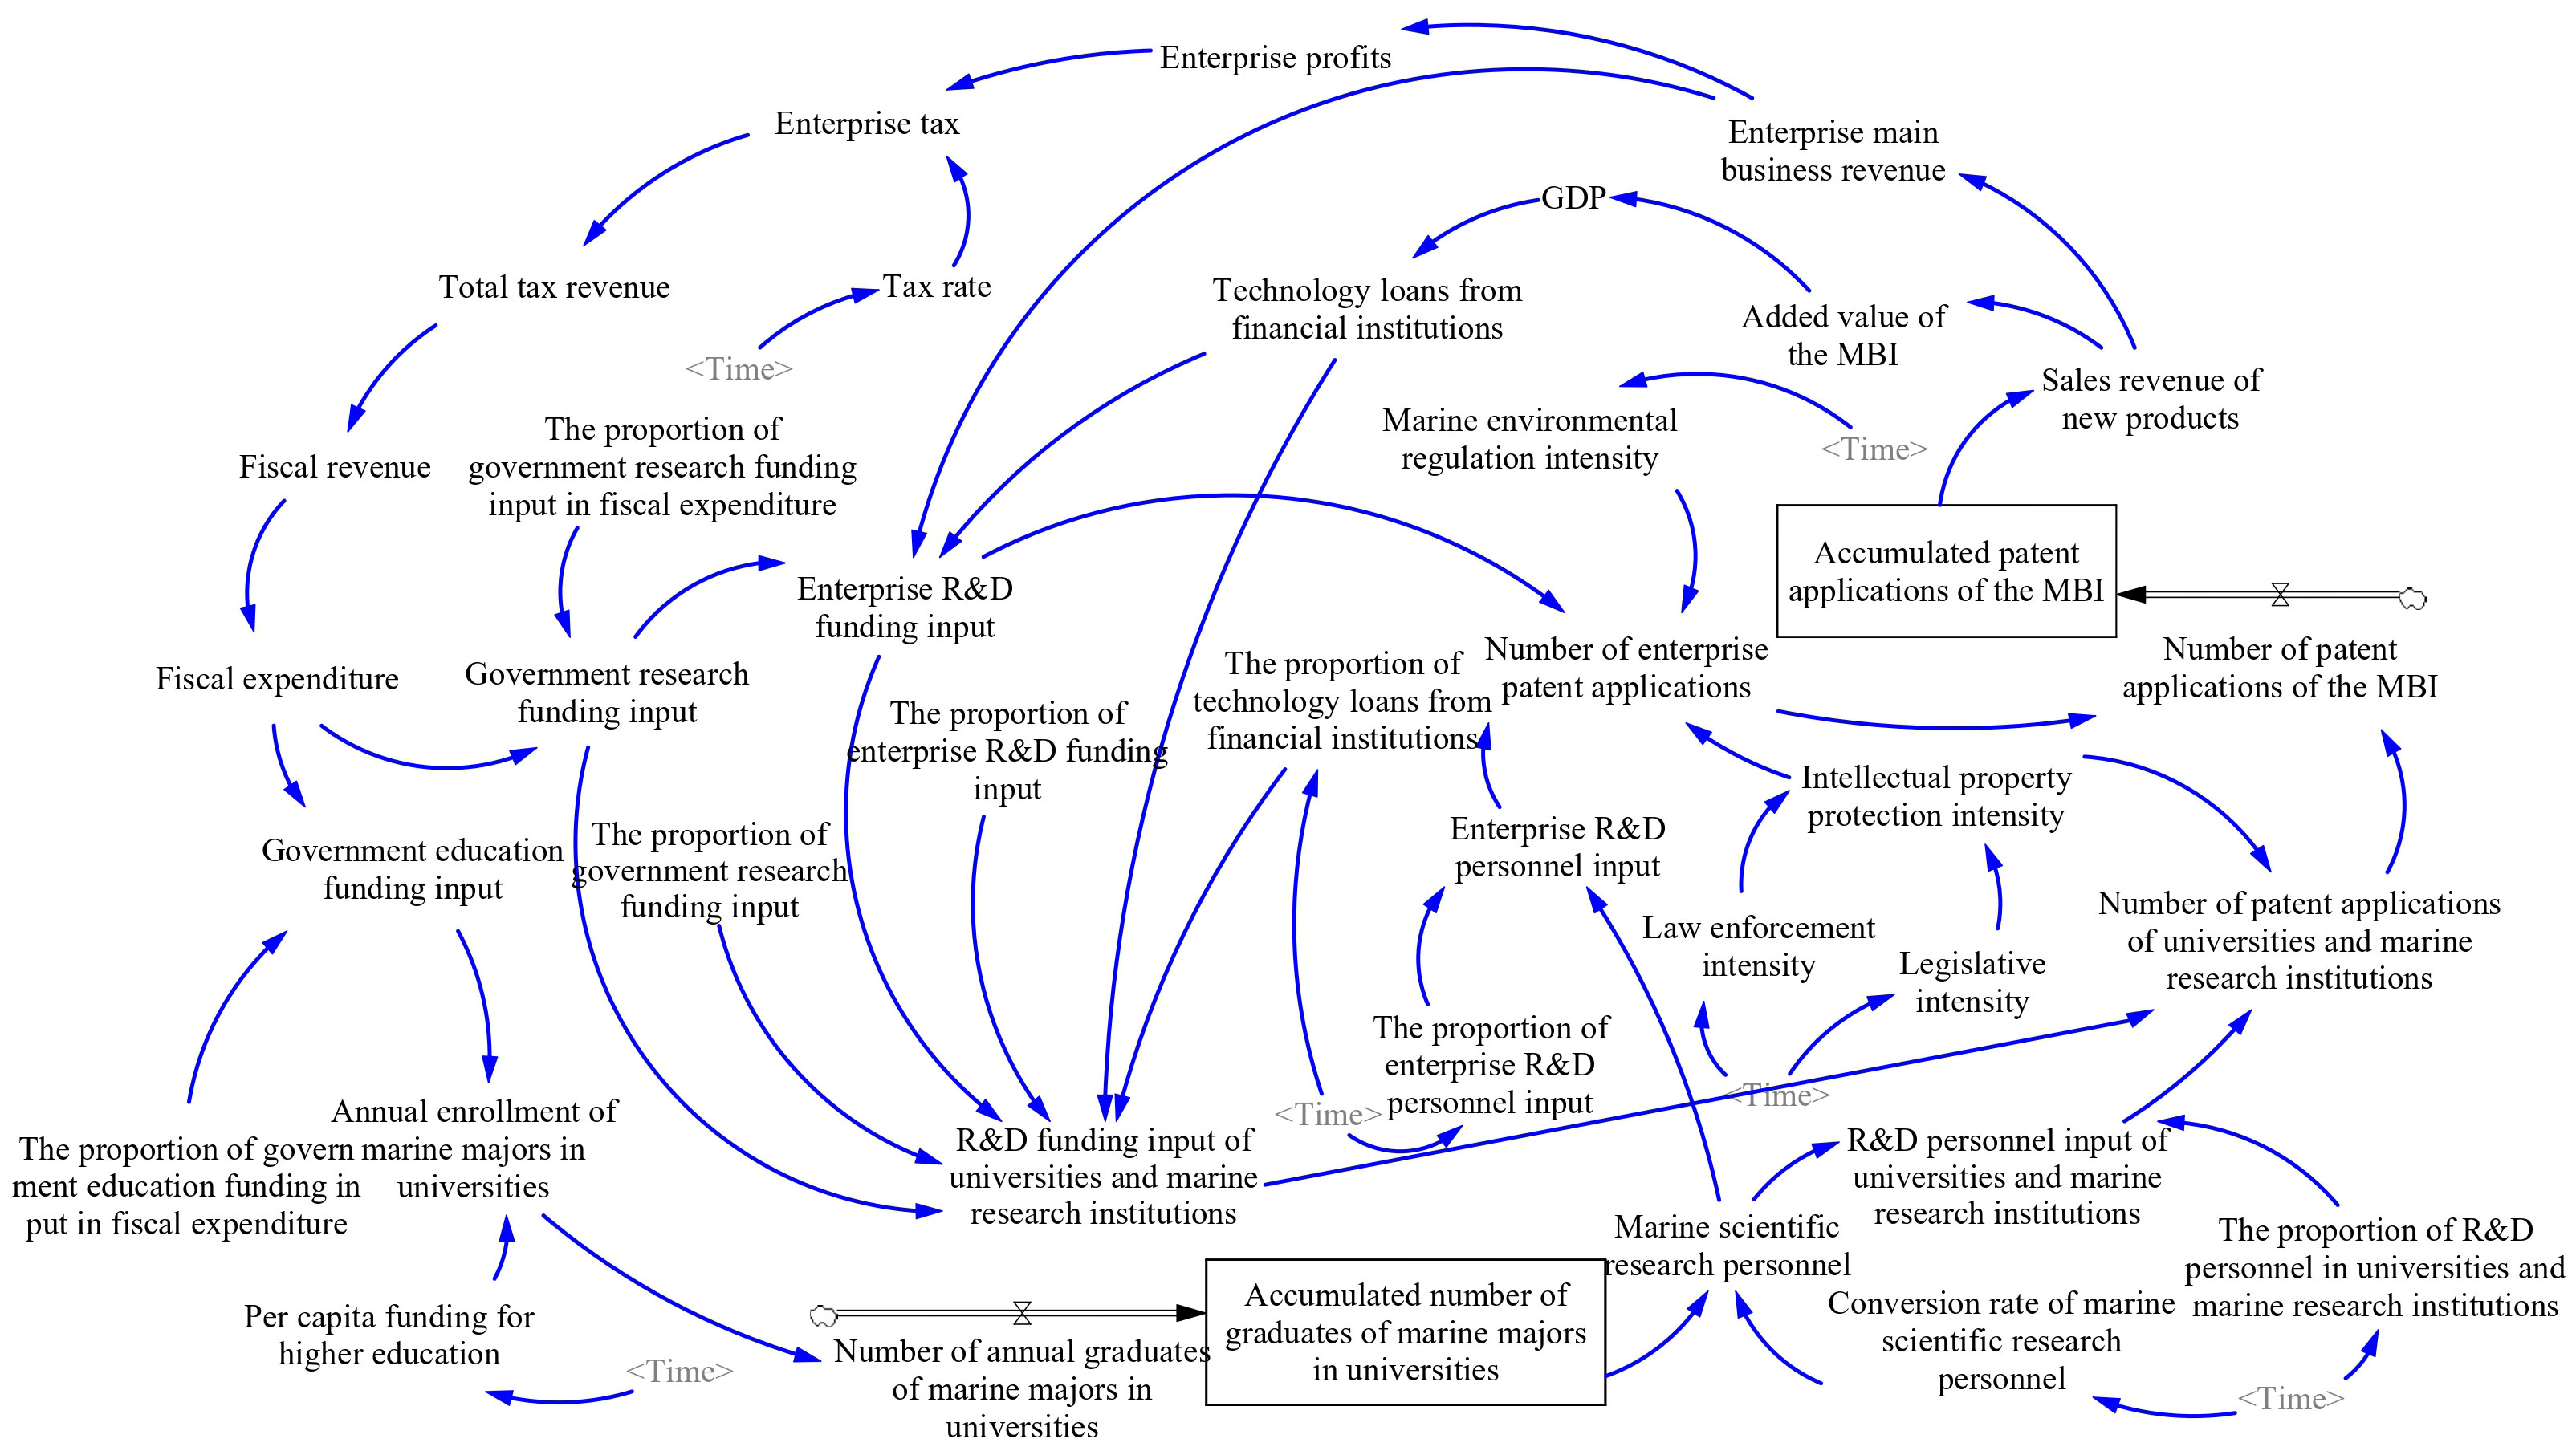
Figure 3 The STI system dynamics flow diagram of the MBI.
3.5.2 Variable description and function relationship
This paper took the STI level of the MBI as the main research object. Based on consistency and availability of variables, the starting time of the model was determined as 2010 and the ending time was 2019, which made the study period of 10 years in the model where DT=1 year. The data mainly came from the China Statistical Yearbook, the China Marine Economic Statistical Yearbook, and the China Statistical Yearbook on High Technology Industry and related statistical bulletins. For the missing data, the interpolation method was used to complete the data. The patent data of the MBI in the model was sourced from the China Patent Database (CNPAT). The retrieval keywords, including professional terms such as Cytarabine, Vidarabine, and Poly Saccharide Sulfate, were selected on the basis of literature (Jiao, 2006) and the definition of marine drugs. The retrieved patent data was preprocessed to improve data reliability. Part of the data statistically counted and processed came from investigations, expert consultations, and questionnaire surveys. First-hand information and data were obtained by visiting and consulting typical MBI enterprises, universities, and research institutes in 11 coastal provinces and cities of China, as well as relevant government departments such as the National Marine Data and Information Service and the Ministry of Natural Resources. Then, adopting Eviews7.0 and SPSS25.0 software, the functional relationship between the variables of the system flow diagram was obtained with linear regression, curve fitting, table functions, and other methods. Referring to the research method of Gai et al. (2022), the marine environmental regulation intensity was calculated with “completed investment in the treatment of industrial pollution*gross ocean product/gross domestic product”. Referring to the existing literature, the intellectual property protection intensity was expressed as the product of law enforcement intensity and legislative intensity (Xu and Shan, 2008). The legislative intensity was indicated with the Ginarte-Park index, and the law enforcement intensity was comprehensively measured with the five indicators of judicial protection level, administrative protection level, economic development level, social public awareness, and international supervision. Referring to the research method of Zhang and Gu (2018), technology loans from financial institutions were represented by medium and long-term loan balances of financial institutions. The main variable types and functions of the system model constructed in this paper are shown in Table 2.
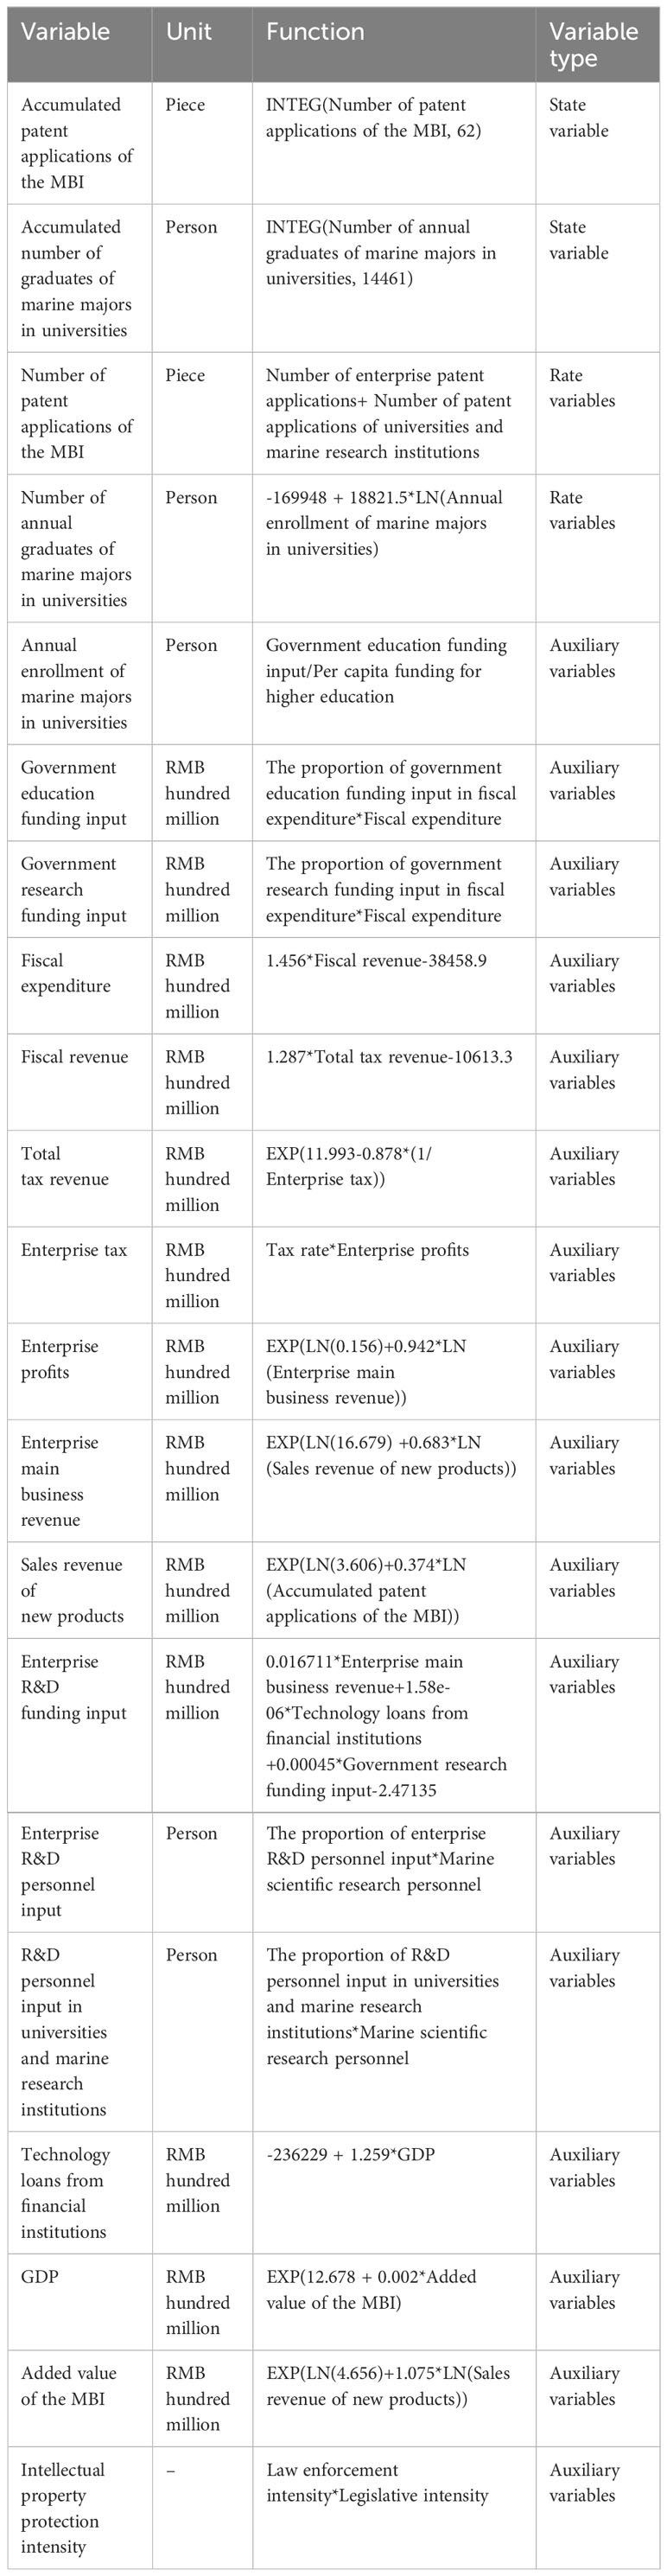
Table 2 Main variable types and functions.
4 Simulation and analysis
4.1 Model test
4.1.1 Structural test and dimensional consistency test
Before the dynamics model of the STI system of the MBI is run, it is necessary to conduct a model structure test whether the settings of various factors are reasonable and logical in the model. In this paper, the model was tested with the Check Model function in Vensim PLE, and the result was displayed as “Model is ok”, indicating that the model passed the structural test.
Next, the model was tested for dimensional consistency. Among the variables included in the system dynamics model in this paper, the units of the factors involving capital were all in RMB hundred million, and they were all deflated with 2010 as the base year to eliminate the impact of inflation; the units of the factors involving personnel were all per person; the units of factors related to patents were pieces.
4.1.2 Fitting degree test
In order to determine whether the model can better reflect the STI of the MBI, it is necessary to test the fitting degree of the model with the fitting degree calculation Equation 1. The closer the degree of fit R2 is to 1, the better the model fit and the higher the reliability of the obtained results.
In Equation 1, is the actual value, is the simulated value, is the average value, and n is the number of simulated years.
The fitting degree test was conducted on four factors selected from three subsystem above, respectively, including the number of patent applications of the MBI, the added value of the MBI, the R&D funding input of universities and marine research institutes, and the government education funding input. The actual values and simulated values of each variable are shown in Figure 4. From Figure 4, it could be seen that the simulated value of the four variables had a relatively similar change trend with the actual value. After calculation, the fitting degree of the number of patent applications, the added value of the MBI, the R&D funding input of universities and marine research institutes, and the government education funding input were 0.88, 0.89, 0.96, and 0.94, respectively, which indicated that the fitting degrees were significant, and the model passed the fitting test.
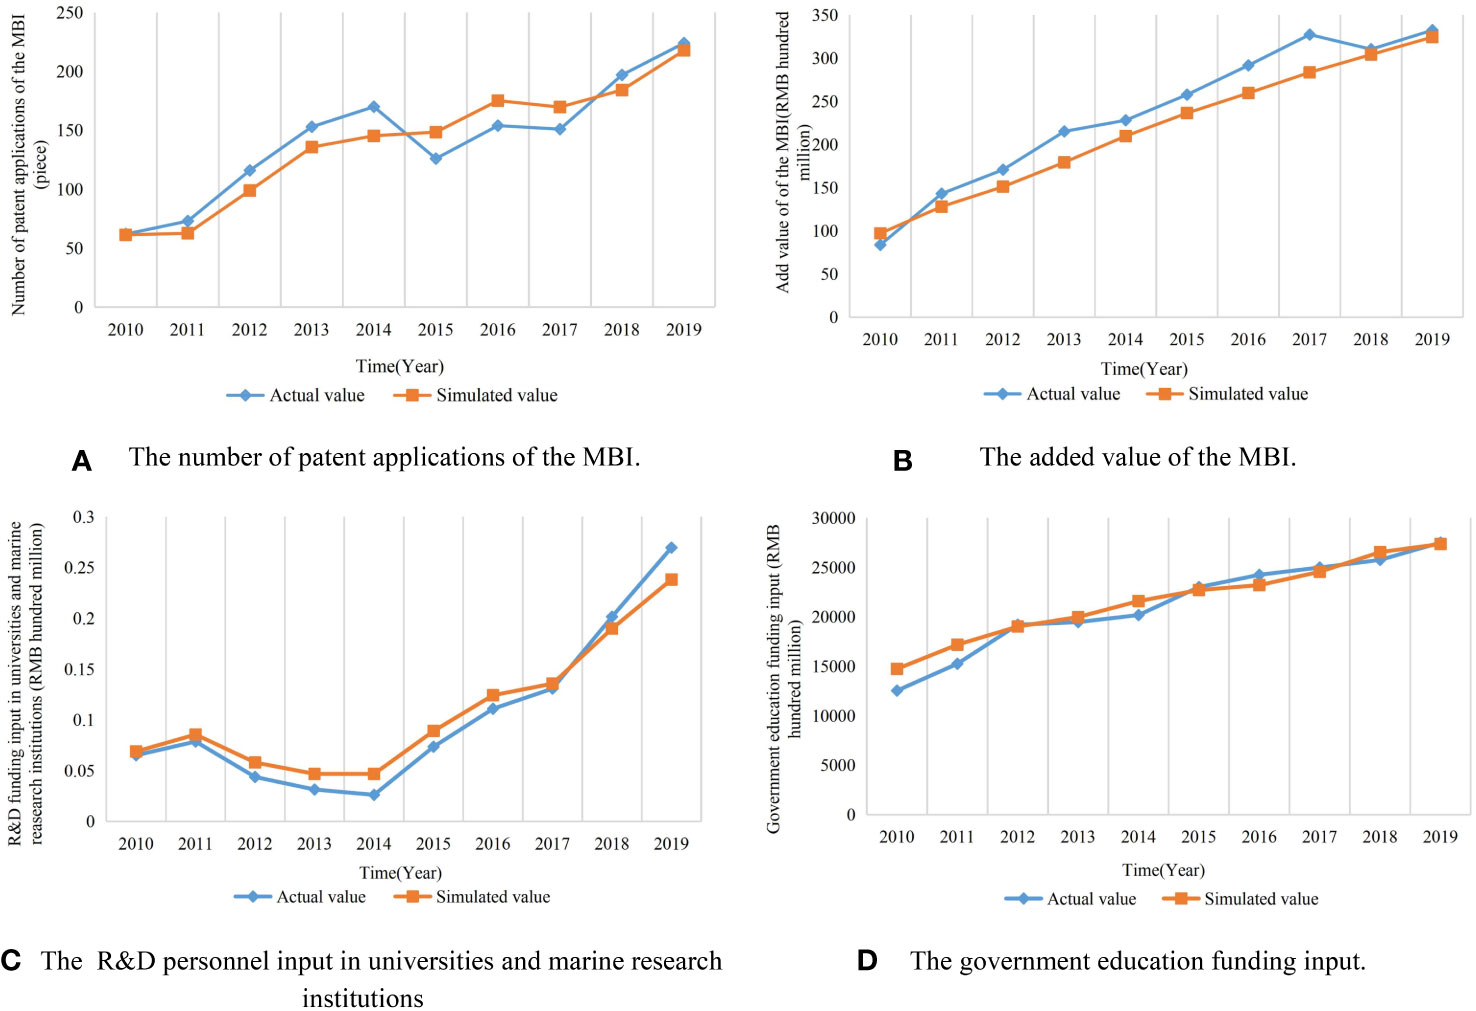
Figure 4 Comparison results between actual and simulated values of main indicators. (A) The number of patent applications of the MBI. (B) The added value of the MBI. (C) The R&D personnel input in universities and marine research institutions. (D) The government education funding input.
4.2 Simulation results and analysis
The research goal of this paper was to analyze the dynamic mechanism of STI in China’s MBI and to clarify the logical starting point of it, from which to draw the policy suggestions for improving the innovation level of the MBI. So, the corresponding simulation results were generated by way of adjusting the input quantities of different factors in the model with Vensim PLE software. According to the results, a comparative analysis was conducted on the impact of the innovation environment (government support, intellectual property protection intensity, and marine environment regulation intensity) and innovation input (innovation funding and innovation personnel) on the STI of the MBI. The simulation and analysis were conducted as follows.
4.2.1 The impact of changes in government support
This paper selected two indicators of government research funding input and government education funding input to represent the strength of government support. On the original basis of input, the two factors were increased by 5%, 10%, 15%, and 20% respectively, in Tables 3, 4. The simulation results are shown in Figures 5, 6.
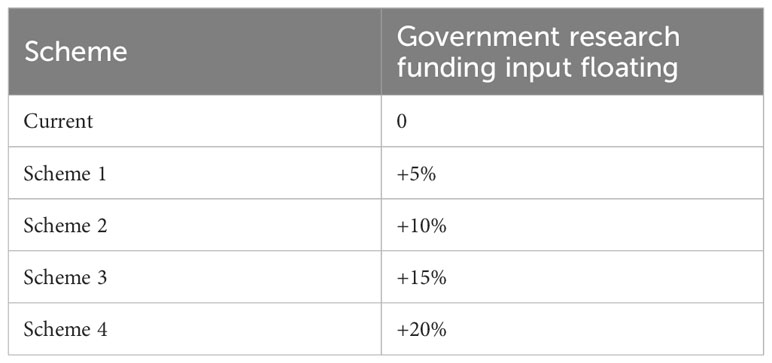
Table 3 Regulation factor scheme of government research funding input.
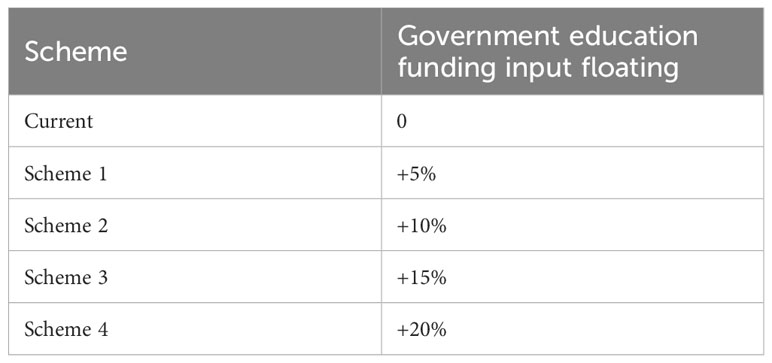
Table 4 Regulation factor scheme of government education funding input.
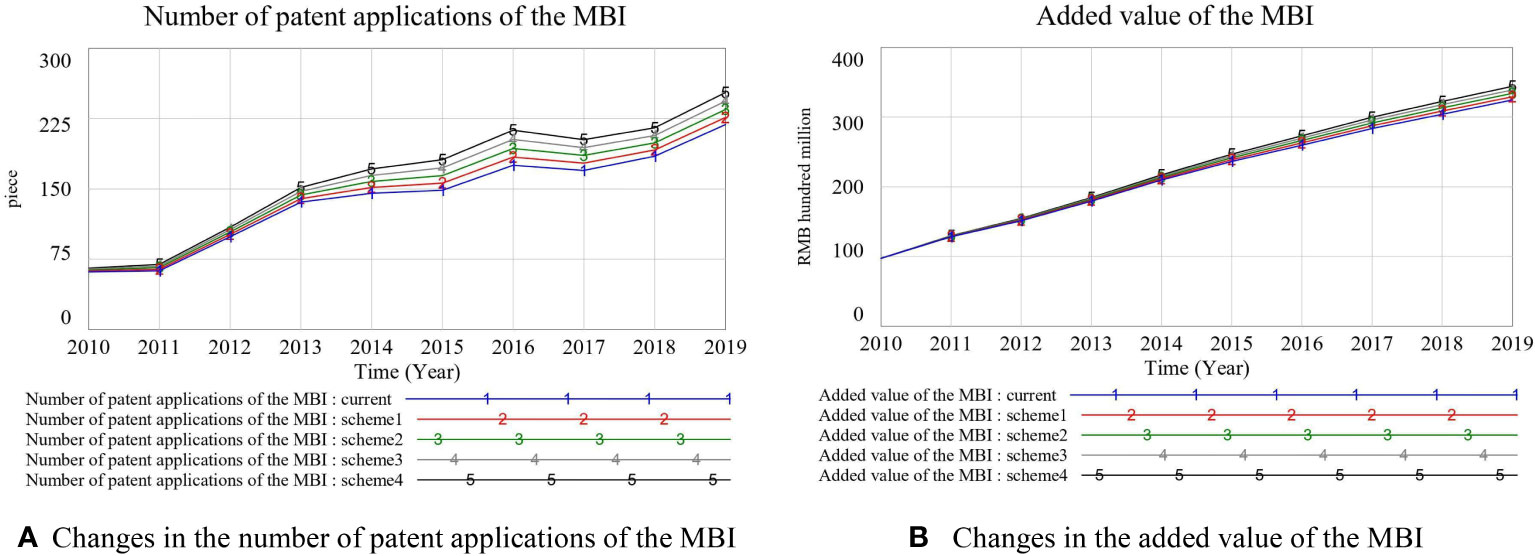
Figure 5 The impact of government research funding input on the STI level of the MBI. (A) Changes in the number of patent applications of the MBI. (B) Changes in the added value of the MBI.
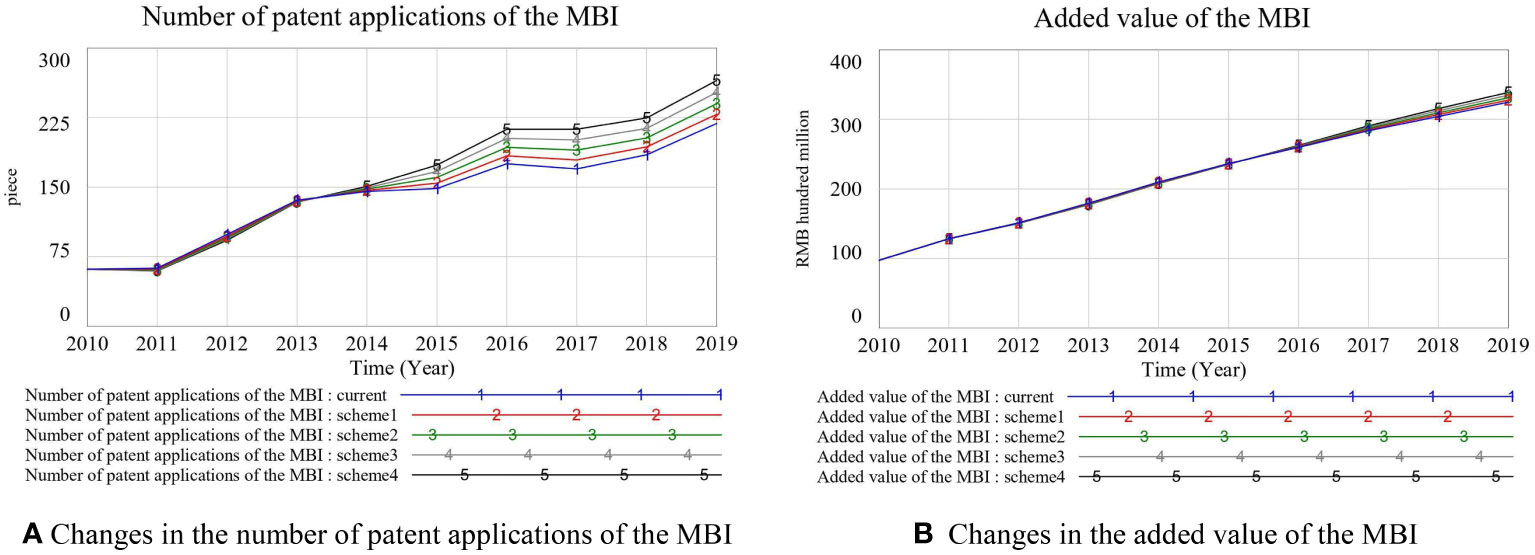
Figure 6 The impact of government education funding input on the STI level of the MBI. (A) Changes in the number of patent applications of the MBI. (B) Changes in the added value of the MBI.
Government support has a significant positive impact on the improvement of the STI of the MBI, mainly reflected in the following two aspects:
(1) The government research funding input can significantly improve the level of STI in the MBI. It could be seen from Figure 5 that the increase in government research funding input led to a significant increase in the number of patent applications of the MBI and could also promote the increase in the added value of the MBI. As time went by, the degree of coincidence of the curves gradually decreased, indicating that the level of the STI in the MBI was more sensitive to the changes in the government research funding input. With the promulgation of policy documents such as the “Decision of the State Council on Accelerating the Cultivation and Development of Strategic Emerging Industries” and the “12th Five-Year Plan” and “13th Five-Year Plan” for the development of strategic emerging industries, the government adjusted the structure of fiscal expenditures, gradually increasing the scale of government research funds in the field of STI in the MBI. Fiscal scientific research expenditure is one of the direct sources of scientific research funds for enterprises, universities, and research institutes. It can also stimulate innovation subjects and provide a strong backing for STI while reducing innovation risks.
(2) The increase in government education funding input can promote the improvement of the innovation level of the MBI, and this promotion effect is strengthened over time. According to the results shown in Figure 6, the number of patent applications and added value of the MBI increased with the increase in government education funding input before 2014, but the range of change was small, and the five curves almost overlapped. This showed that as time goes by, the cumulative effect of government education funding input has gradually increased on talent training. The increase in government education funding input can cultivate more high-quality talents in related majors and provide talent support for STI though it has a long time-lag effect. As an emerging interdisciplinary discipline, the MBI requires professionals with multi-field expertise and strong innovation and creativity capabilities. Therefore, the cultivation of its professionals requires a long period of time, and it takes some time for the utility of scientific and technological talents to play out.
4.2.2 The impact of changes in the intellectual property protection intensity
The intellectual property protection intensity was increased by 5%, 10%, 15%, and 20% in the model, respectively, in Table 5. Then the simulation results obtained are shown in Figure 7.
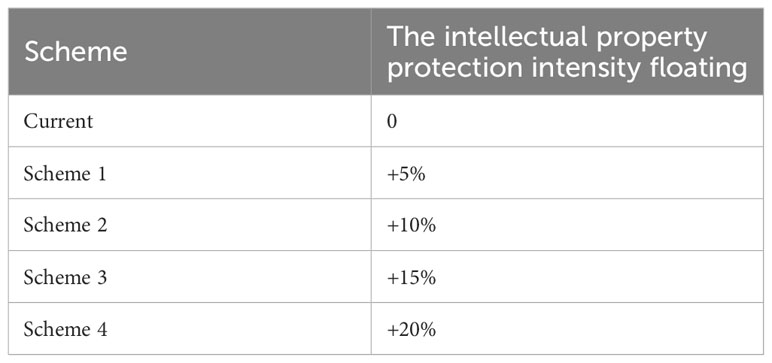
Table 5 Regulation factor scheme of the intellectual property protection intensity.
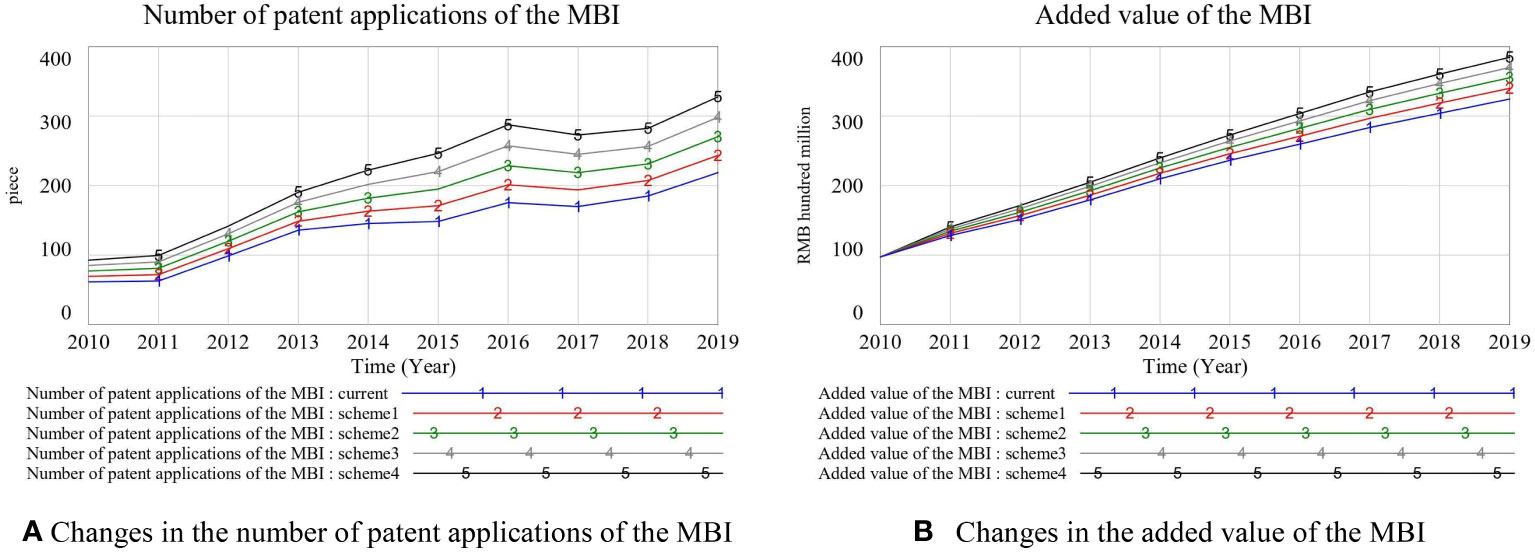
Figure 7 The impact of the intellectual property protection intensity on the STI level of the MBI. (A) Changes in the number of patent applications of the MBI. (B) Changes in the added value of the MBI.
The improvement of the intellectual property protection intensity has played a significant positive role in promoting the level of STI in the MBI. Figure 7 reported that the intellectual property protection intensity had a significant role in promoting the level of STI in the MBI, and with the improvement of the intellectual property protection intensity, the impact on the level of STI showed an increasing trend. In addition, it could be seen from Figure 7 that there was almost no overlap between the curves, and the number of patent applications and industrial added value were relatively sensitive to changes in the intellectual property protection intensity. Since 2011, the national and local governments have issued many plans for the marine economy, and the formulation has also been highly valued in the intellectual property rights policies. The improvement of the intellectual property protection intensity has laid a solid foundation for the development of STI in the MBI. The MBI is a knowledge-intensive industry, and its industrial development and innovation level are closely related to intellectual property rights. The improvement of intellectual property protection can not only reduce the R&D risk of each subject through privatization of innovation achievements but also improve the competitive advantage of innovative products, and create a relatively fair market competition environment, which promotes technology transactions so as to realize the industrialization of knowledge achievements.
4.2.3 The impact of changes in the marine environmental regulation intensity
To explore the impact of changes in the intensity of marine environmental regulations, four simulation schemes were set up, as shown in Table 6.
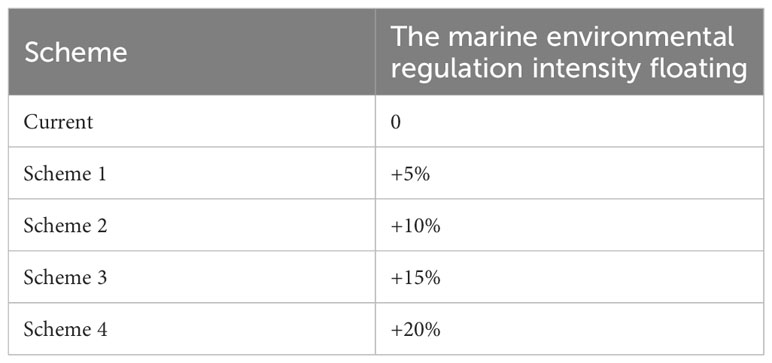
Table 6 Regulation factor scheme of the marine environmental regulation intensity.
The improvement of the marine environmental regulation intensity slightly promoted the increase in the level of innovation in the MBI. As shown in Figure 8, as the marine environmental regulation intensity changed proportionally, the number of patent applications and added value of the MBI showed an increasing trend, but the range of change was quite small. The curve coincidence was in a high degree, which indicated a quite low sensitivity of STI to the changes in the marine environmental regulation intensity. From the perspective of time series, the five curves almost overlapped before 2013, and fluctuated after 2013, indicating that the marine environmental regulation intensity had no obvious impact on the level of STI in the short term. Over time, the promoting effect of the marine environmental regulation intensity became increasingly significant in the improvement of innovation level. In the short term, the implementation of environmental regulatory policies can lead to an increase in enterprise environmental costs, which is a “cost effect”. For the implementation of environmental regulation by the government, enterprises should improve technology to reduce pollution emissions to a level that meets environmental standards. However, in this process, enterprises may encounter some resistance in improving production processes, introducing new equipment, and personnel training, which leads to increased costs. Therefore, due to the environmental costs and the obstruction of technological innovation links, environmental regulation has little effect on promoting STI in the initial stage of the implementation of environmental regulation policies. Over time, environmental regulation policies can prompt enterprises to carry out STI, thereby compensating for their investment in environmental protection and innovation, that is, there is an innovation compensation effect (Porter and Linde, 1995). The increase in costs brought about by environmental regulation will force the marine industry to improve its STI capabilities and reduce industrial production costs through STI to compensate for the cost increase caused by the increase in the marine environmental regulation intensity. On the whole, marine environmental regulation has little impact on the STI level of the MBI. The reason may be that the time is still short, and the incentive effect of marine environmental regulation has not yet fully emerged on industrial STI.
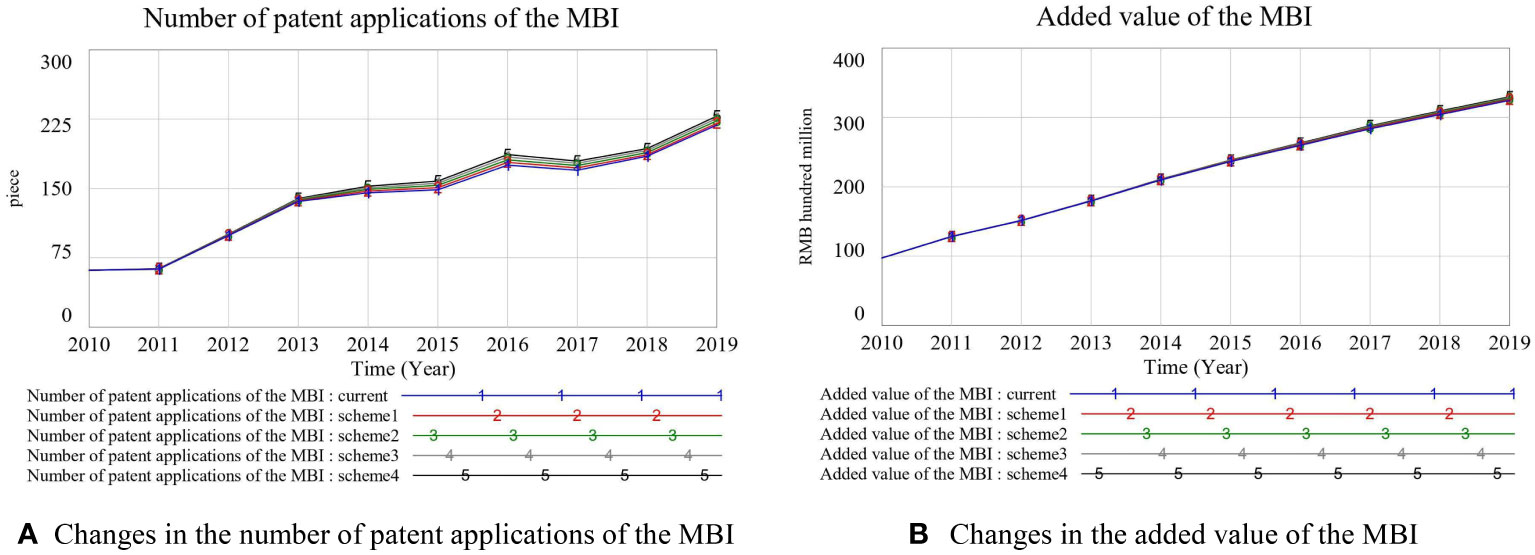
Figure 8 The impact of the marine environmental regulation intensity on the STI level of the MBI. (A) Changes in the number of patent applications of the MBI. (B) Changes in the added value of the MBI.
4.2.4 The impact of changes in innovation funding input
The innovation funds invested by different subjects have different impacts on the level of STI at different scales and times. Innovation funds flowing more to subjects with strong innovation capabilities is conducive to improving the utilization efficiency of innovation resources. To further explore the impact of changes in innovation funding input, different simulation schemes were designed from two aspects: the change in the number of innovation funding input by each entity and the innovation funds allocation on the basis of unchanged total innovation funding input.
(1) Analysis of the impact of the change in the number of innovation funding input. In order to comparatively analyze the impact of changes in the innovation funding input of enterprises and universities, the following four schemes were designed, as shown in Table 7. Then the simulation results are shown in Figure 9.
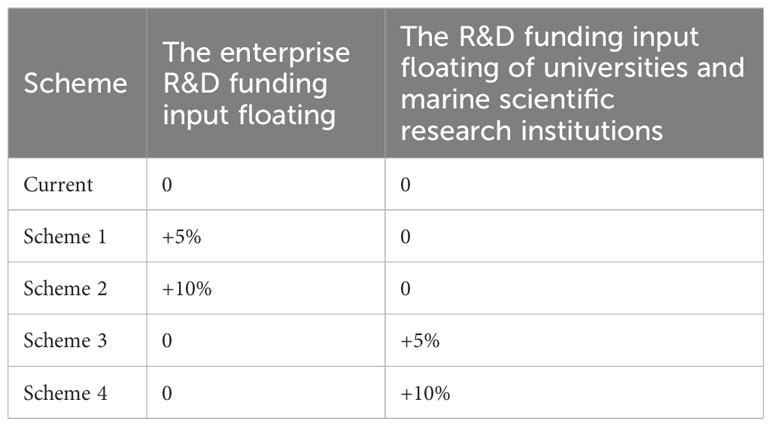
Table 7 Regulation factor scheme of the innovation funding input.
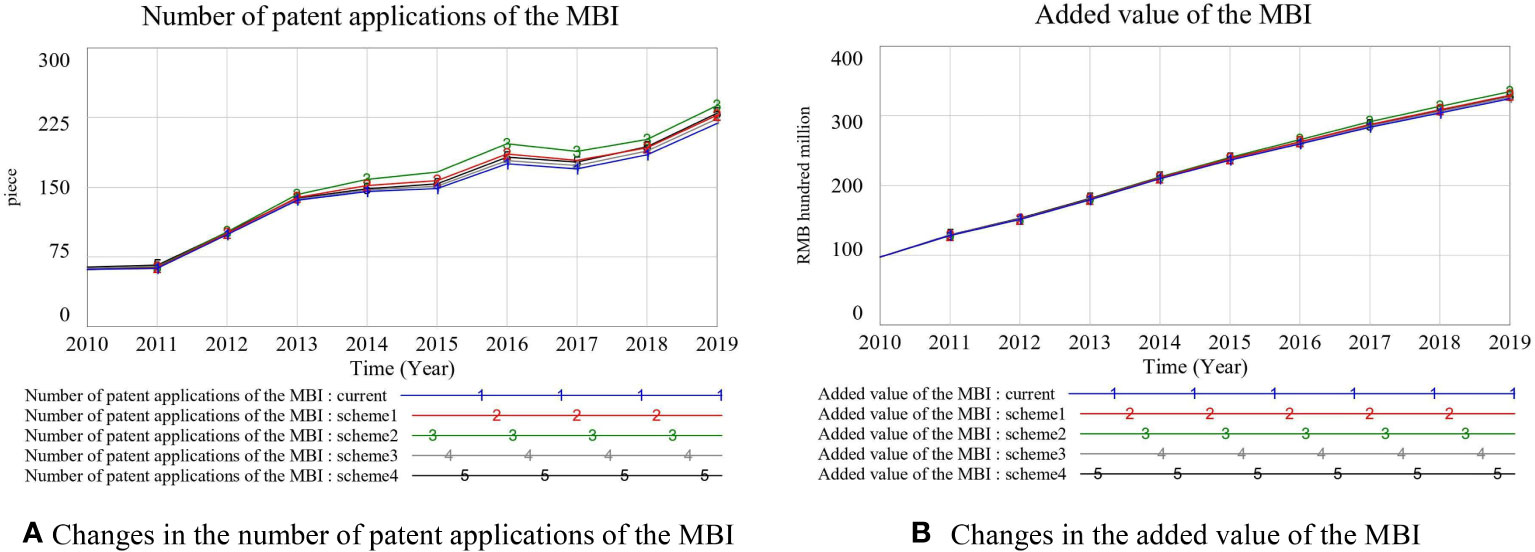
Figure 9 The impact of different innovation funding input on the STI level of the MBI. (A) Changes in the number of patent applications of the MBI. (B) Changes in the added value of the MBI.
According to Figure 9, the increase in innovation funding input led to increases in both the number of patent applications and the added value of the MBI. Among them, the change in R&D funding input of universities and marine scientific research institutions did not cause a large fluctuation in patent applications and industrial added value, while the change in enterprise R&D funding input caused a large fluctuation in both. So, it can be concluded that, compared with universities and marine scientific research institutions, the STI of the MBI is more sensitive to changes in enterprise R&D funding input.
(2) Analysis of the impact of innovation funds allocation. On the basis of keeping the total amount of innovation funds constant, four schemes were set for the proportion of funds input of different innovation subjects as shown in Table 8. The simulation results are shown in Figure 10.
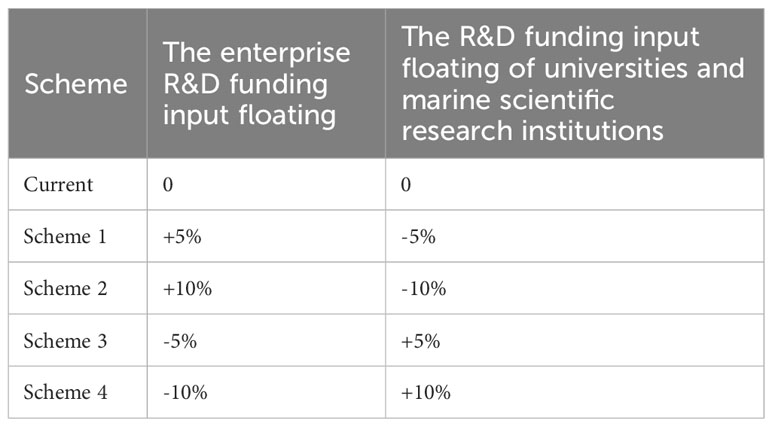
Table 8 Regulation factor scheme of the innovation funds allocation.
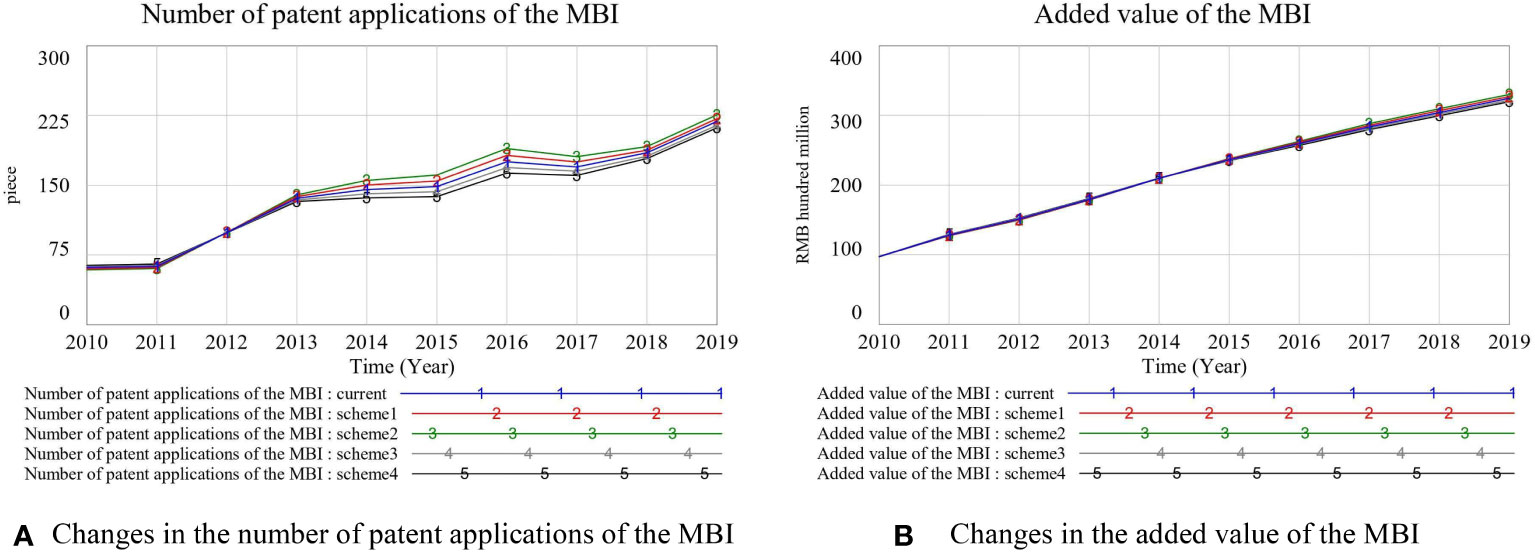
Figure 10 The impact of the allocation of innovation funds on the STI level of the MBI. (A) Changes in the number of patent applications of the MBI. (B) Changes in the added value of the MBI.
It could be seen from Figure 10 that under the condition of “increasing the enterprise R&D funding input by 10%, decreasing the R&D funding input of universities and marine scientific research institutions by 10%”, the number of patent applications and industrial added value of the MBI had the largest growth rate. On the contrary, under the condition of “decreasing the enterprise R&D funding input by 10%, increasing the R&D funding input of universities and marine scientific research institutions by 10%”, the number of patent applications and industrial added value in the MBI dropped the most. This indicates that the more innovation funds flow to enterprises, the more significant the promotion effect on the improvement of the STI level of the MBI is under the condition that the total amount of innovation funds is unchanged.
(3) Comprehensive analysis of the impact of changes in innovation funding input. Combining the two experimental results above, it could be seen that the positive promotion effect of each subject’s innovation funding input became more and more significant in the improvement of STI level with time, which was an indispensable key factor for STI. However, compared with universities and marine scientific research institutions, the increase in enterprise innovation funding input had a better performance in improving the level of the STI in the MBI. Enterprise innovation funds mainly come from the enterprise, and the enterprise itself is not only the decision maker of innovation funds but also the decision maker of funds use. There are few decision-making links, so the effectiveness of innovation funding input is not easy to be delayed in time. However, the innovation funds of universities and marine scientific research institutions mainly come from financial expenditures, and the application process is complicated and the cycle is long, so the effect of innovation funding input is prone to the “time lag” phenomenon.
4.2.5 The impact of changes in innovation personnel input
In order to explore the impact of changes in innovation personnel input, different simulation schemes were designed from two aspects: the change in the number of innovation personnel input by each entity and the innovation personnel allocation on the basis of unchanged total innovation personnel input.
(1) Analysis of the impact of the change in the number of innovation personnel input. The R&D personnel input of enterprises and the R&D personnel input of universities and marine scientific research institutions were increased by 5% and 10% respectively, in Table 9, then the simulation results are shown in Figure 11.
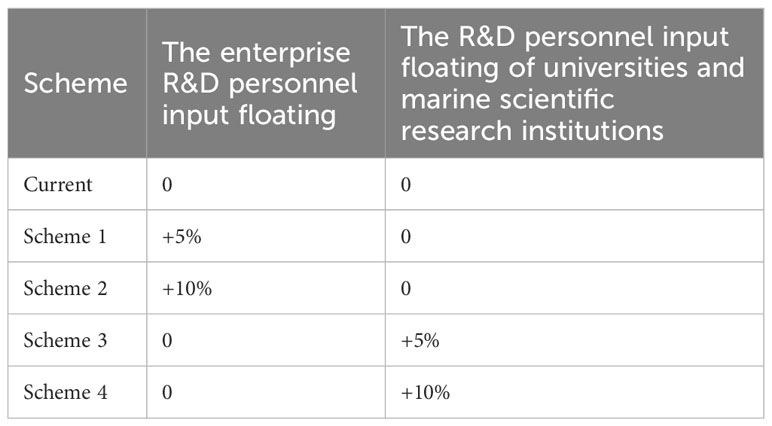
Table 9 Regulation factor scheme of the innovation personnel input.
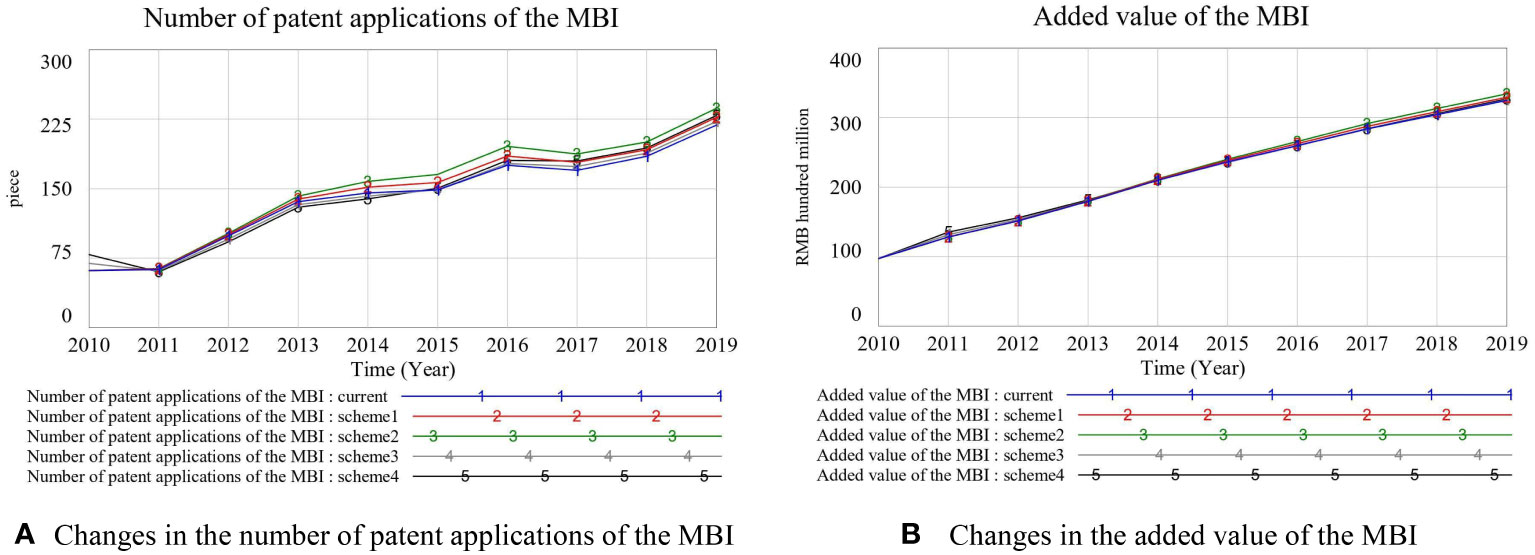
Figure 11 The impact of the different innovation personnel input on the STI level of the MBI. (A) Changes in the number of patent applications of the MBI. (B) Changes in the added value of the MBI.
Figure 11 reported that only a small increase was caused in the level of STI in the MBI by increasing the innovation personnel input in universities and marine scientific research institutions. On the contrary, increasing the enterprise’s innovation personnel input led to a great increase in the number of patent applications and added value of the MBI. So, it can be concluded that, compared with universities and marine scientific research institutions, increasing enterprise talent had a more significant role in promoting the STI level of the MBI.
(2) Analysis of the impact of innovation personnel allocation. Four simulation schemes were designed as shown in Table 10 to explore the impact of the allocation of innovators among different innovation subjects on the STI of the MBI under the condition of keeping the total amount of innovators constant. The simulation results are shown in Figure 12.
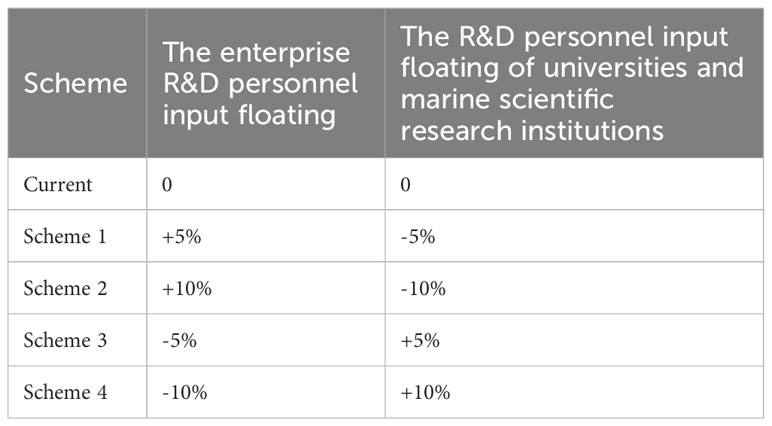
Table 10 Regulation factor scheme of the innovation personnel allocation.
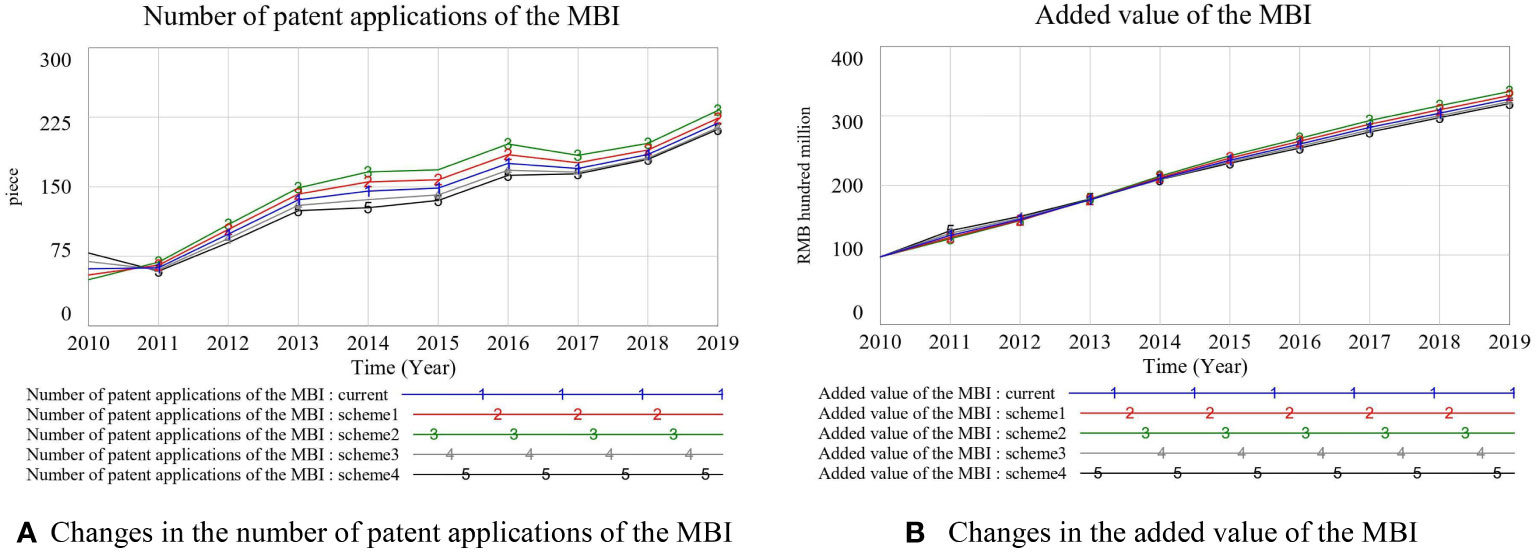
Figure 12 The impact of the allocation of innovation personnel on the STI level of the MBI. (A) Changes in the number of patent applications of the MBI. (B) Changes in the added value of the MBI.
It could be seen that under the condition of “increasing the enterprise R&D personnel input by 10% and decreasing the R&D personnel input of universities and marine scientific research institutions by 10%”, the number of patent applications and added value of the MBI increased the most; whereas in the case of “decreasing the enterprise R&D personnel input by 10% and increasing the R&D personnel input of universities and marine scientific research institutions by 10%”, the number of patent applications and added value of the MBI dropped the most. It can be seen that under the condition that the total amount of R&D personnel input remains unchanged, the more R&D personnel input flow to enterprises, the more significant the promotion effect on the improvement of the STI level of the MBI is.
(3) Comprehensive analysis of the impact of changes in innovation personnel input. Based on the two results above, it could be seen that increasing the innovation personnel input had a significant positive effect on the improvement of the level of STI in the MBI. This indicated that scientific research talents are the core resource of STI and the key force for improving the level of industrial technological innovation. The STI of the MBI was more sensitive to the changes in the enterprise innovation personnel input, so the increasing enterprise innovation personnel input could lead to faster innovation levels improvement. In addition, more innovators flow to universities and scientific research institutions, which may lead to a decrease in the number of patent applications, indicating that the existing talent evaluation system and scientific research management system fail to fully stimulate the innovation enthusiasm of innovators in universities and scientific research institutions, resulting in the waste of innovation personnel resources.
4.2.6 Comparison of the effects of various factors and analysis of multiple factors synergistic effect
After clarifying the impact of different input levels of various factors on STI in the MBI, this paper further explored the differences in the intensity of the effects among different factors. In addition, this paper also explored the impact of the synergistic effect of multiple factors on STI in the MBI by simultaneously increasing the input levels of all the factors, because it is often not only a single factor that changes in reality. Therefore, this paper designed simulation schemes 1-8, which aimed to explore the effect differences among these factors by increasing each factor by 10% while keeping other factors constant, respectively. Additionally, scheme 9 was designed to explore the synergistic effect of multiple factors by increasing all the factors by 5%. The specific simulation designs are shown in Table 11, and the simulation results are presented in Figure 13.
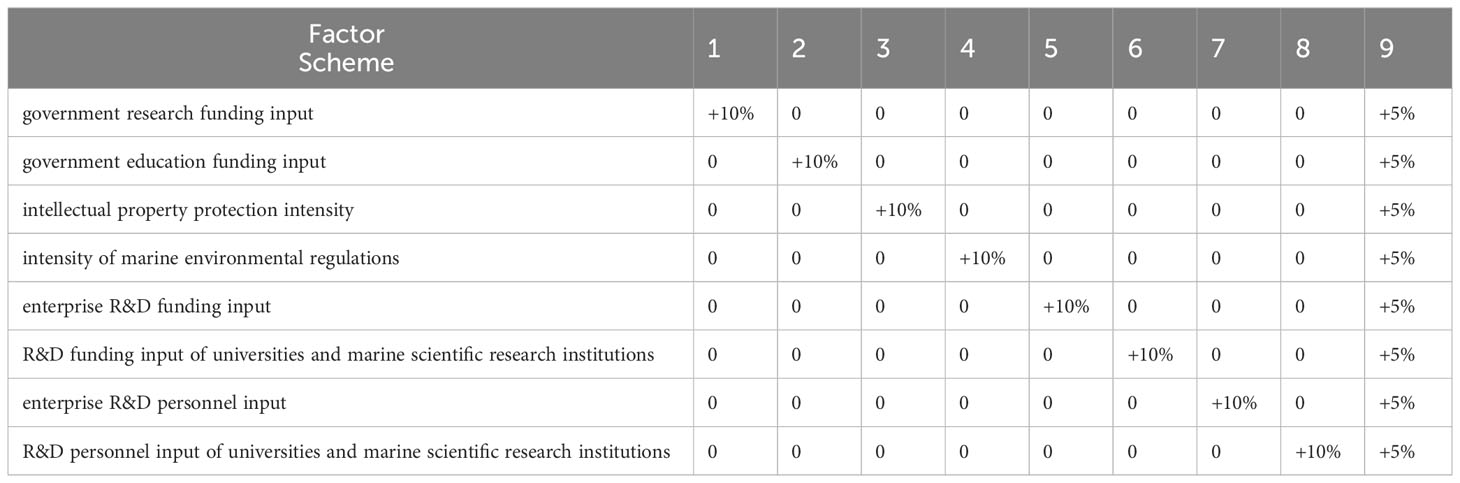
Table 11 Regulation scheme of various factors changes.
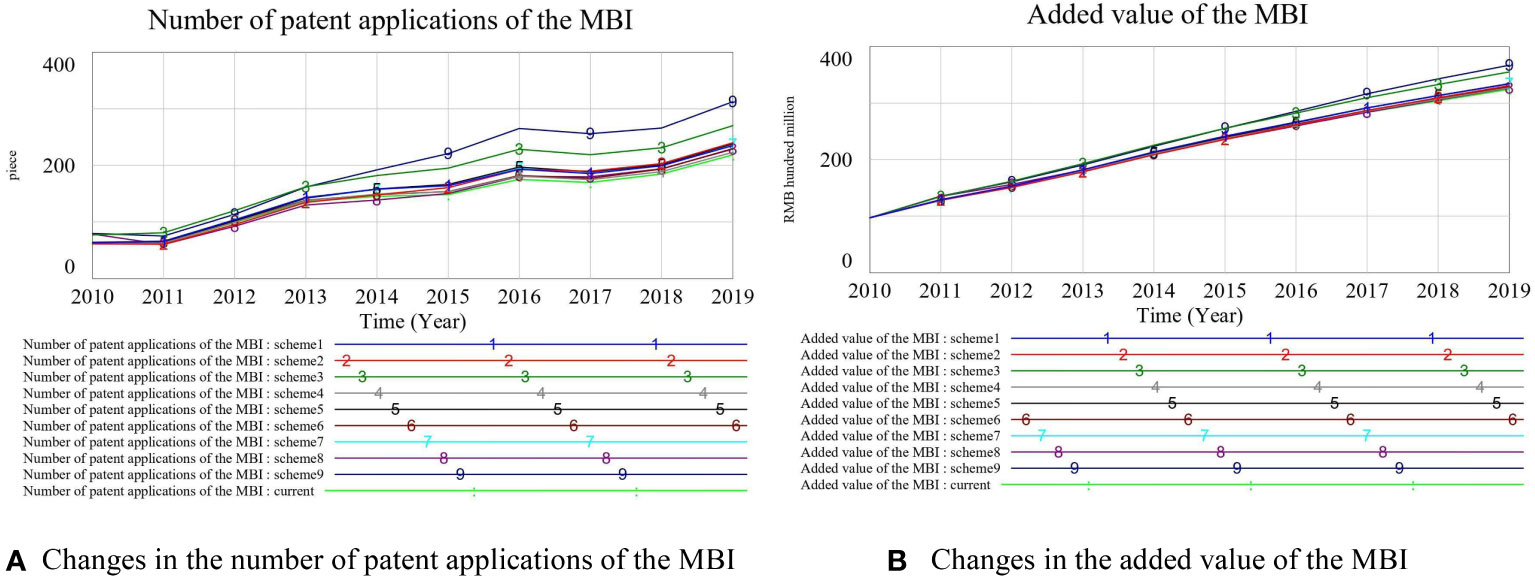
Figure 13 The impact of various factor input changes and multi-factors’ synergistic on the STI level of the MBI. (A) Changes in the number of patent applications of the MBI. (B) Changes in the added value of the MBI.
From Figure 13, it could be seen that, compared with the initial state, the STI level of the MBI had been improved to varying degrees after the implementation of the nine simulation schemes, with the greatest increase in the synergistic effect of multiple factors. To further explore the effect differences among the factors, this paper calculated the average annual growth rate of innovation output factors with the simulation model data. The results showed that the average annual growth rates of patent applications of the MBI under the influence of schemes 1-9 were 7.3%, 4.37%, 25.97%, 1.87%, 7.20%, 3.78%, 6.76%, 2.82%, and 35.3% respectively. The ranking of the average annual growth rates in terms of their impact was as follows: Scheme 9 > Scheme 3 > Scheme 1 > Scheme 5 > Scheme 7 > Scheme 2 > Scheme 6 > Scheme 8 > Scheme 4. The average annual growth rates of industrial added value were 1.83%, 0.32%, 7.13%, 0.4%, 1.49%, 1.03%, 1.4%, 1.07%, and 8% respectively. The ranking of the average annual growth rates in terms of their impact was as follows: Scheme 9 > Scheme 3 > Scheme 1 > Scheme 5 > Scheme 7 > Scheme 8 > Scheme 6 > Scheme 4 > Scheme 2.
According to the results above, there were significant differences in the level of contribution of various factors to STI in the MBI, and the synergistic promoting effect of multiple factors was stronger than all the individual factors. In the innovation environment subsystem, the promotion effect of intellectual property protection intensity was strongest, followed by government research funding input. However the overall promotion effect of government education funding input and marine environmental regulation intensity was at a relatively low level. In the innovation input subsystem, the contribution of enterprise R&D funding and personnel input was always higher than that of universities and marine research institutes. This result explains the limitations of the individual factor from another perspective. Therefore, the ranking in schemes 1-8 confirms the previous analysis results. Scheme 9, which represents the synergistic effect of multiple factors, had the strongest promotion effect on the STI of the MBI both in terms of innovation output and economic output. The synergistic effect of multiple factors can not merely increase the number of input factors, but enhance the cooperation and complementarity among subsystems and accelerate the transformation of innovation resources at the same time(Liu et al., 2023). Therefore, the improvement of STI in the MBI relies not only on the number of input factors but also on the synergistic effect of multiple factors.
5 Conclusions and policy suggestions
5.1 Conclusion
On the basis of analyzing the structure of the STI system of the MBI, this paper built a dynamic model and explored the dynamic mechanism of STI in China’s MBI by designing different simulation schemes. The study conclusions are as follows:
(1) In the innovation environment subsystem, government support (government research funding input and government education funding input), intellectual property protection, and marine environmental regulation are all important promoting forces to improve the STI level of the MBI. The innovation level of the MBI is significantly more sensitive to the changes in the intellectual property protection intensity and government research funding input, and the two have a strong significant role in improving the STI level of the MBI. Although the promotion effect of government education funding input on the level of STI has a lag, it has a cumulative and long-term effect with a significant strengthening trend over time. The marine environmental regulation intensity has a relatively small and gentle promotion effect on the MBI.
(2) In the innovation input subsystem, the two factors of innovation funding input and the innovation personnel input are the key driving factors in the STI system because they have a direct driving effect on the improvement of the innovation level of the MBI. The STI level of the MBI is highly sensitive to the changes in the enterprise innovation funding input and innovation personnel input, indicating that enterprises are at the core of STI in the MBI while as innovation subjects universities and marine research institutes have not yet played sufficient innovative support roles.
(3) The innovation factors have different degrees of influence on STI of the MBI. Compared with individual input factors, the synergistic effect of multiple factors has the most significant promoting effect on STI in the MBI.
(4) A comprehensive comparative analysis of the above simulation scheme results shows that the changes in various innovation factors lead to greater changes in the number of patent applications of the MBI, while the changes in the added value of the industry are much smaller than the changes in the number of patent applications. This indicates that the conversion rate of scientific research achievements in China’s MBI is quite low, and the link between drug R&D and production & sales is not connected well. Therefore, it is difficult for existing research achievements to be well transformed into medical products and, consequently, difficult to obtain higher innovative economic benefits.
5.2 Policy suggestions
Based on the analysis results above, this paper puts forward the following countermeasures and suggestions in order to provide a theoretical basis and practical reference for improving the STI level in China’s MBI.
(1) Expanding the scale of financial input in scientific research and education to strengthen government support. On the one hand, the government’s scientific research funding should be inclined to the research and development of the MBI to a certain degree, while improving the efficiency of the use of financial science and technology funds. It is possible to provide financial support for the development of STI through the establishment of special R&D funds for the MBI and at the same time issue special policy plans for the MBI to achieve the close integration of macro-strategy and the links of STI. On the other hand, continue to increase financial education support to ensure the scale and quality of higher education for the purpose of cultivating more high-quality talents and directly promoting the output of innovative achievements in universities and marine scientific research institutions.
(2) Improving the intellectual property protection policy of the MBI to increase the intellectual property protection intensity. Firstly, the patent examination system can be improved so as to improve the conversion rate of patents. It can be achieved by shortening the time from patent application to authorization as well as focusing on the practicability of patents of the examination standard. Secondly, it is necessary to establish a comprehensive evaluation mechanism of intellectual property rights to promote the transformation and application of application-oriented scientific and technological achievements. Universities and scientific research institutions should pay attention to the combination of application-oriented patent achievements and industries, and enterprises should highlight to the contribution of patent achievements to their operating income. Thirdly, improve the incentive system for patent inventors. Innovation enthusiasm could be well stimulated by issuing rewards and technology shares to inventors. At the same time, the interests of patent inventors could be well protected by increasing penalties for infringement of intellectual property rights to safeguard the property system.
(3) Increasing the marine environmental regulation intensity to give full play to the promoting function of environmental regulation in the innovation of the MBI. In terms of environmental regulation, the government should improve environmental regulation policies timely by adjusting marine environmental regulation standards so as to moderately increase the environmental management costs of relevant enterprises. In this way, the enthusiasm of enterprises for the STI can be stimulated on the basis of safeguarding the enterprise’s production. At the same time, in order to prevent the “one size fits all” situation of environmental protection, it is necessary to comprehensively use different environmental regulation measures as well as implement differentiated incentive and punishment measures according to the specific situation.
(4) Rationally allocating innovation resources to improve utilization efficiency. Different innovation resource input structures have different effects on the level of STI in the MBI. On the one hand, guide innovation funds and talents to flow more to enterprises. A good innovation investment environment could be created for enterprises through tax incentives and other measures. The talent incentive mechanism could be improved by appropriately increasing the salary subsidy of scientific research personnel. On the other hand, a joint platform of industry, university, and research should be well constructed to improve the transparency of information among innovation subjects so as to realize the efficient flow of innovation resources and improve utilization efficiency. Thus, enhance the synergy of industry-university-research innovation to promote the conversion rate of scientific research results, and then better play the driving role of scientific and technological innovation.
In summary, the dynamic mechanism of STI of the MBI is explored from a dynamic perspective by constructing a dynamic model according to relevant theoretical foundations. And then the corresponding countermeasures and policy suggestions are proposed based on the simulated research conclusions. With the further development of statistical work and the continuous progress of statistical tools, a more comprehensive system dynamics model can be constructed, providing more insights and suggestions for the sustainable development of the marine economy. It is hoped that this study could contribute to achieving the United Nations Sustainable Development Goals so as to promote the sustainable development of the marine economy of countries around the world.
Data availability statement
The original contributions presented in the study are included in the article/supplementary material. Further inquiries can be directed to the corresponding author.
Author contributions
X-MF: Conceptualization, Formal analysis, Project administration, Supervision, Writing – original draft, Writing – review & editing. Y-XT: Conceptualization, Data curation, Formal analysis, Investigation, Methodology, Writing – original draft, Writing – review & editing. YL: Methodology, Supervision, Writing – review & editing. Y-HH: Data curation, Investigation, Writing – review & editing. Q-QQ: Data curation, Investigation, Writing – review & editing. J-HL: Data curation, Investigation, Writing – review & editing. C-YL: Conceptualization, Methodology, Supervision, Writing – review & editing.
Funding
The author(s) declare financial support was received for the research, authorship, and/or publication of this article. This research was supported by the National Natural Science Foundation of China (grant number 42176126).
Conflict of interest
The authors declare that the research was conducted in the absence of any commercial or financial relationships that could be construed as a potential conflict of interest.
Publisher’s note
All claims expressed in this article are solely those of the authors and do not necessarily represent those of their affiliated organizations, or those of the publisher, the editors and the reviewers. Any product that may be evaluated in this article, or claim that may be made by its manufacturer, is not guaranteed or endorsed by the publisher.
References
Araújo R., Vázquez Calderón F., Sánchez López J., Azevedo I. C., Bruhn A., Fluch S., et al. (2021). Current status of the algae production industry in Europe: An emerging sector of the blue bioeconomy. Front. Mar. Sci. 7. doi: 10.3389/fmars.2020.626389
Bai F. C., Wu C. M. (2020). Developing strategy of marine biological medicine industry based on innovation ecosystem. Ocean Dev. Manage. 37 (03), 62–67. doi: 10.20016/j.cnki.hykfygl.2020.03.012
Breschi S., Malerba F. (1997). “Sectoral innoation systems: technological regimes, schumpeterian dynamics, and spatal boundanes,” in Systems of innovation: technologies, institutions and organizations (London: Frances Pinter), 130–156.
Dai K. F., Han L. M. (2017). Analysis on factors influencing marine biological medicine industry development in China based on interpretative structural modeling. Ocean Dev. Manage. 34 (08), 7–13. doi: 10.20016/j.cnki.hykfygl.2017.08.002
Di Paola N., Spena T. R. (2019). What drives biopharmaceutical firms’ exploratory openness? A comparative process tracing approach to the analysis of R&D microfoundations. J. Business Res. 97, 94–103. doi: 10.1016/j.jbusres.2018.12.004
Duan D. Z., Du D. B. (2022). Green technology innovation in China city system: Dynamics and determinants. Acta Geograph. Sin. 77 (12), 3125–3145. doi: 10.11821/dlxb202212012
Fang W., Tang L. L., Sun Z. H., Shao J. (2021). Study on the dynamic mechanism of scientific and technological innovation in large aircraft industry under the new nationwide system. Forum Sci. Technol. China (07), 57–65. doi: 10.13580/j.cnki.fstc.2021.07.013
Fu X. M., Jiang S. S., Wang N., Wang S. Q., Wang C. Y. (2018a). The research on international development path of China’s marine biopharmaceutical industry. Sustainability 10 (2), 399. doi: 10.3390/su10020399
Fu X. M., Jiang S. S., Zhang M. Q. (2018b). A study on mechanism of factor allocation to marine biopharmaceutical industry. Ind. Econ. Rev. 9 (02), 62–76. doi: 10.14007/j.cnki.cjpl.2018.02.005
Fu X. M., Wang S. Q., Lin X. H., Liu Y., Tang H. Y. (2020). Innovation efficiency and influencing factors of China’s marine biopharmaceutical industry based on SFA method. Sci. Technol. Manage. Res. 40 (13), 202–208. doi: 10.3969/j.issn.1000-7695.2020.13.029
Fu X. M., Zheng Y. M., Lin C. Y., Wang P., Wang C. Y. (2022). An evaluation of the coupling coordination of technological innovation system in China’s marine biopharmaceutical industry. J. Ocean Univ. China 22 (1), 271–284. doi: 10.1007/s11802-023-5310-5
Gai M., He Y. N., Ke L. N. (2022). Research on the development quality of China’s marine economy. J. Natural Resour. 37 (04), 942–965. doi: 10.31497/zrzyxb.20220408
Gozari M., Alborzet M., El-Seedi H. R., Jassbi A. R. (2021). Chemistry, biosynthesis and biological activity of terpenoids and meroterpenoids in bacteria and fungi isolated from different marine habitats. Eur. J. Med. Chem. 210, 112957. doi: 10.1016/j.ejmech.2020.112957
Han X. F., Song W. F., Li B. X. (2019). Can the Internet become a new momentum to improve the efficiency of regional innovation in China. China Ind. Econ. 07), 119–136. doi: 10.19581/j.cnki.ciejournal.2019.07.007
Hu D., Jin Y. T., Hou X. Q., Zhu Y. L., Chen D. T., Zhu Y. L., et al. (2023). Application of marine natural products against Alzheimer’s disease: Past, present and future. Mar. Drugs 21 (1), 43. doi: 10.3390/md21010043
Hu J. H., Wu H. C., Yao L. J. (2020). Simulation research on regional innovation system and economic growth in Guangdong-Hong Kong-Macao greater bay area. Stat Decision 36 (24), 98–102. doi: 10.13546/j.cnki.tjyjc.2020.24.021
Ji J. Y., Wang D. F., Zhang Y. (2022). Marine biopharmaceutical industrial policies in China: Evolution, characteristics, and challenges. Ocean Coast. Manage. 225, 106224. doi: 10.1016/j.ocecoaman.2022.106224
Jiao B. H. (2006). Research and development of marine bio-active substances and drugs. Acad. J. Naval Med. Univ. (01), 5–7. doi: 10.16781/j.0258-879x.2006.01.002
Lai H. B., Shi H. (2021). A research on the technological regime and innovation efficiency of the pharmaceutical manufacturing industry. Sci. Res. Manage. 42 (11), 16–24. doi: 10.19571/j.cnki.1000-2995.2021.11.003
Li X. M., Wu X. R., Zhao Y. F. (2023). Research and application of multi-variable grey optimization model with interactive effects in marine emerging industries prediction. Technol. Forecast. Soc. Change 187, 122203. doi: 10.1016/j.techfore.2022.122203
Li P. N., Zhao L. X., Wan J. B. (2014). The impact of innovation factors on industry innovation performances: An empirical analysis based on Chinese manufacturing and high technology industries. Stud. Sci. Sci. 32 (04), 604–612. doi: 10.16192/j.cnki.1003-2053.2014.04.010
Li G., Zhou Y., Liu F., Tian A. R. (2021). Regional difference and convergence analysis of marine science and technology innovation efficiency in China. Ocean Coast. Manage. 205, 105581. doi: 10.1016/j.ocecoaman.2021.105581
Liu H. C., Fan J., Zhou K. (2018). Development pattern of scientific and technological innovation and typical zone in China based on the analysis of scale and efficiency. Geograph. Res. 37 (05), 910–924. doi: 10.11821/dlyi201805005
Liu B. L., Zheng K. C., Zhu M. J., Wu F., Zhao X. F. (2023). Towards sustainability: the impact of industrial synergistic agglomeration on the efficiency of regional green development. Environ. Sci. pollut. Res. 30 (36), 85415–85427. doi: 10.1007/s11356-023-28449-1
Malerba F. (2002). Sectoral systems of innovation and production. Res. Policy. 31 (2), 247–264. doi: 10.1016/S0048-7333(01)00139-1
Pace L. A., Borch K., Deidun A. (2023b). Bridging knowledge gaps towards 2030: the use of foresight for the strategic management of a sustainable blue economy. Sustainability 15 (13), 10026. doi: 10.3390/su151310026
Pace L. A., Saritas O., Deidun A. (2023a). Exploring future research and innovation directions for a sustainable blue economy. Mar. Policy 148, 105433. doi: 10.1016/j.marpol.2022.105433
Porter M., Linde C. (1995). Toward a new conception of the environment competitiveness relationship. J. Econ. Perspect. 9 (4), 97–118. doi: 10.1257/jep.9.4.97
Qian L., Wang W. P., Xiao R. Q. (2022). An analysis of the regional differences and loss sources of green innovation efficiency of Chinese enterprises under technology heterogeneity. Sci. Res. Manage. 43 (09), 127–138. doi: 10.19571/j.cnki.1000-2995.2022.09.015
Ren W. H., Wang Q. (2023). Impact of environmental regulation on the green technological progress of marine economy. Sci. Res. Manage. 44 (02), 55–64. doi: 10.19571/j.cnki.1000-2995.2023.02.006
Samara E., Georgiadis P., Bakouros I. (2012). The impact of innovation policies on the performance of national innovation systems: A system dynamics analysis. Technovation 32 (11), 624–638. doi: 10.1016/j.technovation.2012.06.002
Stebbings E., Papathanasopoulou E., Hooper T., Austen M. C., Yan X. (2020). The marine economy of the United Kingdom. Mar. Policy 116, 103905. doi: 10.1016/j.marpol.2020.103905
United Nations (2014). Transforming our world: the 2030 agenda for sustainable development (New York: United Nations), 1–41.
Wang Q. F. (2009). System Dynamics (Shanghai: Shanghai University of Finance and Economics Press), 25–33.
Wang J. L., Ma X., Zhao Y. X., Zhao Y. X., Zhao J., Heydari M. (2022). Impact of scientific and technological innovation policies on innovation efficiency of high-technology industrial parks-A dual analysis with linear regression and QCA. Int. J. Innovation Stud. 6 (3), 169–182. doi: 10.1016/j.ijis.2022.06.001
Xiong L., Zang X. (2015). Research on the innovation dynamic mechanism of information service platform. Sci. Technol. Prog. Policy 32 (13), 20–25. doi: 10.6049/kjjbydc.2015020173
Xu C. M., Shan X. G. (2008). Constructing of the index system and verification for the intensity of intellectual property protection in China. Stud. Sci. Sci. (04), 715–723. doi: 10.16192/j.cnki.1003-2053.2008.04.007
Xue Y., Wang J. K., Hu L. N. (2023). R&D investment, innovation motivation and implementation effect of scientific and technological achievements transformation policy. Stat Decision 39 (03), 170–174. doi: 10.13546/j.cnki.tjyjc.2023.03.031
Yang R. T., Li J. X., Liu C. Z., Tang H. (2022). Empirical test of the influence of local government debt structure on enterprise innovation. Stat Decision (23), 138–143. doi: 10.13546/j.cnki.tjyjc.2022.23.026
Yang J., Xiao M. Y., Jiang M. B. (2023). Intellectual property right protection, technological innovation and return to capital in China. Sci. Res. Manage. 44 (02), 137–145. doi: 10.19571/j.cnki.1000-2995.2023.02.015
Zhang Z. R., Gu G. F. (2018). On the effect of the development of science and technology for finance on Chinese economic growth: An empirical test based on spatial econometrics model. The Theory and Practice of Finance and Economics 39 (04), 112–118. doi: 10.16339/j.cnki.hdxbcjb.2018.04.017
Zhang B. J., Li P. L., Chen J., Guo Q., Wu Y. R. (2019). Thematic analysis and evolution process of national science and technology innovation policy: Based on the perspective of text mining. Sci. Sci. Manage. S.& T. 40 (11), 15–31.
Zhang Y., Long M. L. (2019a). Industry-university-research institute collaboration in marine strategic emerging industries: innovation mechanism and inspiration. Sci. Technol. Manage. Res. 39 (20), 91–98. doi: 10.3969/j.issn.1000–7695.2019.20.013
Zhang Y., Meng F. R. (2019b). Development trend of basic research competitiveness of marine strategic emerging industries—evidence from marine biological medicine industries. Sci. Technol. Prog. Policy 36 (16), 67–76. doi: 10.6049/kjjbydc.2018110359
Zhang Y., Meng F. R., Zhu G. L. (2019c). Industry-University-Research (IUR) collaboration network in marine strategic emerging industry: Characteristics, evolution and impact. J. Technol. Econ. 38 (02), 40–51.
Keywords: marine biomedical industry, scientific and technological innovation, dynamic mechanism, system dynamics, simulation
Citation: Fu X-M, Tan Y-X, Liu Y, Han Y-H, Qi Q-Q, Li J-H and Lin C-Y (2024) The dynamic mechanism of scientific and technological innovation in China’s marine biomedical industry. Front. Mar. Sci. 10:1289742. doi: 10.3389/fmars.2023.1289742
Received: 06 September 2023; Accepted: 27 December 2023;
Published: 16 January 2024.
Edited by:
Osama M. Darwesh, National Research Centre, EgyptReviewed by:
Mohamad Aboelenin, National Research Centre (NRC), EgyptLehua Gao, Ocean University of China, China
Copyright © 2024 Fu, Tan, Liu, Han, Qi, Li and Lin. This is an open-access article distributed under the terms of the Creative Commons Attribution License (CC BY). The use, distribution or reproduction in other forums is permitted, provided the original author(s) and the copyright owner(s) are credited and that the original publication in this journal is cited, in accordance with accepted academic practice. No use, distribution or reproduction is permitted which does not comply with these terms.
*Correspondence: Chun-Yu Lin, bGluY2h1bnl1QHN0dS5vdWMuZWR1LmNu