 Junhyeong Seo1
 Intae Kim1,2
 Dong-Jin Kang2,3
 Hyunmi Lee1
 Jin Young Choi1
 Kongtae Ra1,2
 TaeKeun Rho1Kyungkyu Park1,2
 Suk Hyun Kim1*
- 1Marine Environmental Research Department, Korea Institute of Ocean Science and Technology (KIOST), Busan, Republic of Korea
- 2Department of Ocean Science, University of Science and Technology (UST), Daejeon, Republic of Korea
- 3KIOST School and Academic Program Division, Korea Institute of Ocean Science and Technology (KIOST), Busan, Republic of Korea
We investigated the export flux of particulate organic carbon (POC) using 234Th as a tracer in the western Indian Ocean along 60°E and 67°E transects in 2017 and 2018. The Seychelles-Chagos Thermocline Ridge (SCTR), where production is relatively high due to nutrient replenishment by upwelling of subsurface water, was observed at 3°S – 12°S in 2017 and 4°S – 13°S both 60°E and 67°E in 2018. POC fluxes in 2017 showed no differences between the SCTR and non-SCTR regions. However, in 2018, the POC fluxes in the SCTR regions (8.52 ± 7.89 mmol C m–2 d–1) were one order of magnitude higher than those observed in the non-SCTR regions (0.63 ± 0.07 mmol C m–2 d–1), which appeared to be related to the strong upwelling of subsurface water. These POC fluxes were comparable to those observed under bloom conditions, and thus, are important for estimating the efficiency of carbon sequestration in the ocean.
1 Introduction
Biological carbon pump (BCP) plays a crucial role in the global carbon cycle, as they involve the vertical export of particulate organic carbon (POC) produced by biological activity in surface waters (Falkowski et al., 1998; Sabine et al., 2004). Atmospheric carbon dioxide can be sequestered into the deep ocean through the BCP on a decadal to millennial timescales (Boyd et al., 2019). Therefore, examining BCP is important for understanding the oceanic carbon cycle. Globally, the POC export flux has shown latitudinal patterns in the ocean. For example, POC export fluxes are higher at high latitudes, ~20 – 30 gC m–2 yr–1 compared to ~1 – 10 gC m–2 yr–1 than at low latitudes (Henson et al., 2012). However, high POC fluxes are observed even in oligotrophic low latitudes due to regional processes and climatological effects such as mesoscale eddies, typhoons by extreme atmospheric forcing, and upward Ekman pumping in thermocline ridge. In the subtropical Western North Pacific, POC fluxes below the euphotic zone at the edge of warm eddy were observed to be 3 – 5 times higher than 26 – 35 mg C m–2 d–1 determined in the nutrient-depleted oligotrophic oceans (Shih et al., 2015). In the East China Sea, the POC flux for five days immediately after the typhoon passed was found to be 1.7 times higher than the 140 – 180 mg C m–2 d–1 in the period when there was no typhoon (Hung et al., 2010). Moreover, El Niño events showed POC fluxes four times higher than average flux (1.74 mg C m–2 d–1) in the 10°N thermocline ridge area of the northeastern equatorial Pacific (Kim et al., 2012).
The Indian Ocean shows unique circulation features, including the Indian Ocean Dipole (IOD) and El Niño Southern Oscillation (ENSO) (Klein et al., 1999; Baquero-Bernal et al., 2002). In the western Indian Ocean, the Seychelles-Chagos Thermocline Ridge (SCTR) is a persistent upwelling region characterized by a relatively shallow thermocline and a thin mixed layer (Woodberry et al., 1989; McCreary et al., 1993; Schott et al., 2009). The SCTR upwelling is generally observed south of the equator (5°S –15°S) because the wind direction in this region is westerly, which differs from that in the Pacific and Atlantic Oceans (Schott and McCreary, 2001; McPhaden et al., 2009). The strength of the SCTR upwelling is influenced by air-sea interactions, including local winds (Lee et al., 2022). For example, during the positive phase of the IOD and(or) ENSO, the SCTR upwelling can be enhanced because of the stronger suppression of upwelling caused by downwelling Rossby waves in this region (Masumoto and Meyers, 1998; Rao & Behera, 2005). Further, the SCTR is recognized as an important region for biogeochemical cycles because upwelling can transport nutrients from the subsurface to the surface ocean (Xie et al., 2002; George et al., 2018). Kim et al. (2022) reported that the abundance of mesozooplankton in the SCTR was higher than that observed in the non-SCTR regions. This has also been observed through satellite observations that indicated relatively higher primary production in the SCTR regions than in the non-SCTR regions (Dilmahamod et al., 2016). However, carbon cycles in the SCTR regions are still poorly understood, particularly the effects of upwelling on the BCP. Biogeochemical studies in the SCTR regions were mostly focused on the variability of nutrient increase due to upwelling, primary productivity from satellite images and physical variables, or biological production using ocean carbon models (Lévy et al., 2007; Resplandy et al., 2009; Liao et al., 2014; Dilmahamod et al., 2016; George et al., 2018; Sreeush et al., 2018; Sreeush et al., 2020; Vinayachandran et al., 2021; Karnan and Gautham, 2023).
Extensive studies to understand BCP in the ocean have been conducted through international and national programs such as JGOFS (Joint Global Ocean Flux Study) (Knap et al., 1996), VERTIGO (VERtical Transport In the Global Ocean) (Buesseler and Lampitt, 2008), GEOTRACES (Group S. W, 2007), and so on. POC fluxes have been mainly estimated by direct measurements of settling particles using sediment traps (Honjo, 1978; Baker et al., 1988; Buesseler et al., 2007; Honjo et al., 2008; Lampitt et al., 2008; Owens et al., 2013; Engel et al., 2017) or indirect approaches derived from the 210Po/210Pb and the 234Th/238U disequilibria (Friedrich and van der Loeff, 2002; Cochran and Masqué, 2003; Murray et al., 2005; Stewart et al., 2007; Verdeny et al., 2009; Wei et al., 2011; Roca-Martí et al., 2016), nutrient uptake (Pondaven et al., 2000; Sanders et al., 2005; Le Moigne et al., 2013), satellite empirical algorithms (Dunne et al., 2007; Henson et al., 2011; Laws et al., 2011).
234Th/238U disequilibria approach has been widely used as a means to estimate POC fluxes in the ocean over a period exceeding 50 years. It has already advanced our understanding of the magnitude and controls of particle export in the ocean (Buesseler et al., 2006; Ceballos-Romero et al., 2022). 234Th (half-life: 24.1 d) is particle-reactive, but its parent, 238U (half-life: 4.5 x 10⁹ years), is chemically conservative and proportional to salinity in oxygenated seawater (Bhat et al., 1968; Djogić et al., 1986).
234Th/238U disequilibria have the advantage of allowing a downward flux to be determined by integrating the deficit of 234Th in the upper water column and coupling it to the POC/234Th ratio in sinking particles (Puigcorbé et al., 2020). In addition, the half-life of 234Th is only 24.1 days. This makes 234Th/238U disequilibria particularly suited for studying biologically mediated and other relatively fast (physical) processes that occur on time scales of days to weeks, which are typical in the upper ocean. However, the factors that control changes in the POC/234Th ratio as a function of area, time, particle size and type, and water column depth are not yet well understood (Waples et al., 2006; Puigcorbé et al., 2020). Comparisons of C fluxes derived from 234Th show good agreement with independent estimates of C flux, including mass balances of C and nutrients over appropriate space and time scales (within factors of 2–3) (Buesseler et al., 2006). In this study, POC fluxes were investigated across the SCTR regions using 234Th as a tracer in 2017 and 2018 to examine the impact of upwelling processes due to shallow thermocline.
2 Materials and methods
2.1 Sampling
Samples were collected onboard the R/V Isabu from July 5 to 22, 2017, along the 67°E transect, and from April 6 to 25, 2018, along the 60°E and 67°E transects (Figure 1). Hydrographic parameters, such as temperature and salinity, were obtained using a conductivity-temperature-depth (CTD) mounted on a Rosette sampler. Seawater and particulate samples were collected using a 12 L Niskin sampler. For chlorophyll-a (Chl-a) analysis, 2 L of seawater samples were filtered through a pre-combusted (4 h, 450°C) glass fiber filter (Whatman, 0.7 μm pore size) and stored in a cryogenic freezer (–80°C) before measurement. The 15 mL filtrated seawater was collected and stored in a refrigerator (4°C) for dissolved inorganic nitrogen (DIN) analysis. To measure dissolved 234Th (234Thdis), 4 L of seawater samples were immediately filtered through a silver membrane filter (Sterlitech, 1.2 µm pore-size, 25 mm diameter) and acidified with concentrated HNO3 to adjust to pH ~2. For particulate 234Th (234Thpart), an additional 2 L of seawater was filtered through the silver filter after filtering 4 L of seawater for 234Thdis samples. POC samples were collected by filtering 4 L of seawater through the silver membrane filter, sonicating with ethanol and acetone, and washing with deionized water before filtration to reduce residual POC.
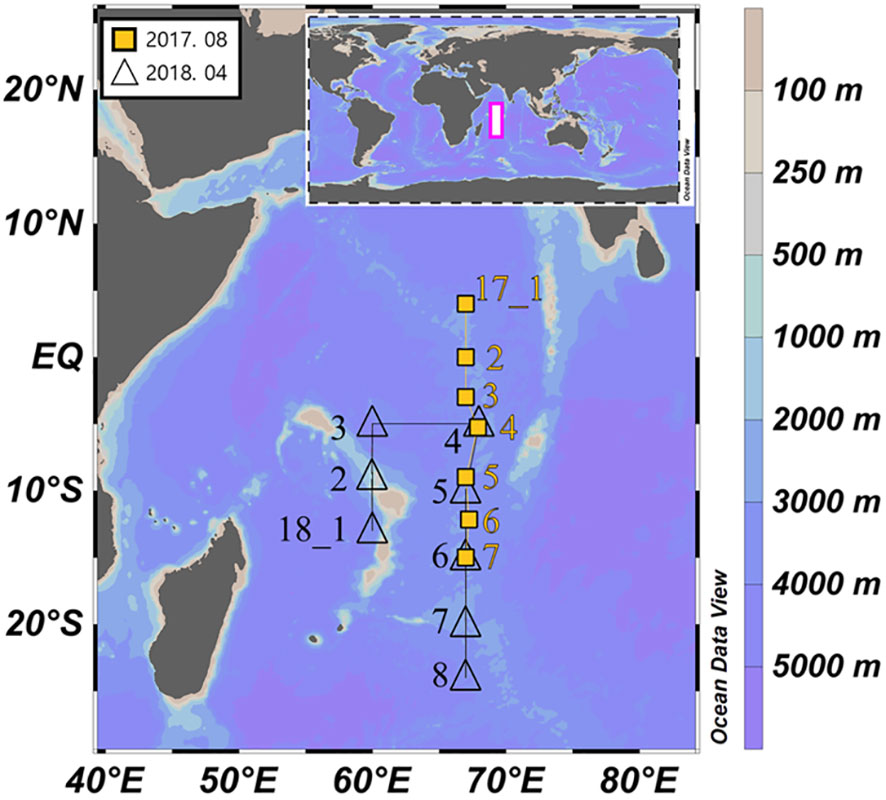
Figure 1 Sampling site (pink rectangle) in the western Indian Ocean in 2017 (yellow rectangles) and 2018 (black triangles).
2.2 Analysis
Chl-a concentrations were measured using a fluorescence sensor (WET Labs ECO-AFL/FL), and onboard calibration was performed using a Turner Designs 10-AU fluorometer. Onboard measurements of DIN concentrations were conducted using an automatic nutrient analyzer (New QuAAtro39, SEAL Analytical).
To measure the 234Thdis activity, an internal standard (230Th, 6.5 dpm) was added to 4 L of the sample, and the pH was raised to ~8 by adding NH4OH after isotopic equilibration (~12 h). KMnO4 and MnCl2 were then added and allowed to stand for over 6 h to form MnO2 precipitates while heating above 80°C (Cai et al., 2006). After the Mn precipitates were formed, they were filtered through the silver filter and covered with two layers of aluminum foil. Onboard measurements were conducted using a low-level beta counter (RISØ National Laboratories, Denmark). Procedural blanks (n = 3) accounted for less than 5% of the average sample activity. The measurements were conducted five times to confirm 234Th activity. After beta counting, 230Th recovery was measured by adding a 229Th spike and further separating Th using an anion-exchange column (Bio-Rad Laboratories, Hercules, CA). Both 229Th and 230Th were measured using a magnetic sector field inductively coupled plasma mass spectrometer (Element 2, Thermo Scientific) (Pike et al., 2005). On-board measurements of 234Thpart were also conducted using a low-level beta counter. After that, in the land-based laboratory, the measurements were conducted five times as well. Total 234Th (234Thtotal) activity was determined by summing the activities of 234Thdis and 234Thpart. 234Th flux was calculated using 238U/234Th disequilibria following the one-dimensional particle flux model given (Bacon et al., 1996; Owens et al., 2015):
where is the particulate flux of 234Th integrated with depth z.
To measure the POC concentration, the sample was decarbonated by HCl fumigation in a desiccator, and measurements were conducted using an elemental analyzer (EA 2400 CHNS/O Series II, PerkinElmer, USA) (Knap et al., 1996). The procedural blanks (n = 10) were below the detection limit of the elemental analyzer (0.03 µM).
3 Results and discussion
3.1 Hydrological characteristics
In 2017, potential temperature and salinity in the upper 200m of the study area ranged from 12 to 30°C and 34.73 to 36.43, respectively (Figure 2). Relatively higher salinity was observed in the surface layer along 5°N – 10°S in 2017, and this was also observed in the subsurface layer (~200 m) in 2018. The surface mixed layer (SML) defined by the vertical distribution of the potential temperature was approximately 50 m. The potential temperature range in 2018 was similar to that observed in 2017 (Figure 2). The salinity ranged from 33.83 to 35.70, slightly lower than the values observed in 2017. In the surface layer, the low-salinity water was observed in the entire region of the 60°E line and along 5°S – 20°S of the 67°E line. The SML in both 60°E and 67°E lines ranged from 25 to 50 m. On the 67°E line, the northern regions (5°S – 15°S) had a relatively shallower SML than the southern regions (15°S – 25°S). The SCTR regions in 2017 and 2018, defined as a 20°C isotherm depth with a shallow thermocline, were observed at 3°S – 12°S and 4°S – 13°S both in 60°E and 67°E lines, respectively.
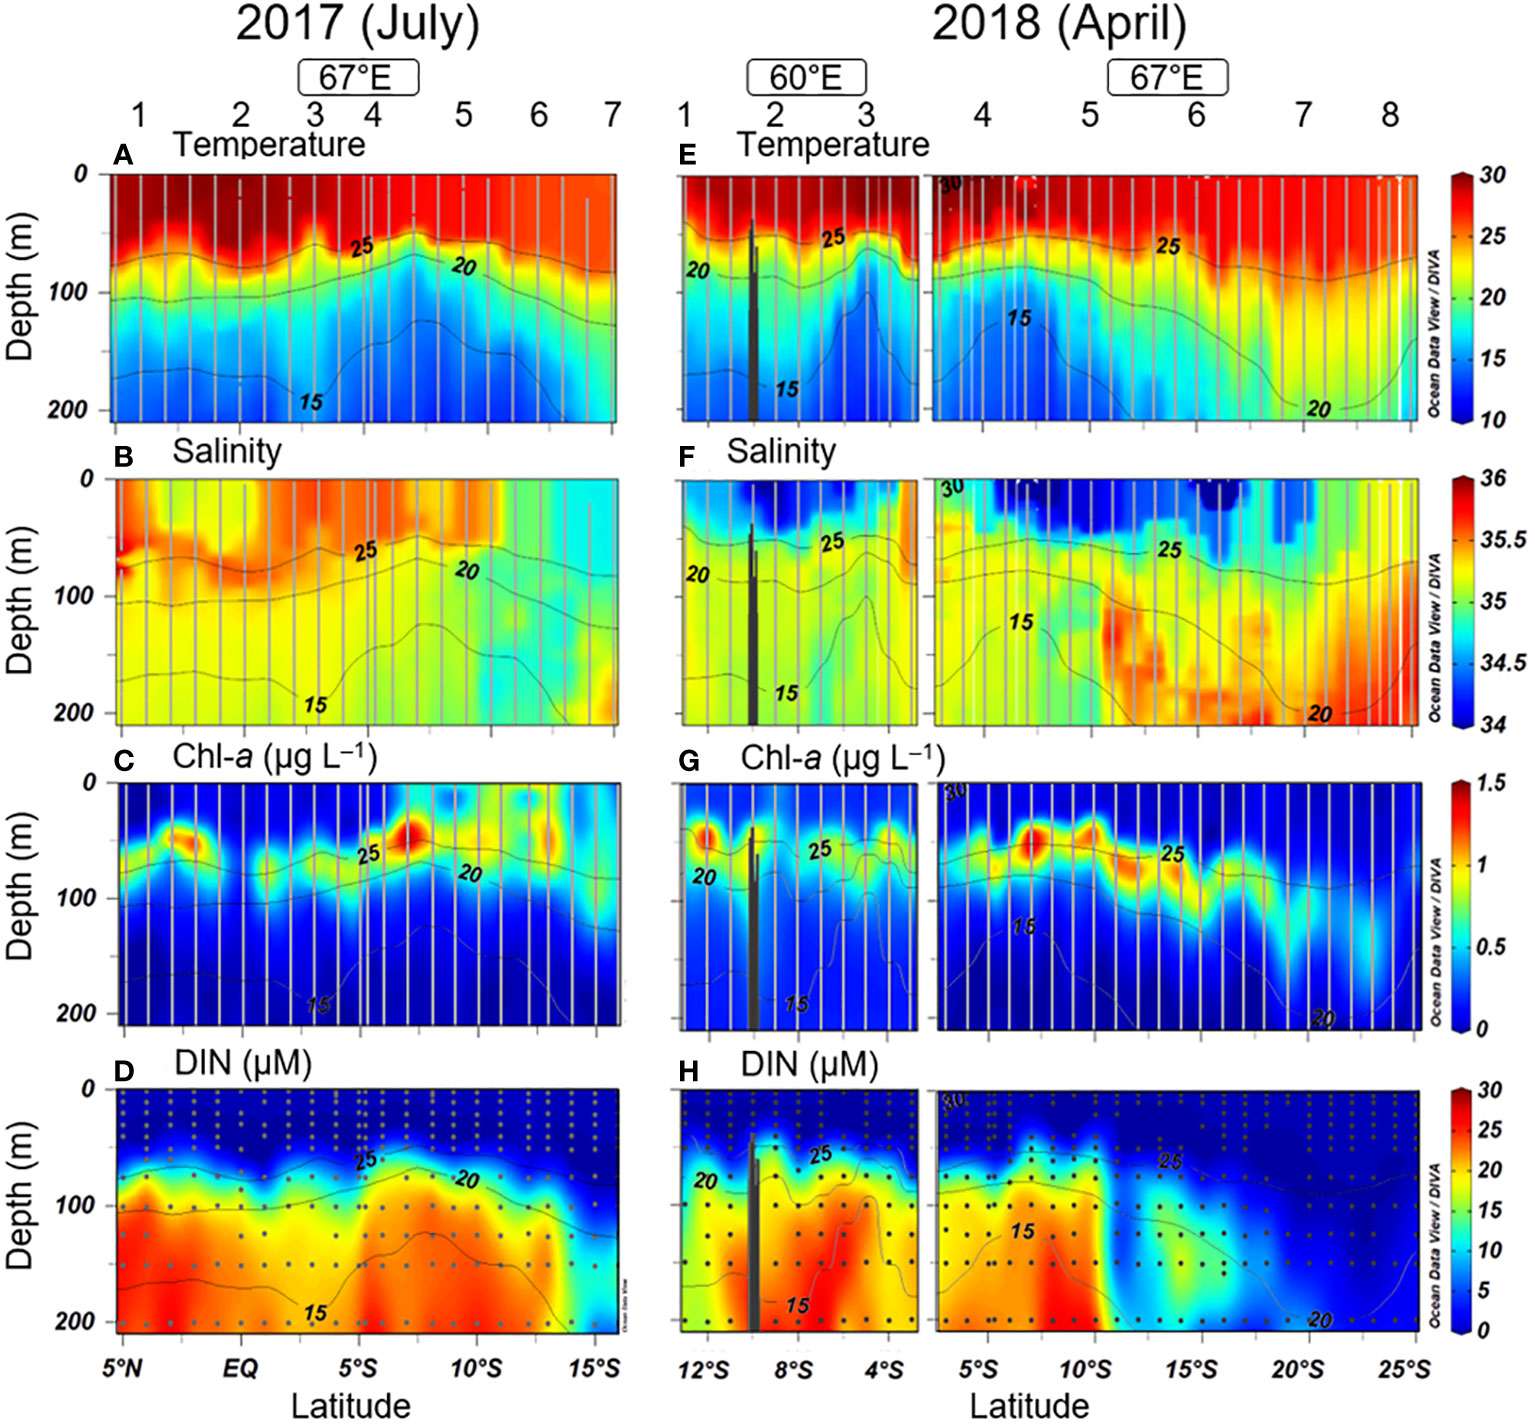
Figure 2 Latitudinal distributions of temperature, salinity, Chl-a, and DIN in the study region in 2017 (A–D) and 2018 (E–H). Solid lines (gray) and circles (gray) indicate the sampling stations. Contour lines (solid) indicate the temperature of the study regions. The numbers on the figure indicate the station.
Chl-a concentrations in 2017 and 2018 ranged from 0.00 to 1.62 µg L–1 and 0.00 to 1.87 µg L–1, respectively (Figure 2). In 2017, a subsurface chlorophyll maximum (SCM) was observed between 50 to 91 m, with no significant differences between 5°N – 14°S. However, Chl-a concentrations in the surface layer (< 50 m) of the SCTR regions were higher than those in the non-SCTR regions. In 2018, SCM depths were similar to those observed in 2017 but were much shallower in the SCTR regions than in the non-SCTR regions (15°S – 24°S). The euphotic zone, defined as the depth at which photosynthetically active radiation (PAR) reaches 1% of the surface layer, ranged from 43 to 161 m in 2017 (103 ± 46 m; mean ± standard deviation), where PAR values were available (Supplementary Table S1). In 2018, the euphotic zone ranged from 31 to 135 m, with an average of 73 ± 27 m. No clear differences were observed between the 2017 and 2018 observations.
DIN concentrations in 2017 and 2018 ranged from 0.01 to 38.39 µM and 0.01 to 37.98 µM, respectively (Figure 2). In 2017, the vertical distribution of DIN showed a depleted concentration in the surface layer, which gradually increased with depth. No clear differences were observed between the SCTR and non-SCTR regions. The vertical distribution of DIN in 2018 was similar to that observed in 2017. However, in the SCTR regions, the DIN concentrations in the subsurface layer (75 – 100 m) were one order of magnitude higher than those in non-SCTR regions.
3.2 Distributions of 234Th and POC
In 2017 and 2018, 238U activity ranged from 2.41 to 2.48 dpm L–1 and 2.36 to 2.49 dpm L–1, respectively, based on salinity calculations (Owens et al., 2011). In 2017, 234Thtotal and 234Thpart activities were 1.63 – 2.88 dpm L–1 and 0.06 – 0.48 dpm L–1, respectively (Figure 3). A deficiency in 234Thtotal relative to 238U was observed mainly in the surface layer (0 – 100 m). In the surface layer of the SCTR regions, 234Thtotal deficiencies and 234Thpart concentrations were higher than those observed in the non-SCTR regions. In 2018, 234Thtotal and 234Thpart concentrations were 0.34 – 2.78 dpm L–1 and 0.05 – 0.66 dpm L–1, respectively (Figure 3). The 234Th deficiency in the SCTR regions was higher than that observed in the non-SCTR regions. Below the surface layer, 234Thtotal activities were close to the equilibrium value in both years, indicating that particle settling mainly occurred within the 100 m layer. The excess 234Thtotal in the subsurface layer could be due to the release of 234Th following remineralization of organic matter.
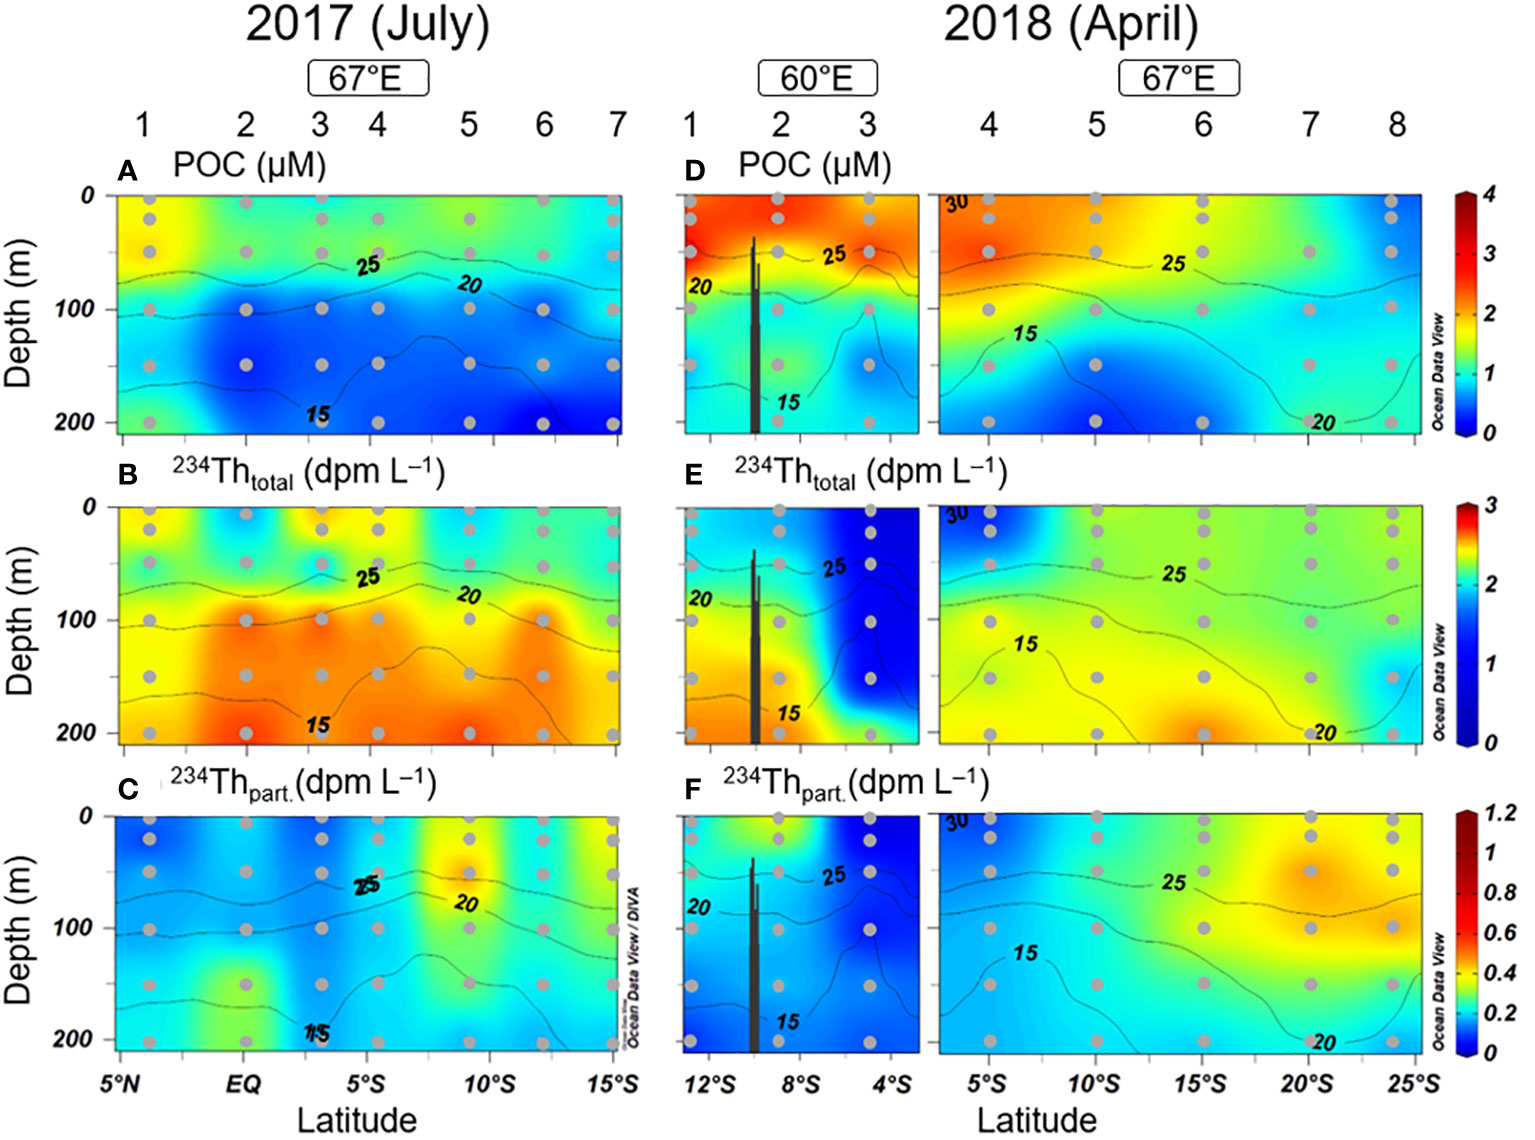
Figure 3 Latitudinal distributions of POC, total 234Th (234Thtotal), and particulate 234Th (234Thpart) in the study region in 2017 (A–C) and 2018 (D–F). Circles (gray) indicate the sampling stations. Contour lines (solid) indicate the temperature at the study regions. The numbers on the figure indicate the station.
The POC concentrations in 2017 and 2018 ranged from 0.01 to 0.48 µM and 0.01 to 3.51 µM, respectively (Figure 3), which were within the typical range (0.40 – 1.09 µM) observed in the equivalent region (Subha Anand et al., 2017; Subha Anand et al., 2018), except for the 60°E transect in 2018. The vertical distribution of POC in both years decreased gradually with increasing depth from the surface layer. In 2017, no clear latitudinal differences in POC concentration except 5°N region were observed; however, in 2018, POC concentrations in the SCTR regions were one to two orders of magnitude higher than those observed in the non-SCTR regions.
3.3 234Th based POC fluxes
We calculated 234Th flux at a depth of 100 m to examine the POC flux as recommended by Buesseler et al. (2006). The integrated 234Th fluxes at a depth of 100 m in 2017 and 2018 varied from 237 to 991 dpm m–2 d–1 and 270 to 3191 dpm m–2 d–1, respectively (Table 1). A comparison of stations at similar latitudes (10°S and 15°S) in both years revealed no significant differences, except for Station 4 (5°S) in 2018. In 2017, no clear differences were observed between the SCTR (3°S – 12°S) and non-SCTR regions. However, in 2018, 234Th fluxes in the SCTR regions (4°S – 13°S), 1402 ± 1097 dpm m–2 d–1, were several times higher than those observed in the non-SCTR regions (15°S – 24°S), 482 ± 189 dpm m–2 d–1. The range of 234Th flux in the study regions, except for Station 3 in 2018 (3191 ± 167 dpm m–2 d–1), was similar to that observed in the western Indian Ocean (88 to 2645 dpm m–2 d–1; Subha Anand et al., 2017; Subha Anand et al., 2018).
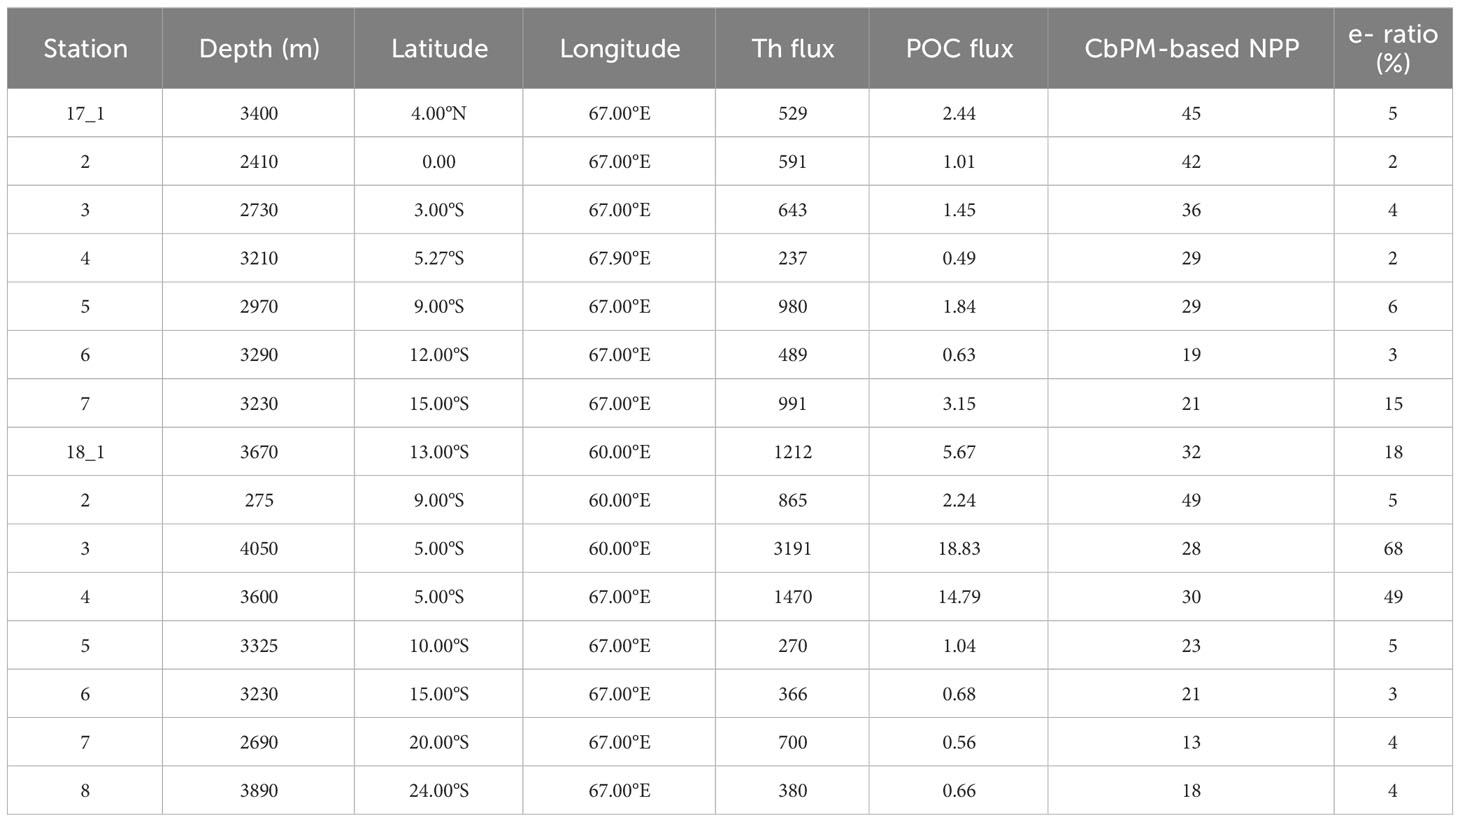
Table 1 Th flux (dpm m–2 d–1), POC flux (mmol C m–2 d–1), CbPM-based NPP (mmol m–2 d–1), and e-ratio for all stations in 2017 and 2018 cruises.
The POC flux through the 100 m layer was calculated by multiplying the ratio of POC to 234Thpart by 234Th flux. In 2017, the POC flux ranged from 0.49 to 3.15 mmol C m–2 d–1, with no evident differences between the SCTR and non-SCTR regions (Table 1). However, in 2018, POC flux increased significantly in the SCTR regions (1.1 – 18.8 mmol C m–2 d–1) compared with that in the non-SCTR regions (0.6 – 0.7 mmol C m–2 d–1). The measured POC fluxes in the study region, except at Stations 3 and 4 in 2018, fell within the typical values for equivalent regions (0.1 – 9.0 mmol C m–2 d–1; Subha Anand et al., 2017; Subha Anand et al., 2018). The POC export fluxes at Stations 3 and 4 in 2018 (> 15 mmol C m–2 d–1) were comparable to those in highly productive regions, such as the Equatorial Atlantic (15 ± 10 mmol C m–2 d–1; Thomalla et al., 2008) and the Arctic Atlantic (20 ± 10 mmol C m–2 d–1; Le Moigne et al., 2013). Based on the distributions of salinity and DIN at 5°S in 2018, a strong upwelling of cold water with high concentrations of nutrients was observed (Figures 2E, H) and could enhance the POC flux. Similarly, in the SCTR regions, high primary productivity was usually observed due to the upwelling process (Dilmahamod et al., 2016). However, this regional phenomenon showed high variations in the magnitude of upwelling in the subsurface layer of the SCTR regions, which depend on air-sea interactions. Therefore, our results imply that the impact of the upwelling process in the SCTR on the POC flux depends on its magnitude and should be cautioned to examine the POC flux in these regions.
3.4 Export efficiency of the BCP
The efficiency of BCP in the surface layer can be examined by the e-ratio (%), which represents the POC export flux divided by the net primary production (NPP). The NPP at each station was estimated using a carbon-based productivity model (CbPM; Westberry et al., 2008) based on Moderate Resolution Imaging Spectroradiometer satellite data provided by Oregon State University Ocean Productivity (http://www.science.oregonstate.edu/ocean.productivity/). Compared to earlier Chl-based models, the CbPM can provide more accurate NPP values since it includes information on the influence of biological and physiological states (Behrenfeld et al., 2005; Westberry et al., 2008). NPP in 2017 and 2018 ranged from 21 to 45 mmol C m–2 d–1 and from 13 to 49 mmol C m–2 d–1, respectively (Table 1). In both years, higher NPP values were observed with increasing latitude; however, there was no significant difference in the orders of NPP. The e-ratios in 2017 and 2018 were 2% – 15% and 3% – 68%, respectively (Table 1, Figure 4). The range of e-ratio was similar to that observed in the Indian Ocean (0.3 – 32.4%; Subha Anand et al., 2017; Subha Anand et al., 2018), except in Stations 3 and 4 in 2018. Generally, the e-ratio in the open ocean under non-bloom conditions was below 10% (Buesseler & Boyd, 2009; Black et al., 2018). However, under bloom conditions, the e-ratio could reach 50%, owing to the extensive scavenging of 234Th by organic particles (Buesseler et al., 1992). For Stations 3 and 4 in 2018, the high Th and POC fluxes suggested efficient scavenging in the SCTR regions, mainly due to the production of large particles in 2018. High primary production by smaller size of plankton such as picoplankton contributes less POC flux from the surface to the deeper layer due to their smaller size, slow sinking, and fast consumption in the microbial loop. Whereas larger size micro (diatoms) and nanophytoplankton contribute more POC flux to the upper layer of the ocean than to primary production (Richardson and Jackson, 2007). A positive Chl-a anomaly, especially for the winter season (June – August), was observed in 2018 based on the multi-sensor ocean-color Chl-a products (Ma et al., 2022), indicating the vigorous PP in the study area. Additionally, 234Thpart concentrations were lower in SCTR regions than those observed in non-SCTR regions, indicating an increase in Th ligands in solution or the production by the plankton communities with larger size (Buesseler et al., 2006). Thus, the relatively high export flux of POC observed in the SCTR regions in 2018 (> 45%), coupled with the relatively high NPP values and DIN concentrations, could be due to the production of fresh organic particles by PP in the surface layer. Therefore, our results suggest that the nutrient input through upwelling in the SCTR regions can enhance POC flux with efficient export comparable to bloom conditions. Our results implied that these persistent physical phenomena play a significant role in estimating the efficiency of carbon sequestration in the global oceans. However, because various conditions, such as light, biomass, and nutrients, are also important for POC flux in the surface layer, caution should be exercised in interpreting POC flux, and further consistent observations with high resolution are necessary.

Figure 4 Plot showing the association between net primary production (NPP) and POC flux. The data for comparison are from Buesseler and Boyd (2009); Black et al. (2018), and Subha Anand et al. (2017, Subha Anand et al., 2018). Dash lines indicate export efficiencies of 10%, 30%, 50%, and 80%.
4 Summary and conclusions
In this study, we examined the POC export flux using 238U/234Th disequilibria method in July 2017 and April 2018 in the western Indian Ocean along 60°E and 67°E transects. In 2017, the POC export flux did not differ significantly between the SCTR and non-SCTR regions. However, in 2018, the SCTR regions showed an efficient POC export, characterized by high 234Th deficiencies and elevated POC concentrations. Furthermore, the e-ratios in the SCTR regions were comparable to those observed during the algal blooms (i.e., diatoms). These results suggested extensive scavenging of 234Th with newly formed organic particles by primary production because replete nutrients were provided through upwelling in the SCTR regions. Therefore, this persistent regional physical process plays a significant role in determining the efficiency of carbon sequestration in the global oceans. However, owing to various conditions (i.e., light, biomass, and nutrients) that influence POC fluxes in the surface layer, continuous high-resolution surveys in the future are necessary.
Data availability statement
The datasets presented in this study can be found in online repositories. The names of the repository/repositories and accession number(s) can be found below:DOI: 10.17632/gptnxfmdtc.1.
Author contributions
JS: Data curation, Validation, Visualization, Writing – original draft. IK: Conceptualization, Data curation, Formal Analysis, Investigation, Methodology, Validation, Visualization, Writing – review & editing. DK: Funding acquisition, Writing – review & editing. HL: Data curation, Formal Analysis, Investigation, Methodology, Writing – review & editing. JC: Data curation, Formal Analysis, Methodology, Writing – review & editing. KR: Data curation, Formal Analysis, Methodology, Writing – review & editing. TR: Data curation, Formal Analysis, Investigation, Methodology, Writing – review & editing. KP: Data curation, Methodology, Formal Analysis, Writing – review & editing. SK: Conceptualization, Formal Analysis, Investigation, Methodology, Visualization, Writing – original draft, Writing – review & editing.
Acknowledgments
We thank the captain and crew of the R/V ISABU for their support with the onboard work. This research was a part of the project titled ‘KIOS(Korea Indian Ocean Study): Korea-US Joint Observation Study of the Indian Ocean, funded by the Korean Ministry of Oceans and Fisheries (20220548, PM63470).
Conflict of interest
The authors declare that the research was conducted in the absence of any commercial or financial relationships that could be construed as a potential conflict of interest.
Publisher’s note
All claims expressed in this article are solely those of the authors and do not necessarily represent those of their affiliated organizations, or those of the publisher, the editors and the reviewers. Any product that may be evaluated in this article, or claim that may be made by its manufacturer, is not guaranteed or endorsed by the publisher.
Supplementary material
The Supplementary Material for this article can be found online at: https://www.frontiersin.org/articles/10.3389/fmars.2023.1288422/full#supplementary-material
References
Bacon M. P., Cochran J. K., Hirschberg D., Hammar T. R., Fleer A. P. (1996). Export flux of carbon at the equator during the EqPac time-series cruises estimated from 234Th measurements. Deep Sea Res. Part II Top. Stud. Oceanogr. 43, 1133–1153. doi: 10.1016/0967-0645(96)00016-1
Baker E. T., Milburn H. B., Tennant D. A. (1988). Field assessment of sediment trap efficiency under varying flow conditions. J. Mar. Res. 46, 573–592. doi: 10.1357/002224088785113522
Baquero-Bernal A., Latif M., Legutke S. (2002). On dipolelike variability of sea surface temperature in the tropical Indian ocean. J. Clim. 15, 1358–1368. doi: 10.1175/1520-0442(2002)015<1358:ODVOSS>2.0.CO;2
Behrenfeld M. J., Boss E., Siegel D. A., Shea D. M. (2005). Carbon-based ocean productivity and phytoplankton physiology from space. Global Biogeochem. Cycles 19, GB1006. doi: 10.1029/2004GB002299
Bhat S. G., Krishnaswamy S., Lal D., Moore W. S. (1968). 234Th/238U ratios in the ocean. Earth Planet. Sci. Lett. 5, 483–491. doi: 10.1016/S0012-821X(68)80083-4
Black E. E., Buesseler K. O., Pike S. M., Lam P. J. (2018). 234Th as a tracer of particulate export and remineralization in the southeastern tropical Pacific. Mar. Chem. 201, 35–50. doi: 10.1016/j.marchem.2017.06.009
Boyd P. W., Claustre H., Levy M., Siegel D. A., Weber T. (2019). Multi-faceted particle pumps drive carbon sequestration in the ocean. Nature 568, 327–335. doi: 10.1038/s41586-019-1098-2
Buesseler K. O., Antia A. N., Chen M., Fowler S. W., Gardner W. D., Gustafsson O., et al. (2007). An assessment of the use of sediment traps for estimating upper ocean particle fluxes. J. Mar. Res. 65, 345–416. doi: 10.1357/002224007781567621
Buesseler K. O., Bacon M. P., Cochran J. K., Livingston H. D. (1992). Carbon and nitrogen export during the JGOFS North Atlantic Bloom Experiment estimated from 234Th:238U disequilibria. Deep Sea Res. Part A. Oceanogr. Res. Pap. 39, 1115–1137. doi: 10.1016/0198-0149(92)90060-7
Buesseler K. O., Benitez-Nelson C. R., Moran S. B., Burd A., Charette M., Cochran J. K., et al. (2006). An assessment of particulate organic carbon to thorium-234 ratios in the ocean and their impact on the application of 234Th as a POC flux proxy. Mar. Chem. 100, 213–233. doi: 10.1016/j.marchem.2005.10.013
Buesseler K. O., Boyd P. W. (2009). Shedding light on processes that control particle export and flux attenuation in the twilight zone of the open ocean. Limnol. Oceanogr. 54, 1210–1232. doi: 10.4319/lo.2009.54.4.1210
Buesseler K. O., Lampitt R. S. (2008). Introduction to “Understanding the Ocean’s biological pump: Results from VERTIGO.” Deep Sea Res. Part II Top. Stud. Oceanogr. 55, 1519–1521. doi: 10.1016/j.dsr2.2008.04.009
Cai P., Dai M., Lv D., Chen W. (2006). An improvement in the small-volume technique for determining thorium-234 in seawater. Mar. Chem. 100, 282–288. doi: 10.1016/j.marchem.2005.10.016
Ceballos-Romero E., Buesseler K. O., Villa-Alfageme M. (2022). Revisiting five decades of 234Th data: a comprehensive global oceanic compilation. Earth Syst. Sci. Data 14, 2639–2679. doi: 10.5194/essd-14-2639-2022
Cochran J. K., Masqué P. (2003). Short-lived U/Th series radionuclides in the ocean: tracers for scavenging rates, export fluxes and particle dynamics. Rev. Mineral. geochemistry 52, 461–492. doi: 10.2113/0520461
Dilmahamod A. F., Hermes J. C., Reason C. J. C. (2016). Chlorophyll-a variability in the Seychelles–Chagos Thermocline Ridge: Analysis of a coupled biophysical model. J. Mar. Syst. 154, 220–232. doi: 10.1016/j.jmarsys.2015.10.011
Djogić R., Sipos L., Branica M. (1986). Characterization of uranium (VI) in seawater 1. Limnol. Oceanogr. 31, 1122–1131. doi: 10.4319/lo.1986.31.5.1122
Dunne J. P., Sarmiento J. L., Gnanadesikan A. (2007). A synthesis of global particle export from the surface ocean and cycling through the ocean interior and on the seafloor. Global Biogeochem. Cycles 21, GB4006. doi: 10.1029/2006GB002907
Engel A., Wagner H., Le Moigne F. A. C., Wilson S. T. (2017). Particle export fluxes to the oxygen minimum zone of the eastern tropical North Atlantic. Biogeosciences 14, 1825–1838. doi: 10.5194/bg-14-1825-2017
Falkowski P. G., Barber R. T., Smetacek V. (1998). Biogeochemical controls and feedbacks on ocean primary production. Science 80- ). 281, 200–206. doi: 10.1126/science.281.5374.200
Friedrich J., van der Loeff M. M. R. (2002). A two-tracer (210Po–234Th) approach to distinguish organic carbon and biogenic silica export flux in the Antarctic Circumpolar Current. Deep Sea Res. Part I Oceanogr. Res. Pap. 49, 101–120. doi: 10.1016/S0967-0637(01)00045-0
George J. V., Nuncio M., Anilkumar N., Chacko R., Rajashekhar D. (2018). Seasonal surface chlorophyll a variability in the Seychelles–Chagos thermocline ridge. Curr. Sci. 114 (4), 868–878. doi: 10.18520/cs/v114/i04/868-878
Group S. W (2007). GEOTRACES–An international study of the global marine biogeochemical cycles of trace elements and their isotopes. Geochemistry 67, 85–131. doi: 10.1016/j.chemer.2007.02.001
Henson S. A., Sanders R., Madsen E. (2012). Global patterns in efficiency of particulate organic carbon export and transfer to the deep ocean. Global Biogeochem. Cycles 26, GB1028. doi: 10.1029/2011GB004099
Henson S. A., Sanders R., Madsen E., Morris P. J., Le Moigne F., Quartly G. D. (2011). A reduced estimate of the strength of the ocean’s biological carbon pump. Geophys. Res. Lett. 38, L04606. doi: 10.1029/2011GL046735
Honjo S. (1978). Sedimentation of materials in the Sargasso Sea at a 5,367 m deep station. Journal of Marine Research 36, 469-492.
Honjo S., Manganini S. J., Krishfield R. A., Francois R. (2008). Particulate organic carbon fluxes to the ocean interior and factors controlling the biological pump: A synthesis of global sediment trap programs since 1983. Prog. Oceanogr. 76, 217–285. doi: 10.1016/j.pocean.2007.11.003
Hung C.-C., Gong G.-C., Chou W.-C., Chung C.-C., Lee M.-A., Chang Y., et al. (2010). The effect of typhoon on particulate organic carbon flux in the southern East China Sea. Biogeosciences 7, 3007–3018. doi: 10.5194/bg-7-3007-2010
Karnan C., Gautham S. (2023). Seasonal enhancement of phytoplankton biomass in the southern tropical Indian Ocean: Significance of meteorological and oceanography parameters. Oceanologia. doi: 10.1016/j.oceano.2023.10.003
Kim H. J., Hyeong K., Yoo C. M., Khim B. K., Kim K. H., Son J. W., et al. (2012). Impact of strong El Niño event, (1997/98 and 2009/10) on sinking particle fluxes in the 10 N thermocline ridge area of the northeastern equatorial Pacific. Deep Sea Res. Part I Oceanogr. Res. Pap. 67, 111–120. doi: 10.1016/j.dsr.2012.05.008
Kim M., Kang J.-H., Rho T., Kang H.-W., Kang D.-J., Park J.-H., et al. (2022). Mesozooplankton community variability in the Seychelles–Chagos Thermocline Ridge in the western Indian Ocean. J. Mar. Syst. 225, 103649. doi: 10.1016/j.jmarsys.2021.103649
Klein S. A., Soden B. J., Lau N.-C. (1999). Remote sea surface temperature variations during ENSO: Evidence for a tropical atmospheric bridge. J. Clim. 12, 917–932. doi: 10.1175/1520-0442(1999)012<0917:RSSTVD>2.0.CO;2
Knap A. H., Michaels A., Close A. R., Ducklow H., Dickson A. G. (1996). Protocols for the joint global ocean flux study (JGOFS) core measurements. JGOFS Repr. IOC Manuals Guid. No. 29 UNESCO 1994, 19. Available at: http://epic.awi.de/17559/1/Kna1996a.pdf
Lampitt R. S., Boorman B., Brown L., Lucas M., Salter I., Sanders R., et al. (2008). Particle export from the euphotic zone: Estimates using a novel drifting sediment trap, 234Th and new production. Deep Sea Res. Part I Oceanogr. Res. Pap. 55, 1484–1502. doi: 10.1016/j.dsr.2008.07.002
Laws E. A., D’Sa E., Naik P. (2011). Simple equations to estimate ratios of new or export production to total production from satellite-derived estimates of sea surface temperature and primary production. Limnol. Oceanogr. Methods 9, 593–601. doi: 10.4319/lom.2011.9.593
Lee E., Kim C., Na H. (2022). Suppressed upwelling events in the Seychelles–chagos thermocline ridge of the southwestern tropical Indian ocean. Ocean Sci. J. 57, 305–313. doi: 10.1007/s12601-022-00075-x
Le Moigne F. A. C., Henson S. A., Sanders R. J., Madsen E. (2013). Global database of surface ocean particulate organic carbon export fluxes diagnosed from the 234 Th technique. Earth Syst. Sci. Data 5, 295–304. doi: 10.5194/essd-5-295-2013
Lévy M., Shankar D., André J., Shenoi S. S. C., Durand F., de Boyer Montégut C. (2007). Basin-wide seasonal evolution of the Indian Ocean’s phytoplankton blooms. J. Geophys. Res. Ocean. 112 (C12). doi: 10.1029/2007JC004090
Liao X., Du Y., Zhan H., Shi P., Wang J. (2014). Summertime phytoplankton blooms and surface cooling in the western south equatorial Indian Ocean. J. Geophys. Res. Ocean. 119, 7687–7704. doi: 10.1002/2014JC010195
Ma X., Chen G., Li Y., Zeng L. (2022). Interannual variability of sea surface chlorophyll a in the southern tropical Indian Ocean: Local versus remote forcing. Deep Sea Res. Part I Oceanogr. Res. Pap. 190, 103914. doi: 10.1016/j.dsr.2022.103914
Masumoto Y., Meyers G. (1998). Forced Rossby waves in the southern tropical Indian Ocean. J. Geophys. Res. Ocean. 103, 27589–27602. doi: 10.1029/98JC02546
McCreary J. P., Kundu P. K., Molinari R. L. (1993). A numerical investigation of dynamics, thermodynamics and mixed-layer processes in the Indian Ocean. Prog. Oceanogr. 31, 181–244. doi: 10.1016/0079-6611(93)90002-U
McPhaden M. J., Meyers G., Ando K., Masumoto Y., Murty V. S. N., Ravichandran M., et al. (2009). RAMA: the research moored array for African–Asian–Australian monsoon analysis and prediction*. Bull. Am. Meteorol. Soc 90, 459–480. doi: 10.1175/2008BAMS2608.1
Murray J. W., Paul B., Dunne J. P., Chapin T. (2005). 234Th, 210Pb, 210Po and stable Pb in the central equatorial Pacific: Tracers for particle cycling. Deep Sea Res. Part I Oceanogr. Res. Pap. 52, 2109–2139. doi: 10.1016/j.dsr.2005.06.016
Owens S. A., Buesseler K. O., Lamborg C. H., Valdes J., Lomas M. W., Johnson R. J., et al. (2013). A new time series of particle export from neutrally buoyant sediments traps at the Bermuda Atlantic Time-series Study site. Deep Sea Res. Part I Oceanogr. Res. Pap. 72, 34–47. doi: 10.1016/j.dsr.2012.10.011
Owens S. A., Buesseler K. O., Sims K. W. W. (2011). Re-evaluating the 238U-salinity relationship in seawater: Implications for the 238U–234Th disequilibrium method. Mar. Chem. 127, 31–39. doi: 10.1016/j.marchem.2011.07.005
Owens S. A., Pike S., Buesseler K. O. (2015). Thorium-234 as a tracer of particle dynamics and upper ocean export in the Atlantic Ocean. Deep Sea Res. Part II Top. Stud. Oceanogr. 116, 42–59. doi: 10.1016/j.dsr2.2014.11.010
Pike S. M., Buesseler K. O., Andrews J., Savoye N. (2005). Quantification of 234Th recovery in small volume seawater samples by inductively coupled plasma-mass spectrometry. J. Radioanal. Nucl. Chem. 263, 355–360. doi: 10.1007/s10967-005-0062-9
Pondaven P., Ragueneau O., Tréguer P., Hauvespre A., Dezileau L., Reyss J. L. (2000). Resolving the ‘opal paradox’in the southern ocean. Nature 405, 168–172. doi: 10.1038/35012046
Puigcorbé V., Masqué P., Le Moigne F. A. C. (2020). Global database of ratios of particulate organic carbon to thorium-234 in the ocean: improving estimates of the biological carbon pump. Earth Syst. Sci. Data 12, 1267–1285. doi: 10.5194/essd-12-1267-2020
Rao S. A., Behera S. K. (2005). Subsurface influence on SST in the tropical Indian Ocean: structure and interannual variability. Dyn. Atmos. Ocean. 39, 103–135. doi: 10.1016/j.dynatmoce.2004.10.014
Resplandy L., Vialard J., Lévy M., Aumont O., Dandonneau Y. (2009). Seasonal and intraseasonal biogeochemical variability in the thermocline ridge of the southern tropical Indian Ocean. J. Geophys. Res. Ocean. 114, C07024. doi: 10.1029/2008JC005246
Richardson T. L., Jackson G. A. (2007). Small phytoplankton and carbon export from the surface ocean. Science 315 (5813), 838–840. doi: 10.1126/science.1133471
Roca-Martí M., Puigcorbé V., Rutgers van der Loeff M. M., Katlein C., Fernández-Méndez M., Peeken I., et al. (2016). Carbon export fluxes and export efficiency in the central Arctic during the record sea-ice minimum in 2012: A joint 234Th/238U and 210Po/210Pb study. J. Geophys. Res. Ocean. 121, 5030–5049. doi: 10.1002/2016JC011816
Sabine C. L., Feely R. A., Gruber N., Key R. M., Lee K., Bullister J. L., et al. (2004). The oceanic sink for anthropogenic CO2. Science 80-. ). 305, 367–371. doi: 10.1126/science.1097403
Sanders R., Brown L., Henson S., Lucas M. (2005). New production in the Irminger Basin during 2002. J. Mar. Syst. 55, 291–310. doi: 10.1016/j.jmarsys.2004.09.002
Schott F. A., McCreary J. P. (2001). The monsoon circulation of the Indian Ocean. Prog. Oceanogr. 51, 1–123. doi: 10.1016/S0079-6611(01)00083-0
Schott F. A., Xie S.-P., McCreary J. P. (2009). Indian Ocean circulation and climate variability. Rev. Geophys 47, RG1002. doi: 10.1029/2007RG000245
Shih Y.-Y., Hung C.-C., Gong G.-C., Chung W.-C., Wang Y.-H., Lee I.-H., et al. (2015). Enhanced particulate organic carbon export at eddy edges in the oligotrophic Western North Pacific Ocean. PloS One 10, e0131538. doi: 10.1371/journal.pone.0131538
Sreeush M. G., Valsala V., Pentakota S., Prasad K. V. S. R., Murtugudde R. (2018). Biological production in the Indian Ocean upwelling zones–Part 1: refined estimation via the use of a variable compensation depth in ocean carbon models. Biogeosciences 15, 1895–1918. doi: 10.5194/bg-15-1895-2018
Sreeush M. G., Valsala V., Santanu H., Pentakota S., Prasad K., Naidu C., et al. (2020). Biological production in the Indian Ocean upwelling zones-Part 2: Data based estimates of variable compensation depth for ocean carbon models via cyclo-stationary Bayesian Inversion. Deep Sea Res. Part II Top. Stud. Oceanogr. 179, 104619. doi: 10.1016/j.dsr2.2019.07.007
Stewart G., Cochran J. K., Miquel J. C., Masqué P., Szlosek J., Baena A. M. R., et al. (2007). Comparing POC export from 234Th/238U and 210Po/210Pb disequilibria with estimates from sediment traps in the northwest Mediterranean. Deep Sea Res. Part I Oceanogr. Res. Pap. 54, 1549–1570. doi: 10.1016/j.dsr.2007.06.005
Subha Anand S., Rengarajan R., Sarma V. (2018). 234Th-based carbon export flux along the Indian GEOTRACES GI02 section in the Arabian Sea and the Indian Ocean. Global Biogeochem. Cycles 32, 417–436. doi: 10.1002/2017GB005847
Subha Anand S., Rengarajan R., Sarma V., Sudheer A. K., Bhushan R., Singh S. K. (2017). Spatial variability of upper ocean POC export in the Bay of Bengal and the Indian Ocean determined using particle-reactive 234Th. J. Geophys. Res. Ocean. 122, 3753–3770. doi: 10.1002/2016JC012639
Thomalla S. J., Poulton A. J., Sanders R., Turnewitsch R., Holligan P. M., Lucas M. I. (2008). Variable export fluxes and efficiencies for calcite, opal, and organic carbon in the Atlantic Ocean: A ballast effect in action? Global Biogeochem. Cycles 22, GB1010. doi: 10.1029/2007GB002982
Verdeny E., Masqué P., Garcia-Orellana J., Hanfland C., Cochran J. K., Stewart G. M. (2009). POC export from ocean surface waters by means of 234Th/238U and 210Po/210Pb disequilibria: A review of the use of two radiotracer pairs. Deep Sea Res. Part II Top. Stud. Oceanogr. 56, 1502–1518. doi: 10.1016/j.dsr2.2008.12.018
Vinayachandran P. N. M., Masumoto Y., Roberts M. J., Huggett J. A., Halo I., Chatterjee A., et al. (2021). Reviews and syntheses: Physical and biogeochemical processes associated with upwelling in the Indian Ocean. Biogeosciences 18, 5967–6029. doi: 10.5194/bg-18-5967-2021
Waples J. T., Benitez-Nelson C., Savoye N., van der Loeff M. R., Baskaran M., Gustafsson Ö. (2006). An introduction to the application and future use of 234Th in aquatic systems. Mar. Chem. 100, 166–189. doi: 10.1016/j.marchem.2005.10.011
Wei C.-L., Lin S.-Y., Sheu D.-D., Chou W.-C., Yi M.-C., Santschi P. H., et al. (2011). Particle-reactive radionuclides (234Th, 210Pb, 210Pb) as tracers for the estimation of export production in the South China Sea. Biogeosciences 8, 3793–3808. doi: 10.5194/bg-8-3793-2011
Westberry T., Behrenfeld M. J., Siegel D. A., Boss E. (2008). Carbon-based primary productivity modeling with vertically resolved photoacclimation. Global Biogeochem. Cycles 22, GB2024. doi: 10.1029/2007GB003078
Woodberry K. E., Luther M. E., O’Brien J. J. (1989). The wind-driven seasonal circulation in the southern tropical Indian Ocean. J. Geophys. Res. Ocean. 94, 17985–18002. doi: 10.1029/JC094iC12p17985
Keywords: POC export flux, Indian Ocean, SCTR, thorium-234, particulate organic carbon
Citation: Seo J, Kim I, Kang D-J, Lee H, Choi JY, Ra K, Rho T, Park K and Kim SH (2024) Particulate organic carbon export fluxes across the Seychelles-Chagos thermocline ridge in the western Indian Ocean using 234Th as a tracer. Front. Mar. Sci. 10:1288422. doi: 10.3389/fmars.2023.1288422
Received: 04 September 2023; Accepted: 18 December 2023;
Published: 08 January 2024.
Edited by:
Alex J. Poulton, Heriot-Watt University, United StatesReviewed by:
Keyhong Park, Korea Polar Research Institute, Republic of KoreaHaiyan Jin, Ministry of Natural Resources, China
Copyright © 2024 Seo, Kim, Kang, Lee, Choi, Ra, Rho, Park and Kim. This is an open-access article distributed under the terms of the Creative Commons Attribution License (CC BY). The use, distribution or reproduction in other forums is permitted, provided the original author(s) and the copyright owner(s) are credited and that the original publication in this journal is cited, in accordance with accepted academic practice. No use, distribution or reproduction is permitted which does not comply with these terms.
*Correspondence: Suk Hyun Kim, c2hraW1Aa2lvc3QuYWMua3I=