- 1Tanzania Fisheries Research Institute (TAFIRI), Dar es Salaam, Tanzania
- 2School of Aquatic Science and Fisheries Technology (SoAF), University of Dar es Salaam, Dar es Salaam, Tanzania
- 3The Nelson Mandela African Institution of Science and Technology (NM-AIST), School of Materials, Energy, Water and Environmental Sciences (MEWES), Arusha, Tanzania
- 4International Union for Conservation of Nature (IUCN), Dar es Salaam, Tanzania
- 5Western Indian Ocean Marine Science Association (WIOMSA), Zanzibar, Tanzania
Ocean acidification, deoxygenation, and warming are three interconnected global change challenges caused by increased anthropogenic carbon emissions. These issues present substantial threats to marine organisms, ecosystems, and the survival of coastal communities depending on these ecosystems. Coastal upwelling areas may experience significant declines in pH, dissolved oxygen (DO), and temperature levels during upwelling events, making marine organisms and ecosystems in these areas more susceptible to ocean acidification and deoxygenation. Understanding the dynamics of pH, DO, and temperature in coastal upwelling areas is essential for evaluating the susceptibility of resident organisms and ecosystems to lower pH and DO conditions occurring during upwelling events. To accomplish this, we used the pH and the DO loggers to measure high-frequency data for pH and DO, respectively, over six months in the open ocean and for a 24-hour cycle within the mangrove, seagrass, and coral reef ecosystems of the Tanga-Pemba Seascape (T-PS) during the northeast monsoon season. Our findings revealed the occurrence of multiple upwelling events, with varying durations, that result in significant declines in pH, DO, and temperature within the seascape. This is the first study to confirm the occurrence of multiple upwelling events in the T-PS. Moreover, the study has revealed a pH threshold value of 7.43 for ocean acidification in the T-PS. This is the first study to report a threshold value for ocean acidification in coastal upwelling areas of the Western Indian Ocean (WIO). Furthermore, it revealed that the extremely low levels of pH that occurred during upwelling events were above the pH threshold value of 7.43 for ocean acidification, while the extremely low levels of DO fell below the oxygen threshold value of 4.6 mg/L for deoxygenation. During upwelling events, seagrass and coral reef ecosystems, but not mangrove ecosystems, demonstrated elevated mean hourly values of pH and DO compared to those of the open ocean. These findings show that marine organisms and ecosystems in the T-PS are frequently exposed to lower pH and DO conditions due multiple upwelling events. However, their susceptibility to these conditions is reduced to some extent by the presence of seagrass meadows within these interconnected systems.
1 Introduction
Ocean acidification, deoxygenation, and warming are three interconnected global change challenges primarily caused by increased anthropogenic carbon emissions (Keeling et al., 2010; Orr, 2011; Laffoley and Baxter, 2016; Yoro and Daramola, 2020). These challenges, either alone or in combination, pose great threats to marine organisms and coastal ecosystems, jeopardizing the survival of coastal communities depending on these ecosystems (Doney et al., 2020; Talukder et al., 2022; Vinayachandran et al., 2022). Ocean acidification occurs when the ocean absorbs excess carbon dioxide (CO2) from the atmosphere, leading to an increase in the acidity (or reduced pH) of the seawater and changes in seawater carbonate chemistry (Doney et al., 2009; Feely et al., 2009). The increased acidity lowers the availability of carbonate mineral saturation states in seawater, a condition that reduces the ability of marine calcifying organisms to form and maintain their shells and skeletons made of calcium carbonate (CaCO3), leading to fatalities or reduced reproduction rates (Doney et al., 2020; Figuerola et al., 2021). Ocean warming, characterized by rising sea surface temperatures due to the absorption of atmospheric heat by the oceans, causes disruptions in marine life, including changes in migration patterns, spawning times, and food availability (Keeling et al., 2010; Kroeker et al., 2013; Laffoley and Baxter, 2016). Deoxygenation, the decline in seawater oxygen levels, is caused by ocean warming, which reduces the ocean’s capacity to hold DO (Keeling et al., 2010; Limburg et al., 2020). Furthermore, high nutrients in seawater, mostly from agriculture, sewage, and upwelling, lead to excessive growth of phytoplankton that results to algal blooms (Kyewalyanga et al., 2020). When algal blooms die and disintegrate, they absorb oxygen, resulting in deoxygenation in coastal and shelf areas, as well as semi-enclosed seas (Limburg et al., 2020). When DO levels fall below 4.6 ml/L in seawater, it causes stress in most marine organisms (Kroeker et al., 2023).
Coastal upwelling areas are regions where deep, cold, nutrient- and carbon-rich water from the ocean’s depths rises to the surface during upwelling events (Smith, 1992). As a result, they are highly productive and experience significant decreases in pH, DO, and temperature levels during upwelling events (Rixen et al., 2012; Schulz et al., 2019; Kroeker et al., 2023). Furthermore, the declines in pH and DO during upwelling events can exceed thresholds for pH and oxygen assumed to be detrimental to marine organisms (Lutier et al., 2022; Cornwall et al., 2023; Kroeker et al., 2023). These conditions place resident marine organisms and coastal ecosystems at a high risk of future ocean acidification and deoxygenation (Cornwall et al., 2023; Kroeker et al., 2023). Although the extensive impacts of upwelling events on pH, DO, and temperature dynamics are well-documented globally (Rixen et al., 2012; Schulz et al., 2019; Kroeker et al., 2023), this information is largely unknown in coastal upwelling areas of the Western Indian Ocean (WIO), particularly in the Tanga-Pemba Seascape (T-PS), known to experience upwelling during the northeast monsoon season (Halo et al., 2020; Kyewalyanga et al., 2020). This information is crucial for informing the future of global change biology in the WIO. Moreover, the frequency and duration (the number of days of the given upwelling event) of upwelling events remain unknown in the T-PS. This knowledge gap poses a challenge in assessing the seascape’s susceptibility to upwelling-enhanced ocean acidification and deoxygenation, as well as its implications for current mariculture practices within the seascape.
Coastal ecosystems such as mangroves, seagrass meadows, and coral reefs, prevalent in the T-PS, experience significant variations of seawater pH, DO, and temperature over a 24-hour cycle, a result of the interplay of various factors beyond upwelling (Saderne et al., 2015; George et al., 2018; George and Lugendo, 2022). Photosynthesis and respiration represent fundamental metabolic processes that govern the productivity of a particular coastal ecosystem (Rasmusson et al., 2019; Rasmusson et al., 2020). Photosynthesis involves the uptake of CO2 and the production of oxygen (O2), leading to increases in pH and DO in seawater (Semesi et al., 2009b). Conversely, respiration involves the consumption of O2 and the production of CO2, resulting in reductions in pH and DO in seawater (Pedersen et al., 2013; Pedersen et al., 2016). The balance between these metabolic processes can affect the levels of pH and DO in the seawater of mangroves, seagrass meadows, and coral reefs (Semesi et al., 2009a). Inorganic metabolism, like the calcification of marine calcifiers, also has an influence on pH levels in mangroves, seagrass meadows, and coral reefs (Hendriks et al., 2014; Morrell, 2018; Van Dam et al., 2021). The inflow of freshwater during low tides affects seawater pH in mangroves by increasing CO2, subsequently affecting pH in seagrass meadows and coral reefs. Tides have also been demonstrated to influence the impacts of key physiological processes and calcification on the pH and DO levels of coastal ecosystems (George and Lugendo, 2022). However, it remains unclear whether coastal ecosystems, especially those situated in coastal upwelling areas, are susceptible to lower pH and DO conditions brought by upwelling events or if their habitats offer some degree of mitigation under such events (Rixen et al., 2012; Lachkar, 2014; Schulz et al., 2019; Kroeker et al., 2023). The lack of this knowledge prevents the implementation of suitable measures to address the impact of upwelling-enhanced ocean acidification and deoxygenation on resident organisms and the existing mariculture practices in the seascape (WIOMSA, 2022).
The application of high-frequency data allows for the capture of upwelling-driven dynamics in pH, DO, and temperature within the open ocean over a sampling period and within a 24-hour cycle (Kroeker et al., 2023). It also facilitates the comparison of the 24-hour cycle mean hourly values of these variables in mangrove, seagrass meadow, and coral reef ecosystems to those of the open ocean (Hofmann et al., 2011), providing a more intricate evaluation of the susceptibility and potential for mitigation of these ecosystems to the lower pH and DO conditions induced by upwelling events. Previous studies into the temporal dynamics of pH, DO, and temperature in the WIO relied on discrete measurements (Boodhoo et al., 2022; Edworthy et al., 2022; George and Lugendo, 2022), which failed to capture declines in these variables driven by upwelling. As a result, it was impossible to understand the susceptibility of mangrove, seagrass and coral reef ecosystems to lower pH and DO levels during upwelling events or determine if some of them provide any degree of mitigation under such events.
The objective of this study was twofold. Firstly, to understand high-frequency dynamics in pH, DO, and temperature in the open ocean of the T-PS during the northeast monsoon, when upwelling events are thought to occur (Halo et al., 2020; Kyewalyanga et al., 2020), as well as the 24-hour high-frequency dynamics of these variables in mangrove, seagrass, and coral reef ecosystems within the seascape. Secondly, to understand the susceptibility of mangrove, seagrass, and coral reef ecosystems to lower pH and DO conditions induced by upwelling events and whether some of these ecosystems offer any degree of mitigation under such events. We tested three hypotheses. First, the T-PS experiences multiple upwelling events, each with varying durations, that result in significant declines in pH, DO, and temperature within the seascape, thereby subjecting resident organisms and coastal ecosystems to multiple exposures of lower pH and DO conditions. Second, the reduced levels of pH and DO common during upwelling events are lower than thresholds for these variables assumed to be detrimental to marine organisms (Cornwall et al., 2023), rendering resident marine organisms in mangrove, seagrass, and coral reef ecosystems susceptible to upwelling-enhanced ocean acidification and deoxygenation. Third, mangrove, seagrass, and coral reef ecosystems would demonstrate higher mean hourly values of pH, DO, and temperature than those in the open ocean during upwelling events, thereby providing some degree of mitigation to lower pH and DO conditions in interconnected coastal ecosystems under these events.
2 Materials and methods
2.1 Study area
The study was conducted in both the coastal waters of Moa and Wete and the open ocean within the Tanga-Pemba Seascape (T-PS) (Figure 1). Moa and Wete sites are marked by the presence of mangrove, seagrass, and coral reef ecosystems. This connectivity of coastal ecosystems enables the comparison of environmental variables between these ecosystems and those in the open ocean for understanding the susceptibility of these ecosystems to lower pH and DO levels during upwelling events or assessing if some of these ecosystems provide any degree of mitigation under such events. The climate in the T-PS is tropical, with two distinct monsoon seasons: the northeast monsoon season and the southeast monsoon season, characterized by the reversal of trade winds (Semba et al., 2019). The northeast monsoon season often occurs from October to March and is characterized by prevailing northeasterly trade winds (Mahongo et al., 2011). During this season, the T-PS experiences warm water, gentle wind speeds, and relatively low surface current speeds (Semba et al., 2019). The southeast monsoon season, on the other hand, often occurs from March to September. During this season, the direction of trade winds in the T-PS is reversed from northeasterly to southeasterly, with strong winds blowing from the southeast. This makes the T-PS to experiences cooler water and relatively high surface current speeds (Semba et al., 2019). Furthermore, the study areas undergo tidal movement, following a semidiurnal pattern characterized by two high and two low tides, each approximately six hours apart within a 24-hour cycle (Mahongo, 2014). This pattern influences the variation of environmental variables, including pH, DO, and temperature, within mangrove, seagrass, and coral reef ecosystems (George et al., 2018; George and Lugendo, 2022).
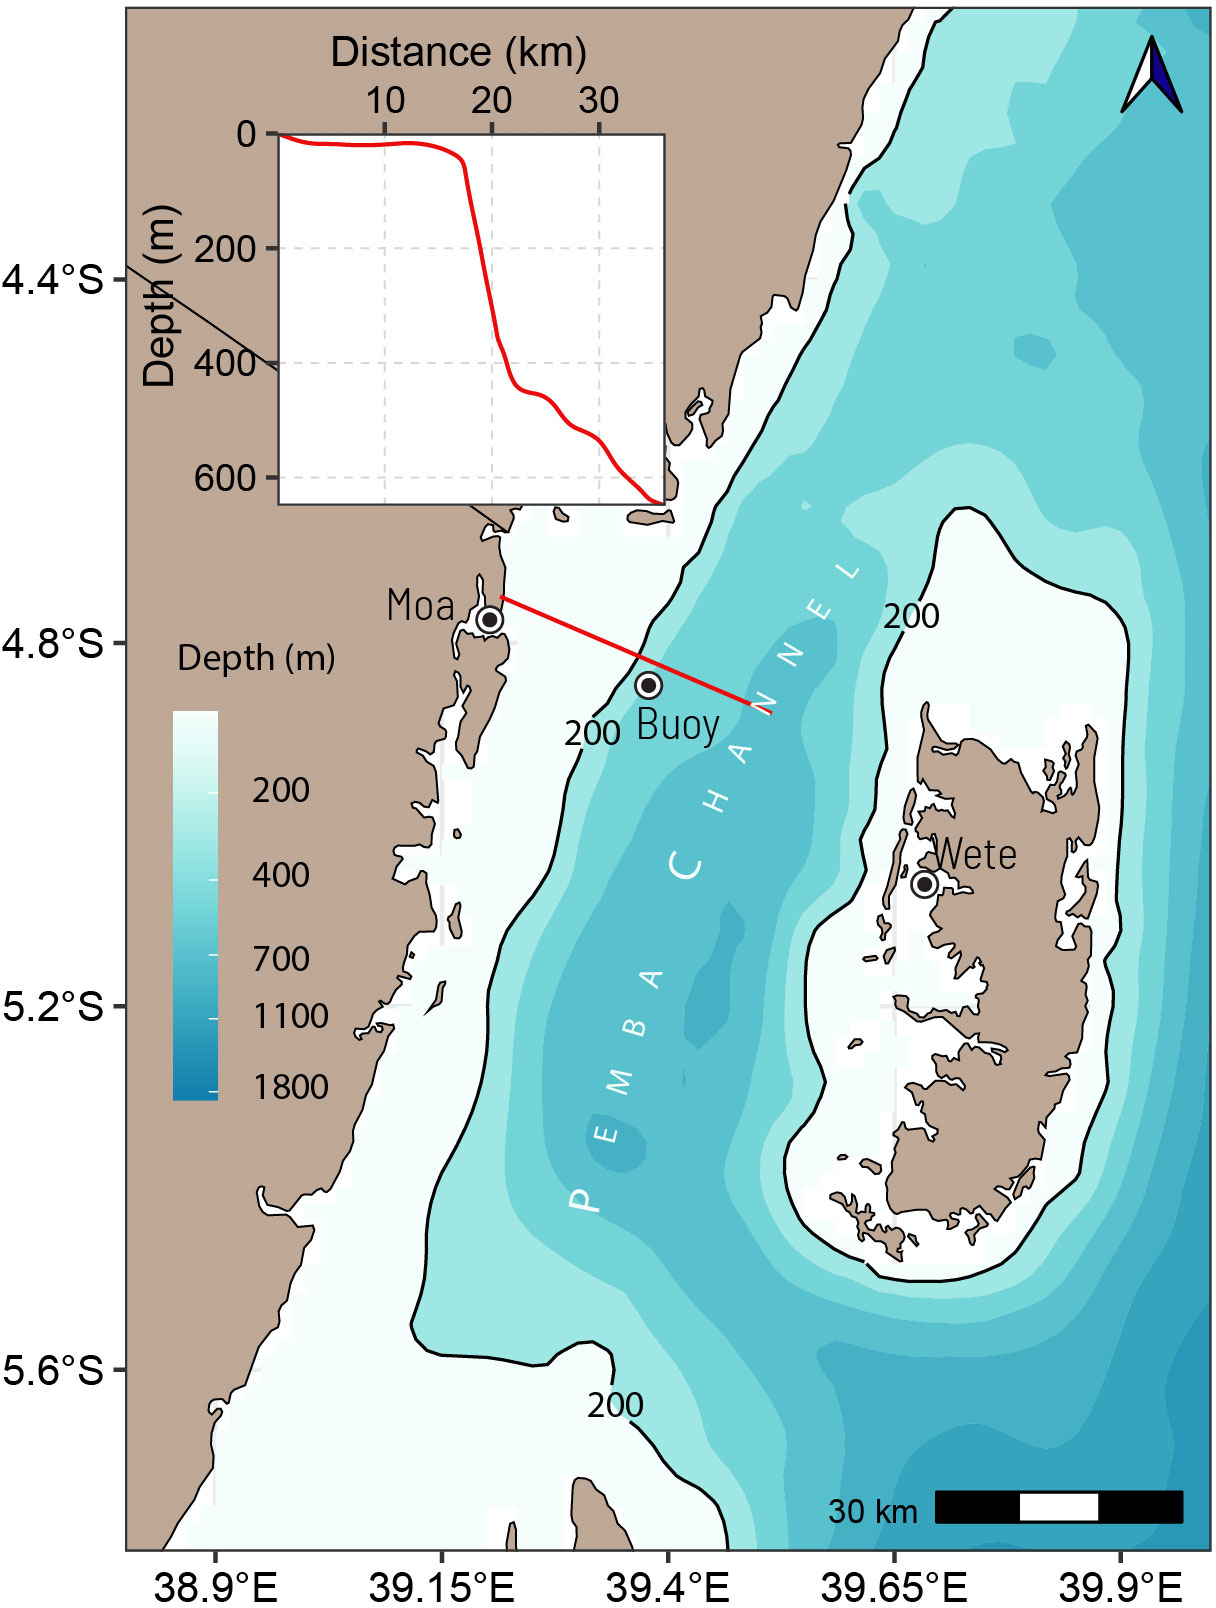
Figure 1 Map of the Tanga-Pemba Seascape, with white dots overlaid with black dots representing sampling sites. The solid red line is the transect for the topographic nature of the seascape shown in the inset plot.
2.2 Sampling design and instruments
Loggers designed for measuring high-frequency data for pH (HOBO pH and Temperature Data Logger MX2501), and DO (HOBO Dissolved Oxygen Logger (U26-001)) were configured to measure these variables at 5-minute intervals in coastal ecosystems (mangroves, seagrass meadows, and coral reefs) over a 24-hour cycle and at 30-minute intervals in the open ocean for six consecutive months. The 30-minute measurement frequency for the open ocean was thoughtfully chosen to optimize the lifespan of the loggers’ batteries while guaranteeing a reliable representation of data throughout the day. Both pH and DO loggers also measured temperature.
In coastal ecosystems, these loggers were inserted into protective pipes, affixed to a wooden stick, and anchored to the seafloor within a specific coastal ecosystem during a low spring tide. The loggers were placed 40 cm above the seafloor on a wooden stick to measure the pH and DO of the water column. The wooden stick with loggers was finally tagged with a buoy that was attached to it using rope for quick identification during device retrieval. After 24 hours, the loggers were collected, and the data was retrieved before being dispersed in the following ecosystem. Due to the limited number of loggers available, measurements were conducted sequentially in different ecosystems during the same spring tide by relocating loggers every 24 hours until the data collection activity was completed. The weather conditions remained consistent across the experimental spring tide, devoid of any extreme weather events. This consistency allows for comparability between the measurements conducted independently across different ecosystems while still encompassing the inherent variability in factors like light and temperature (George et al., 2018).
Within the open ocean of the waters off Moa, data collection was facilitated using an oceanographic buoy (Figure 1). Similar to the loggers utilized in coastal ecosystems, pH and DO loggers were securely affixed to the buoy, positioned at a depth of 10 meters below the surface to maintain continuous monitoring of surface water pH, DO, and temperature. The loggers recorded pH, DO, and temperature data throughout the northeast monsoon season, spanning from October 2022 to March 2023, when upwelling is thought to occur in the T-PS (Halo et al., 2020; Kyewalyanga et al., 2020).
2.3 Measurement of pH, DO, and temperature
The HOBO pH and Temperature Data Logger MX2501 and HOBO Dissolved Oxygen Logger (U26-001) were used to measure pH, temperature, and DO for the open ocean and within mangrove, seagrass, and coral reef ecosystems. The pH device was calibrated with a HANNA buffer before configuration and deployment to a specific coastal ecosystem. Following the retrieval of the device, the pH and temperature data from the HOBO pH and Temperature Data Logger MX2501 were downloaded into an Android phone utilizing the HOBO Connect a mobile-phone application available on the Google Play store and App Store that supports Bluetooth connectivity for seamless data transfer. Moreover, DO data from the HOBO Dissolved Oxygen Logger (U26-001) was retrieved by using HOBO Optic USB Base Station connected to HOBOware, a computer software.
2.4 Determination of pH and DO threshold values
To determine the ocean acidification threshold, which signifies the point of pH reduction where average saturation states reach one and dissolution initiates, multiple simulations were carried out utilizing the seacarb package in R. Conservative values for salinity (35), temperature (25 °C), and total alkalinity (2000-2300 mol/kg) obtained from the Western Indian Ocean (WIO) were utilized (Madkaiker et al., 2023). The seacarb package’s carb function was employed to calculate the solubility product of aragonite in units of mol/kg at various pH levels. Furthermore, the pH function within the seacarb package was employed to calculate the potentiometric pH on the total scale (in mol/kg). Through these calculations, the pH value closest to the aragonite saturation state value of one was determined as the threshold value for ocean acidification. Based on the available literature, a specific DO threshold value of 4.6 mg/L was selected for deoxygenation, as this is the level at which the first noticeable biological effects become apparent (Vaquer-Sunyer and Duarte, 2008; Cornwall et al., 2023; Kroeker et al., 2023).
2.5 Data processing and analysis
To assess the high-frequency dynamics of pH, DO, and temperature in the open ocean, we derived hourly information for the measured pH, DO, and temperature at 30-minute intervals from the date variable. The time variable was then used to average pH, DO, and temperature into hourly interval for the period of data collection. The time series data was used to plot a Hovmöller diagram, which visually showed the dynamics of pH, DO, and temperature over the sampling period and within a 24-hour cycle. The presentation of time series data in a time-series diagram allowed the identification of specific periods characterized by noticeable sharp declines in pH, DO, and temperature—which were used as proxy for upwelling events—and ascertaining their duration in the T-PS (Tapia et al., 2009; Schulz et al., 2019; Kroeker et al., 2023). To compare the dynamics of pH, DO, and temperature in mangrove, seagrass, and coral reef ecosystems over a 24-hour cycle, 5-minute data records were normalized to hourly interval, which was then used to compute the mean hourly values of pH, DO, and temperature and a non-parametric Wilcoxon signed-rank test was used to examine whether the levels of pH, DO, and temperature in mangrove, seagrass, and coral reef ecosystems were higher than in the open ocean, where upwelling events were identified. This test is employed when the data lacks a normal distribution or when the sample size is insufficient for reliance on parametric tests such as the t-test (Woolson, 2007). To minimize the influence of environmental variations, the pH, DO, and temperature records of third upwelling events that match the sampling dates in mangrove, seagrass, and coral reefs were used. The R programming language, version R 4.3.1, was used for processing, analyzing, visualizing the high-frequency data, and plotting (Mount and Zumel, 2019).
3 Results
3.1 Dynamics of pH, DO, and temperature in the open ocean and the occurrence and duration of upwelling events
Hovmöller diagrams (Figure 2) indicate the high-frequency dynamics of pH, DO, and temperature over the sampling time and a 24-hour cycle in the open ocean of the T-PS. These diagrams cover a six-month period, from October 2022 to March 2023. It is worth noting that these diagrams also feature clear signals that correspond to the occurrence of upwelling events with varying durations in the seascape that were confirmed in time series diagrams (Figure 3). The first upwelling event occurred in December, and it lasted for 12 days, followed by a second event in February, which lasted for 12 days, and finally, a third event in March, which lasted for 7 days. The time interval between the first and second events was 40 days, while the interval between the second and third events was 24 days. The period of upwelling events was characterized by significant declines in pH, DO, and temperature (Figure 3). Following the first upwelling event, there was a noticeable decline in DO levels in the non-upwelling days that occurred a few days later (Figure 3).
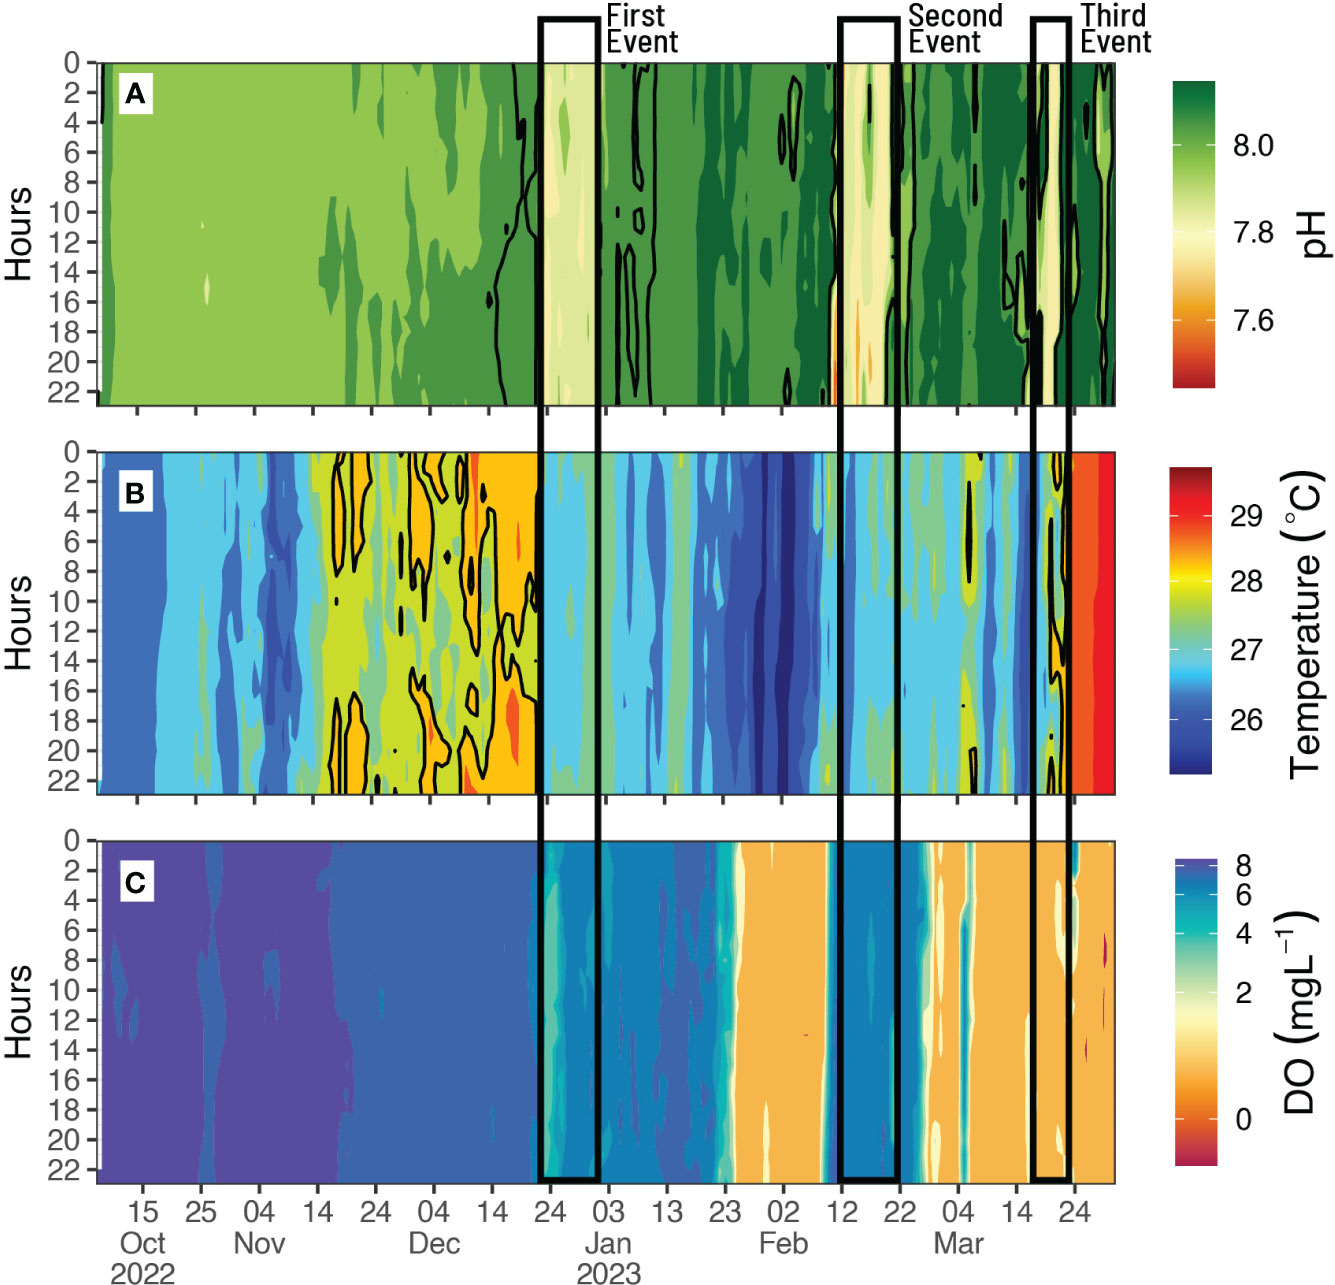
Figure 2 Hovmöller diagrams of the 24-hour cycle from October to March of (A) pH, (B) temperature, and (C) dissolved oxygen (DO) in the Tanga-Pemba Seascape. The black solid line indicates the duration (days) of upwelling events.
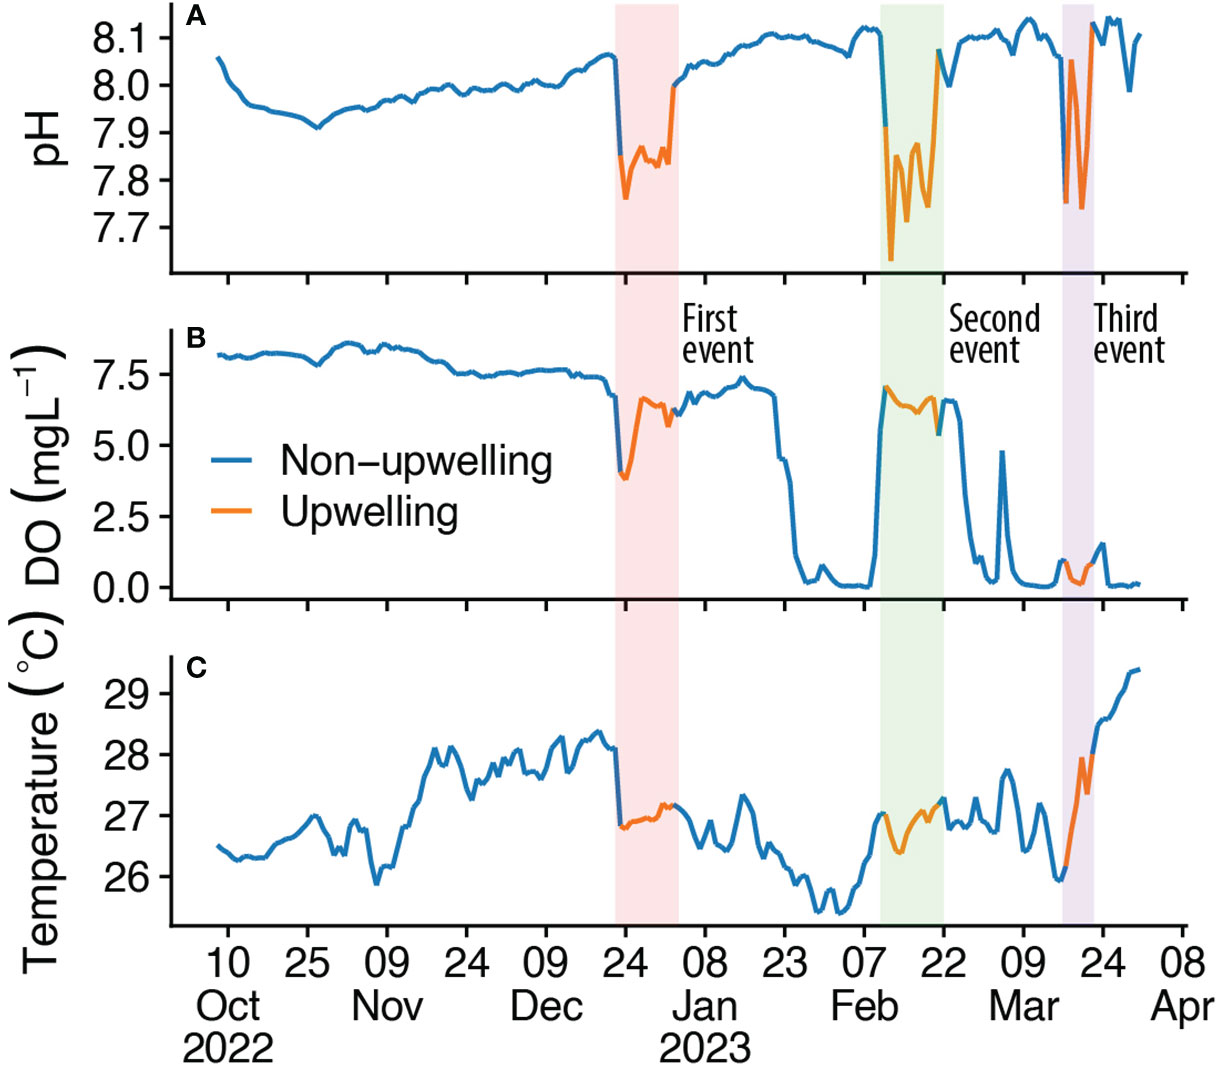
Figure 3 Time series diagrams of (A) pH, temperature (B, C) dissolved oxygen (DO) in the Tanga-Pemba Seascape. The color-coded blocks denote the upwelling occurrence period.
3.2 Critical thresholds for ocean acidification and deoxygenation
The simulation results revealed a pH threshold value of 7.43 ± 0.15 for ocean acidification in the T-PS, which corresponds to an average aragonite saturation state of 1.0 ± 0.02. This threshold value represents a critical point under future ocean acidification conditions below which dissolution of the saturation state for coral reefs can begin in the seascape (Cornwall et al., 2023). A DO threshold of 4.6 mg/L was also selected, which was based on the findings of a meta-analysis that identified biological effects becoming evident at this level (Vaquer-Sunyer and Duarte, 2008; Cornwall et al., 2023). The mean hourly values of pH during upwelling events were above a pH threshold value of 7.43 for ocean acidification, but DO mean values exhibited variability both above and below a threshold value of 4.6 mg/L for deoxygenation (Figure 4). The correlation between pH and DO was more pronounced during non-upwelling events compared to upwelling events (Figure 4).
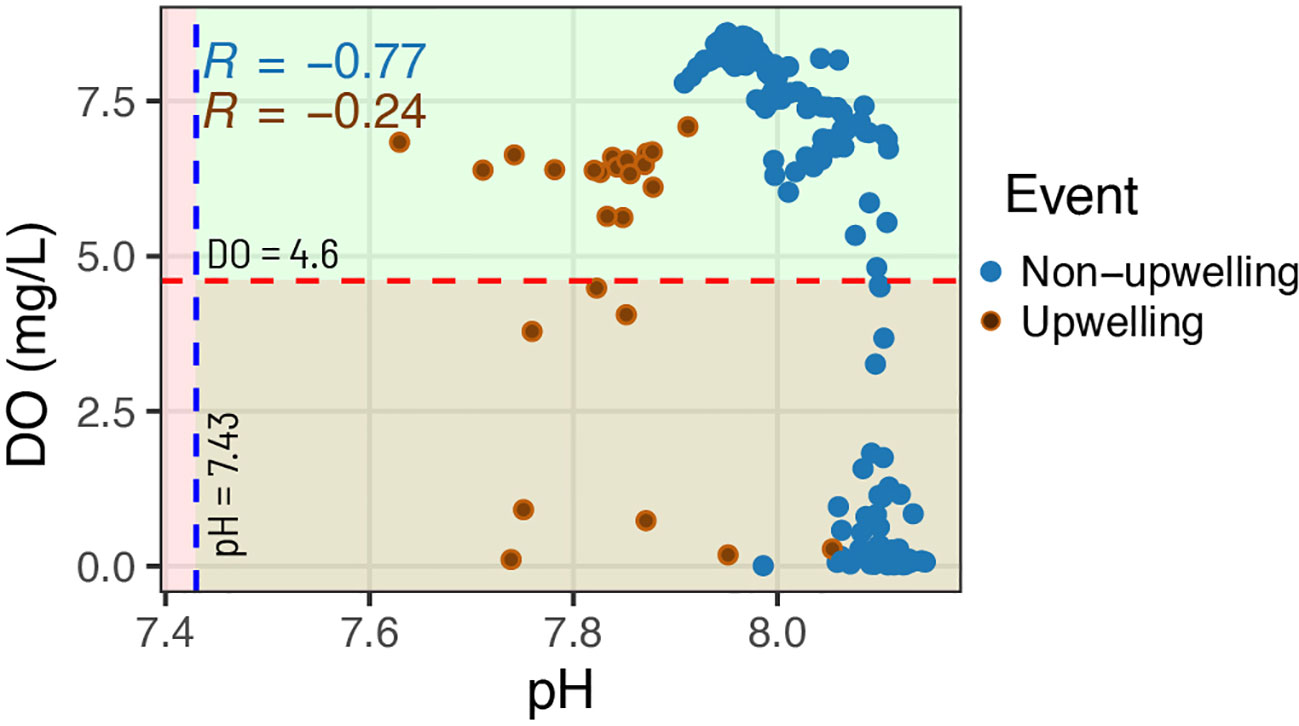
Figure 4 The correlation between pH and DO during upwelling events and non-upwelling days in the Tanga-Pemba Seascape. The blue dotted line denotes the computed pH threshold of 7.43 for ocean acidification, and the red dotted red line is the dissolved oxygen (DO) threshold of 4.6 mg/L.
3.3 Dynamics of pH in mangrove, seagrass and coral reef ecosystems
The patterns of pH dynamics were consistent across mangrove, seagrass, and coral reef ecosystems in the Moa site (Figure 5A) but not in the Wete site (Figure 5B). pH patterns consistently demonstrated higher mean hourly values in the seagrass and coral reef ecosystems at the Moa site, as well as in the mangrove, seagrass, and coral reef ecosystems at the Wete site, compared to those of the open ocean recorded during the third upwelling event (Figures 5A, B). However, most of the time, during a 24-hour cycle, the pH pattern within the mangrove ecosystems of the Moa site displayed mean hourly values below those of the open ocean recorded third upwelling event (Figure 5A). The highest mean pH values in Moa were observed within the coral reef ecosystems (8.234), while in Wete, the highest mean values were observed in seagrass ecosystems (8.315) (Table 1). The highest pH ranges were detected within the mangrove ecosystems of Moa (1.272) and the seagrass ecosystems of Wete (0.275) (Table 1).
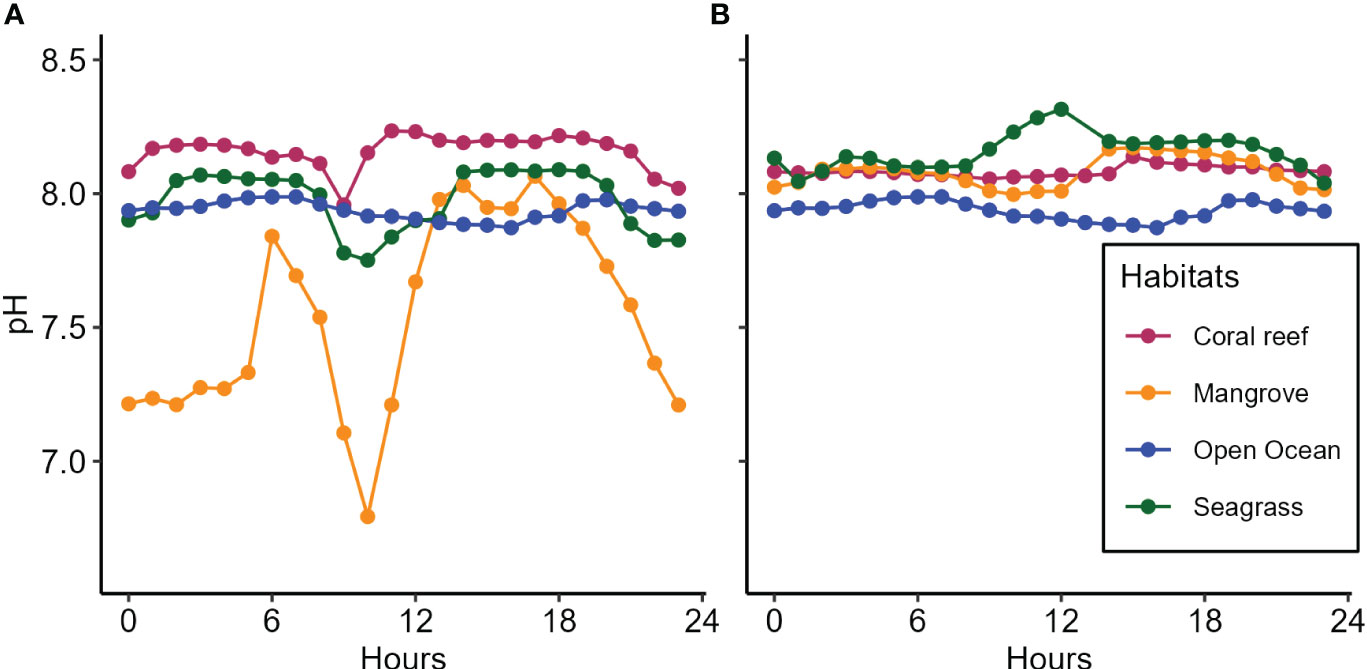
Figure 5 The patterns of pH dynamics in mangrove, seagrass, and coral reef ecosystems of (A) Moa and (B) Wete in comparison to those in the open ocean recorded during the third upwelling event.
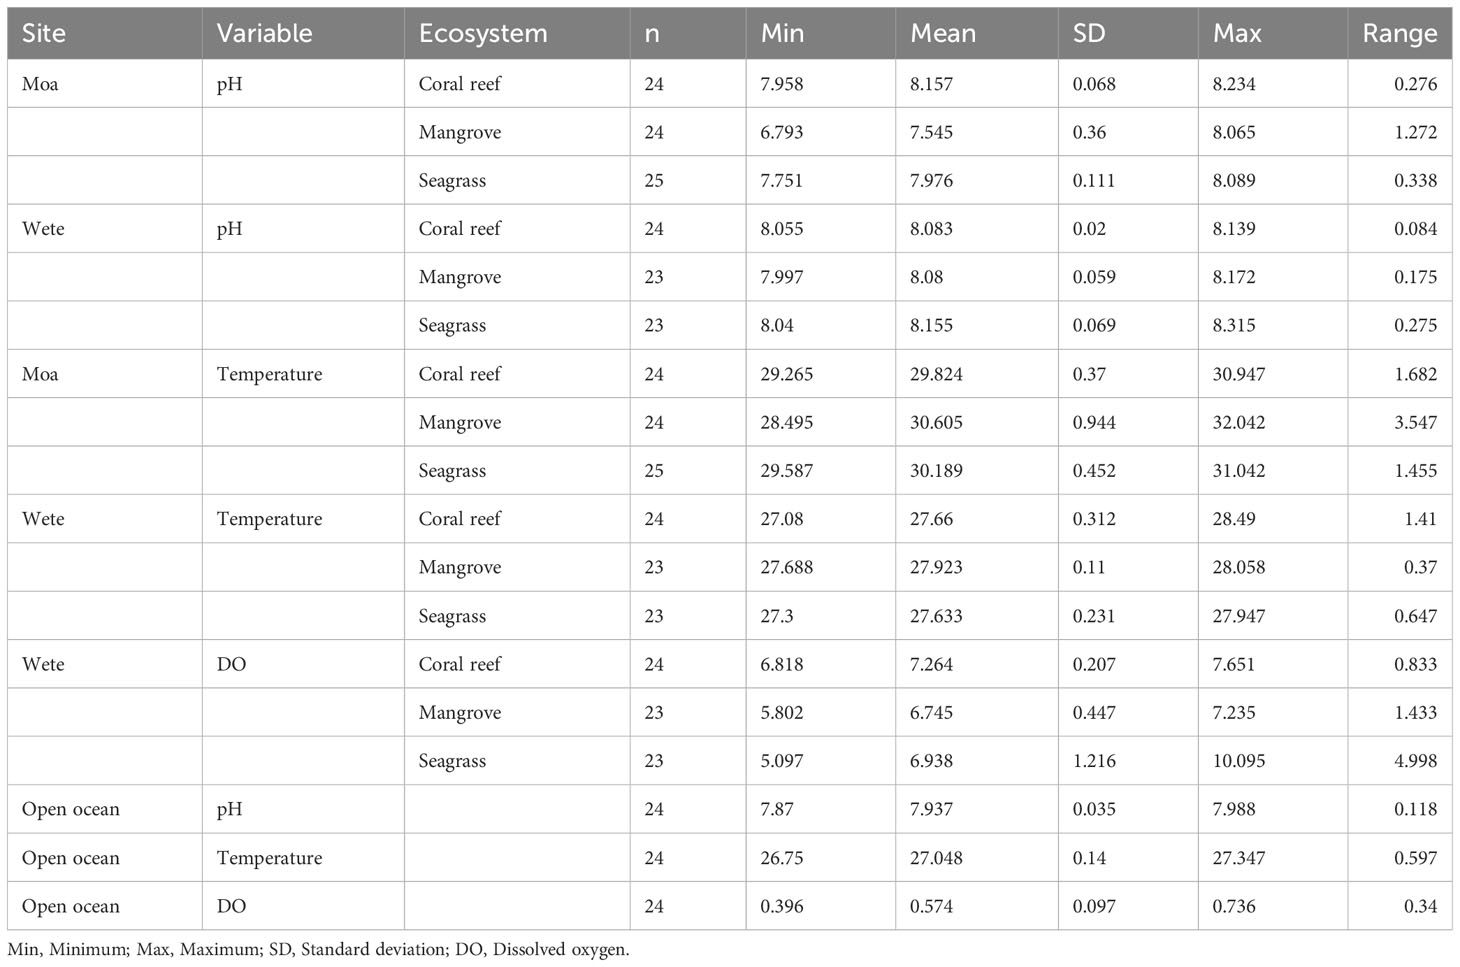
Table 1 Descriptive statistics for pH, DO, and temperature in the coastal ecosystems of Moa and Wete sites and those of the open ocean recorded during the third upwelling event.
3.4 Dynamics of temperature in mangrove, seagrass and coral reef ecosystems
Consistent temperature patterns were observed across the mangrove, seagrass, and coral reef ecosystems of both Moa (Figure 6A), and Wete (Figure 6B). The temperature patterns consistently showed elevated mean hourly values within the mangrove, seagrass, and coral reef ecosystems at both the Moa and Wete sites compared to those observed in the open ocean during the third upwelling event (Figures 6A, B). The highest temperature recorded in Moa was 32.042°C, and the lowest was 28.495°C, with a range of 3.547°C (Table 1). The mean hourly values for water temperature patterns in Moa were often greater than those in Wete.
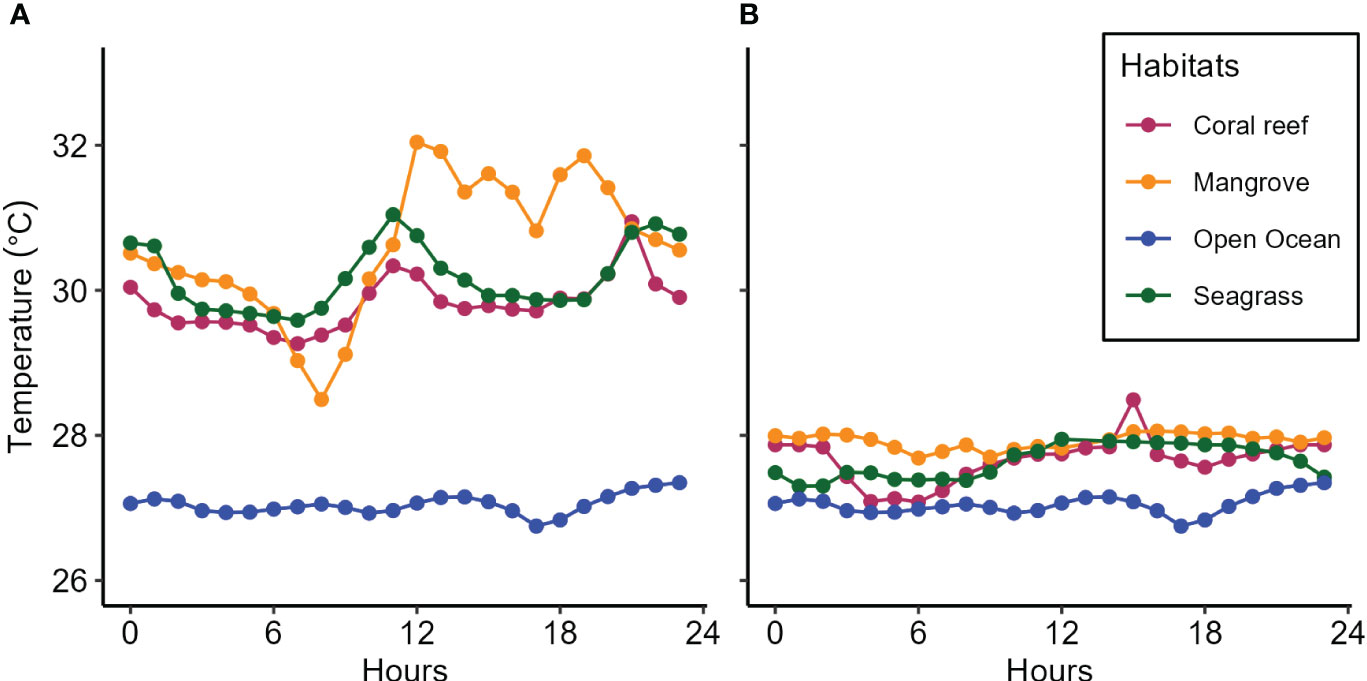
Figure 6 The patterns temperature dynamics in mangrove, seagrass, and coral reef ecosystems in (A) Moa and (B) Wete in comparison to those in the open ocean recorded during the third upwelling event.
3.5 Dynamics of DO in mangrove, seagrass and coral reef ecosystems
The pattern of DO dynamics varied between mangrove, seagrass, and coral reef ecosystems (Figure 7). The DO patterns throughout displayed higher mean hourly values within the mangrove, seagrass, and coral reef ecosystems compared to those recorded in the open ocean during the third upwelling event. The presentation of only DO results for Wete was due to the unavailability of the DO logger during sampling in Moa, as it was still recording data for the open ocean. Consistent DO patterns were observed in the seagrass and coral reef ecosystems, while the mangrove ecosystem exhibited a distinct pattern differing from that observed in the seagrass and coral reef ecosystems. The highest DO concentration was found in seagrass meadows, which was 10 mg/L (Table 1).
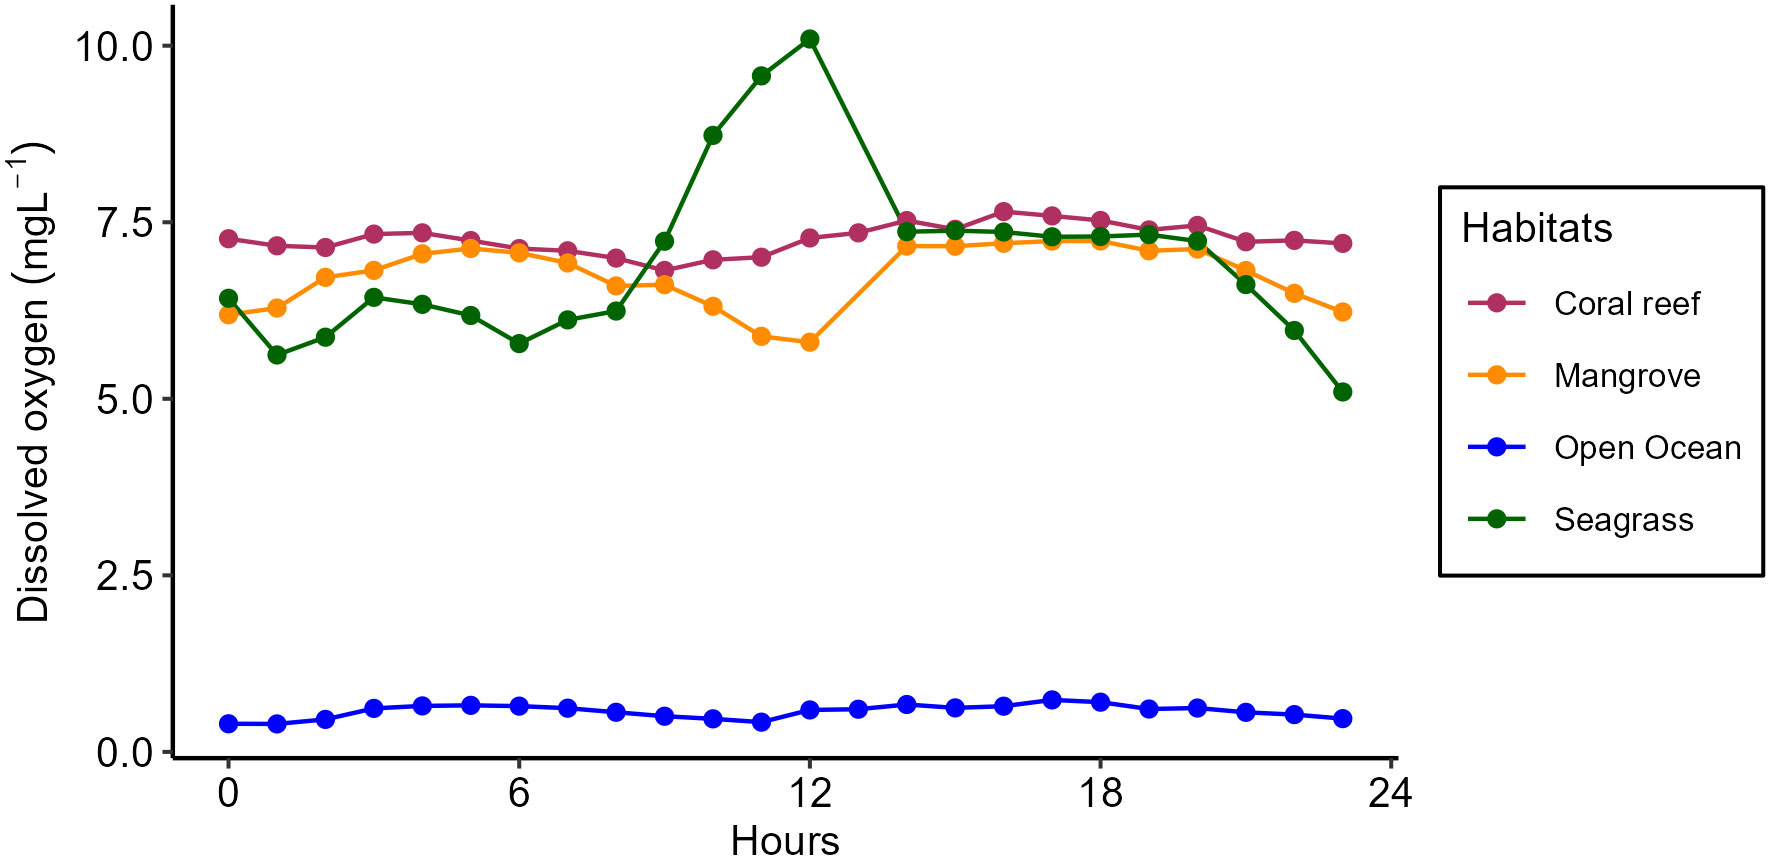
Figure 7 The patterns of dissolved oxygen (DO) dynamics in mangrove, seagrass, and coral reef ecosystems of Wete in comparison to those in the open ocean recorded during the third upwelling event.
3.6 Comparisons of pH, DO, and temperature between coastal ecosystems and the open ocean during the third upwelling event
Statistically rich boxplot of pH, DO, and temperature in mangrove, coral reef, and seagrass ecosystems and in the open ocean, which are represented by the red dotted line (Figure 8). Specifically, the mean hourly pH values were significantly higher in the coral reef ecosystems and the seagrass ecosystems than those of the open ocean during the third upwelling event (Table 2). However, there was no significant difference in mean hourly pH values between the mangrove ecosystem and the open ocean. Similarly, the mean hourly values for temperatures in the mangrove, seagrass, and coral reef ecosystems were significantly higher than those of the open ocean environment (Table 1). Moreover, the mean hourly DO values in the mangrove, seagrass, and coral reef ecosystems were significantly higher than those in the open ocean.
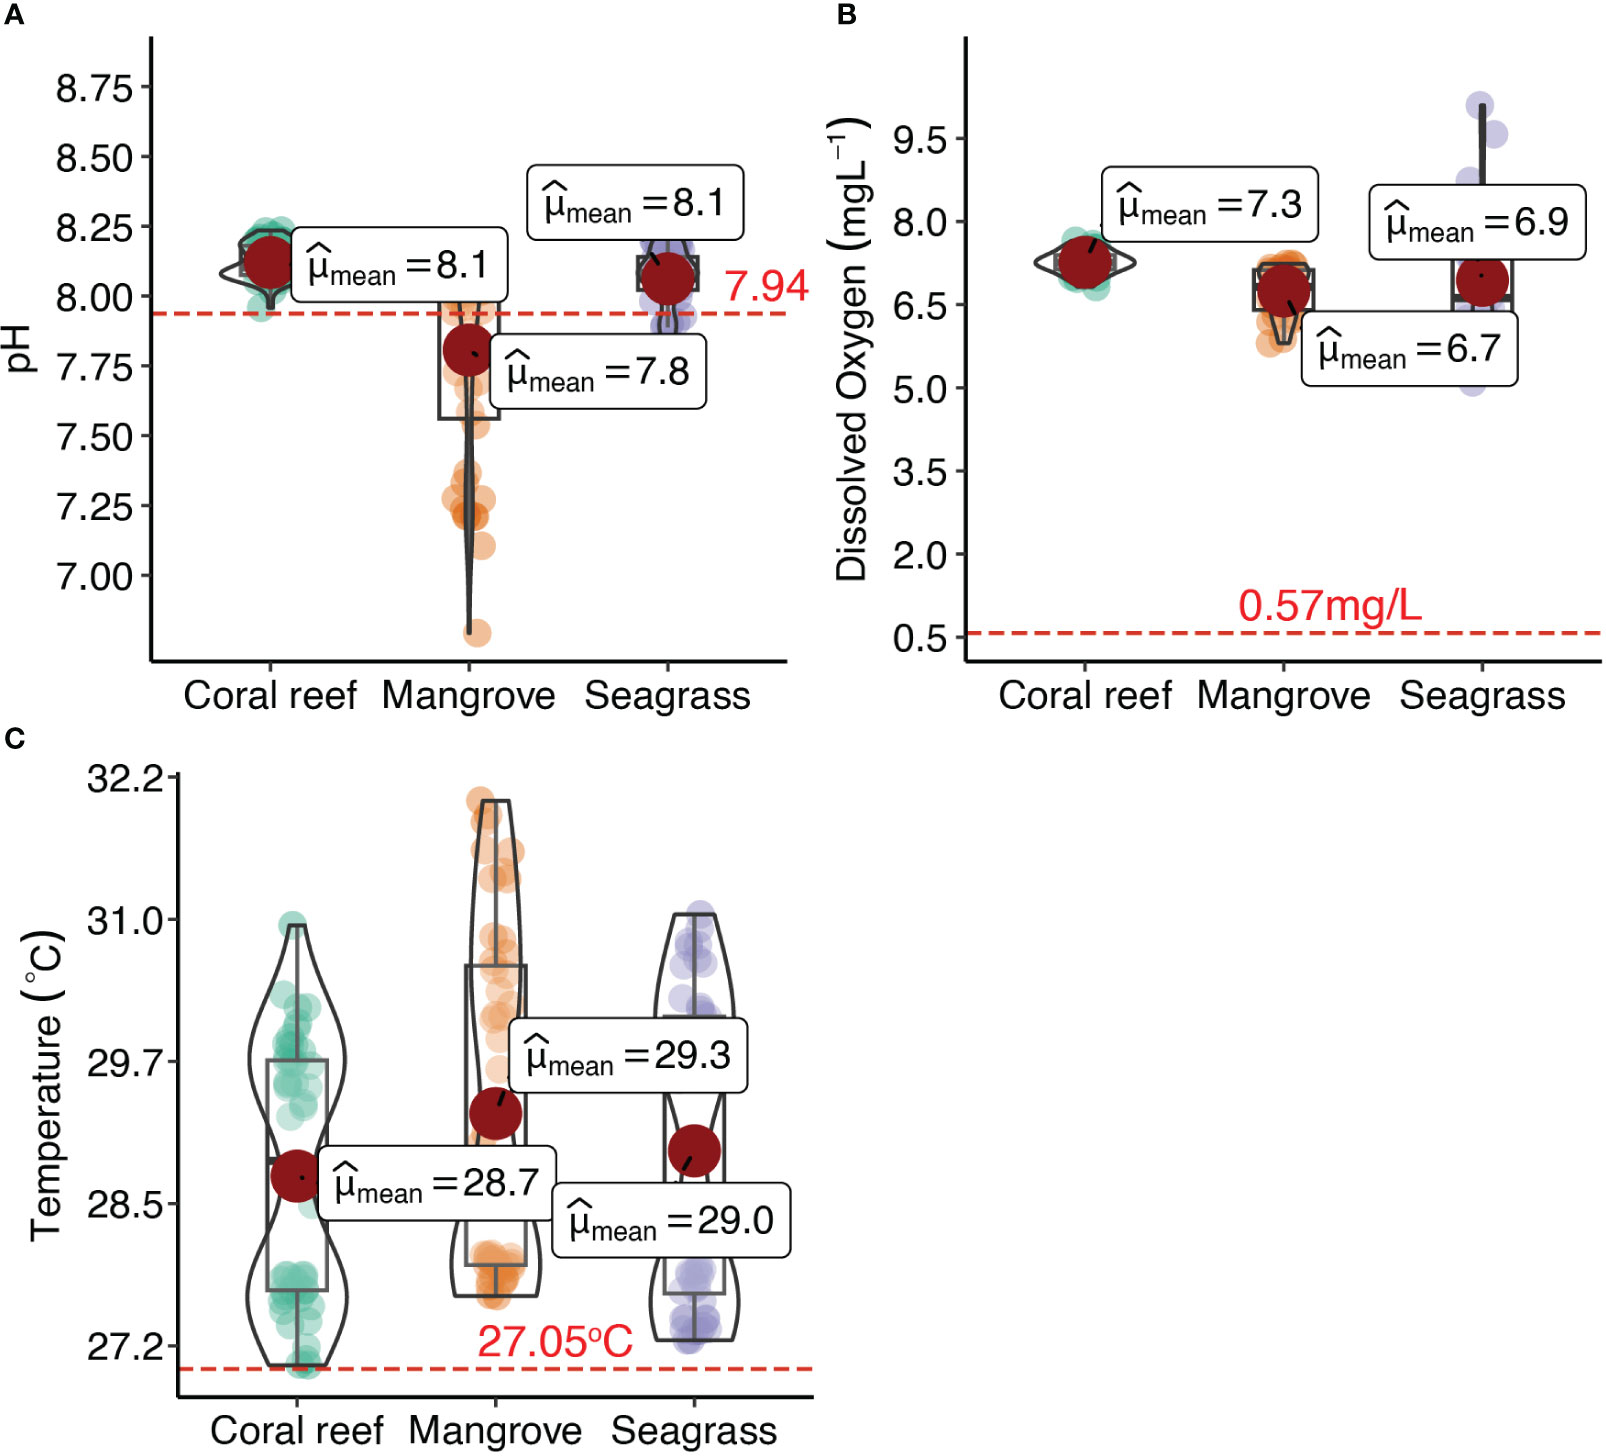
Figure 8 Statistically rich boxplot for (A) pH, (B) dissolved oxygen (DO), and (C) temperature in coral, mangrove, and seagrass coastal ecosystems. The red dotted line represents the mean values for pH, DO, and temperature for the open ocean during the third upwelling event.
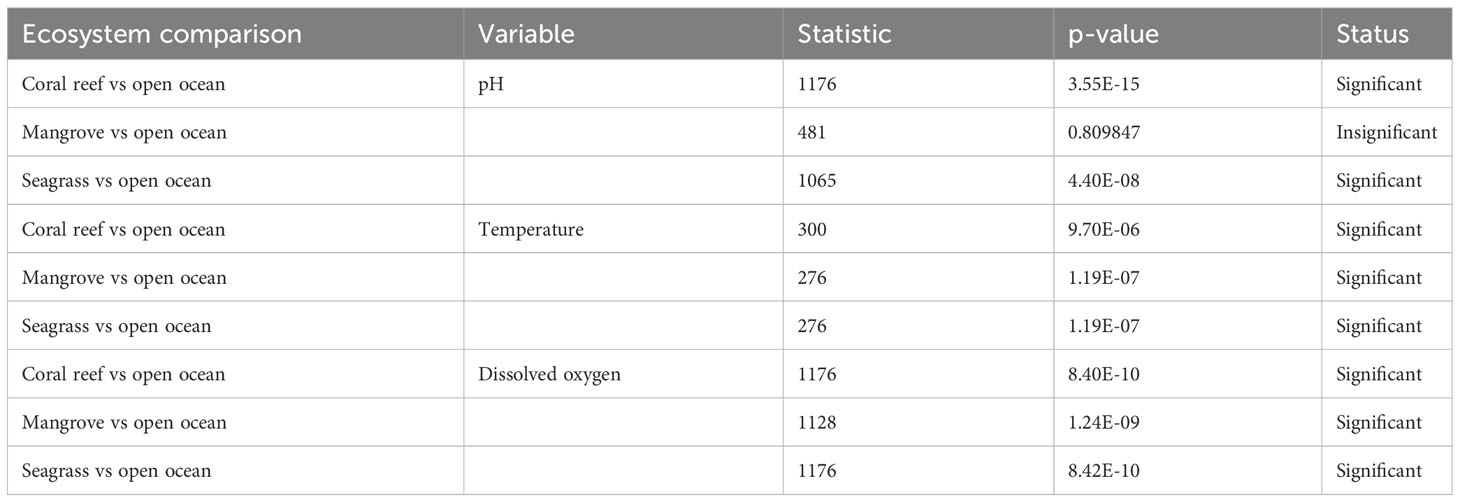
Table 2 Statistical comparisons of pH, dissolved oxygen (DO) and temperature between coastal ecosystems and the open ocean during the third upwelling event.
4 Discussion
The study revealed the high-frequency dynamics of pH, DO, and temperature in the T-PS for both the open ocean during the northeast monsoon season and within mangrove, seagrass, and coral reef ecosystems throughout the 24-hour cycle within that particular season. Moreover, it has revealed the occurrence of multiple upwelling events, with varying durations, that resulted in significant declines in pH, DO, and temperature within the seascape. Additionally, it revealed that the extremely low levels of pH during upwelling events in the T-PS are above the threshold value of 7.43 for ocean acidification, while the extremely low levels of DO fall below a threshold value of 4.6 mg/L for deoxygenation. During upwelling events, seagrass and coral reef ecosystems demonstrated higher mean hourly values of pH and DO than those in the open ocean. Frequent exposure to lower conditions in pH and DO during upwelling events may pose threats to the survival of both resident marine organisms and ecosystems, as well as the current mariculture practices within the T-PS seascape (Rixen et al., 2012; Schulz et al., 2019; Kroeker et al., 2023). However, the presence of seagrass meadows within these interconnected systems offers a degree of mitigation to their susceptibility to lower pH and DO conditions. These findings highlight the importance of conserving and managing seagrass meadows, not only for their well-being but also for their capability to alleviate the notably low levels of both pH and DO frequently experienced during upwelling events, thereby providing potential benefits to nearby mangrove and coral reef ecosystems.
Significant declines in pH, DO, and temperature were observed in upwelling events in the T-PS, potentially attributed to the upwelling of water with diminished pH, DO, and temperature to the surface (Lachkar, 2014; Schulz et al., 2019; Kroeker et al., 2023). The multiple upwelling events observed during the northeast monsoon season, with varying durations, may suggest that resident organisms and ecosystems endure multiple exposures to reduced pH and DO conditions. This is the first study to confirm the occurrence of upwelling in the T-PS reported by Kyewalyanga et al. (2020) and Halo et al. (2020) and detect multiple upwelling events during the northeast monsoon season. Upwelling in T-PS is driven by the convergence of the northward-flowing East Africa Coastal Current and the southward-flowing Somali Current (Semba et al., 2019). Significant declines in pH, DO, and temperature during upwelling events have also been reported in other parts of the world, along with the occurrence of multiple events in their respective study areas (Lachkar, 2014; Schulz et al., 2019; Kroeker et al., 2023).
A pH threshold value of 7.43 for ocean acidification in the T-PS was established in this study, representing an aragonite saturation state of one, below which dissolution of the aragonite saturation state may begin in the seascape (Cornwall et al., 2023). This is the first study to report a pH threshold value for ocean acidification in coastal upwelling areas of the WIO. The mean hourly values for pH observed during upwelling events in the T-PS were above the threshold value of 7.43 for ocean acidification, suggesting that the dissolution of the aragonite saturation state is unlikely to occur under the current upwelling events in the seascape. However, it is anticipated that the intensity and severity of upwelling events may increase in future climate change scenarios, thereby posing a risk the seascape to dissolution of the aragonite saturation state (Tapia et al., 2009; Schulz et al., 2019; Kroeker et al., 2023). Our pH threshold value of 7.43 for ocean acidification differs from the 7.6 reported by Kroeker et al. (2023) in the California current system. This disparity highlights the geographic variability of threshold values for ocean acidification, influenced by the frequency and intensity of upwelling (Chan et al., 2008). It also cautions against generalizing these threshold values in experiments designed to understand the impacts of ocean acidification in coastal upwelling areas. On the other hand, the DO values fluctuated both above and below a threshold of 4.6 mg/L for oxygen, signaling a high susceptibility of resident organisms in the seascape to deoxygenation during upwelling events (Cornwall et al., 2023; Kroeker et al., 2023).
The observed higher mean hourly values of pH and DO in seagrass meadows and coral reefs than the means for these variables during upwelling events could suggest a degree of mitigation to low pH and DO levels within these interconnected ecosystems facilitated by the presence of seagrass meadows during such events. Supporting these findings, a study by George and Lugendo (2022) using discrete measurements reported the highest pH and DO levels in seagrass meadows in Chwaka and Mnazi bays during the daytime. Seagrass meadows consume CO2 from the seawater through photosynthesis, leading to the production of O2 and an increase in the pH and DO levels in seawater of these ecosystems (Hendriks et al., 2014; Saderne et al., 2015). On the other hand, the mean hourly pH levels in the mangrove ecosystem were comparatively lower than those in the open ocean, suggesting that the mangrove ecosystem and the organisms it hosts may be susceptible to the lower pH and DO conditions in the seascape associated with upwelling events. Seagrass meadows have the potential to increase pH and DO levels in adjacent mangrove and coral reef ecosystems during the daytime through tidal movement, thereby contributing to the mitigation of the impacts of upwelling-enhanced ocean acidification and deoxygenation (George and Lugendo, 2022). The tidal-driven water movement among mangrove, seagrass, and coral reef ecosystems facilitates the transfer of water with higher pH and DO values from seagrass ecosystems to mangrove ecosystems during high tides. Similarly, it prevents water with a lower pH from mangroves from reaching coral reefs during low tides. When mangrove, seagrass, and coral reef ecosystems are situated at considerable distances from each other or when water circulation through them is limited, as seen at the Wete site, they tend to have fewer mutual impacts, and mangrove ecosystems may be more susceptible to the lower pH and DO levels during upwelling events (Schulz et al., 2019; Kroeker et al., 2023).
The degradation or disappearance of seagrass meadows, primarily attributed to human-induced factors and the impacts of climate change (Crabbe, 2008; Waycott et al., 2009), poses a significant threat to the regulatory capacity of these ecosystems in mitigating lower pH and DO levels associated with upwelling events. As these critical coastal ecosystems deteriorate, their effectiveness in buffering the effects of upwelling-enhanced declines in pH and DO is compromised (Job et al., 2023). This, in turn, will expose organisms and adjacent coastal ecosystems to an increased susceptibility to the adverse effects of upwelling-enhanced ocean acidification and deoxygenation.
5 Conclusion and recommendation
It is concluded that multiple upwelling events occur during the northeast monsoon season, with decreasing duration over time, leading to significant declines in pH, DO, and temperature within the T-PS. A pH value of 7.43 is a threshold for ocean acidification in the T-PS, representing an aragonite saturation state of one, below which dissolution of the aragonite saturation state may begin in the seascape. The existing extremely low pH levels observed in the T-PS during upwelling events are above the threshold value of 7.43 for ocean acidification, and consequently, the dissolution of aragonite saturation state is unlikely to occur under the current upwelling events in the seascape. The extreme DO values below 4.6 mg/L are occurring in the T-PS during upwelling events, indicating a high vulnerability of resident organisms and coastal organisms in the seascape to deoxygenation. During upwelling events, the seagrass and coral reef ecosystems exhibit higher mean hourly values of pH and DO compared to those of the open ocean, attributed to the presence of seagrass meadows within these interconnected systems. The study recommends proactive conservation and management strategies for seagrass meadows that will minimize ongoing threats and enhance the resilience of these ecosystems against changing environmental conditions (George, 2019; Unsworth et al., 2019). These efforts will enable seagrass meadows to continue playing a vital role in mitigating the impacts of upwelling-enhanced ocean acidification and deoxygenation in the T-PS.
Data availability statement
The raw data supporting the conclusions of this article will be made available by the authors, without undue reservation.
Author contributions
RG: Conceptualization, Data curation, Formal analysis, Methodology, Writing – original draft, Writing – review & editing. SJ: Conceptualization, Data curation, Formal analysis, Writing – review & editing. MS: Data curation, Formal analysis, Methodology, Writing – original draft. EM: Funding acquisition, Project administration, Resources, Writing – review & editing. BL: Conceptualization, Writing – review & editing. AT: Funding acquisition, Project administration, Resources, Writing – review & editing. IK: Conceptualization, Funding acquisition, Methodology, Project administration, Resources, Writing – review & editing.
Funding
The author(s) declare financial support was received for the research, authorship, and/or publication of this article. The research was funded by Irish Embassy through the partnership of IUCN-Tanzania and WIOMSA grant with the grant number WIOMSA/OA/2023/01.
Acknowledgments
We would like to express our gratitude to the local field assistants who played a crucial role in our field sampling efforts, with special mention to Patroba Matiku, Julietha Mosille, Omary Wijuru, Fidelis Kayanda, Ezira Katate, Hamad Hassan, and Ali Ali for their invaluable contributions to data collection. We extend our heartfelt thanks to the Beach Management Units (BMUs) at the Moa and Wete sites for their unwavering support and active participation in the data collection process. Furthermore, we sincerely appreciate the cooperation and permission granted by the administrations of Mkinga District and Wete District councils to conduct our sampling activities in their coastal waters. This study was supported by the International Union for Conservation of Nature (IUCN) through the Western Indian Ocean Marine Science Association (WIOMSA).
Conflict of interest
The authors declare that the research was conducted in the absence of any commercial or financial relationships that could be construed as a potential conflict of interest.
Publisher’s note
All claims expressed in this article are solely those of the authors and do not necessarily represent those of their affiliated organizations, or those of the publisher, the editors and the reviewers. Any product that may be evaluated in this article, or claim that may be made by its manufacturer, is not guaranteed or endorsed by the publisher.
References
Boodhoo K., Ramessur R. T., Imrit Y. A. (2022). Assessment of ocean acidification in a selected tropical coastal lagoon in Mauritius. J. Environ. Stud. 26, 9–15. doi: 10.21608/jesj.2022.138037.1008
Chan F., Barth J., Lubchenco J., Kirincich A., Weeks H., Peterson W. T., et al. (2008). Emergence of anoxia in the California current large marine ecosystem. Science 319, 920–920. doi: 10.1126/science.1149016
Cornwall C., Comeau S., Harvey B. (2023). Physiological and ecological tipping points caused by ocean acidification. Earth Sys. Dynam. Discuss. 2023, 1–21. doi: 10.5194/esd-2023-24
Crabbe M. J. C. (2008). Climate change, global warming and coral reefs: Modelling the effects of temperature. Comput. Biol. Chem. 32, 311–314. doi: 10.1016/j.compbiolchem.2008.04.001
Doney S. C., Busch D. S., Cooley S. R., Kroeker K. J. (2020). The impacts of ocean acidification on marine ecosystems and reliant human communities. Annu. Rev. Environ. Res. 45, 83–112. doi: 10.1146/annurev-environ-012320-083019
Doney S. C., Fabry V. J., Feely R. A., Kleypas J. A. (2009). Ocean acidification: the other CO2 problem. Annu. Rev. Mar. sci. 1, 169–192. doi: 10.1146/annurev.marine.010908.163834
Edworthy C., Potts W., Dupont S., Duncan M., Bornman T., James N. (2022). A baseline assessment of coastal pH variability in a temperate South African embayment: implications for biological ocean acidification research. Afr. J. Mar. Sci. 44, 367–381. doi: 10.2989/1814232X.2022.2147999
Feely R. A., Doney S. C., Cooley S. R. (2009). Ocean acidification. Oceanography 22, 36–47. doi: 10.5670/oceanog.2009.95
Figuerola B., Hancock A. M., Bax N., Cummings V. J., Downey R., Griffiths H. J., et al. (2021). A review and meta-analysis of potential impacts of ocean acidification on marine calcifiers from the Southern Ocean. Front. Mar. Sci. 8, 584445. doi: 10.3389/fmars.2021.584445
George R. (2019). Seagrasses in warming oceans: physiological and biogeochemical responses (Stockholm University: Department of Ecology, Environment and Plant Sciences).
George R., Gullström M., Mangora M. M., Mtolera M. S., Björk M. (2018). High midday temperature stress has stronger effects on biomass than on photosynthesis: A mesocosm experiment on four tropical seagrass species. Ecol. evol. 8, 4508–4517. doi: 10.1002/ece3.3952
George R., Lugendo B. R. (2022). Tidal cycle and time of day control pH levels in coastal habitats of the western Indian Ocean: the case of Mnazi and Chwaka Bays in Tanzania. West. Indian Ocean J. Mar. Sci. 21, 141–150. doi: 10.4314/wiojms.v21i2.12
Halo I., Sagero P., Manyilizu M., Mahongo S. B. (2020). Biophysical modelling of coastal upwelling variability and circulation along the Tanzanian and Kenyan coasts. West. Indian Ocean J. Mar. Sci., 43–61. doi: 10.4314/wiojms.si2020.1.5
Hendriks I. E., Olsen Y. S., Ramajo L., Basso L., Moore T., Howard J., et al. (2014). Photosynthetic activity buffers ocean acidification in seagrass meadows. Biogeosciences 11 (2), 333–346. doi: 10.5194/bgd-10-12313-2013
Hofmann G. E., Smith J. E., Johnson K. S., Send U., Levin L. A., Micheli F., et al. (2011). High-frequency dynamics of ocean pH: a multi-ecosystem comparison. PloS One 6, e28983. doi: 10.1371/journal.pone.0028983
Job S., Sekadende B., Yona G., George R., Lugendo B. R., Kimirei I. A. (2023). Effect of seagrass cover loss on seawater carbonate chemistry: Implications for the potential of seagrass meadows to mitigate ocean acidification. Region. Stud. Mar. Sci. 60, 102816. doi: 10.1016/j.rsma.2023.102816
Keeling R. F., Körtzinger A., Gruber N. (2010). Ocean deoxygenation in a warming world. Annu. Rev. Mar. sci. 2, 199–229. doi: 10.1146/annurev.marine.010908.163855
Kroeker K. J., Donham E. M., Vylet K., Warren J. K., Cheresh J., Fiechter J., et al. (2023). Exposure to extremes in multiple global change drivers: Characterizing pH, dissolved oxygen, and temperature variability in a dynamic, upwelling dominated ecosystem. Limnol. Oceanogr 68, 1611–1623. doi: 10.1002/lno.12371
Kroeker K. J., Kordas R. L., Crim R., Hendriks I. E., Ramajo L., Singh G. S., et al. (2013). Impacts of ocean acidification on marine organisms: quantifying sensitivities and interaction with warming. Global Change Biol. 68 (7), 1611–1623. doi: 10.1111/gcb.12179
Kyewalyanga M. S., Peter N., Semba M., Mahongo S. B. (2020). Coastal upwelling and seasonal variation in phytoplankton biomass in the Pemba Channel. West. Indian Ocean J. Mar. Sci., 19–32. doi: 10.4314/wiojms.si2020.1.3
Lachkar Z. (2014). Effects of upwelling increase on ocean acidification in the California and Canary Current systems. Geophys. Res. Letters. 41, 90–95. doi: 10.1002/2013GL058726
Laffoley D., Baxter J. M. (2016). Explaining ocean warming: Causes, scale, effects and consequences (Switzerland: IUCN Gland).
Limburg K. E., Breitburg D., Swaney D. P., Jacinto G. (2020). Ocean deoxygenation: A primer. One Earth. 2, 24–29. doi: 10.1016/j.oneear.2020.01.001
Lutier M., Di Poi C., Gazeau F., Appolis A., Le Luyer J., Pernet F. (2022). Revisiting tolerance to ocean acidification: insights from a new framework combining physiological and molecular tipping points of Pacific oyster. Global Change Biol. 28, 3333–3348. doi: 10.1111/gcb.16101
Madkaiker K., Valsala V., Sreeush M., Mallissery A., Chakraborty K., Deshpande A. (2023). Understanding the seasonality, trends, and controlling factors of Indian ocean acidification over distinctive bio-provinces. J. Geophys. Res.: Biogeosci. 128, e2022JG006926.
Mahongo S. B. (2014). Annual to inter-decadal variability of surface air temperature along the coast of Tanzania. West. Indian Ocean J. Mar. Sci. 13, 109–124.
Mahongo S. B., Francis J., Osima S. (2011). Wind patterns of coastal Tanzania: their variability and trends. West. Indian Ocean J. Mar. Sci. 10, 107–120.
Morrell B. (2018). Coastal Ocean Acidification: Carbonate Chemistry and Ecosystem Effects (Elsevier). https://scholar.google.com/scholar?hl=en&as_sdt=0%2C5&q=.+Coastal+Ocean+Acidification%3A+Carbonate+Chemistry+and+Ecosystem+Q24+Effects.&btnG=
Mount J., Zumel N. (2019). Practical data science with R (20 Baldwin Rd, Shelter Island, NY 11964, United States: MANNING SHELTER ISLAND).
Orr J. C. (2011). Recent and future changes in ocean carbonate chemistry. Ocean acidification. 1, 41–66. doi: 10.1093/oso/9780199591091.003.0008
Pedersen O., Colmer T. D., Borum J., Zavala-Perez A., Kendrick G. A. (2016). Heat stress of two tropical seagrass species during low tides–impact on underwater net photosynthesis, dark respiration and diel in situ internal aeration. New Phytol. 210, 1207–1218. doi: 10.1111/nph.13900
Pedersen O., Colmer T. D., Sand-Jensen K. (2013). Underwater photosynthesis of submerged plants–recent advances and methods. Front. Plant Sci. 4, 140. doi: 10.3389/fpls.2013.00140
Rasmusson L. M., Buapet P., George R., Gullström M., Gunnarsson P. C., Björk M. (2020). Effects of temperature and hypoxia on respiration, photorespiration, and photosynthesis of seagrass leaves from contrasting temperature regimes. ICES J. Mar. Sci. 77, 2056–2065. doi: 10.1093/icesjms/fsaa093
Rasmusson L. M., Gullström M., Gunnarsson P. C. B., George R., Björk M. (2019). Estimation of a whole plant Q10 to assess seagrass productivity during temperature shifts. Sci. Rep. 9, 1–9. doi: 10.1038/s41598-019-49184-z
Rixen T., Jiménez C., Cortés J. (2012). Impact of upwelling events on the sea water carbonate chemistry and dissolved oxygen concentration in the Gulf of Papagayo (Culebra Bay), Costa Rica: Implications for coral reefs. Rev. Biología Tropical. 60, 187–195. doi: 10.15517/rbt.v60i2.20004
Saderne V., Fietzek P., Aßmann S., Körtzinger A., Hiebenthal C. (2015). Seagrass beds as ocean acidification refuges for mussels? High resolution measurements of pCO 2 and O 2 in a Zostera marina and Mytilus edulis mosaic habitat. Biogeosci. Discuss. 12, 11423–11461. doi: 10.5194/bgd-12-11423-2015
Schulz K. G., Hartley S., Eyre B. (2019). Upwelling amplifies ocean acidification on the East Australian Shelf: Implications for marine ecosystems. Front. Mar. Sci. 6, 636. doi: 10.3389/fmars.2019.00636
Semba M., Lumpkin R., Kimirei I., Shaghude Y., Nyandwi N. (2019). Seasonal and spatial variation of surface current in the Pemba Channel, Tanzania. PloS One 14, e0210303. doi: 10.1371/journal.pone.0210303
Semesi I. S., Beer S., Björk M. (2009a). Seagrass photosynthesis controls rates of calcification and photosynthesis of calcareous macroalgae in a tropical seagrass meadow. Mar. Ecol. Prog. Series. 382, 41–47. doi: 10.3354/meps07973
Semesi I. S., Kangwe J., Björk M. (2009b). Alterations in seawater pH and CO2 affect calcification and photosynthesis in the tropical coralline alga, Hydrolithon sp.(Rhodophyta). Estuarine Coast. Shelf Sci. 84, 337–341. doi: 10.1016/j.ecss.2009.03.038
Smith R. L. (1992). Coastal upwelling in the modern ocean. Geol. Soc. London Special Publications. 64, 9–28. doi: 10.1144/GSL.SP.1992.064.01.02
Talukder B., Ganguli N., Matthew R., Hipel K. W., Orbinski J. (2022). Climate change-accelerated ocean biodiversity loss & associated planetary health impacts. J. Climate Change Health 6, 100114. doi: 10.1016/j.joclim.2022.100114
Tapia F. J., Navarrete S. A., Castillo M., Menge B. A., Castilla J. C., Largier J., et al. (2009). Thermal indices of upwelling effects on inner-shelf habitats. Prog. Oceanogr. 83, 278–287. doi: 10.1016/j.pocean.2009.07.035
Unsworth R. K., McKenzie L. J., Collier C. J., Cullen-Unsworth L. C., Duarte C. M., Eklöf J. S., et al. (2019). Global challenges for seagrass conservation. Ambio 48, 801–815. doi: 10.1007/s13280-018-1115-y
Van Dam B., Lopes C., Zeller M. A., Ribas-Ribas M., Wang H., Thomas H. (2021). Corrigendum: Overstated potential for seagrass meadows to mitigate coastal ocean acidification. Front. Mar. Sci. 8, 1959. doi: 10.3389/fmars.2021.814700
Vaquer-Sunyer R., Duarte C. M. (2008). Thresholds of hypoxia for marine biodiversity. Proc. Natl. Acad. Sci. 105, 15452–15457. doi: 10.1073/pnas.0803833105
Vinayachandran P., Seng D. C., Schmid F. A. (2022). Climate change and coastal systems. In Blue economy: an ocean science perspective (Berlin, Germany: Springer), 341–377.
Waycott M., Duarte C. M., Carruthers T. J., Orth R. J., Dennison W. C., Olyarnik S., et al. (2009). Accelerating loss of seagrasses across the globe threatens coastal ecosystems. Proc. Natl. Acad. Sci. 106, 12377–12381. doi: 10.1073/pnas.0905620106
WIOMSA (2022). Potential site-level ocean acidification mitigation measures and provision of seascape level recommendations in the Tanga-pemba seascape. viii + 35.
Woolson R. F. (2007). Wilcoxon signed-rank test. Wiley encyclo. Clin. trials 2, 1–3. doi: 10.1002/9780471462422.eoct979
Keywords: Western Indian Ocean, Tanga-Pemba Seascape, mangrove, seagrass and coral reef ecosystems, pH, dissolved oxygen, temperature, coastal upwelling areas
Citation: George R, Job S, Semba M, Monga E, Lugendo B, Tuda A and Kimirei I (2024) High-frequency dynamics of pH, dissolved oxygen, and temperature in the coastal ecosystems of the Tanga-Pemba Seascape: implications for upwelling-enhanced ocean acidification and deoxygenation. Front. Mar. Sci. 10:1286870. doi: 10.3389/fmars.2023.1286870
Received: 31 August 2023; Accepted: 12 December 2023;
Published: 08 January 2024.
Edited by:
Abed El Rahman Hassoun, Helmholtz Association of German Research Centers (HZ), GermanyReviewed by:
Kouakou Urbain Koffi, Ecole Normale Supérieure Abidjan, Cote d’IvoireSubrata Sarker, Shahjalal University of Science and Technology, Bangladesh
Copyright © 2024 George, Job, Semba, Monga, Lugendo, Tuda and Kimirei. This is an open-access article distributed under the terms of the Creative Commons Attribution License (CC BY). The use, distribution or reproduction in other forums is permitted, provided the original author(s) and the copyright owner(s) are credited and that the original publication in this journal is cited, in accordance with accepted academic practice. No use, distribution or reproduction is permitted which does not comply with these terms.
*Correspondence: Rushingisha George, Z2VvcmdlcnVzaGluZ2lzaGFAdGFmaXJpLmdvLnR6
 Rushingisha George
 Samson Job
 Masumbuko Semba3
 Ismael Kimirei