 Pim G. Boute
 Andres Hagmayer
 Koen Smid1†
 Martin J. Lankheet
94% of researchers rate our articles as excellent or good
Learn more about the work of our research integrity team to safeguard the quality of each article we publish.
Find out more
ORIGINAL RESEARCH article
Front. Mar. Sci., 29 January 2024
Sec. Marine Fisheries, Aquaculture and Living Resources
Volume 10 - 2023 | https://doi.org/10.3389/fmars.2023.1286149
Electrical pulse trawling is an alternative to conventional beam trawling for common sole (Solea solea), with substantially less discards, lower fuel consumption, and reduced impact on the benthic ecosystem. Pulsed electric fields are used to drive the fish from the seafloor and immobilise them in front of the nets. Concerns exist, however, that the electric fields may affect fishes outside the trawl track. Here, we address these concerns by measuring amplitude thresholds for behavioural responses and by comparing these response thresholds to simulated field strengths around fishing gear. Electroreceptive small-spotted catshark (Scyliorhinus canicula) and thornback ray (Raja clavata) as well as non-electroreceptive European seabass (Dicentrarchus labrax), turbot (Scophthalmus maximus), and common sole were, one at the time, placed in a ø2.5 m circular tank with seven, individually controlled, evenly spaced electrode pairs, spanning the diameter of the tank. Behavioural responses were assessed from camera recordings for different pulse amplitudes and for different fish positions relative to the stimulating electrodes. Electrical stimulation consisted of a Pulsed Bipolar Current at 45 Hz and 0.3 ms pulse width, similar to that used in commercial gears. Computer simulations of the electric field, verified with in situ measurements, were used to determine the field strength at the location of the animal. Thresholds for different species varied between 6.0 and 9.8 V m–1, with no significant difference between electroreceptive and non-electroreceptive species. The thresholds correspond to a distance of maximally 80 cm from the electrode arrays in simulated electric fields around commercial fishing gears. These findings suggest that electrical pulses as used in pulse trawling are unlikely to elicit a behavioural response outside the nets that surround the electrode arrays.
Bottom trawling is widely used to capture demersal fishes and invertebrates but comes with negative effects on the marine ecosystem and environment (de Groot, 1984; Jones, 1992; Kaiser et al., 2006; Callaway et al., 2007; Thurstan et al., 2010; Hiddink et al., 2017; Amoroso et al., 2018; Mazor et al., 2021; Pitcher et al., 2022; Sala et al., 2022). Fishing-gear innovation may help to limit negative environmental effects of bottom trawling (Brewer et al., 2006; He, 2007; Suuronen and Sardà, 2007; Haasnoot et al., 2016; ICES, 2020b; van Hoof et al., 2020; Hilborn et al., 2023; Sala et al., 2023). For bottom trawls targeting common sole (Solea solea) in the North Sea, a promising modification is the replacement of tickler chains with electrode arrays (Soetaert et al., 2015b). Whereas tickler chains use mechanical stimulation to chase the fish out of the sediment, pulse gears use pulsed electric fields to drive the fish from the seafloor and immobilise them in front of the nets (Soetaert et al., 2015b; Soetaert et al., 2019). Fitting trawlers with electrode arrays can lessen the environmental impact by reducing fuel consumption (van Marlen et al., 2014; Poos et al., 2020), discard rates (van Marlen et al., 2014; van Overzee et al., 2023), physical disturbance of the benthic ecosystem (Depestele et al., 2016; Depestele et al., 2019; Rijnsdorp et al., 2021), impact on benthic organisms (Soetaert et al., 2015a; Soetaert et al., 2016d; Bergman and Meesters, 2020; Tiano et al., 2020; Boute et al., 2021), and the benthic ecosystem (Rijnsdorp et al., 2020b; Tiano et al., 2021; Tiano et al., 2022). Furthermore, compared to tickler-chain trawling, pulse trawling has increased selectivity (van Marlen et al., 2014; Poos et al., 2020; van Overzee et al., 2023), discard survival rates (van der Reijden et al., 2017), and revenues (Batsleer et al., 2016; Turenhout et al., 2016). When catch volumes are limited by regulations, the lower ecological footprint as a result of reduced towing speed and increased catch efficiency is, arguably, a major advantage (Rijnsdorp et al., 2020b).
Concerns exist, however, that the electric field extends well beyond the netting, potentially affecting fish outside the trawl track (Desender et al., 2017; ICES, 2018; Quirijns et al., 2018). Exposure to pulsed electric fields may cause different responses, depending on the field strength (Snyder, 2003; Soetaert et al., 2015a; Soetaert et al., 2019). High field strengths may cause epileptic seizures and whole-body muscle contractions. Lower field strengths may induce involuntary muscle twitches and uncontrolled swimming. Moreover, if a fish would be able to sense low field strengths, this could lead to complex changes in behaviour. Thresholds for the different types of responses are likely species-specific and may also vary with waveform parameters such as pulse duration and frequency (de Haan et al., 2016; Desender et al., 2016; Soetaert et al., 2019). Pulse trawlers targeting common sole, however, use invariable electrical settings (ICES, 2020a), leaving electric field strength as the dominant variable.
It is unknown if fish can respond to low electric field strengths generated by pulse trawlers. Common sole – the target species for pulse trawlers – responds to high field strengths by curling their body upwards in a U-shape during which they are immobilised, without obvious damage (Soetaert et al., 2015b; Soetaert et al., 2016b). Whole-body muscle contractions in non-target species, especially bilaterally-symmetrical round fish, may however lead to spinal injuries and internal haemorrhages, as studied in the laboratory (de Haan et al., 2016; Soetaert et al., 2016a; Soetaert et al., 2016b; Soetaert et al., 2018; Schram et al., 2022) and under field conditions (van Marlen et al., 2014; Soetaert et al., 2016c; Boute, 2022; Boute et al., 2022; Boute et al., 2023). Whole-body muscle contractions occur at field strengths above 37 V m–1 in Atlantic cod (Gadus morhua) resulting in a 50% spinal injury probability in larger specimens at 80 V m–1 (95% CI: 60–110 V m–1) (de Haan et al., 2016). Such high field strengths occur only in close proximity of the stimulating electrodes (de Haan et al., 2016; de Haan and Burggraaf, 2018), and are unlikely to affect fish beyond the boundaries of the nets which are at about 40–90 cm from the electrode arrays depending on the pulse gear type and number of arrays (above and sideways from the most outer electrode arrays). Lower field strengths, however, may extend well beyond the nets and could potentially cause major behavioural changes.
Especially elasmobranchs might sense the electric fields at a large distance from the source. Elasmobranchs have electroreceptors, the ampullae of Lorenzini, with extremely high sensitivity to electric fields (Dijkgraaf and Kalmijn, 1962; Murray, 1962; Dijkgraaf and Kalmijn, 1963; England and Robert, 2021). They use, a.o., electroreception to detect prey that is hidden in the sediment (Montgomery and Bodznick, 1999; Newton et al., 2019). Desender et al. (2017) found that exposure of electroreceptive small-spotted catshark (Scyliorhinus canicula) to a high electric field strength did not result in impaired electroreception. de Haan et al. (2009) reported variable responses of small-spotted catshark depending on distance to the electrodes, but no attempt was made to quantify this relationship, nor to quantify threshold strengths for minimal behavioural responses. In a freshwater electrofishing context, non-electroreceptive fish have been found to respond to electrical stimuli of low field strengths via a startle response or galvanotaxis (Taylor et al., 1957; Snyder, 2003; Pottier et al., 2020). Galvanotaxis is expected to be minimal in marine electrotrawling because bipolar pulses are used, the scale of operation is larger than in freshwater (Bary, 1956; Polet, 2010; Soetaert et al., 2019), and – if it occurs – galvanotaxis is presumably outweighed by the gear towing speed of about 4–5 knots (2.1–2.6 m s–1) (Poos et al., 2020; Rijnsdorp et al., 2020b). Startle responses or even attraction or repulsion could occur, however, if fish sense the electric field besides or above the electrode arrays.
Here, we investigate behavioural response thresholds of marine fish to the pulsed electric field used by commercial pulse trawlers. For the behavioural measurements, fish were placed in a large circular tank with seven, individually controlled, evenly spaced electrode pairs, spanning the diameter of the tank. Absence or presence of a behavioural response was assessed from camera recordings for different electrical stimulation amplitudes and for different positions of the fish relative to the stimulating electrodes. Any visible change in behaviour, e.g. changing speed or direction of swimming, during the stimulation period was scored as a response. To assess field strength thresholds, pulse amplitude and choice of stimulation electrodes was varied according to a modified staircase procedure (Treutwein, 1995; Leek, 2001). Computer simulation of the electric field, verified with measurements in the experimental setup, was subsequently used to determine the electric field strength at the animal’s location.
We quantified response thresholds in two electroreceptive species, small-spotted catshark and thornback ray (Raja clavata) (Kalmijn, 1971), as well as three non-electroreceptive species, European seabass (Dicentrarchus labrax), turbot (Scophthalmus maximus), and common sole. These species represent round fish and flatfish as well as bycatch and target species of the pulse-trawl fishery, and inhabit areas trawled by pulse vessels (Heessen et al., 2015). In addition, small-spotted catshark, European seabass, and common sole have previously been studied in electrotrawling research, albeit with a focus on injuries (Soetaert et al., 2016b; Desender et al., 2017; Soetaert et al., 2018). Although many fish species with different body shapes and sizes may encounter pulse trawls, our aim is to quantify individual and species-specific behavioural thresholds and compare electroreceptive with non-electroreceptive species to make a first assessment of behavioural sensitivity differences. To translate the measured response thresholds to a behavioural ‘safety zone’ around commercial fishing gear, we compare threshold field strengths to simulation of the electric field around the fishing gear. This way, we can estimate the distance relative to commercial gears at which fishes may be impacted by the electric fields.
Small-spotted catshark were caught using short (∼20 min) fishing hauls with a beam trawl by the RV Belgica. Thornback ray were caught by commercial beam trawlers. They were collected on the North Sea by scientists of the Flanders Research Institute for Agriculture, Fisheries and Food (ILVO) and transported to the ILVO laboratory facilities in Ostend (Belgium). After at least five weeks, animals were transported to the Carus Aquatic Research facility of Wageningen University in Wageningen (the Netherlands). Turbot were caught by commercial pulse trawlers on the North Sea and first housed at Wageningen Marine Research location Yerseke (the Netherlands) and after at least five weeks transported to Wageningen. European seabass were acquired from the aquacultured stock at Écloserie Marine de Gravelines Ichtus (Gravelines, France) and common sole were acquired from the aquacultured stock of Stichting Zeeschelp (Kamperland, the Netherlands).
All fish were housed in a climate-controlled room in tanks containing aerated, artificial seawater (demi water with Aquarium Systems Reef Crystals sea salt) in closed circulation systems, at a 12:12 h light:dark regime. Water quality parameters were monitored daily, including ammonium, nitrite, and nitrate (MQuant) as well as pH, temperature, salinity, and conductivity (multi-parameter portable meter, MultiLine Multi 3630 IDS). Water was partially changed when ammonium, nitrite, or nitrate levels exceeded 0.5, 0.15, or 100 mg L−1 respectively. Water temperature, salinity, conductivity, and pH were 15.6 ± 1.3°C, 34.1 ± 1.6 ppt, 5.3 ± 0.2 S m–1, and 7.6 ± 0.3 respectively (mean ± SD). Small-spotted catshark, thornback ray, common sole, and turbot were housed in tanks with sediment (0.5–1 mm grain size for the first three species and 4–8 mm grain size for the latter species) to allow for natural behaviour (Filer et al., 2008; Gibson et al., 2015; Greenway et al., 2016). European seabass was housed in a cylindrical tank without sediment to prevent damage. Animals were acclimated to laboratory housing conditions at least one month prior to experimentation and were fed by hand, two-to-three times per week, also during the experimental period (Supplementary 1).
Collection of fishes and subsequent experimental procedures were approved by the Animal Welfare Body of Wageningen University, the Animal Ethics Committee of Wageningen University & Research, and the Dutch Central Authority for Scientific Procedures on Animals (application number AVD1040020184945; experiment number 2017.W-0080.001 and 2017.W-0080.002) as well as the ethical committee of ILVO (reference number EC 2018/322) and the Animal Welfare Service of the Flemish government (DWZ/WVdS/18/115/44). All experiments were done in the Netherlands.
The experimental setup consisted of a circular tank, 2.5 m in diameter, filled with 25 cm artificial seawater, connected to an external filtration system (EHEIM type 2260 bucket filter). The bottom was covered with white ceramic tiles to enhance contrast between the animal and background. The tank was aerated in-between measurement sessions. Water quality parameters were monitored at the start and at the end of the experimental procedure and remained stable and similar to the housing tanks. Ammonium, nitrite, and nitrate levels were 0.03 ± 0.1, 0.02 ± 0.02, and 13.8 ± 11.7 mg L−1 respectively. Water temperature, salinity, conductivity, and pH were 15.4 ± 1.3°C, 34.6 ± 0.8 ppt, 5.3 ± 0.1 S m–1, and 8.1 ± 0.1 respectively.
To record fish behaviour, we used a Basler ace acA2040-90um NIR camera (2048 × 2048 px; images binned 2 x 2 at 25 fps) with a Kowa C-mount LM8HC F1.4 8 mm lens, and a ø55 mm UV filter (Hama) for protection against spray water and salt. The camera was placed centrally at 230 cm above the bottom of the tank. Four halogen floodlights (400 W each) at a height of ~2.5 m and at ~1.5 m from the side of the tank illuminated the experimental arena. To create a soft-box effect and minimise external disturbances, white cotton sheets were placed around and above the experimental setup.
Fourteen electrodes were evenly spaced around the circumference of the tank, at a distance of 115 cm from the centre. Each electrode consisted of a brass rod, 6 mm in diameter, insulated with 1 mm thick heat-shrink tubing, apart from 10 cm at the tip, with the exposed part placed in the middle of the water column. Electrical stimulation was generated between a single pair of opposite electrodes, depending on the location of the fish. Electric field strengths were varied by the choice of electrode pair and the amplitude of the generated pulses. The electrical stimulus was generated by a custom-made, computer-controlled pulse generator connected to a DC power supply (60 V, 5 A; TENMA 72-2940) and a 22000 μF capacitor (63 V; EPCOS B41560-A8229-M). Pulse timings and selection of the output electrodes were controlled by means of a National Instruments PCI-6221 data acquisition card (VHDCI front connection type), connected with a SHC68-68-EPM 2 m cable to a SCB-68A interface. Pulse amplitudes were determined by the voltage of the power supply, under computer control. Pulse generation and image acquisition were programmed in Python (Python Software Foundation, n.d.) in combination with OpenCV. For each stimulation, the program saved settings and timing of the stimulus as well as camera images at the start and end of the stimulus for precise measurements of the animals’ location.
The electrical stimulus consisted of a rectangular-shaped Pulsed Bipolar Current (Soetaert et al., 2019) at a pulse frequency of 45 Hz and pulse width of 0.3 ms (2.7% duty cycle), similar to those used in pulse systems for targeting common sole (Soetaert et al., 2015a; Soetaert et al., 2015b; Soetaert et al., 2019; ICES, 2020a). We used a stimulus duration of 3 s to provide ample response time, which is about a factor of 2 longer than exposures to commercial fishing gears with 4 m long electrode arrays (Soetaert et al., 2016a; Soetaert et al., 2019) towed at about 5 knots (van Marlen et al., 2014; Depestele et al., 2019; Poos et al., 2020; Rijnsdorp et al., 2020b).
To determine the local strength of the pulsed electric field in the experimental tank, we used the AC/DC package in COMSOL Multiphysics (COMSOL Multiphysics® v5.4.0.246, n.d.) to numerically simulate the field for a single electrode pair (Figure 1). Water conductivity was set at 5 S m–1, and steady-state field strengths were calculated for a 10 V pulse. Computer simulation was verified with measurements of local field strengths in the experimental setup (Supplementary 2), and was used to determine the local electric field strengths at the start time of stimulation.
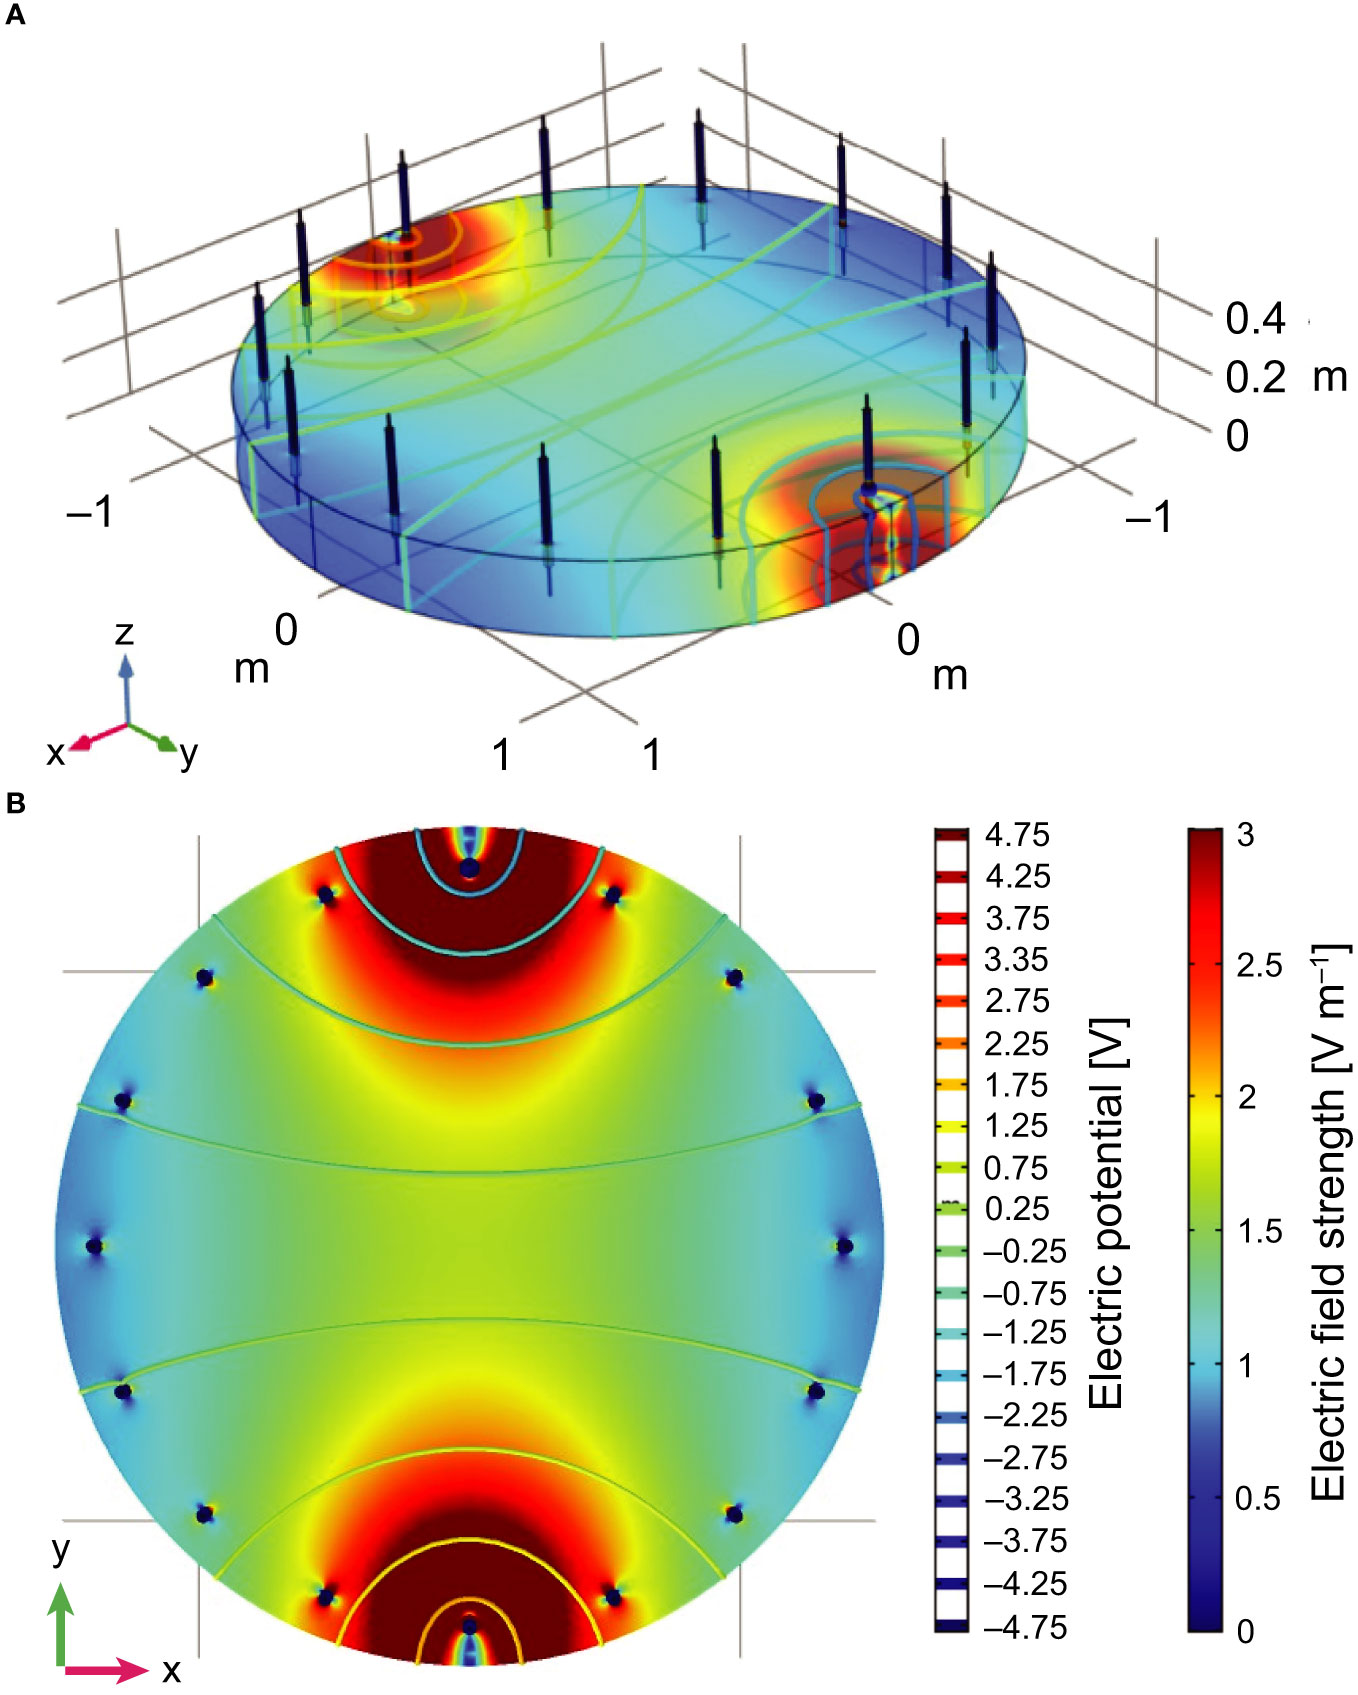
Figure 1 Schematic representation of the experimental setup in combination with the numerical simulation data of the electric field between one electrode pair showing the equipotential lines (–5 V to 5 V) and electric field strengths in V m–1. All distances are shown in metres. (A) Three-dimensional view and (B) horizontal cross-section taken at 5 cm from the bottom (i.e. z = 0.05 m). Field strength values are clipped at 3 V m–1.
All experiments were performed in the same setup, for one individual at a time. A series of measurements consisted of 20–277 stimulations, lasting about 2–5 hours. Before each measurement series, electrodes were lightly sanded to remove any corrosion (Stewart, 1973). Animals were transferred from the housing tank to the experimental setup in a net, which was submerged in a water-filled transportation tub. The animals were acclimated to the experimental setup until displaying normal behaviour, with a minimum of 30 min.
To determine a threshold, we used a modified staircase procedure (Cornsweet, 1962; Treutwein, 1995; Leek, 2001). The procedure started with a 5 V stimulus on an electrode pair expected to give no response, based on pilot measurements for each species. After absence of a response, pulse amplitude was increased by 5 V. When the fish showed a response but did not change position, we further increased the field strength until the fish moved to a new location, where we could start a new threshold assessment staircase. In case the maximum value of 60 V elicited no response, an electrode pair closer to the fish was chosen. In cases of doubt, e.g. for minimal changes of swimming speed or direction, we lowered stimulation strength to re-assess the threshold. The time between stimuli was at least 20 s in case no response was observed. After a response, we waited until the animal resumed normal behaviour, with a minimum of 30 s. Measurements stopped after at least ten response staircases were gathered or if prolonged swimming behaviour prevented reliable measurements. A measurement session was performed by one of two persons conducting the experiments. One person checked all responses from camera images afterwards. Body length was either measured with a measurement board (Rabone Chesterman No 47R mounted on a measuring board) for European seabass and common sole, or from camera images for small-spotted catshark, thornback ray, and turbot. We measured standard length for European seabass, turbot, and common sole and total length for small-spotted catshark and thornback ray (Supplementary 3).
The number of specimens available per species differed because of supply-and-housing-space limitations, and the use of some individuals in pilot measurements to design and optimise our experimental setup and measurement protocol. For the finalised protocol, we started measurements with seven small-spotted catshark, six thornback ray, nine European seabass, seven turbot, and seven common sole. Each specimen was used in only one measurement series conducted in a single day. For one small-spotted catshark and two turbot, we aborted the measurement series due to prolonged, high swimming activity making it too difficult to perform the measurements. These animals were excluded from subsequent analyses due to a lack of measurement points. Reliable threshold measurements were obtained for five up to nine specimens per species.
Photographs taken at the start of the stimulus were used to determine the location of the fish with respect to the active electrode pair in ImageJ (Schneider et al., 2012). For the location of the fish, we used the point on the body closest to one of the active electrodes, corresponding to the highest field strength. Measured coordinates in pixels were transformed into actual world coordinates taking lens projection and refraction at the air-water interface into account. Hereto, a ruler spanning the diameter of the tank, was placed in the tank and digitised. For thornback ray, turbot, and common sole, we placed the ruler at a depth of 1 cm from the bottom of the tank while for small-spotted catshark and European seabass we used a depth of 5 cm. The electric field strength at the fish’s location was determined based on numerical simulation of the electric field in the setup (Figure 1) at a resolution of 0.5 cm, scaled by the actual stimulus amplitude. Model simulation and linear scaling of field strengths with stimulation amplitude were verified by recordings of field strengths at different locations and for different stimulation amplitudes (Supplementary 2).
Examples of the staircase sequence for an electroreceptive and non-electroreceptive species is shown in Figure 2A. Based on these raw data, we first estimated the probability of an individual to respond to an electrical stimulus by fitting the response (0 or 1) as a function of the electric field strength in a Bayesian Bernoulli generalised linear mixed model (Equation 1) (Figure 2B). The model estimates individual-specific intercepts and slopes on the electric field strength to quantify individual-specific response curves. Additional variables included stimulus number and observer identity as random intercepts to account for potential habituation to the stimulus, as well as between-observer variation, respectively:
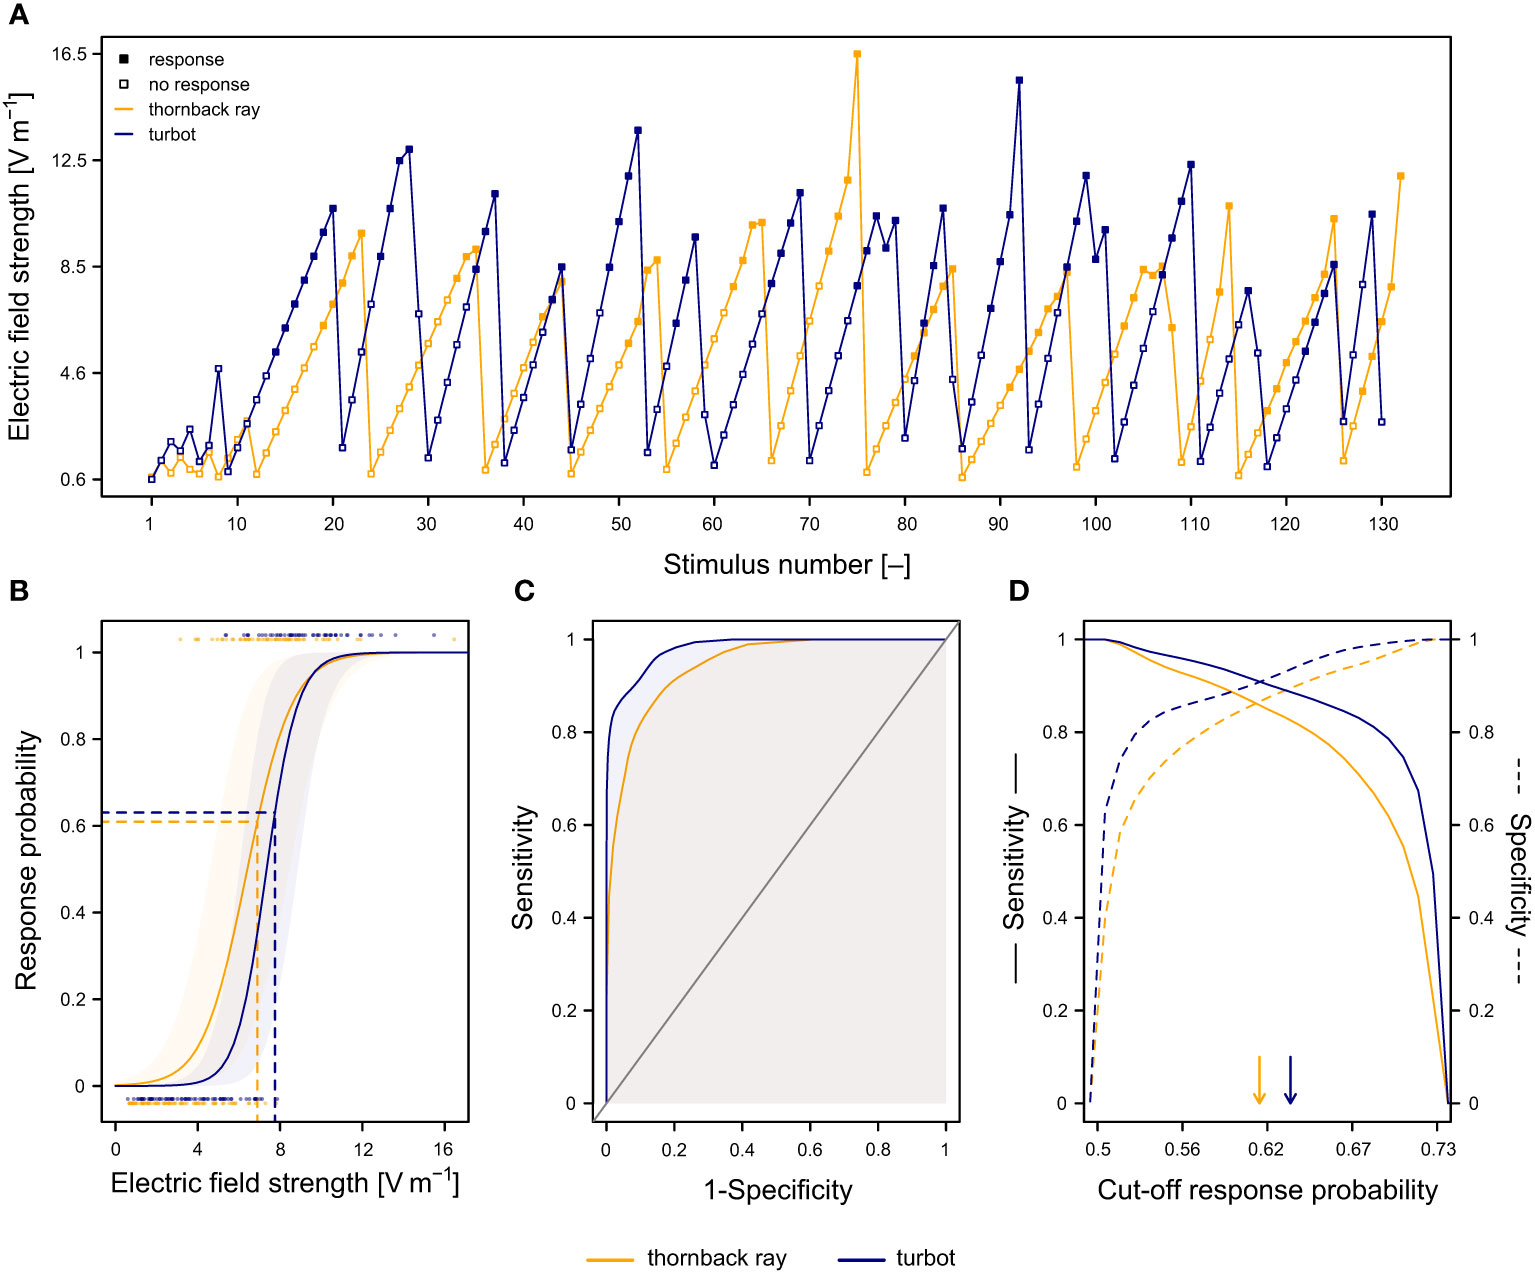
Figure 2 Individual responses to the electrical stimulus and corresponding receiver-operating characteristic (ROC) analysis for an electroreceptive (thornback ray; orange) and non-electroreceptive (turbot; blue) specimen. (A) Staircase sequence of stimulus strengths with the corresponding responses (open and filled squares for absence or presence of a response respectively). (B) Response probability (± 95% CI) as a function of electric field strength (individual response curve). Dots at the bottom and top indicate the raw data for absence or presence of a response respectively as shown in (A). Horizontal dashed lines indicate the optimal cut-off probability determined using the ROC-analysis shown in (D). The vertical dashed lines indicate the corresponding mean electric field strength threshold. (C) ROC curve or true positive rate (sensitivity) as a function of false negative rate (1−specificity). General model performance was calculated as the area under the ROC curve (AUC; shaded area). (D) True positive rate (sensitivity) and true negative rate (specificity) as function of cut-off response probability. The optimal cut-off response probability was defined as the cut-off with the highest Youden Index, specifying the highest sum of sensitivity and specificity (arrows).
where corresponds to the binary response (0: no response, 1: response) of the ith individual during the nth stimulus number, to the stimulus-number-specific intercept, to the observer-specific intercept, and to the individual-specific intercept. corresponds to the electric field strength experienced by the ith individual during the nth stimulus number. We used priors for the individual-specific intercepts and slopes on the electric field strength. For stimulus number and observer identity, we used a prior, each with the common standard deviation σ ~ Student -. Three Markov Chain Monte Carlo (MCMC) simulation chains were run for 1,500,000 iterations, with a burn-in of 500,000 and a thinning of 1,000. Convergence was assessed by visual examination of the traces and by checking that .
Second, we performed a receiver-operating characteristic (ROC) analysis on the individual response curves to determine the optimal cut-off probability (optimal decision threshold) (Krzanowski and Hand, 2009). For this, we calculated the true positive rate (sensitivity), true negative rate (specificity), as well as the area under the ROC curve (AUC) for cut-off values ranging from 0 to 1 (Figures 2C, D). The AUC is a measure of the general model performance across all cut-off values (Krzanowski and Hand, 2009). The optimal cut-off response probability was then defined as the cut-off with the highest Youden Index, specifying the highest sum of sensitivity and specificity, as indicated by the arrows in Figure 2D and horizontal lines in Figure 2B (Krzanowski and Hand, 2009). For values above the optimal cut-off probability the model predicts a response, otherwise an absence of a response. The electric field strength threshold corresponds to the field strength at this optimal cut-off probability (dashed lines in Figure 2B). The above procedure was repeated for all MCMC samples of the estimated posterior distribution, to provide an individual-specific confidence interval of the cut-off probability, as well as of the corresponding field strength threshold. Response curves, ROC curves, and sensitivity and specificity as function of cut-off response probabilities for all specimens are listed per species in Supplementary 4.
Finally, to compare response thresholds among species, individual-specific thresholds were fitted as a function of species and body length in a Bayesian Gaussian model (Equation 2):
where corresponds to the posterior mean response threshold of the ith individual, to the overall intercept, to the species, and to the body length of the ith individual. is the residual standard deviation. The inclusion of body length enables us to estimate species-specific response thresholds that are independent of within-species variation in body length. We used priors for all fixed effects (i.e. species and body length) and the same MCMC specifications and convergence assessment as for Equation 1.
The difference in response thresholds between electroreceptive and non-electroreceptive species was quantified by pooling the posterior estimates of the species-specific response thresholds for electroreceptive and non-electroreceptive species together. We subsequently calculated the difference between a random posterior sample (n = 1000) of each category.
All response-threshold analyses were carried out in a Bayesian framework using the JAGS package (Plummer, 2003) in R v4.1.2 (R Core Team, 2021). The models were fitted using the rjags and R2jags packages (Plummer, 2019; Su and Masanao, 2020).
To compare measured thresholds to the electric field strength around a pulse trawl gear and determine a maximum distance from electrode arrays at which fish species may be affected, we simulated the electric field around a pair of electrode arrays as used in pulse trawling for common sole (Figure 3) (COMSOL Multiphysics® v5.4.0.246, n.d.). Pulse gear electrode arrays run in parallel from the pulse modules attached to the beam or PulseWing (Delmeco Group B.V. or HFK Engineering B.V. pulse gear manufacturer respectively) to the ground rope of the net (Soetaert et al., 2019; Rijnsdorp et al., 2021). Electrode arrays consist of connected conductive parts of 12.5 cm long and ø3 cm, separated by 22 cm long, insulated parts (Soetaert et al., 2019). Large trawlers have 24–28 electrode arrays over a beam width of 12 m, small trawlers typically have 10 electrode arrays over a beam width of 4.5 m (Depestele et al., 2016; Rijnsdorp et al., 2020a; Rijnsdorp et al., 2021). Neighbouring electrode arrays act as an anode-cathode pair. All pairs are activated at the same frequency, but pulses are alternated in time and, therefore, different pairs do not interact. To describe the electric fields around a pulse gear, simulating one electrode array pair suffices. We simulated a pair of electrode arrays 41.5 cm apart, similar to the distance in commercial gears (Soetaert et al., 2019). The electrode arrays were placed at the interface between water (5 S m–1) and sediment (0.5 S m–1). Steady-state electric field strengths were determined for a stimulation peak of 60 V, similar to the maximum voltage setting for commercial gears (Rijnsdorp et al., 2020a).
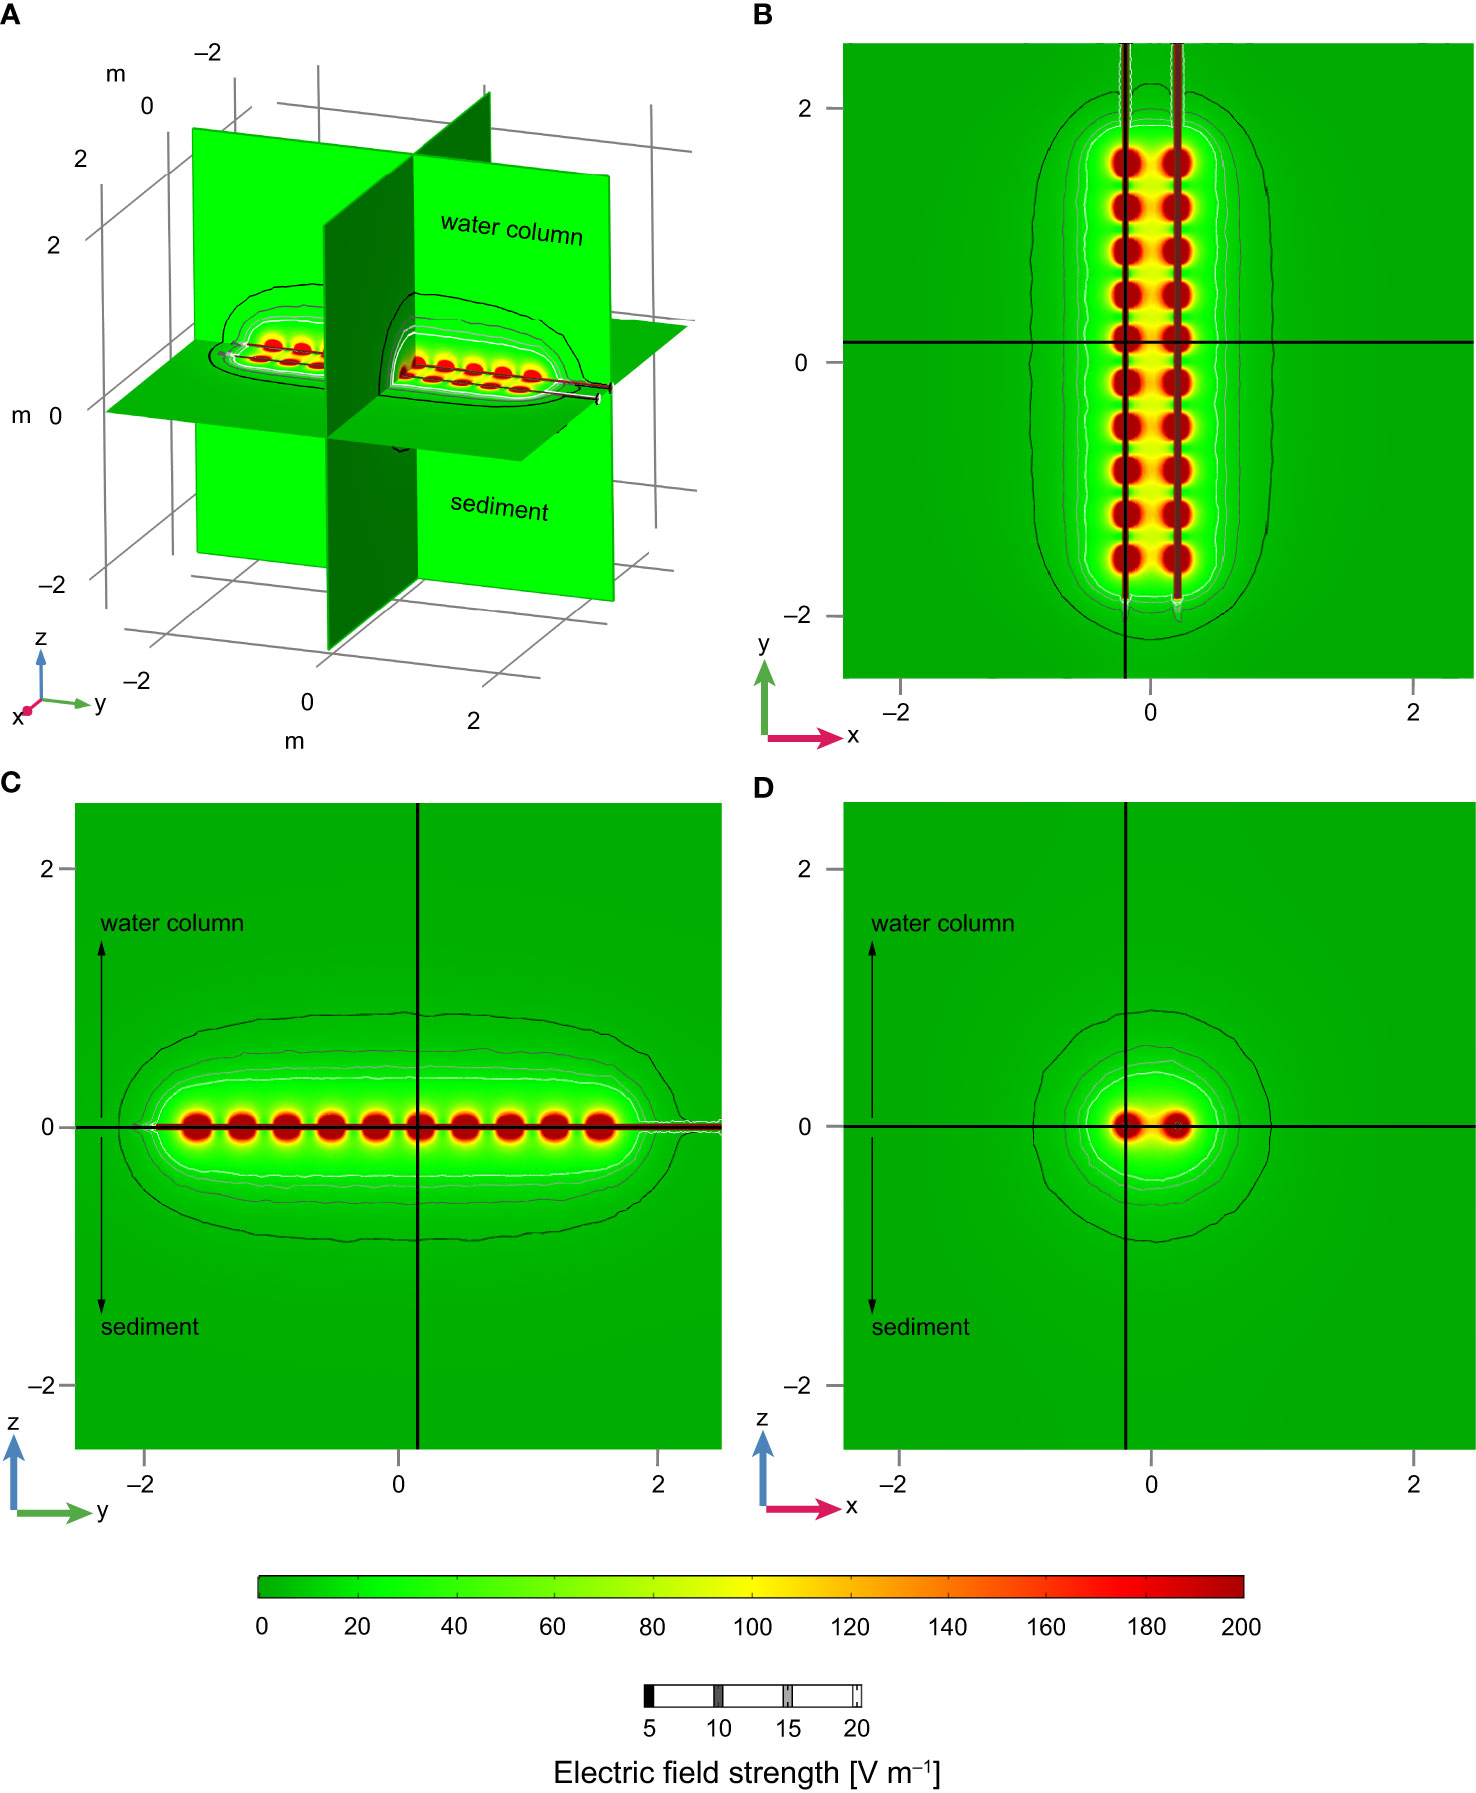
Figure 3 Contour plots with the numerical simulation data of the electric field strengths around a pair of commercial electrode arrays separated at 41.5 cm and computed at a steady-state of 60 V. All distances are shown in metres. (A) Three orthogonal planes through the electrode array pair. These views are shown in panels (B–D) where the thick black lines indicate the locations of the planes shown in the other panels. (B) Horizontal cross-section at z = 0. (C) Vertical cross-section through one of the electrode arrays. (D) Vertical cross-section orthogonal to the electrode arrays. Field strength values close to the electrodes are clipped at 200 V m–1. Contour lines indicate equal field strengths at 5, 10, 15, and 20 V m–1 (thin lines from black to white). Positive and negative z-values are the water column and sediment respectively.
Responses varied, ranging from small fin movements or minimal movements of body parts that were closest to the electrode, to muscle twitches, a full escape by a swimming bout, and whole-body muscle contractions. At relatively low stimulus strengths, animals remained stationary but showed minor body part movements such as with their fins. Thornback ray and small-spotted catsharks were observed to sometimes close an eye during an electrical stimulus. At increasing stimulus strengths, animals would reposition slightly on their spot. At the higher spectrum of stimulus strengths, animals would displace and swim around in the tank. If animals were already swimming during a stimulus, one could observe minor deviations in their swimming path and speed. Flatfishes and thornback ray seemed more likely to remain stationary after responding to the electric field in contrast to small-spotted catshark and European seabass, which had the tendency to start swimming. In a few instances of relatively high field-strength exposure, we observed whole-body muscle contractions in all species. Common sole bended into a U-shape, turbot would bend only slightly, and thornback ray would fold/curl up its wings. In European seabass and turbot, we observed distended opercula and protrusion of the mouth when exposed to high stimulus strengths. In general, however, animals showed similar behavioural patterns throughout a recording session. After measurements, animals resumed normal behaviours including feeding. Small-spotted catsharks deposited (fertilised) eggs before and after the experimental procedure. No mortality was observed.
General model performance across all cut-off values estimated as the area under ROC-curve (AUC) was high for all individuals at 0.95 ± 0.03 (mean ± SD; Supplementary 5). The effect of habituation on the response of an individual to the electrical stimulus was negligible (αpost.mean = 0.000; 95% CI: −0.204–0.243). Likewise, there was no significant difference in the estimated response probability between the observers (αpost.mean = 1.931, PMCMC = 0.336). The estimated individual-specific electric field strength thresholds varied between 3.4–14.9 V m–1 with a mean of 7.3 V m–1 (95% CI: 4.1–12.4) (Figure 4). The mean within-individual variation of the estimated field strength thresholds was relatively small (SD of 0.13 V m–1) compared to the mean between-individual variation (SD of 2.36 V m–1). Body length did not significantly influence the individual-specific field strength thresholds (βpost.mean = 0.067, PMCMC = 0.285).
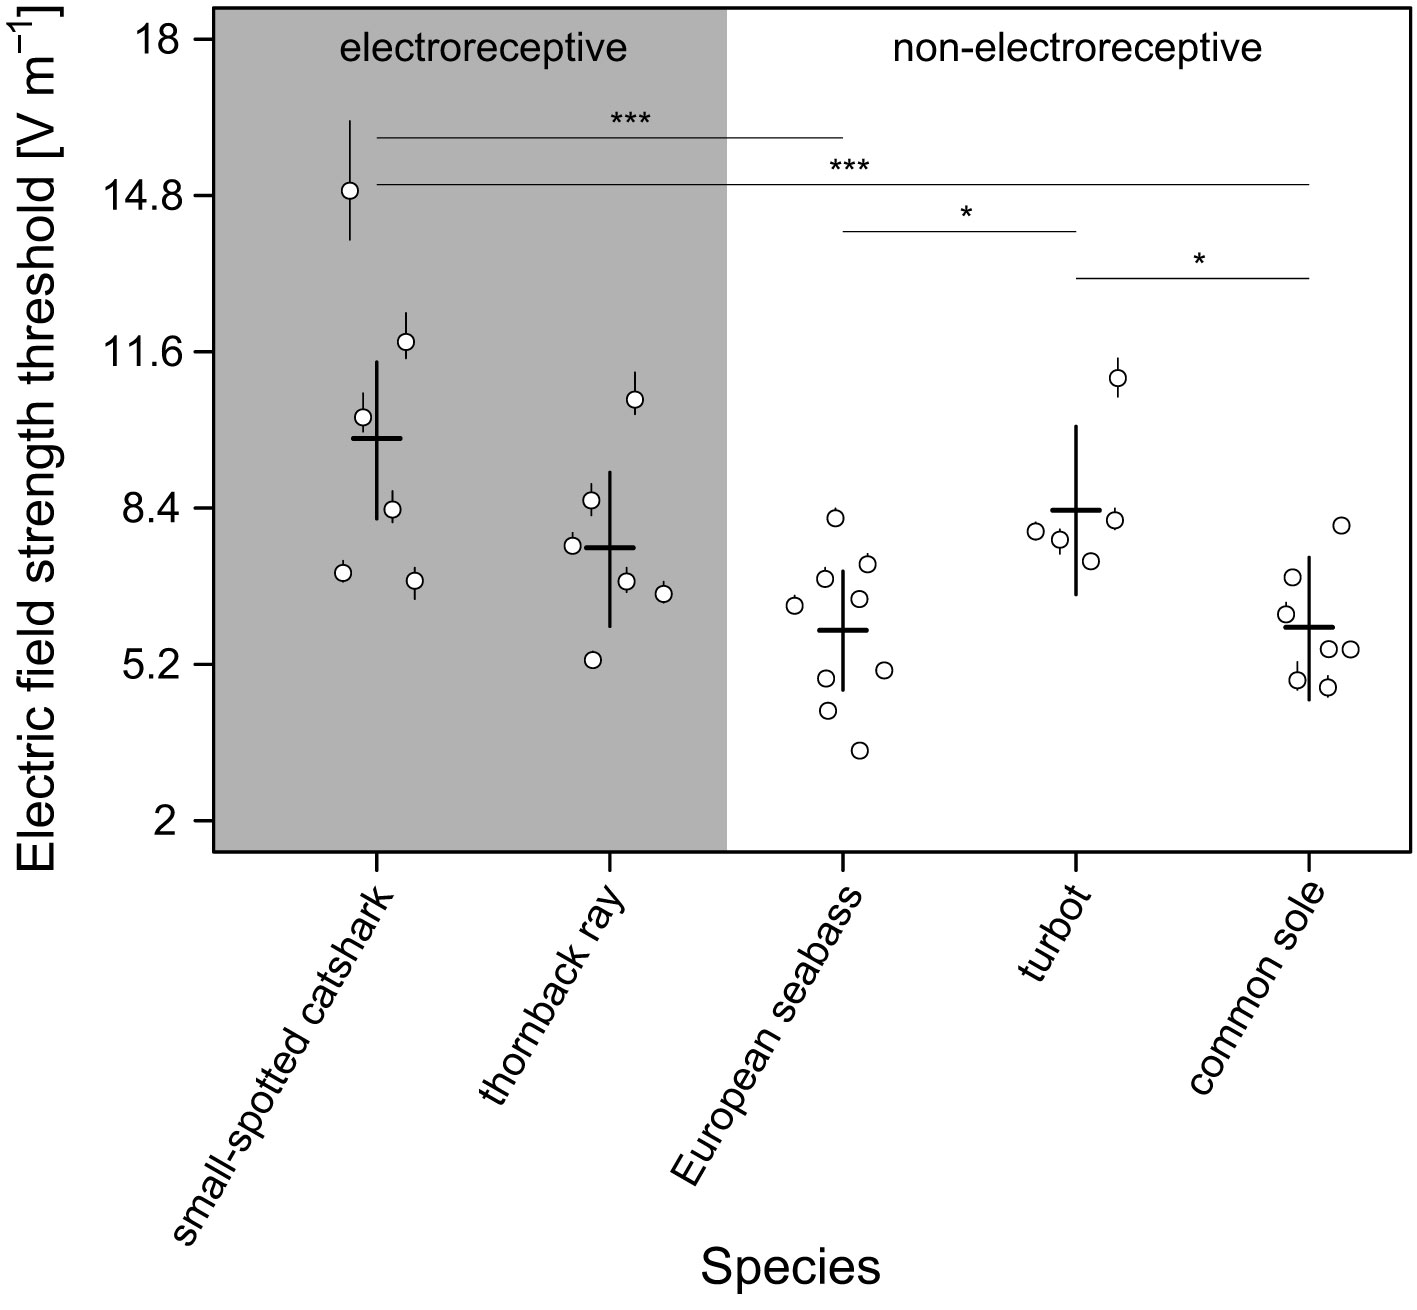
Figure 4 Mean individual-specific (open circles) and species-specific (horizontal line segments) electric field strength thresholds with 95% CI (vertical line segments) for a behavioural response. Species-specific thresholds were predicted for the species-specific mean body length (small-spotted catshark = 58 cm; thornback ray = 51 cm; European seabass = 30 cm; turbot = 27 cm; common sole = 30 cm), and thus, accounts for within-species variation in body length. Small-spotted catshark had a significantly higher electric field strength threshold compared to European seabass and common sole. Turbot had a significantly higher response threshold compared to European seabass and common sole. We found no significant difference in response threshold between electroreceptive and non-electroreceptive fish species. Significance codes: PMCMC ≤ 0.001 ***; 0.01< PMCMC ≤ 0.05 *.
Thresholds (mean; 95% CI) were lowest for the non-electroreceptive European seabass (5.9 V m–1; 4.7–7.1) and common sole (6.0 V m–1; 4.5–7.4), and highest for the electroreceptive small-spotted catshark (9.8 V m–1; 8.2–11.4) (Figure 4). The electroreceptive thornback ray (7.6 V m–1; 6.0–9.1) and non-electroreceptive turbot (8.4 V m–1; 6.6–10.1) showed intermediate sensitivities. Although thresholds were in the same range, pair-wise comparisons of the field strength thresholds between species showed some significant results. Notably, small-spotted catshark was significantly less sensitive than European seabass (βpost.mean = −3.929, PMCMC = 0.001) and common sole (βpost.mean = −3.867, PMCMC = 0.001) (Figure 4). Furthermore, turbot was significantly less sensitive than European seabass (βpost.mean = −2.458, PMCMC = 0.027) and common sole (βpost.mean = −2.397, PMCMC = 0.037). However, we found no significant difference in sensitivity between electroreceptive and non-electroreceptives species (βpost.mean = 1.921, PMCMC = 0.332).
The electric field around a commercial electrode array pair of a pulse trawl gear is heterogeneous, with highest field strengths close to the electrodes (Figures 3, 5). Electric field strength quantifies the gradient in voltage (V m–1) and determines the current for a specified conductivity of the medium. The electric field strength, as created by the source voltage, is proportional to the voltage and is inversely related to the square of the distance from the source. The electric field shape created by an electrode array pair is a complex function of the size and shape of the electrodes, conductivity of the medium, and the spatial layout of the electrodes (Figures 3, 5). Electric field strengths are similar in the water column and in the sediment and are largely independent of the conductivity of the sediment (Figures 3, 5). Close to the electrode, electric field strengths reach values of 200 V m–1 and show a strong modulation along the length of the array, with high values close to the electrodes and lower values near the insulators. At larger distances, modulations in the longitudinal directions disappear. Field strengths drop below a value of 10 V m–1 at a distance of about 50–60 cm from the electrode and below 5 V m–1 at about 70–90 cm (Figure 5). This decline is slightly steeper in the horizontal direction than in the vertical direction.
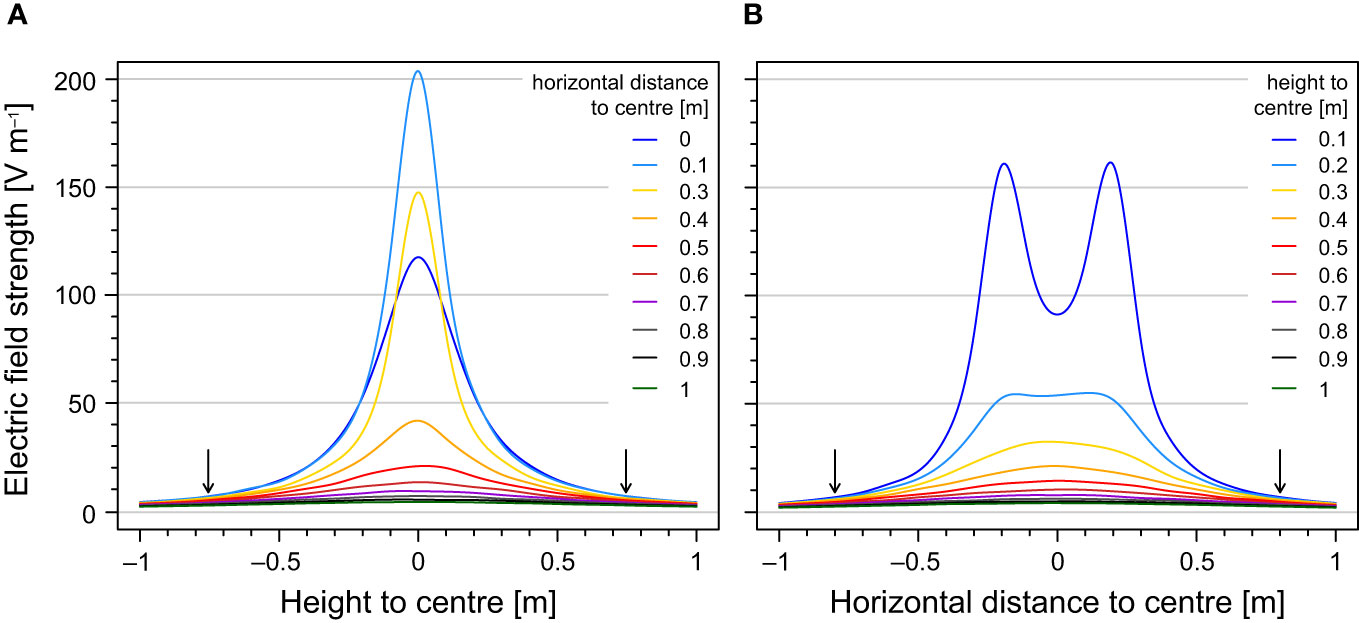
Figure 5 Electric field strengths as a function of (A) height relative to the seabed (z-axis in Figure 3) for different horizontal positions relative to the centre of an electrode pair (along the x-axis in Figure 3). Electric field strengths as a function of (B) horizontal distance to the centre of an electrode pair (x-axis in Figure 3) for different heights above the electrodes in the water column (z-axis in Figure 3). The electrode pair is situated at the interface between water column and sediment (i.e. height of 0 m) and at 41.5 cm apart (i.e. the electrode cores at –19.25 and 19.25 cm on the horizontal distance to the centre). Sections through the electrodes were left out because zero field strength values in the electrodes and high values around the electrode distorted the view on low values in which we are interested. The horizontal-distance-to-centre value 0.2 m and height value 0 m are therefore not shown in panel (A, B) respectively. The arrows indicate the mean fish response threshold of 8 V m–1.
To estimate the threshold distance of the fish relative to the electrode pair, we quantified the electric field strengths along the horizontal and vertical axis and compared these with our behavioural thresholds. Based on the mean behavioural response thresholds of about 6–10 V m–1, the maximum distance at which studied species are expected to show a response is about 60 cm to an electrode in the horizontal direction and 80 cm in the vertical direction, with little interspecies variation.
Understanding fish behaviour in response to fishing gear deployment can provide valuable insights into e.g. capture mechanisms and selectivity (Wardle, 1986; Fernö, 1993; Winger et al., 2010; Gibson et al., 2015; Robert et al., 2020). Here, we studied behavioural responses to pulsed electric fields used for stimulation in pulse trawling, which potentially extend well beyond the boundaries of the fishing gear. We quantified response thresholds for electric field strengths of two electroreceptive and three non-electroreceptive marine species, under controlled laboratory conditions. These thresholds were subsequently compared to the numerically-simulated electric field around a commercial electrode array pair to determine a safety zone where fish are expected not to respond to the field.
We observed various responses during electrical stimulation, corroborating previous results for small-spotted catshark, European seabass, and common sole (Stewart, 1977; de Haan et al., 2009; Soetaert et al., 2016b; Desender et al., 2017; Soetaert et al., 2018). For common sole, the observed body bending during exposure to high field strengths resembles the Omega jump, described by Kruuk (1963) as an escape move from the sediment. Body bending during high-frequency, high-field-strength electrical stimulation was also observed in dab (Limanda limanda) (de Haan et al., 2015) and in European plaice (Pleuronectes platessa), European flounder (Platichthys flesus), brill (Scophthalmus rhombus), and lemon sole (Microstomus kitt) (Stewart, 1977). This body bending during muscle contractions is presumably the consequence of asymmetrical muscle distribution in flatfish between the eyed and blind side. Distended opercula and protrusion of the mouth in European seabass and turbot indicate that the axial swimming muscles, which are used by fish for suction feeding (Camp et al., 2015; Jimenez and Brainerd, 2020), contract during electrical pulsing. Overall, however, we saw few signs of discomfort. Small-spotted catshark continued depositing eggs after the measurements, as also observed by de Haan et al. (2009). Experimental animals resumed normal feeding after the measurements and no mortality was observed, as has been reported for small-spotted catshark, European seabass, common sole, and Atlantic cod exposed to similar electrical waveforms, but at higher electric field strengths (de Haan et al., 2009; de Haan et al., 2016; Soetaert et al., 2016a; Soetaert et al., 2016b; Desender et al., 2017; Soetaert et al., 2018). Our findings show that fish can respond to the electric fields before encountering high, immobilising field strengths. They also suggest that behavioural responses can be absent until field strengths reach levels where involuntary responses kick in.
Behavioural response thresholds for the studied species varied between 6.0 and 9.8 V m–1. To our knowledge, these are the first quantitative behavioural threshold values reported in the context of marine electrotrawling for common sole. Although de Haan et al. (2016) reported that Atlantic cod did not respond when exposed to a field strength of 4 V m–1 but showed muscle contractions at values of ≥37 V m–1, step sizes were not sufficient to quantify a behavioural response threshold. Furthermore, Abrantes et al. (2021) tested the effect of electric fields on largetooth sawfish (Pristis pristis) behaviour and reported reaction distances of <1.2 m to the electrodes but did not quantify the electric field strengths and worked with different electrical waveform characteristics. Few studies have examined the behavioural response of marine fishes to low electric field strengths as the focus has generally been on galvanotaxis/electrotaxis (Bary, 1956; Diner and le Men, 1971; Klima, 1972; Diner and le Men, 1974; Polet, 2010; D’Agaro, 2011), immobilising whole-body muscle contractions referred to as electronarcosis, tetanus, or cramp (Bary, 1956; Diner and le Men, 1971; Diner and le Men, 1974; Stewart, 1977; Polet, 2010; de Haan et al., 2016), and (internal) injuries (van Marlen et al., 2014; de Haan et al., 2016; Desender et al., 2016; Soetaert et al., 2016a; Soetaert et al., 2016b; Soetaert et al., 2016c; Soetaert et al., 2018; Boute, 2022; Boute et al., 2022; Schram et al., 2022; Boute et al., 2023). Bary (1956) studied ‘minimum response values’ based on body jerks (also referred to as muscle twitches) during stimulation in golden grey mullet (Chelon auratus), European flounder, and European seabass of different body lengths, but in a homogeneous electric field with waveforms different from those used in pulse trawling for common sole. Stewart (1975), however, recognised the relevance of these thresholds and evaluated the selectivity of an electrode array system that is towed perpendicularly with respect to the seafloor. Hereto, he converted the golden grey mullet data, expressed in voltage gradient along the fish body, from Bary (1956) to electric field strengths. For a ‘minimal response threshold’, he reported values of about 5 V m–1, which is close to maximum sensitivity in our experiments, with a limited fish-length effect. He subsequently related this threshold to the heterogeneous electric field and reported high reaction probabilities for fish close to the arrays. Although, no response distances with respect to the gear are presented, Stewart (1975) demonstrates the use of response thresholds in gear-selectivity assessment.
We quantified behavioural response thresholds for five marine fish species and found some significant interspecies differences that could not be explained by body length. Intraspecies length variation was, however, limited, which hampers detecting potential effects. Furthermore, these species do not only differ in size, but also in a multitude of other anatomical and morphological properties such as body shape, which may explain some of the interspecies differences in behavioural response thresholds (Emery, 1984). Our main objective was to estimate threshold sensitivities of different species, flatfish and round fish, target and non-target, electroreceptive and non-electroreceptive, of representative sizes. These measured sensitivities provide a first estimate of the distance over which similar fish could be affected around a pulse gear. Investigating a size effect would require larger sample sizes and extended variations in body length. Our data provide no indications that electrical pulsing used for catching turbot caused higher or lower thresholds as compared to the other species.
We found no significant sensitivity difference between the electroreceptive (small-spotted shark and thornback ray) and non-electroreceptive species (European seabass, turbot, and common sole). Electroreceptive fish with ampullary receptors are highly sensitive for electric-field-strength amplitudes as low as 1 x 10⁻⁷ V m–1 (Dijkgraaf, 1963; Kalmijn, 1966; Kalmijn, 1982; Tricas and New, 1998; Peters et al., 2007) but only for a specific frequency range of about 0.1–25 Hz with a maximum sensitivity at around 1–8 Hz (Kalmijn, 1974; Montgomery, 1984; Peters and Evers, 1985; Collin, 2010; Crampton, 2019). Optimal frequency sensitivity of thornback ray ampullae of Lorenzini neurons is at 4 Hz with a relative steep drop in gain at higher frequencies and a gradual fall at lower frequencies to 0.05 Hz (Montgomery, 1984). In small-spotted catshark, Peters and Evers (1985) quantified the frequency sensitivity of the primary afferent neurons (i.e. before the stimuli are processed by the brain) and the respiratory reflex (i.e. after brain processing). They find a higher frequency-sensitivity optimum for the neurons (5–8 Hz with a fall-off of 2.3 and 3.4 dB octave–1 at the low and high frequency side respectively) than for the respiratory reflex (0.1–1 Hz with a fall-off of 2.8 and 11.4 dB octave–1 at the low and high frequency side respectively).
To understand why electroreceptive fishes are apparently insensitive for the pulsed electric fields in our study, one needs to take the frequency content of the stimulus into account. For pulses generated at 45 Hz, with a width of only 0.3 ms, most of the energy is in the high-frequency range. To analyse the mismatch in frequency content of the stimulus and the response characteristics of ampullae, we computed the frequency content of the electrical stimulus using the Fast Fourier transform function in MATLAB (MATLAB, 2018) (Figure 6). The pulse train stimulus in the time domain (Figures 6A, B) contains the fundamental frequency (45 Hz) and its odd integer harmonics series (Figure 6C). The amplitude spectrum shows that the frequency content largely mismatches the frequency sensitivity of the fish, with the larger part of the spectrum in the higher frequency range (>100 Hz), where electroreceptors have poor sensitivity. Although common-sole-targeting pulse trawlers may use lower frequencies down to 30 Hz (ICES, 2020a), the frequency content would still be well above the sensitivity range of the ampullae. In addition, the energy content is shifted to even higher frequencies, as each electrode array may participate in two pairs (except for the two most outer arrays). In this case, the effective frequency is doubled close to the electrodes, where electric field strengths are larger. When operating multiple electrode arrays using pulsed waveforms in close proximity, pulses may have different phases – depending on whether there is a centralised control – and thus create more complex waveforms with high frequencies in the area where the electric fields overlap (Beaumont, 2017; Soetaert et al., 2019).
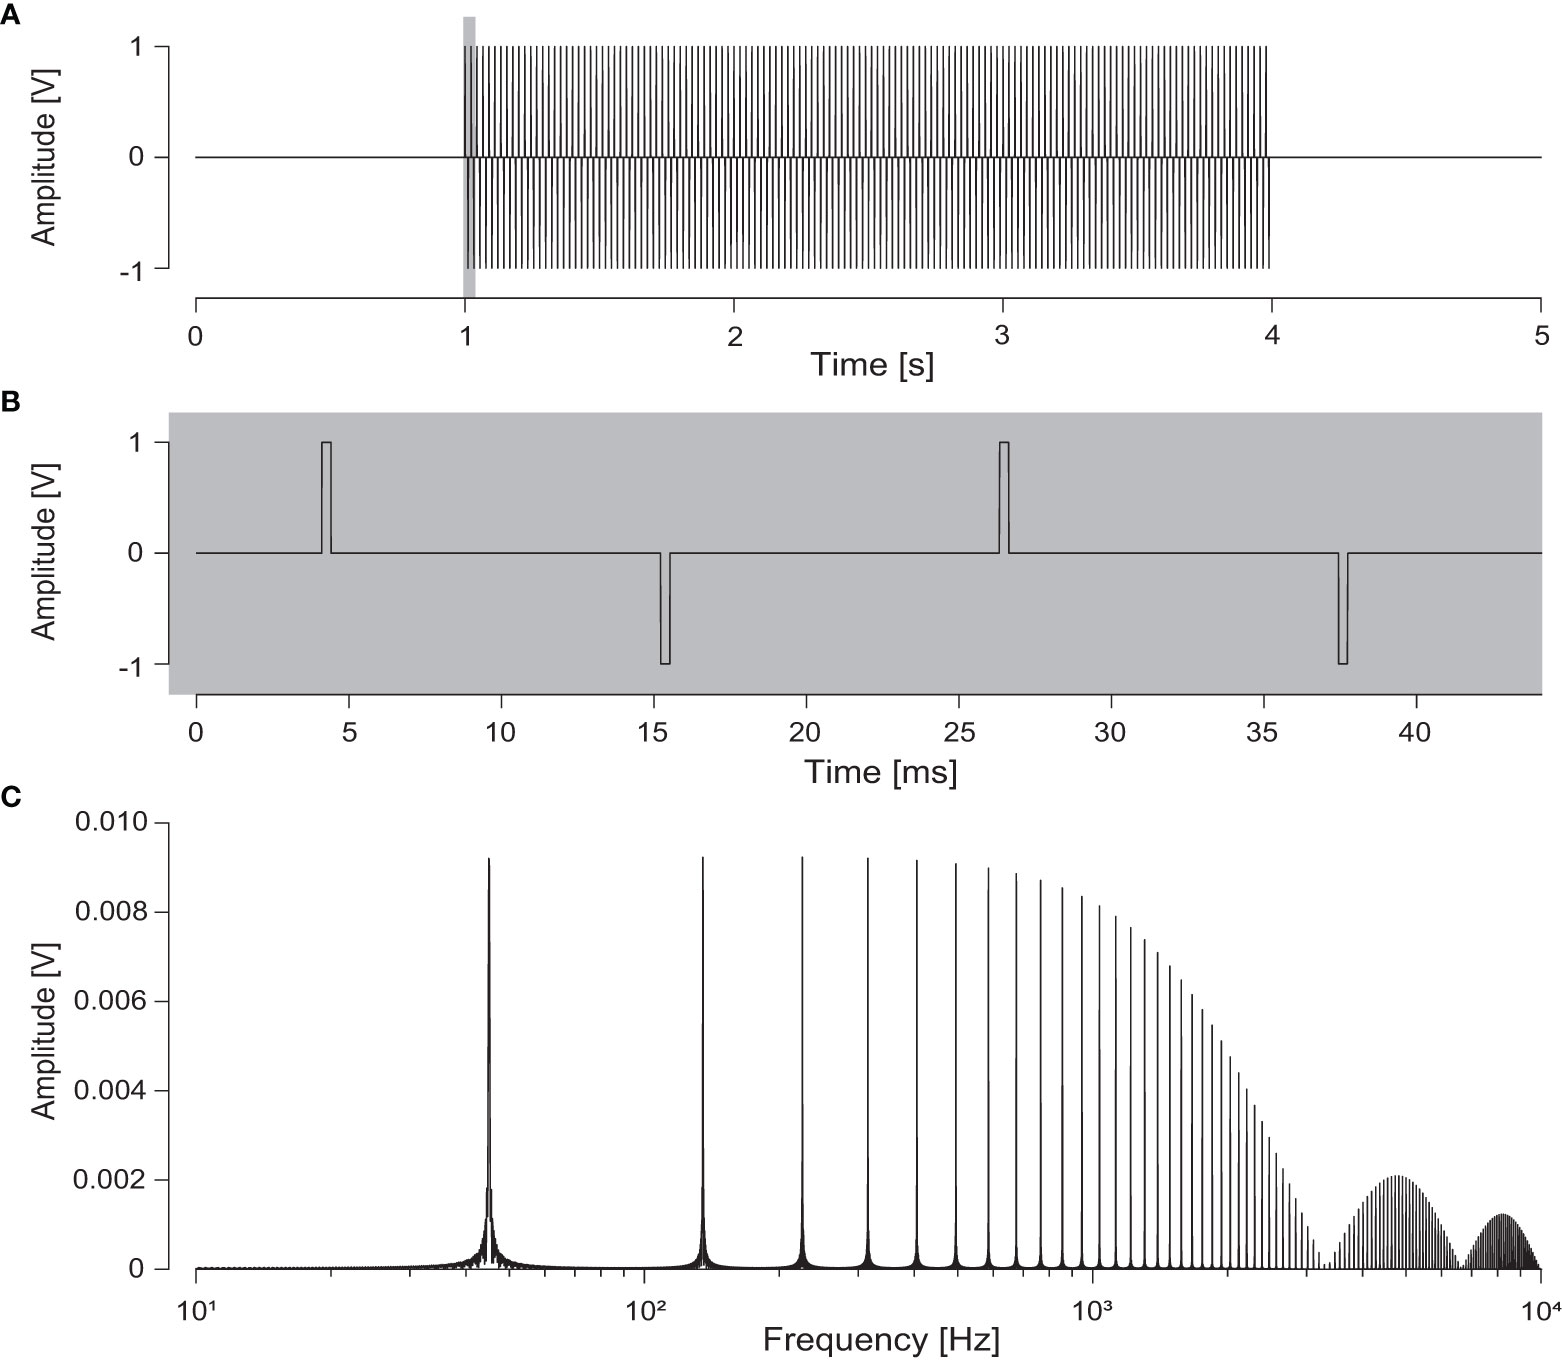
Figure 6 Characteristics of the square-shaped Pulsed Bipolar Current waveform offered at a pulse duration of 3 s. (A) The full 3 s pulse stimulus containing 135 cycles at 45 Hz with a pulse width of 0.3 ms at an arbitrary amplitude of 1 V of which two cycles in the grey shading are enlarged in (B). Pulse waveform is 45 Hz PBC (PW = 0.3 ms, PB = 10.81 ms) sensu Soetaert et al. (2019). (C) Fast Fourier transform spectrum of the waveform in (A) shown until 10000 Hz.
The high-frequency limits for receptor and behavioural responses may thus explain the low sensitivity of the electroreceptive species to the pulsed electric fields. Moreover, the discrepancy between receptor and behavioural responses illustrates that a receptor response at high frequencies does not necessarily evoke a behavioural response. Even if the ampullae of Lorenzini would respond to the lower frequencies, the evoked neural response pattern may not match any pattern of interest to higher processing stages. The shape and size of the electric field could also affect the behavioural response as the ampullae of Lorenzini are tuned to detect bioelectric fields of e.g. small (buried) prey (Bedore and Kajiura, 2013), which have specific size characteristics (Kalmijn, 1982). Both the electric field in our experimental setup and the electric field around the pulse-trawl-gear electrode arrays are larger than that of a potential prey, thus likely unable to elicit a behavioural response of elasmobranchs. Based on the electrical waveform properties of the stimulus used by pulse trawls to catch common sole, in combination with the similarity of measured threshold sensitivities, it seems unlikely that electroreceptive species are more sensitive to the pulsed electric field than non-electroreceptive species.
Numerical simulations show that the electric field around commercial electrode arrays decreases steeply with increasing distance, following an inverse-square law. This matches in situ measurements around various marine electro-array designs (Stewart, 1975; Stewart, 1977; Polet et al., 2005; Murray et al., 2016) including those used to target common sole (de Haan et al., 2016; de Haan and Burggraaf, 2018). The field shape in the vertical cross-section orthogonal to the electrode arrays (Figure 3D) is highly similar to an electrode-pair simulation of a brown-shrimp (Crangon crangon) electrotrawl (Verschueren and Polet, 2009). The simulations also clearly illustrate that field strengths in the water column and in the sediment are highly similar, and are largely independent of the conductivity of the sediment. This agrees with measurements at various field locations (de Haan and Burggraaf, 2018) and in the laboratory (Murray et al., 2016). Positioning of the electrode arrays in the sediment in the simulations was based on Depestele et al. (2019), who modelled penetration depth of an in situ electrode array to be between 1–1.5 cm. In our simulation, we computed the steady-state electric field at a peak amplitude of 60 V which is used as maximum setting for commercial gears. In field conditions, however, this value drops to 52–58 V at the seafloor, depending on the season (Rijnsdorp et al., 2020a). Hence, we may slightly overestimate the electric field strengths of commercial gears by 3–13%. Different commercial electrode array design variations are expected to minimally affect electric field strength distributions around an electrode pair (see Soetaert et al. (2019) for an example of two electrode array designs). Different patterns of spacing the electrodes along the length of an electrode array may yield different temporal modulations of field strength exposure (de Haan et al., 2011; Soetaert et al., 2019), but is not expected to have a major effect on the decline of maximal field strength with distance to the electrodes.
Threshold measurements in combination with simulations show that behavioural responses, for the species we studied, will be limited to 80 cm from the electrode arrays in a vertical direction and 60 cm in a horizontal direction for the most outer electrode arrays. These relatively short distances make it unlikely that a fish responds behaviourally outside the nets. The electrodes on the array start about 4 m after the trawl opening (Soetaert et al., 2019), whereas side and top nets start at the beam or PulseWing (at the trawl opening). The nets are located about 40–80 cm horizontally from the most outer electrode arrays and placed at about 50–90 cm above the arrays (Rijnsdorp et al., 2021). Combined with a simulated threshold field strength at about 60 cm (horizontal) and 80 cm (vertical) relative to an electrode, this leaves about 20–30 cm distance beyond the nets, where fish might show a response. This is a negligible effect, and it seems excluded that such a response would affect the risk of capture or injury. Electrical pulsing therefore adds little to long-distance responses to an oncoming trawl via e.g. visual cues or vibrations from the gear and vessel engine (Arimoto et al., 2010; Yan et al., 2010; Jordan et al., 2013).
In conclusion, our results indicate that marine fishes show relatively high thresholds for a behavioural response to pulsed electric fields of common-sole-targeting pulse trawlers. Mean behavioural response thresholds across species varied between 6 and 10 V m–1. Electroreceptive species were not more sensitive, which is presumably due to a mismatch in frequency content of stimulation and receptor sensitivity to low frequencies. These thresholds correspond to a distance of about 60–80 cm from electrodes in commercial pulse trawl gears. Our findings indicate that behavioural responses of fishes to electrical pulses are largely restricted to the trawl path and hardly extent beyond the netting of the pulse gear, with some variation per pulse gear type and rigging.
The raw data supporting the conclusions of this article will be made available by the authors, without undue reservation.
The animal study was approved by the Animal Welfare Body of Wageningen University, the Animal Ethics Committee of Wageningen University & Research, and the Dutch Central Authority for Scientific Procedures on Animals (application number AVD1040020184945; experiment number 2017.W-0080.001 and 2017.W-0080.002) as well as the ethical committee of ILVO (reference number EC 2018/322) and the Animal Welfare Service of the Flemish government (DWZ/WVdS/18/115/44). All experiments were done in the Netherlands. The study was conducted in accordance with the local legislation and institutional requirements.
PB: Conceptualization, Data curation, Formal analysis, Investigation, Methodology, Project administration, Resources, Software, Supervision, Validation, Visualization, Writing – original draft, Writing – review & editing. AH: Data curation, Formal analysis, Methodology, Software, Validation, Visualization, Writing – review & editing. KS: Data curation, Formal analysis, Investigation, Methodology, Software, Visualization, Writing – review & editing. RP: Conceptualization, Methodology, Writing – review & editing. ML: Conceptualization, Data curation, Formal analysis, Funding acquisition, Investigation, Methodology, Project administration, Resources, Software, Supervision, Validation, Visualization, Writing – original draft, Writing – review & editing.
The author(s) declare financial support was received for the research, authorship, and/or publication of this article. The authors declare that this study received funding from the Dutch Ministry of Agriculture, Nature and Food Quality via the Impact Assessment Pulse-trawl Fishery project. This project is funded through the Dutch component of the European Maritime and Fisheries Fund of the European Union (contract number 1300021172). The funding bodies were neither involved in the study design, collection, analysis, interpretation of data, and writing of this article nor in the decision to submit the article for publication.
We thank the following people for their valuable contributions in various stages of this study: crew and cruise participants of the RV Belgica for collecting experimental animals; Pieke Molenaar, Edward Schram, and Pim van Dalen of Wageningen Marine Research for collecting experimental animals and animal caretaking; Maarten Soetaert, Mattias Van Opstal, and David Vuylsteke of the Flanders Research Institute for Agriculture, Fisheries and Food for advice, collecting experimental animals, and animal caretaking; Marleen E.J. Verdaasdonk and Lara van den Oever for technical support and pilot measurements; Kas Koenraads and Henk Schipper for technical support; Hans Meijer of the Technical Development Studio of Wageningen University for technical support and construction of the pulse stimulation equipment; Emily Roux, Tom Spanings, Manouk van Loon, Truus van der Wal, Linsey de Wildt, Sander Visser, Gerrit Dijkhuizen, Wian Nusselder, Menno ter Veld, and interns of the Carus Aquatic Research facility of Wageningen University for animal caretaking and technical support; Johan L. van Leeuwen and Adriaan D. Rijnsdorp for feedback on the manuscript.
The authors declare that the research was conducted in the absence of any commercial or financial relationships that could be construed as a potential conflict of interest.
All claims expressed in this article are solely those of the authors and do not necessarily represent those of their affiliated organizations, or those of the publisher, the editors and the reviewers. Any product that may be evaluated in this article, or claim that may be made by its manufacturer, is not guaranteed or endorsed by the publisher.
The Supplementary Material for this article can be found online at: https://www.frontiersin.org/articles/10.3389/fmars.2023.1286149/full#supplementary-material
Abrantes K., Barnett A., Soetaert M., Kyne P., Laird A., Squire L., et al. (2021). Potential of electric fields to reduce bycatch of highly threatened sawfishes. Endanger Species Res. 46, 121–135. doi: 10.3354/esr01146
Amoroso R. O., Pitcher C. R., Rijnsdorp A. D., McConnaughey R. A., Parma A. M., Suuronen P., et al. (2018). Bottom trawl fishing footprints on the world’s continental shelves. Proc. Natl. Acad. Sci. U. S. A. 115, E10275–E10282. doi: 10.1073/pnas.1802379115
Arimoto T., Glass C. W., Zhang X. (2010). “Fish vision and its role in fish capture,” in Behavior of marine fishes: capture processes and conservation challenges. Ed. He P. (Ames, IA, USA. 375 pp: Blackwell Publishing Ltd) 25–44. doi: 10.1002/9780813810966.ch2
Bary B. M. (1956). The effect of electric fields on marine fishes (Edinburgh, United Kingdom. 33 pp: Marine Research/Scottish Home Department, Her Majesty’s Stationary Office).
Batsleer J., Rijnsdorp A. D., Hamon K. G., van Overzee H. M. J., Poos J. J. (2016). Mixed fisheries management: Is the ban on discarding likely to promote more selective and fuel efficient fishing in the Dutch flatfish fishery? Fish Res. 174, 118–128. doi: 10.1016/j.fishres.2015.09.006
Beaumont W. R. C. (2017). Comment: Rates and effects of branding due to electroshock: Some additional perspectives. N Am. J. Fish Manag. 37, 429–430. doi: 10.1080/02755947.2017.1280570
Bedore C. N., Kajiura S. M. (2013). Bioelectric fields of marine organisms: voltage and frequency contributions to detectability by electroreceptive predators. Physiol. Biochem. Zool. 86, 298–311. doi: 10.1086/669973
Bergman M. J. N., Meesters E. H. (2020). First indications for reduced mortality of non-target invertebrate benthic megafauna after pulse beam trawling. ICES J. Mar. Sci. 77, 846–857. doi: 10.1093/icesjms/fsz250
Boute P. G. (2022). Effects of electrical stimulation on marine organisms (Wageningen, the Netherlands. 322 pp: Wageningen University). doi: 10.18174/566867
Boute P. G., Rijnsdorp A. D., van Leeuwen J. L., Pieters R. P. M., Lankheet M. J. (2023). Internal injuries in marine fishes caught in beam trawls using electrical versus mechanical stimulations. ICES J. Mar. Sci. 80, 1367–1381. doi: 10.1093/icesjms/fsad064
Boute P. G., Rijnsdorp A. D., van Leeuwen J. L., Versteeg W. S. M., Pieters R. P. M., Lankheet M. J. (2022). Internal injuries in whiting (Merlangius merlangus) caught by tickler-chain and pulse-trawl gears. Fish Res. 253, 106351. doi: 10.1016/j.fishres.2022.106351
Boute P. G., Soetaert M., Reid Navarro J. A., Lankheet M. J. (2021). Effects of electrical pulse stimulation on behaviour and survival of marine benthic invertebrates. Front. Mar. Sci. 7, 592650. doi: 10.3389/fmars.2020.592650
Brewer D., Heales D., Milton D., Dell Q., Fry G., Venables B., et al. (2006). The impact of turtle excluder devices and bycatch reduction devices on diverse tropical marine communities in Australia’s northern prawn trawl fishery. Fish Res. 81, 176–188. doi: 10.1016/j.fishres.2006.07.009
Callaway R., Engelhard G. H., Dann J., Cotter J., Rumohr H. (2007). A century of North Sea epibenthos and trawling: comparison between 1902-1912, 1982-1985 and 2000. Mar. Ecol. Prog. Ser. 346, 27–43. doi: 10.3354/meps07038
Camp A. L., Roberts T. J., Brainerd E. L. (2015). Swimming muscles power suction feeding in largemouth bass. Proc. Natl. Acad. Sci. U. S. A. 112, 8690–8695. doi: 10.1073/pnas.1508055112
Collin S. P. (2010). “Electroreception in vertebrates and invertebrates,” in Encyclopedia of animal behavior. Eds. Breed M. D., Moore J. (Elsevier Ltd: Academic Press), 611–620. doi: 10.1016/B978-0-08-045337-8.00323-5
COMSOL Multiphysics® v5.4.0.246 (Stockholm, Sweden: COMSOL AB). Available at: www.comsol.com.
Cornsweet T. N. (1962). The staircase-method in psychophysics. Am. J. Psychol. 75, 485–491. doi: 10.2307/1419876
Crampton W. G. R. (2019). Electroreception, electrogenesis and electric signal evolution. J. Fish Biol. 95, 92–134. doi: 10.1111/jfb.13922
D’Agaro E. (2011). “Numerical simulations of seawater electro-fishing systems,” in Numerical simulations of physical and engineering processes. Ed. Awrejcewicz J. (London, United Kingdom: InTech), 339–366. doi: 10.5772/24167
de Groot S. J. (1984). The impact of bottom trawling on benthic fauna of the North Sea. Ocean Management 9, 177–190. doi: 10.1016/0302-184X(84)90002-7
de Haan D., Burggraaf D. (2018). Field strength profile in and above the seabed as reference to pulse trawl fishing on Dover sole (Solea solea). Wageningen Marine Research, Report number C022/18 (IJmuiden, the Netherlands), 33 pp.
de Haan D., Fosseidengen J. E., Fjelldal P. G., Burggraaf D. (2011). The effect of electric pulse stimulation to juvenile cod and cod of commercial landing size. IMARES Wageningen UR, Report number C141/11 (IJmuiden, the Netherlands), 44 pp.
de Haan D., Fosseidengen J. E., Fjelldal P. G., Burggraaf D., Rijnsdorp A. D. (2016). Pulse trawl fishing: characteristics of the electrical stimulation and the effect on behaviour and injuries of Atlantic cod (Gadus morhua). ICES J. Mar. Sci. 73, 1557–1569. doi: 10.1093/icesjms/fsw018
de Haan D., Haenen O., Chen C., Hofman A., van Es Y., Burggraaf D., et al. (2015). Pulse trawl fishing: the effects on dab (Limanda limanda). IMARES Wageningen UR, Report number C171/14 (IJmuiden, the Netherlands), 44 pp.
de Haan D., van Marlen B., Velzenboer I., van der Heul J., van der Vis H. (2009). The effects of pulse stimulation on biota – Research in relation to ICES advice – Effects on dogfish. IMARES Wageningen UR, Report number C105/09 (IJmuiden, the Netherlands), 32 pp.
Depestele J., Degrendele K., Esmaeili M., Ivanović A., Kröger S., O’Neill F. G., et al. (2019). Comparison of mechanical disturbance in soft sediments due to tickler-chain SumWing trawl vs. electro-fitted PulseWing trawl. ICES J. Mar. Sci. 76, 312–329. doi: 10.1093/icesjms/fsy124
Depestele J., Ivanović A., Degrendele K., Esmaeili M., Polet H., Roche M., et al. (2016). Measuring and assessing the physical impact of beam trawling. ICES J. Mar. Sci. 73, i15–i26. doi: 10.1093/icesjms/fsv056
Desender M., Chiers K., Polet H., Verschueren B., Saunders J. H., Ampe B., et al. (2016). Short-term effect of pulsed direct current on various species of adult fish and its implication in pulse trawling for brown shrimp in the North Sea. Fish Res. 179, 90–97. doi: 10.1016/j.fishres.2016.02.018
Desender M., Kajiura S., Ampe B., Dumolein L., Polet H., Chiers K., et al. (2017). Pulse trawling: evaluating its impact on prey detection by small-spotted catshark (Scyliorhinus canicula). J. Exp. Mar. Biol. Ecol. 486, 336–343. doi: 10.1016/j.jembe.2016.10.026
Dijkgraaf S. (1963). The functioning and significance of the lateral-line organs. Biol. Rev. 38, 51–105. doi: 10.1111/j.1469-185X.1963.tb00654.x
Dijkgraaf S., Kalmijn A. J. (1962). Verhaltensversuche zur Funktion der Lorenzinischen Ampullen. Naturwissenschaften 49, 400. doi: 10.1007/BF00632257
Dijkgraaf S., Kalmijn A. J. (1963). Untersuchungen über die Funktion der Lorenzinischen Ampullen an Haifischen. Z Vgl Physiol. 47, 438–456. doi: 10.1007/BF00343146
Diner N., le Men R. (1971). Etude du champ électrique nécessaire à la taxie anodique du poisson. Rev. Des. Travaux l’Institut Des. Pêches Maritimes 35, 21–34. Available at: https://archimer.ifremer.fr/doc/00000/2384/.
Diner N., le Men R. (1974). Seuils de taxie et de tétanie des bars, des mulets et des sardines dans un champ électrique impulsionnel uniforme. Documents de Conférence et de Réunion B:16, Comite des Engins et du Comportement, Conseil International pour l’Exploration de la Mer (Charlottenlund, Danemark). 9 pp.
Emery L. (1984). The physiological effects of electrofishing. California-Nevada Wildlife Trans. 20, 59–72.
England S. J., Robert D. (2021). The ecology of electricity and electroreception. Biol. Rev. 97, 383–413. doi: 10.1111/brv.12804
Fernö A. (1993). “Advances in understanding of basic behavior: consequences for fish capture studies,” in ICES Mar. Sci. Symp., Vol. 196. 5–11.
Filer J. L., Booker C. G., Sims D. W. (2008). Effects of environment on electric field detection by small spotted catshark Scyliorhinus canicula (L.). J. Fish Biol. 72, 1450–1462. doi: 10.1111/j.1095-8649.2008.01807.x
Gibson R. N., Stoner A. W., Ryer C. H. (2015). “Chapter 12: The behaviour of flatfishes,” in Flatfishes: biology and exploitation, 2nd ed. Eds. Gibson R. N., Nash R. D. M., Geffen A. J., van der Veer H. W. (Chichester, West Sussex, United Kingdom. 576 pp: John Wiley & Sons, Ltd), 314–345. doi: 10.1002/9781118501153.ch12
Greenway E., Jones K. S., Cooke G. M. (2016). Environmental enrichment in captive juvenile thornback rays, Raja clavata (Linnaeus 1758). Appl. Anim. Behav. Sci. 182, 86–93. doi: 10.1016/j.applanim.2016.06.008
Haasnoot T., Kraan M., Bush S. R. (2016). Fishing gear transitions: lessons from the Dutch flatfish pulse trawl. ICES J. Mar. Sci. 73, 1235–1243. doi: 10.1093/icesjms/fsw002
He P. (2007). “Technical measures to reduce seabed impact of mobile fishing gears,” in By-catch reduction in the world’s fisheries, vol. 7 . Ed. Kennelly S. J. (Dordrecht, the Netherlands. 302 pp: Springer), 141–179. doi: 10.1007/978-1-4020-6078-6_6
Heessen H. J. L., Daan N., Ellis J. R. (2015). Fish atlas of the Celtic Sea, North Sea, and Baltic Sea – based on international research-vessel surveys (Wageningen, the Netherlands: KNNV Publishing, Wageningen Academic Publishers), 572. doi: 10.3920/978-90-8686-878-0
Hiddink J. G., Jennings S., Sciberras M., Szostek C. L., Hughes K. M., Ellis N., et al. (2017). Global analysis of depletion and recovery of seabed biota after bottom trawling disturbance. Proc. Natl. Acad. Sci. U. S. A. 114, 8301–8306. doi: 10.1073/pnas.1618858114
Hilborn R., Amoroso R., Collie J., Hiddink J. G., Kaiser M. J., Mazor T., et al. (2023). Evaluating the sustainability and environmental impacts of trawling compared to other food production systems. ICES J. Mar. Sci. 80, 1567–1579. doi: 10.1093/icesjms/fsad115
ICES (2018). Report of the working group on electric trawling (WGELECTRA). ICES Report WGELECTRA 2018, 17–19 April 2018 (IJmuiden, the Netherlands: International Council for the Exploration of the Sea), 155 pp. doi: 10.17895/ices.pub.8160
ICES (2020a). ICES working group on electrical trawling (WGELECTRA). ICES scientific reports/rapports scientifiques du CIEM (Copenhagen, Denmark: International Council for the Exploration of the Sea), Vol. 2, 108 pp. doi: 10.17895/ices.pub.6006
ICES (2020b). ICES workshop on innovative fishing gear (WKING). ICES scientific reports/rapports scientifiques du CIEM (Copenhagen, Denmark: International Council for the Exploration of the Sea), Vol. 2, 130 pp. doi: 10.17895/ices.pub.7528
Jimenez Y. E., Brainerd E. L. (2020). Dual function of epaxial musculature for swimming and suction feeding in largemouth bass. Proc. R. Soc. B: Biol. Sci. 287, 20192631. doi: 10.1098/rspb.2019.2631
Jones J. B. (1992). Environmental impact of trawling on the seabed: A review. N Z J. Mar. Freshw. Res. 26, 59–67. doi: 10.1080/00288330.1992.9516500
Jordan L. K., Mandelman J. W., McComb D. M., Fordham S. V., Carlson J. K., Werner T. B. (2013). Linking sensory biology and fisheries bycatch reduction in elasmobranch fishes: A review with new directions for research. Conserv. Physiol. 1, cot002. doi: 10.1093/conphys/cot002
Kaiser M. J., Clarke K. R., Hinz H., Austen M. C. V., Somerfield P. J., Karakassis I. (2006). Global analysis of response and recovery of benthic biota to fishing. Mar. Ecol. Prog. Ser. 311, 1–14. doi: 10.3354/meps311001
Kalmijn A. J. J. (1966). Electro-perception in sharks and rays. Nature 212, 1232–1233. doi: 10.1038/2121232b0
Kalmijn A. J. (1971). The electric sense of sharks and rays. J. Exp. Biol. 55, 371–383. doi: 10.1242/jeb.55.2.371
Kalmijn A. J. (1974). “The detection of electric fields from inanimate and animate sources other than electric organs,” in Electroreceptors and other specialized receptors in lower vertrebrates. Handbook of sensory physiology, vol. 3. Ed. Fessard A. (Berlin Germany. 336 pp: Springer-Verlag), 147–200. doi: 10.1007/978-3-642-65926-3_5
Kalmijn A. J. (1982). Electric and magnetic field detection in elasmobranch fishes. Science 218, 916–918. doi: 10.1126/science.7134985
Klima E. F. (1972). Voltage and pulse rates for inducing electrotaxis in twelve coastal pelagic and bottom fishes. J. Fisheries Board Canada 29, 1605–1614. doi: 10.1139/f72-247
Kruuk H. (1963). Diurnal periodicity in the activity of the common sole, Solea vulgaris Quensel. Netherlands J. Sea Res. 2, 1–28. doi: 10.1016/0077-7579(63)90002-4
Krzanowski W. J., Hand D. J. (2009). ROC curves for continuous data (New York, United States of America: Chapman and Hall/CRC Press, Taylor and Francis Group, LLC), 232. doi: 10.1201/9781439800225
Leek M. R. (2001). Adaptive procedures in psychophysical research. Percept. Psychophys. 63, 1279–1292. doi: 10.3758/BF03194543
MATLAB (2018). Version 9.5.0.944444 R2018b. (Natick, MA, USA: The MathWorks Inc.). Available at: https://www.mathworks.com
Mazor T., Pitcher C. R., Rochester W., Kaiser M. J., Hiddink J. G., Jennings S., et al. (2021). Trawl fishing impacts on the status of seabed fauna in diverse regions of the globe. Fish Fisheries 22, 72–86. doi: 10.1111/faf.12506
Montgomery J. C. (1984). Frequency response characteristics of primary and secondary neurons in the electrosensory system of the thornback ray. Comp. Biochem. Physiol. A Physiol. 79, 189–195. doi: 10.1016/0300-9629(84)90731-X
Montgomery J. C., Bodznick D. (1999). Signals and noise in the elasmobranch electrosensory system. J. Exp. Biol. 202, 1349–1355. doi: 10.1242/jeb.202.10.1349
Murray R. W. (1962). The response of the ampullae of Lorenzini of elasmobranchs to electrical stimulation. J. Exp. Biol. 39, 119–128. doi: 10.1242/jeb.39.1.119
Murray F., Copland P., Boulcott P., Robertson M., Bailey N. (2016). Impacts of electrofishing for razor clams (Ensis spp.) on benthic fauna. Fish Res. 174, 40–46. doi: 10.1016/j.fishres.2015.08.028
Newton K. C., Gill A. B., Kajiura S. M. (2019). Electroreception in marine fishes: chondrichthyans. J. Fish Biol. 95, 135–154. doi: 10.1111/jfb.14068
Peters R. C., Eeuwes L. B. M., Bretschneider F. (2007). On the electrodetection threshold of aquatic vertebrates with ampullary or mucous gland electroreceptor organs. Biol. Rev. 82, 361–373. doi: 10.1111/j.1469-185X.2007.00015.x
Peters R. C., Evers H. P. (1985). Frequency selectivity in the ampullary system of an elasmobranch fish (Scyliorhinus canicula). J. Exp. Biol. 118, 99–109. doi: 10.1242/jeb.118.1.99
Pitcher C. R., Hiddink J. G., Jennings S., Collie J., Parma A. M., Amoroso R., et al. (2022). Trawl impacts on the relative status of biotic communities of seabed sedimentary habitats in 24 regions worldwide. Proc. Natl. Acad. Sci. U. S. A. 119, e2109449119. doi: 10.1073/pnas.2109449119
Plummer M. (2003). JAGS: a program for analysis of Bayesian graphical models using Gibbs sampling. Proc. 3rd Int. workshop distributed Stat. computing 124, 8.
Plummer M. (2019). rjags: Bayesian Graphical Models using MCMC. R package version 4-10 (Vienna, Austria: The R Foundation for Statistical Computing). Available at: https://cran.r-project.org/package=rjags.
Polet H. (2010). “Electric senses of fish and their application in marine fisheries,” in Behavior of marine fishes: capture processes and conservation challenges. Ed. He P. (Ames, IA, USA. 375 pp: Blackwell Publishing Ltd), 205–235. doi: 10.1002/9780813810966.ch9
Polet H., Delanghe F., Verschoore R. (2005). On electrical fishing for brown shrimp (Crangon crangon): I. Laboratory experiments. Fish Res. 72, 1–12. doi: 10.1016/j.fishres.2004.10.016
Poos J., Hintzen N. T., van Rijssel J. C., Rijnsdorp A. D. (2020). Efficiency changes in bottom trawling for flatfish species as a result of the replacement of mechanical stimulation by electric stimulation. ICES J. Mar. Sci. 77, 2635–2645. doi: 10.1093/icesjms/fsaa126
Pottier G., Beaumont W. R., Marchand F., le Bail P.-Y., Azam D., Rives J., et al. (2020). Electrofishing in streams of low water conductivity but high biodiversity value: challenges, limits and perspectives. Fish Manag. Ecol. 27, 52–63. doi: 10.1111/fme.12384
Quirijns F. J., Steins N. A., Steenbergen J., Rijnsdorp A. D. (2018). Recommendations for additional research into pulse-trawl fisheries: based on an inventory of stakeholder concerns. Report number C106/18 (IJmuiden, the Netherlands: Wageningen Marine Research), 56 pp. doi: 10.18174/466766
R Core Team (2021). R: A language and environment for statistical computing (Vienna, Austria: The R Foundation for Statistical Computing). Available at: https://www.r-project.org/.
Rijnsdorp A. D., Boute P., Tiano J., Lankheet M., Soetaert K., Beier U., et al. (2020a). The implications of a transition from tickler chain beam trawl to electric pulse trawl on the sustainability and ecosystem effects of the fishery for North Sea sole: an impact assessment (IJmuiden, the Netherlands: Wageningen Marine Research), 108. doi: 10.18174/519729
Rijnsdorp A. D., Depestele J., Eigaard O. R., Hintzen N. T., Ivanovic A., Molenaar P., et al. (2020b). Mitigating seafloor disturbance of bottom trawl fisheries for North Sea sole Solea solea by replacing mechanical with electrical stimulation. PloS One 15, e0228528. doi: 10.1371/journal.pone.0228528
Rijnsdorp A. D., Depestele J., Molenaar P., Eigaard O. R., Ivanović A., O’Neill F. G. (2021). Sediment mobilization by bottom trawls: a model approach applied to the Dutch North Sea beam trawl fishery. ICES J. Mar. Sci. 78, 1574–1586. doi: 10.1093/icesjms/fsab029
Robert M., Cortay A., Morfin M., Simon J., Morandeau F., Deneubourg J. L., et al. (2020). A methodological framework for characterizing fish swimming and escapement behaviors in trawls. PloS One 15, e0243311. doi: 10.1371/journal.pone.0243311
Sala A., Damalas D., Labanchi L., Martinsohn J., Moro F., Sabatella R., et al. (2022). Energy audit and carbon footprint in trawl fisheries. Sci. Data 9, 428. doi: 10.1038/s41597-022-01478-0
Sala A., Depestele J., Gümüş A., Laffargue P., Nielsen J. R., Polet H., et al. (2023). Technological innovations to reduce the impact of bottom gears on the seabed. Mar. Policy 157, 105861. doi: 10.1016/j.marpol.2023.105861
Schneider C. A., Rasband W. S., Eliceiri K. W. (2012). NIH Image to ImageJ: 25 years of image analysis. Nat. Methods 9, 671–675. doi: 10.1038/nmeth.2089
Schram E., Molenaar P., Soetaert M., Burggraaf D., Boute P. G., Lankheet M. J., et al. (2022). Effect of electrical stimulation used in the pulse trawl fishery for common sole on internal injuries in sandeels. ICES J. Mar. Sci. 79, 1561–1568. doi: 10.1093/icesjms/fsac082
Snyder D. E. (2003). Electrofishing and its harmful effects on fish. Information and Technology Report USGS/BRD/ITR–2003-0002 (Denver, Colorado, United States of America: U.S. Government Printing Office), 149 pp.
Soetaert M., Boute P. G., Beaumont W. R. C. (2019). Guidelines for defining the use of electricity in marine electrotrawling. ICES J. Mar. Sci. 76, 1994–2007. doi: 10.1093/icesjms/fsz122
Soetaert M., Chiers K., Duchateau L., Polet H., Verschueren B., Decostere A. (2015a). Determining the safety range of electrical pulses for two benthic invertebrates: brown shrimp (Crangon crangon L.) and ragworm (Alitta virens S.). ICES J. Mar. Sci. 72, 973–980. doi: 10.1093/icesjms/fsu176
Soetaert M., Decostere A., Polet H., Verschueren B., Chiers K. (2015b). Electrotrawling: a promising alternative fishing technique warranting further exploration. Fish Fisheries 16, 104–124. doi: 10.1111/faf.12047
Soetaert M., Decostere A., Verschueren B., Saunders J., van Caelenberge A., Puvanendran V., et al. (2016b). Side-effects of electrotrawling: exploring the safe operating space for Dover sole (Solea solea L.) and Atlantic cod (Gadus morhua L.). Fish Res. 177, 95–103. doi: 10.1016/j.fishres.2016.01.019
Soetaert M., de Haan D., Verschueren B., Decostere A., Puvanendran V., Saunders J., et al. (2016a). Atlantic cod show a highly variable sensitivity to electric-induced spinal injuries. Mar. Coast. Fisheries 8, 412–424. doi: 10.1080/19425120.2016.1180332
Soetaert M., Lenoir H., Verschueren B. (2016c). Reducing bycatch in beam trawls and electrotrawls with (electrified) benthos release panels. ICES J. Mar. Sci. 73, 2370–2379. doi: 10.1093/icesjms/fsw096
Soetaert M., Verschueren B., Chiers K., Duchateau L., Polet H., Decostere A. (2016d). Laboratory study on the impact of repetitive electrical and mechanical stimulation on brown shrimp Crangon crangon. Mar. Coast. Fish 8, 404–411. doi: 10.1080/19425120.2016.1180333
Soetaert M., Verschueren B., Decostere A., Saunders J., Polet H., Chiers K. (2018). No injuries in European sea bass tetanized by pulse stimulation used in electrotrawling. N Am. J. Fish Manag. 38, 247–252. doi: 10.1002/nafm.10028
Stewart P. A. M. (1973). “The selection of electrode materials for electrical fishing,” in Conference and Meeting documents B:11, Gear and Behaviour Committee, International Council for the Exploration of the Sea, Charlottenlund, Denmark. 13 pp.
Stewart P. A. M. (1975). Catch selectivity by electrical fishing systems. ICES J. Mar. Sci. 36, 106–109. doi: 10.1093/icesjms/36.2.106
Stewart P. A. M. (1977). A study of the response of flatfish (Pleuronectidae) to electrical stimulation. ICES J. Mar. Sci. 37, 123–129. doi: 10.1093/icesjms/37.2.123
Su Y.-S., Masanao Y. (2020). R2jags: using R to run “JAGS”. R package version 0.6-1 (Vienna, Austria: The R Foundation for Statistical Computing). Available at: https://cran.r-project.org/package=R2jags.
Suuronen P., Sardà F. (2007). “By-catch reduction techniques in European fisheries: Traditional methods and potential innovations,” in By-catch reduction in the world’s fisheries, vol. 7. Ed. Kennelly S. J. (Dordrecht, the Netherlands. 302 pp: Springer), 37–74. doi: 10.1007/978-1-4020-6078-6_3
Taylor G. N., Cole L. S., Sigler W. F. (1957). Galvanotaxic response of fish to pulsating direct current. J. Wildl Manage 21, 201–213. doi: 10.2307/3797586
Thurstan R. H., Brockington S., Roberts C. M. (2010). The effects of 118 years of industrial fishing on UK bottom trawl fisheries. Nat. Commun. 1, 15. doi: 10.1038/ncomms1013
Tiano J. C., De Borger E., O’Flynn S., Cheng C. H., van Oevelen D., Soetaert K. (2021). Physical and electrical disturbance experiments uncover potential bottom fishing impacts on benthic ecosystem functioning. J. Exp. Mar. Biol. Ecol. 545, 151628. doi: 10.1016/j.jembe.2021.151628
Tiano J. C., Depestele J., Van Hoey G., Fernandes J., Van Rijswijk P., Soetaert K. (2022). Trawling effects on biogeochemical processes are mediated by fauna in high-energy biogenic-reef-inhabited coastal sediments. Biogeosciences 19, 2583–2598. doi: 10.5194/bg-19-2583-2022
Tiano J. C., van der Reijden K. J., O’Flynn S., Beauchard O., van der Ree S., van der Wees J., et al. (2020). Experimental bottom trawling finds resilience in large-bodied infauna but vulnerability for epifauna and juveniles in the Frisian Front. Mar. Environ. Res. 159, 104964. doi: 10.1016/j.marenvres.2020.104964
Treutwein B. (1995). Adaptive psychophysical procedures. Vision Res. 35, 2503–2522. doi: 10.1016/0042-6989(95)00016-X
Tricas T. C., New J. G. (1998). Sensitivity and response dynamics of elasmobranch electrosensory primary afferent neurons to near threshold fields. J. Comp. Physiol. A 182, 89–101. doi: 10.1007/s003590050161
Turenhout M. N. J., Zaalmink B. W., Strietman W. J., Hamon K. G. (2016). Pulse fisheries in the Netherlands: economic and spatial impact study. Research report 2016-104 (Wageningen, the Netherlands: Wageningen Economic Research), 36 pp. doi: 10.18174/396469
van der Reijden K. J., Molenaar P., Chen C., Uhlmann S. S., Goudswaard P. C., van Marlen B. (2017). Survival of undersized plaice (Pleuronectes platessa), sole (Solea solea), and dab (Limanda limanda) in North Sea pulse-trawl fisheries. ICES J. Mar. Sci. 74, 1672–1680. doi: 10.1093/icesjms/fsx019
van Hoof L., Steins N. A., Smith S., Kraan M. (2020). Change as a permanent condition: A history of transition processes in Dutch North Sea fisheries. Mar. Policy 122, 104245. doi: 10.1016/j.marpol.2020.104245
van Marlen B., Wiegerinck J. A. M., van Os-Koomen E., van Barneveld E. (2014). Catch comparison of flatfish pulse trawls and a tickler chain beam trawl. Fish Res. 151, 57–69. doi: 10.1016/j.fishres.2013.11.007
van Overzee H. M. J., Rijnsdorp A. D., Poos J. J. (2023). Changes in catch efficiency and selectivity in the beam trawl fishery for sole when mechanical stimulation is replaced by electrical stimulation. Fish Res. 260, 106603. doi: 10.1016/j.fishres.2022.106603
Verschueren B., Polet H. (2009). Research Summary on HOVERCRAN, hovering pulse trawl for a selective Crangon fishery (Ostend, Belgium: Animal Sciences and Fisheries unit, Institute for Agricultural and Fisheries Research).
Wardle C. S. (1986). “Fish behaviour and fishing gear,” in The behaviour of teleost fishes. Ed. Pitcher T. J. (Boston, MA, USA. 553 pp: Springer), 463–495. doi: 10.1007/978-1-4684-8261-4_18
Winger P. D., Eayrs S., Glass C. W. (2010). “Fish behavior near bottom trawls,” in Behavior of marine fishes: capture processes and conservation challenges. Ed. He P. (Ames, IA, USA. 375 pp: Blackwell Publishing Ltd), 67–103. doi: 10.1002/9780813810966.ch4
Keywords: bottom trawling, bycatch, electroreceptive fishes, electrical pulse fishing, fish swimming, North Sea, staircase procedure, receiver-operating characteristic analysis
Citation: Boute PG, Hagmayer A, Smid K, Pieters RPM and Lankheet MJ (2024) Behavioural response thresholds of marine fish species for pulsed electric fields. Front. Mar. Sci. 10:1286149. doi: 10.3389/fmars.2023.1286149
Received: 30 August 2023; Accepted: 21 December 2023;
Published: 29 January 2024.
Edited by:
Benjamin Costas, University of Porto, PortugalReviewed by:
José Lino Vieira De Oliveira Costa, University of Lisbon, PortugalCopyright © 2024 Boute, Hagmayer, Smid, Pieters and Lankheet. This is an open-access article distributed under the terms of the Creative Commons Attribution License (CC BY). The use, distribution or reproduction in other forums is permitted, provided the original author(s) and the copyright owner(s) are credited and that the original publication in this journal is cited, in accordance with accepted academic practice. No use, distribution or reproduction is permitted which does not comply with these terms.
*Correspondence: Pim G. Boute, cC5nLmJvdXRlQHJ1Zy5ubA==
†ORCID: Pim G. Boute, orcid.org/0000-0003-2954-635X
Andres Hagmayer, orcid.org/0000-0001-5840-2350
Remco P.M. Pieters, orcid.org/0000-0002-8517-9227
Martin J. Lankheet, orcid.org/0000-0002-8261-2187
Koen Smid, orcid.org/0009-0001-4985-1725
Disclaimer: All claims expressed in this article are solely those of the authors and do not necessarily represent those of their affiliated organizations, or those of the publisher, the editors and the reviewers. Any product that may be evaluated in this article or claim that may be made by its manufacturer is not guaranteed or endorsed by the publisher.
Research integrity at Frontiers
Learn more about the work of our research integrity team to safeguard the quality of each article we publish.