
94% of researchers rate our articles as excellent or good
Learn more about the work of our research integrity team to safeguard the quality of each article we publish.
Find out more
ORIGINAL RESEARCH article
Front. Mar. Sci., 13 November 2023
Sec. Marine Biogeochemistry
Volume 10 - 2023 | https://doi.org/10.3389/fmars.2023.1282891
This article is part of the Research TopicBiogeochemical Responses to Physical Processes in the North Pacific and Its Adjacent Marginal SeasView all 9 articles
 Haili Ma1,2
 Xiaotong Xiao1,2*
 Yang Ding1,2
 Xuwen Feng3Weifang Chen4Liguang Sun5Xiaohan Bao1,6
 Shanshan Duan7
 Meixun Zhao1,2*
Continental marginal seas are key systems in the global carbon cycle. Carbon stocks represent the ability to store carbon, thus quantifying the carbon stocks in marine sediments would help to better understand their importance in the carbon cycle. In this study, 17 sediment cores in the mud areas of the South Yellow Sea and the East China Sea were measured for total organic carbon (TOC) and its stable isotope (δ13C), and dry bulk density; and from which the carbon stocks and carbon stock accumulation rate as well as marine/terrestrial carbon stocks/carbon stock accumulation rate were calculated. The carbon stocks in the mud area of the South Yellow Sea showed a decreasing trend during 1855 to 1950 caused by the relocation of the Yellow River Estuary in 1855, but increased after 1950s due to increased sediment input via the enhancement of South Shandong Coastal Current. In the Min-Zhe belt of the East China Sea, carbon stocks showed an overall high marine proportion due to the phytoplankton bloom induced by high nutrient level, but the decreased carbon stocks in recent decades were mainly caused by the construction of reservoirs in the Yangtze River that reduced sediment transports. The average carbon stocks in 1 m sediments from the South Yellow Sea (45.2 t ha-1) and Min-Zhe belt (52.8 t ha-1) were low compared to that of global marine sediments (66.6 t ha-1), while the carbon stock accumulation rate showed much higher values (0.1 t ha-1 yr-1 in South Yellow Sea and 0.31 t ha-1 yr-1 in the Min-Zhe belt) because of higher sedimentation rates. Although carbon stocks of Chinese marginal seas were also lower than that of the tidal flats (70.7 t ha-1) and wetland (123.6 t ha-1) in China, their much larger area could store 0.75 Pg C in marine sediments. Our temporal records suggest that anthropogenic activities have reduced carbon stocks in the marginal seas since 1950, causing carbon to re-enter the atmosphere to impact climate changes.
The global carbon cycle has been radically changing over the past 200 years influenced by human activities, characterized by the rapid rise of CO2 in the atmosphere (Falkowski et al., 2000). In 2019, the growth rate of anthropogenic CO2 concentration was about 5.4 ± 0.2 Pg C yr-1, 40% of which was absorbed by the ocean (2.6 ± 0.6 Pg C yr-1) (Friedlingstein et al., 2020). The continental marginal seas receive and store a large amount of carbon and play an important role in the global carbon cycle and climate regulation (Bianchi et al., 2018; Hunt et al., 2020), taking in about 20% of the oceans’ net absorption of CO2 each year (Friedlingstein et al., 2020). Furthermore, continental marginal seas bury 80% of organic carbon (OC) in the world’s oceans (Burdige, 2005; Jiao et al., 2018), although account for only 8% of the world’s oceans area. The OC in sediments from the marginal seas generally consist of marine and terrestrial sources. Marine OC in sediments is originated from the biological pump, referring to the process that phytoplankton photosynthesis helps to fix CO2 into organic matter, which is then transported through the water column to the deep ocean and finally buried in the marine sediments as a relatively “permanent” carbon reservoir (Hedges and Keil, 1995; Burdige, 2007; Jiao et al., 2010). Additionally, organic matter produced via primary productivity could be utilized by zooplankton in the food web during its transportation in the water column (Jiang et al., 2018) and be converted into recalcitrant dissolved OC by microorganisms via the microbial carbon pump that could be stored in the ocean for long periods of time (Jiao et al., 2018). The sources of terrestrial organic matter in marine sediments mainly include riverine transport, atmospheric deposition and coastal erosion (Schlünz and Schneider, 2000). In the world, rivers provide around 430–500 Tg terrestrial OC to the oceans every year (Schlünz and Schneider, 2000; Wang et al., 2012). Meanwhile, the terrestrial OC transported to the oceans through the atmospheric deposition is about 245 Tg C yr-1 (Jurado et al., 2008). Coastal erosion is also an important source of marine sediments (Cai et al., 2009) and the overall surface of eroded land approximately reached 28,000 km2 during the past decades (Mentaschi et al., 2018). Globally, the coastal sediments are important carbon sinks, with about 126.2 Tg OC buried in marine sediments (estuaries and shelves) each year (Duarte et al., 2005). In China, the marginal seas (including the Bohai Sea, Yellow Sea, East China Sea and South China Sea) span from the temperate to tropical zones and cover an area of about 470 × 104 km2 (Jiao et al., 2018), accounting for 16% of the global coastal ocean area (Duarte et al., 2005). The OC buried in the Chinese marginal seas is approximately 20.4 Tg C yr-1 (Deng et al., 2006; Hu et al., 2016; Jiao et al., 2018), which is equivalent to 15% of the OC buried in the global marginal seas (~138 Tg C yr-1) (Burdige, 2005). It is important to evaluate the OC rates and efficiency in sediments from Chinese marginal seas, which are influenced not only by riverine transport and primary productivity, but also by human activities such as bottom trawling that could cause sediments resuspension and consequently lead to the loss of fine sediments and organic matters (Oberle et al., 2016).
Carbon stocks represent the capacity to store OC, have been estimated in various regions all over the world (Atwood et al., 2017; Avelar et al., 2017; Atwood et al., 2020). High carbon stocks indicate that the region has potentially high carbon preservation capacity. Worldwide, assessments of carbon stocks have focused mainly on terrestrial environments, such as forest (Gibbs et al., 2007; Keith et al., 2009; Asner et al., 2010; Don et al., 2011), soil (Pan et al., 2004; Xie et al., 2007; Scharlemann et al., 2014), terrestrial ecosystems (Cao and Woodward, 1998; Tang et al., 2018) and wetland ecosystems (mangrove, seagrass and salt marsh) (Fourqurean et al., 2012; Estrada and Soares, 2017; Meng et al., 2019). However, the assessments of carbon stocks in marine sediments are still scarce. Avelar et al. (2017) and Smeaton et al. (2021) calculated the carbon stocks in the national exclusive economic zone and made a recommendation for the future management and protection of the oceans. Furthermore, the carbon stocks of global marine sediments have been estimated using a simulation model and the results showed that the average carbon stocks of global marine sediments in the top 1 m were 66.6 t ha-1, of which nearshore sediments (186.7 t ha-1) were about 3 times of the global marine sediment carbon stocks (Atwood et al., 2020). In China, carbon stocks have been estimated in the coastal areas, such as wetlands (Meng et al., 2019; Chu et al., 2021), tidal flats (Chen et al., 2020; Zhang et al., 2020) and bays (Ma et al., 2021). However, the influence of the sedimentation rates on carbon stocks have not been considered in previous studies, thus resulting in large uncertainties in the evaluation of the preserved capacity of the OC in marine sediments.
In this study, 17 sediment cores were selected from the mud areas located in the South Yellow Sea and the East China Sea to calculate the carbon stocks and to evaluate the carbon storing ability of sediments in the Chinese marginal seas (Figure 1A). The sediments in mud areas are characterized by fine grain size and high sedimentation rates, which can well document the marine environment variations, climate changes and sediment sources, becoming a research hotspot worldwide (Shi et al., 2003; Zhu et al., 2016; Qiao et al., 2017; Zhao et al., 2018). In order to obtain carbon stocks, carbon stock accumulation rates and OC sources in the mud areas of the South Yellow Sea and the East China Sea, we analyzed the organic geochemical parameters including total organic carbon (TOC) and stable isotope 13C of TOC (13CTOC), as well as dry bulk density and sedimentation rates. Our results provide a basis for the spatial and temporal variation of carbon stocks in the mud area from Chinese marginal seas, which is significant for understanding the ability of carbon preservation in marine sediments and developing a reasonable regulation of the marginal seas utilization.
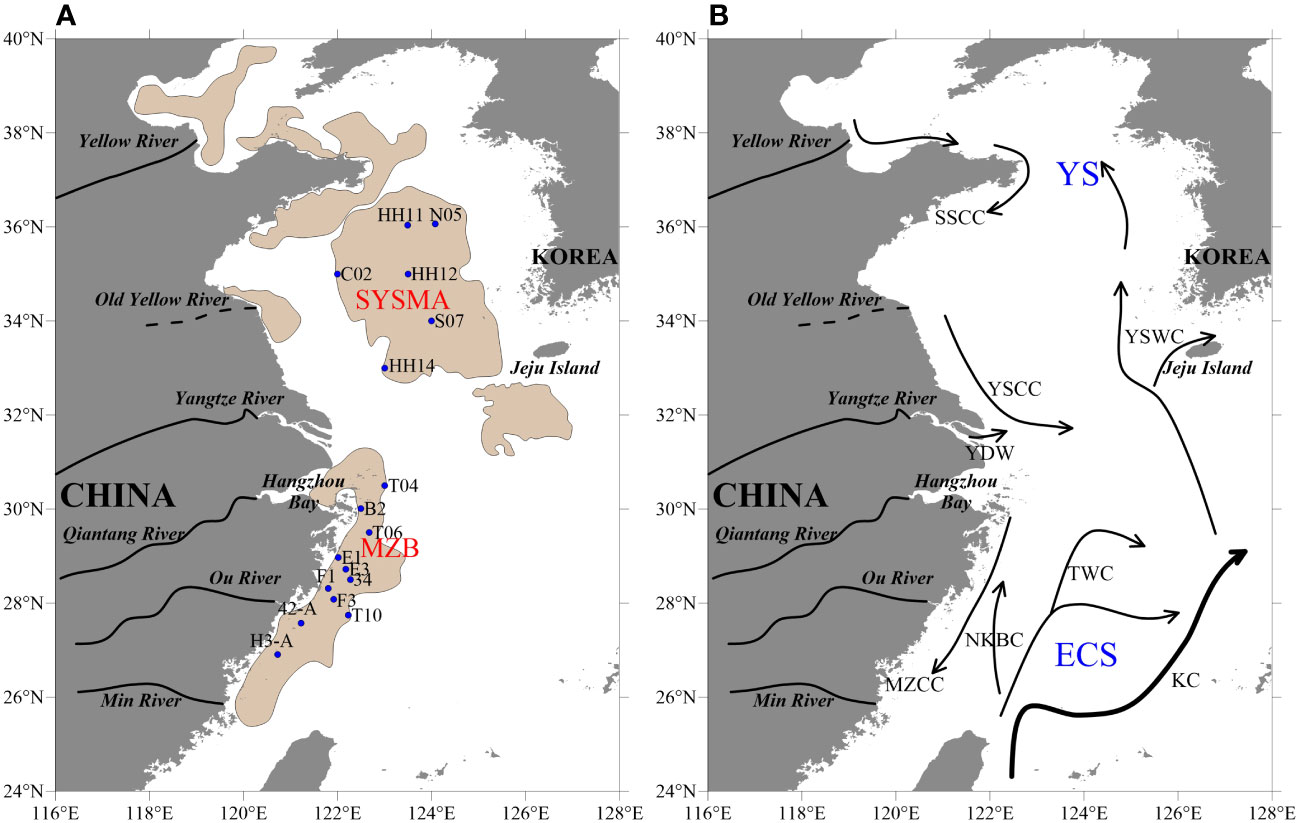
Figure 1 (A) Locations of sediment cores and mud areas. Mud areas are marked in brown according to (Qiao et al., 2017). SYSMA, South Yellow Sea Mud Area; MZB, Min-Zhe belt. (B) Ocean circulation patterns in the Chinese marginal seas. Black arrows show the general pattern of current systems in winter (Wang et al., 2014; Yang et al., 2018). YS, Yellow Sea; ECS, East China Sea; SSCC, South Shandong Coastal Current; YSCC, Yellow Sea Coastal Current; YSWC, Yellow Sea Warm Current; YDW, Yangtze Diluted Water; MZCC, Min-Zhe Coastal Current; TWC, Taiwan Warm Current; KC, Kuroshio Current; NKBC, Nearshore Kuroshio Branch Current.
Mud Area in the South Yellow Sea [referred as the South Yellow Sea in the following) and in the East China Sea (known as Min-Zhe belt along the coast of Fujian Province (Min) and Zhejiang Province (Zhe)] are two major mud areas from the Chinese marginal seas, covering 9.93 ×10⁴ km2 and 5.65 ×10⁴ km2, respectively (Qiao et al., 2017; Wang et al., 2018).
The Yellow Sea is located between China and the Korean Peninsula, with an area of about 38.0×10⁴ km2, of which the South Yellow Sea covers approximately 30.9×10⁴ km2 (Jiao et al., 2018). The Yellow Sea has been significantly affected by human activities such as trawling, aquaculture, fishing and pollution (Xing et al., 2011; Oberle et al., 2016). The relatively weak energy currents and cyclonic cold eddies resulted in the formation of the mud area in the South Yellow Sea (Figure 1B; Zeng et al., 2015; Zhao et al., 2021). The sediments from the South Yellow Sea come from a variety of sources, including the Yellow River (both the old and modern Yellow River estuaries), the Yangtze River, and small rivers in Korea Peninsula (Li et al., 2014; Tao et al., 2016). Additionally, seabed erosion, resuspension and redeposition are also important sources of sediments in the South Yellow Sea (Wang et al., 2014). Specifically, sediments in the South Yellow Sea were mainly transported from the Yellow River (Xing et al., 2014; Yang et al., 2015). With the high productivity and high sedimentation rates of up to 2.7 mm yr-1 (Xing et al., 2011; Jia et al., 2019), the South Yellow Sea became an important carbon sink (Chen and Borges, 2009; Jiao et al., 2018).
The East China Sea is located in the east of China, one of the widest continental shelves worldwide (Wang et al., 2020), influenced by the northward Kuroshio Current and Taiwan Warm Current, and the southward Min-Zhe Coastal Current. The primary production in the East China Sea is as high as 0.55 g C m-2 d-1 (Zhao et al., 2018) because large amounts of nutrient discharged by the Yangtze River (Song, 2010) trigger the phytoplankton growth. In addition, the Yangtze River-derived sediments are the main source of mud area along the Min-Zhe belt (Zeng et al., 2015). With the significantly high sedimentation rates (0.5 to 6.0 cm yr-1) (Zhao et al., 2021), the Min-Zhe belt recently become a research hotpot for carbon cycle (Qiao et al., 2017).
The sediment cores used in this study were collected using a box-core sampler in the South Yellow Sea in August of 2009 and in March of 2011 (R/V Dongfanghong II), along Min-Zhe coast in July and August of 2011 (R/V Runjiang I), in October and November of 2011(R/V Dongfanghong II) and in April and May of 2017 (R/V HaiLi).
The sedimentation rates in this study were calculated by the activities of 210Pb or 137Cs. Sedimentation rates in cores HH12 (0.16 cm yr-1), 34 (0.48 cm yr-1), T06 (0.49 cm yr-1), 42-A (0.86 cm yr-1) and H3-A (0.5 cm yr-1) have been published (Duan et al., 2014; Liu et al., 2022; Peng et al., 2023). In addition, sedimentation rates for HH11, N05, C02, S07 and HH14 in the South Yellow Sea were 0.23 cm yr-1, 0.13 cm yr-1, 0.25 cm yr-1, 0.3 cm yr-1 and 0.26 cm yr-1, respectively.
For the TOC analysis, the freeze-dried sediments were acidified using 6 M HCl, which is effective in removing inorganic carbon from sediments and has been widely reported in previous studies (Liu et al., 2022). The sediments were subsequently washed with deionized water until the pH = 7. To avoid loss of particles, the sediment samples were fully centrifuged after each water wash until no suspended particles before pouring off the supernatant. Therefore, no particles are lost during the washing of the sediment samples to neutrality. Prior to the measurements, the samples were dried in an oven at 55°C. TOC contents were measured using a Thermo Scientific Flash 2000 organic elemental analyzer, with a standard deviation of 0.02 wt% (n = 6).
Sediment samples were acidified to remove inorganic carbon and dried in an oven at 55 °C following the same procedure as TOC analysis mentioned above. The δ13CTOC of the sediment samples were determined using Thermo Delta-V isotopic ratio mass spectrometer (the United States) (continuous-flow mode) at Ocean University of China. The standard deviation of the instrument was 0.2‰ (n = 6).
The fresh sediments were filled in the fixed volume ring cutters and then were freeze-dried. The dry bulk density of the samples was calculated using the following equation, referred as DBD:
The carbon stocks were calculated using the following equation (Avelar et al., 2017):
Depth is used to calculate the carbon stock of a given depth interval of sediments. Since the top 1 m of marine sediments were susceptible to disturbance, we extended the depth of sediment cores to 1 m for carbon stock calculation as reported by Atwood et al. (2020). Missing data (TOC or dry bulk density) in the sediment cores beyond the actual depth were complemented by averages. Therefore, carbon stocks in this study were calculated as the sum of the carbon stocks per centimeter based on the available data and the carbon stocks of the remaining depth based on the average value.
with i represents a certain depth in the sediment core having measured TOC and dry bulk density values.
Considering that the sedimentation rates may greatly influence the OC burial rates, the carbon stock accumulation rate (CSAR) was used to evaluate the amount of carbon stocks per year. The TOC and dry bulk density were average values of the sediments each core.
The source contributions based on δ13CTOC were used to evaluate the terrestrial and marine contributions in carbon stocks and carbon stock accumulation rate.
fTerr represents the fraction of TOC transported via the terrestrial input. In temperate regions, fMar represents the fraction of TOC derived from the marine phytoplankton productivity. δ13CTerr and δ13CMar are the terrestrial and marine end member δ13CTOC values, respectively. Considering that the sediments of the South Yellow Sea are mainly influenced by the input of the Yellow River, the terrestrial end member δ13CTOC was obtained from the δ13C values of the Yellow River particulates, which is –23.9 ± 0.6‰ (Yu et al., 2021). Similarly, –25.6 ± 0.7‰ was chosen for the terrestrial end member in the East China Sea obtained from the Yangtze River particulates (Wang et al., 2021). To be consistent with previous studies, the δ13C value of –20 ± 1.0‰ and –20.6 ± 1.2‰ were used for the marine endmember in the Yellow Sea and East China Sea, respectively (Xing et al., 2014; Yoon et al., 2016; Wang et al., 2021; Yu et al., 2021).
Similarly, the terrestrial and marine carbon stock accumulation rate were also calculated.
The TOC ranged from 0.12% to 1.31% for all sediment samples. In the South Yellow Sea, the TOC contents in sediment cores ranged from 0.12% to 1.31%, generally showing slightly decreasing trends downcore, except the core HH14 located at the southmost boundary of the South Yellow Sea with fluctuating variation downwards (Figure 2A). In the Min-Zhe belt, the TOC contents (0.12% to 0.83%) showed small temporal variations in core T06, 34, T10 and H3-A, while displayed fluctuating variations in the rest of the cores (Figure 2B). In terms of spatial distribution, the average value of TOC for sediment cores was 0.55% (0.59% in the South Yellow Sea and 0.53% in the Min-Zhe belt), with the highest values in the northern part of the South Yellow Sea (1.00%) (Figure 3A).
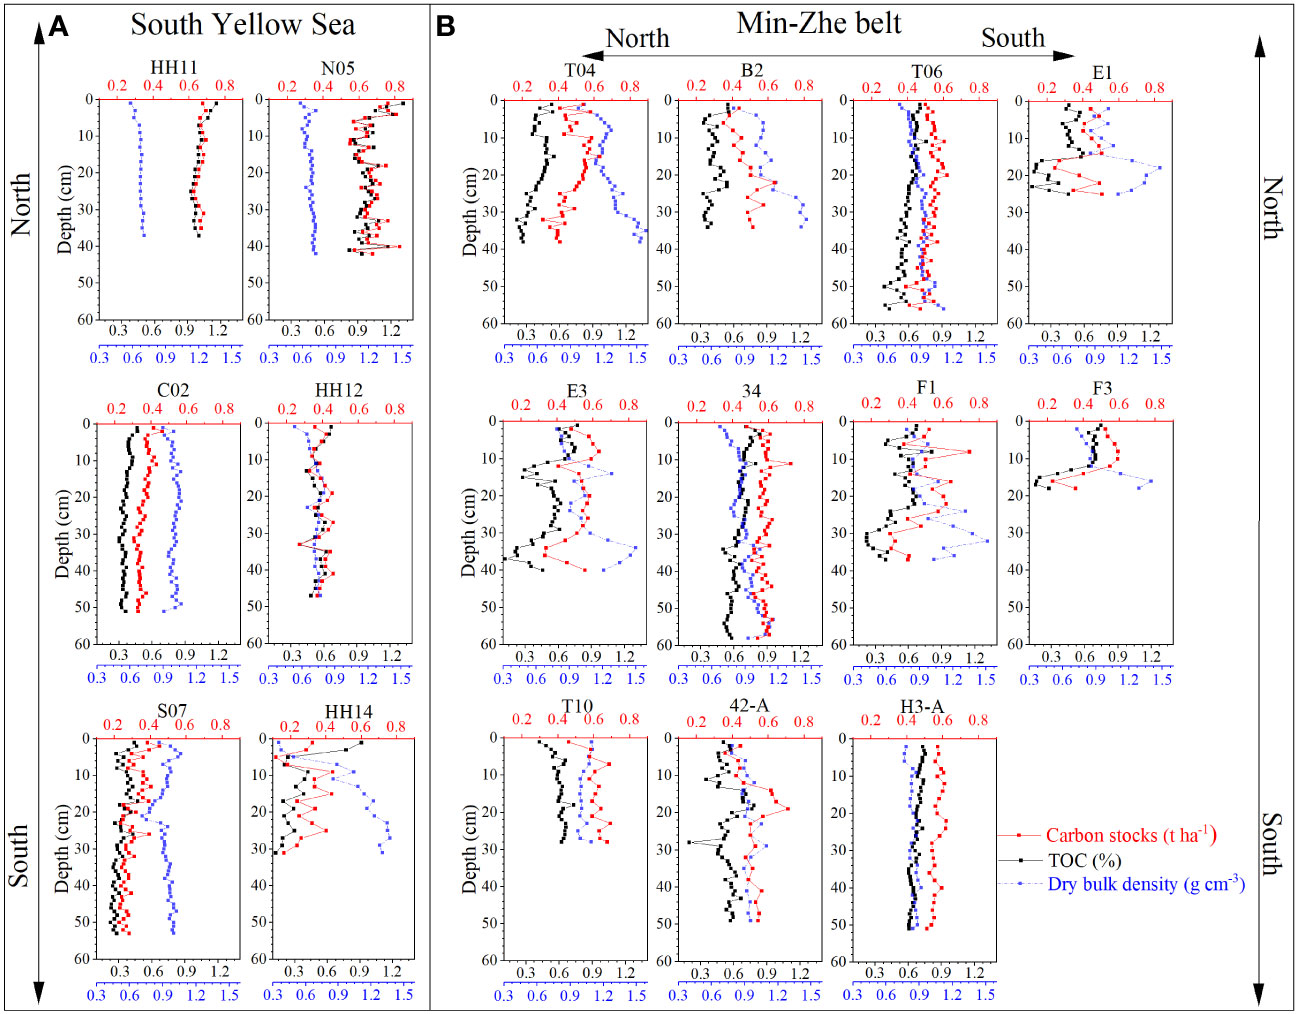
Figure 2 Vertical variation of the TOC, dry bulk density and carbon stock per centimeter in the sediment cores of the (A) South Yellow Sea and (B) Min-Zhe belt.
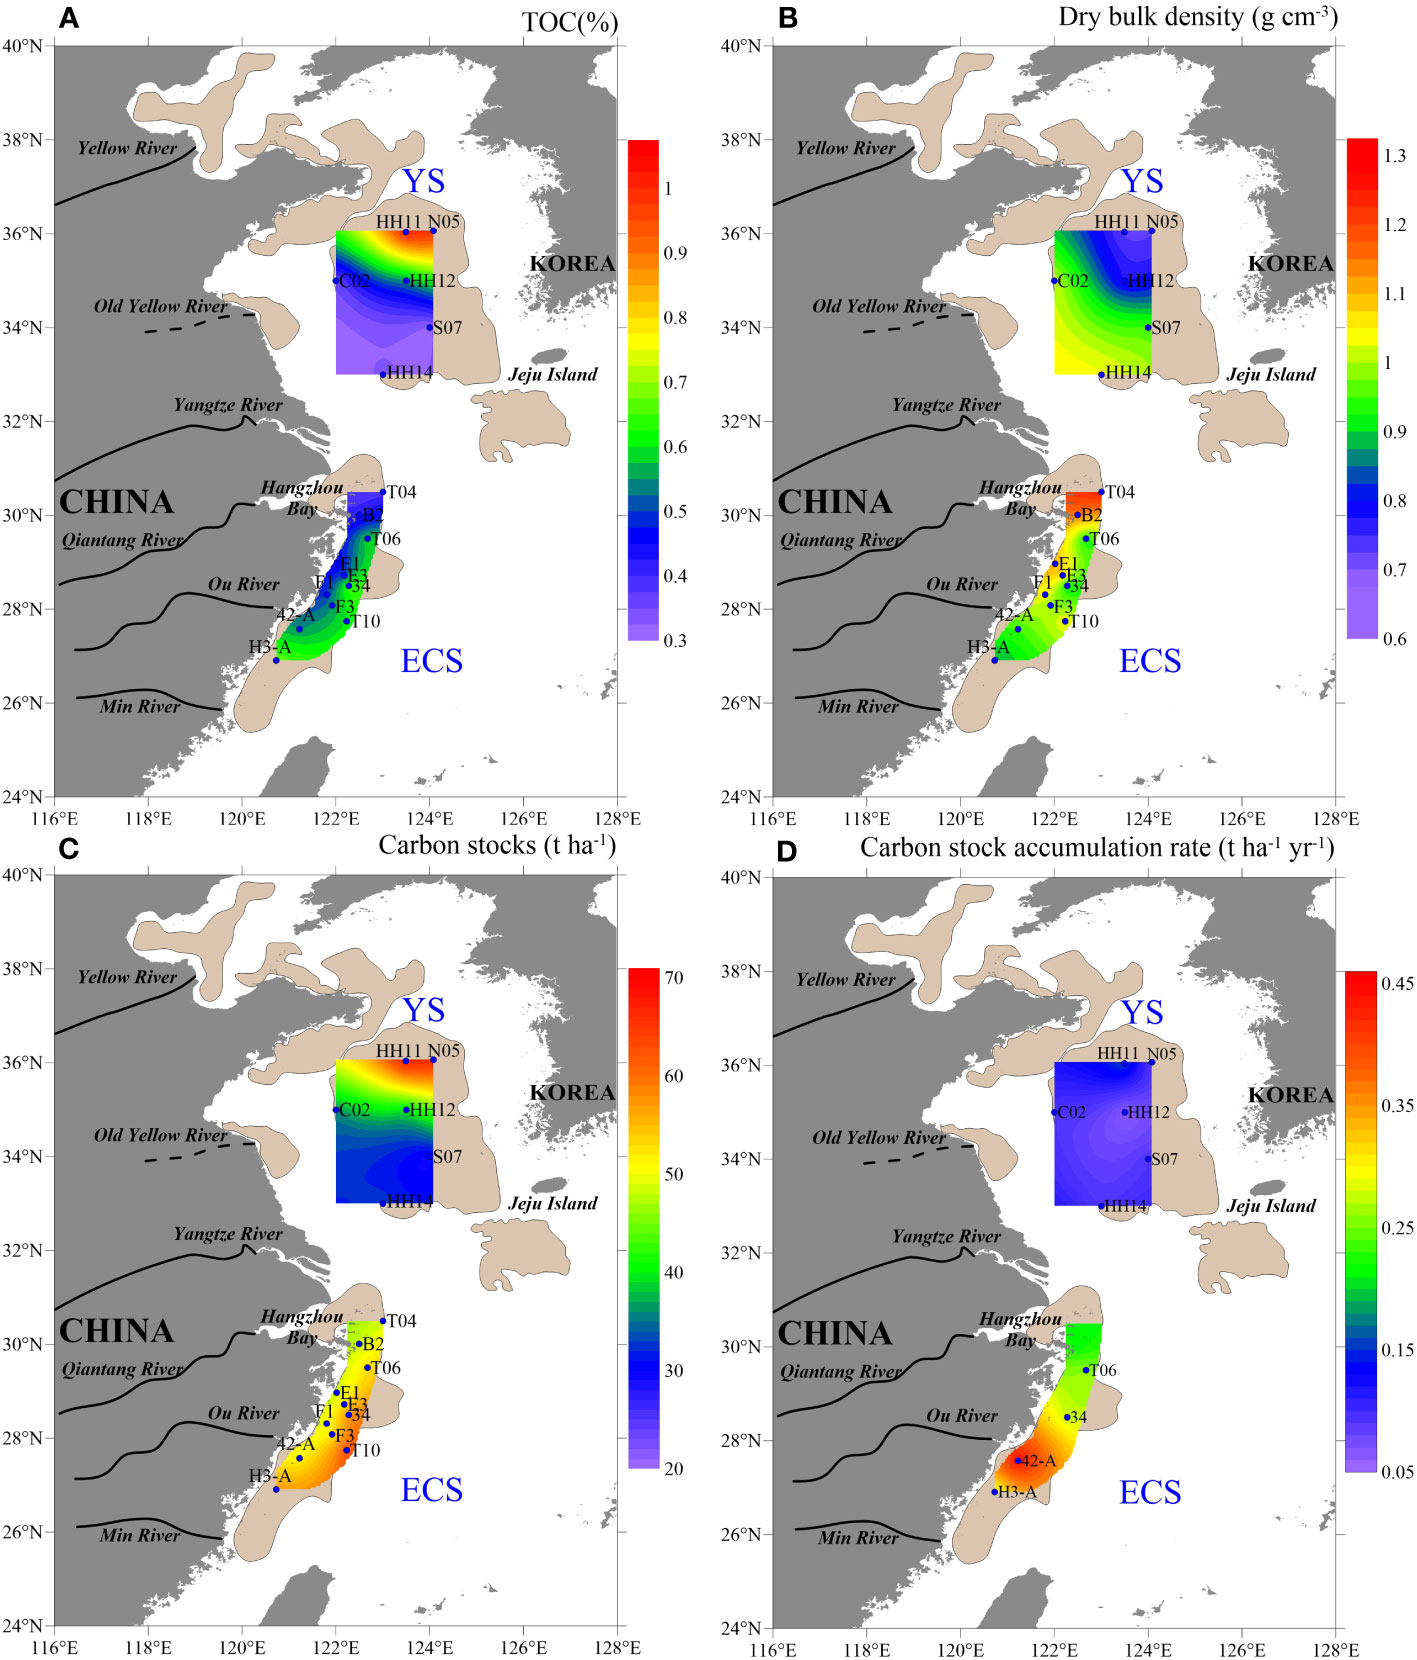
Figure 3 Spatial distribution of the (A) TOC, (B) dry bulk density, (C) carbon stocks and (D) carbon stock accumulation rate in sediment cores from the study region.
The dry bulk density ranged from 0.35 g cm-³ to 1.58 g cm-³ for all sediment samples. In this study, the TOC contents and dry bulk density showed a significant negative correlation (Figures 4A, B).
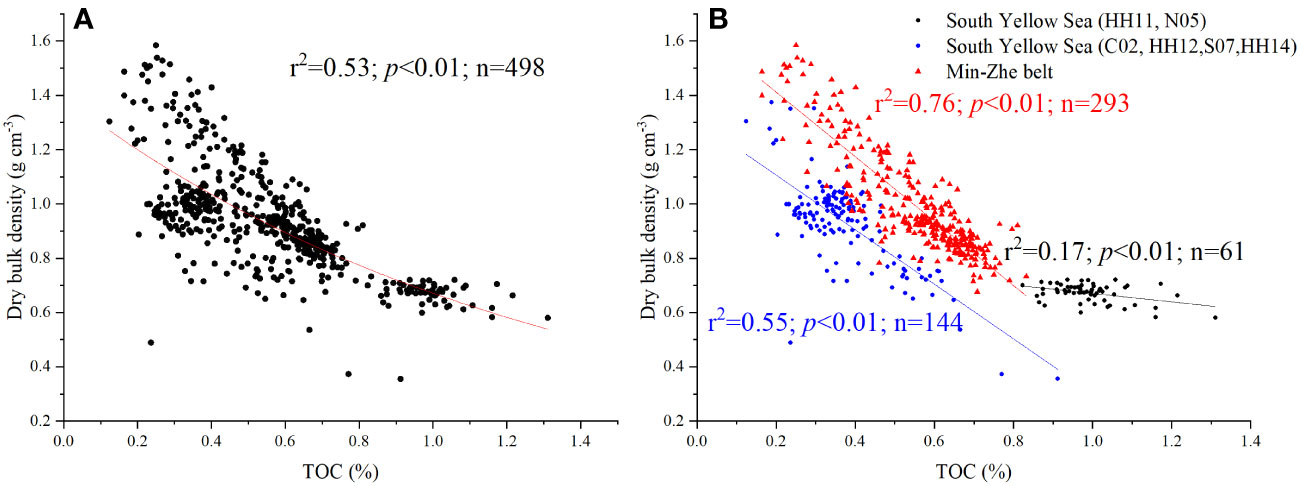
Figure 4 Relationship between TOC and dry bulk density for (A) all samples and (B) samples divided into different regions.
The dry bulk density of all sediment cores showed a decreasing trend downcore. In the South Yellow Sea, dry bulk density displayed stable temporal trends (0.54 g cm-³ to 1.06 g cm-³) except core HH14 with relatively strong fluctuation (0.35 g cm-³ to 1.37 g cm-³) (Figure 2A). In the Min-Zhe belt, the variations of the dry bulk density in the Min-Zhe belt sediment cores (0.68 g cm-³ to 1.58 g cm-³) were larger than that in the South Yellow Sea (Figures 2A, B). The spatial distribution of dry bulk density showed a roughly opposite trend to that of TOC, with the lowest in the northern part of South Yellow Sea (0.67 g cm-³) and the average values of dry bulk density were 0.84 g cm-³ and 1.02 g cm-³ in the South Yellow Sea and Min-Zhe belt (Figure 3B).
The carbon stocks ranged from 0.12 t ha-1 to 0.83 t ha-1 for all sediment samples. In the South Yellow Sea, the temporal trends of the carbon stocks per centimeter (0.12 t ha-1 to 0.83 t ha-1) were similar with that of the TOC (Figure 2A), showing a decreasing trend followed by an increasing trend after 1950 (Figure 5A). Prior to 1950, the variabilities of marine and terrestrial carbon stocks displayed same trends as the total carbon stocks. Terrestrial carbon stocks displayed increasing trend after 1950 (Figure 6A). The carbon stocks per centimeter in the Min-Zhe belt also showed similar trends with the TOC, varying from 0.23 t ha-1 to 0.75 t ha-1 (Figure 2B). Carbon stocks in the Min-Zhe belt showed roughly the opposite trend of South Yellow Sea (Figure 5B). Before 1950, both marine and terrestrial carbon stocks followed roughly the same trend as total carbon stocks, while after 1950 (except for 42-A) marine carbon stocks increased and terrestrial carbon stocks decreased (Figure 6B).
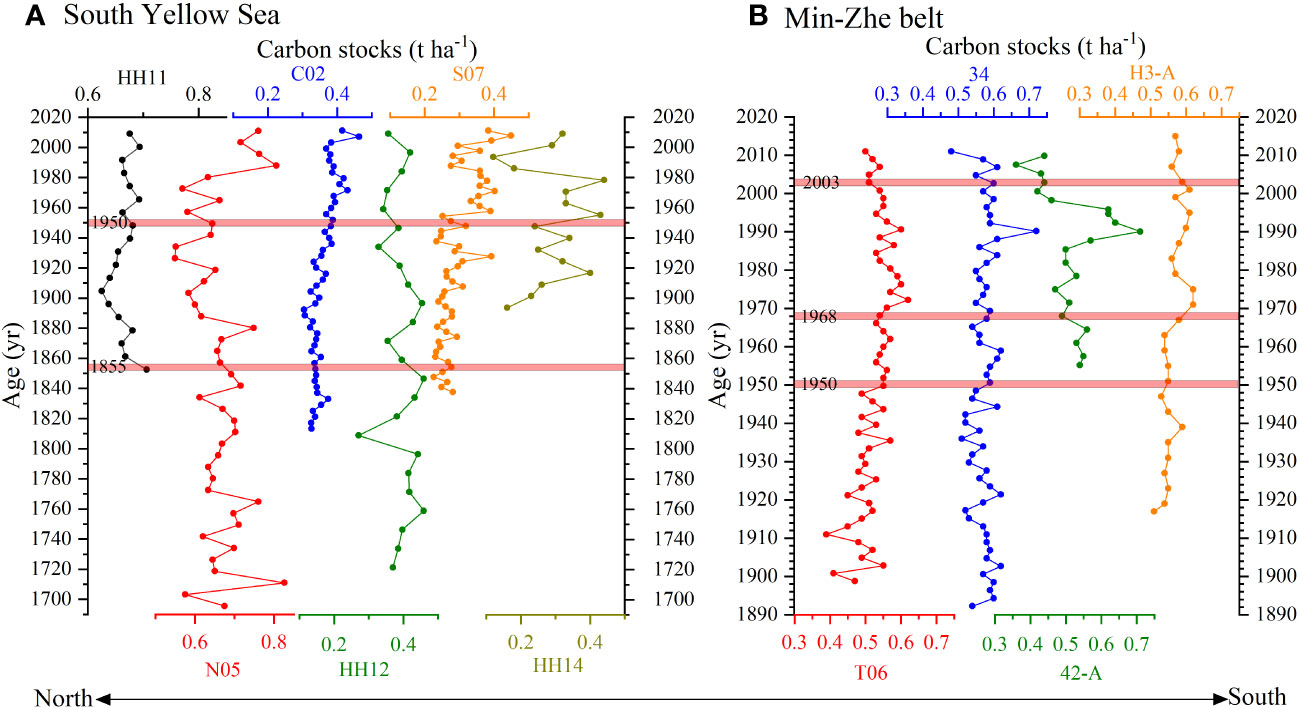
Figure 5 Temporal variability of carbon stocks in the sediment cores of the (A) South Yellow Sea and (B) Min-Zhe belt.
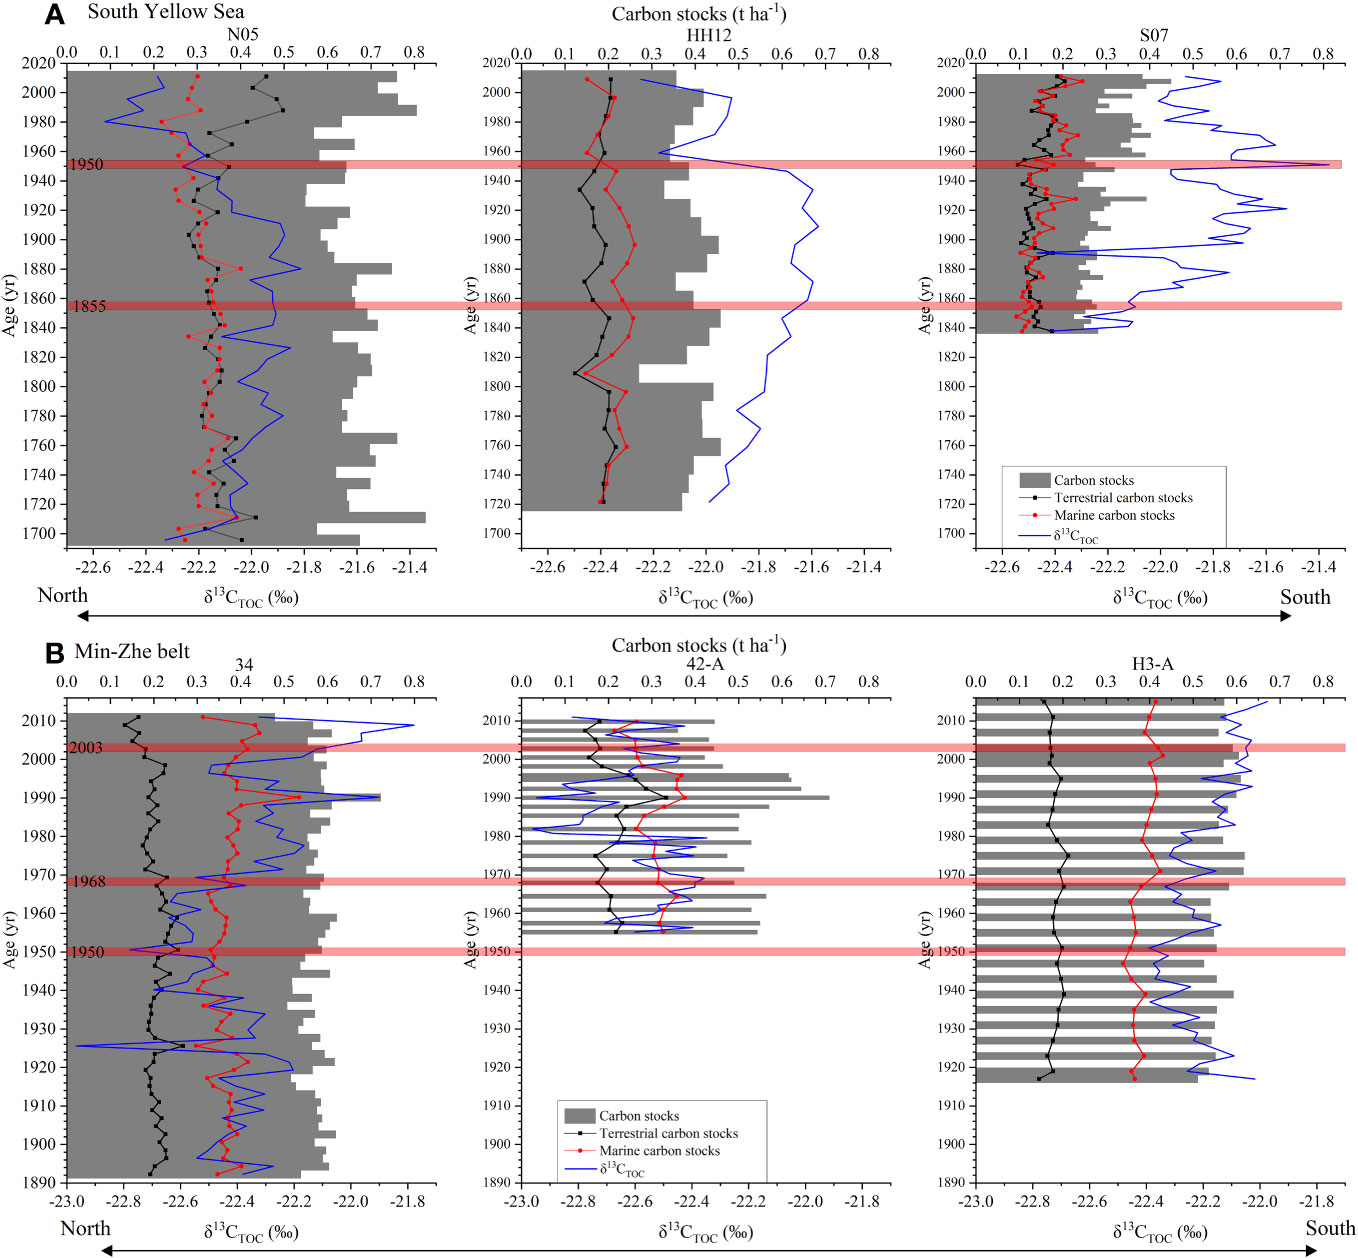
Figure 6 Temporal variability of carbon stocks, terrestrial carbon stocks, marine carbon stocks and δ13CTOC in the sediment cores of the (A) South Yellow Sea and (B) Min-Zhe belt.
The spatial distribution of carbon stock was consistent with TOC, with the average value of 50.1 t ha-1. The average value of carbon stock was 45.2 t ha-1 and 52.8 t ha-1 in South Yellow Sea and Min-Zhe belt, respectively, with the highest in the northern part of South Yellow Sea at about 67 t ha-1 (Figure 3C). The average carbon stock was 50.1 t ha-1, with average values of 45.2 t ha-1 and 52.8 t ha-1 for South Yellow Sea and Min-Zhe belt, respectively. Terrestrial and marine carbon stocks in the South Yellow Sea decreased from north towards south, while the spatial variations of terrestrial and marine carbon stocks in the Min-Zhe belt were not obvious (Figure 7A). Carbon stocks in our study were below the average value of global marine sediments and other regions in the world (Figure 8A; Table 1).
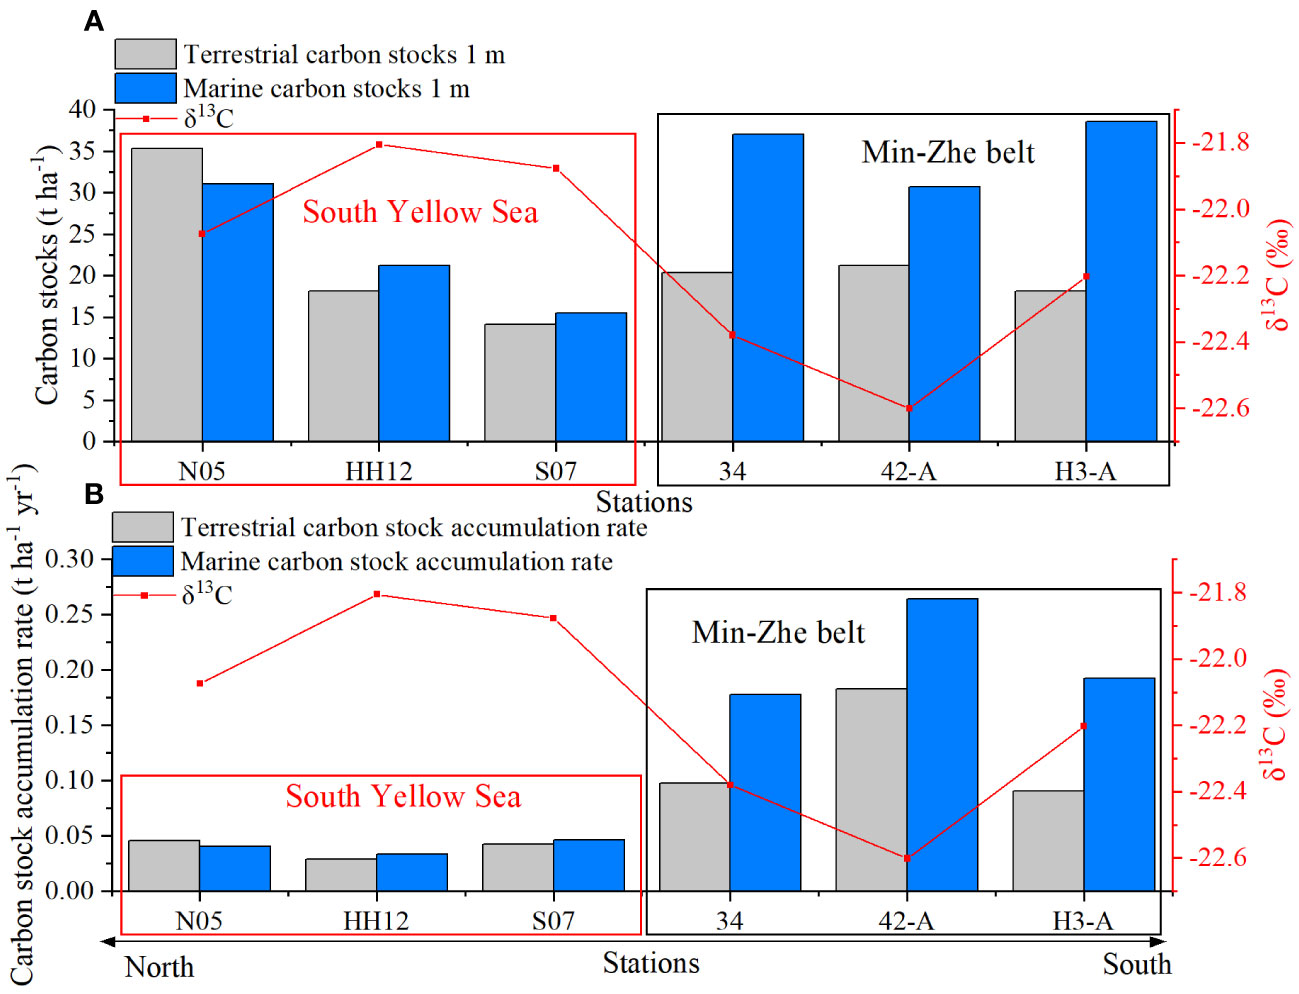
Figure 7 Comparison of the (A) terrestrial carbon stocks and marine carbon stocks; (B) terrestrial carbon stock accumulation rate and marine carbon stock accumulation rate in sediment cores from the study region.
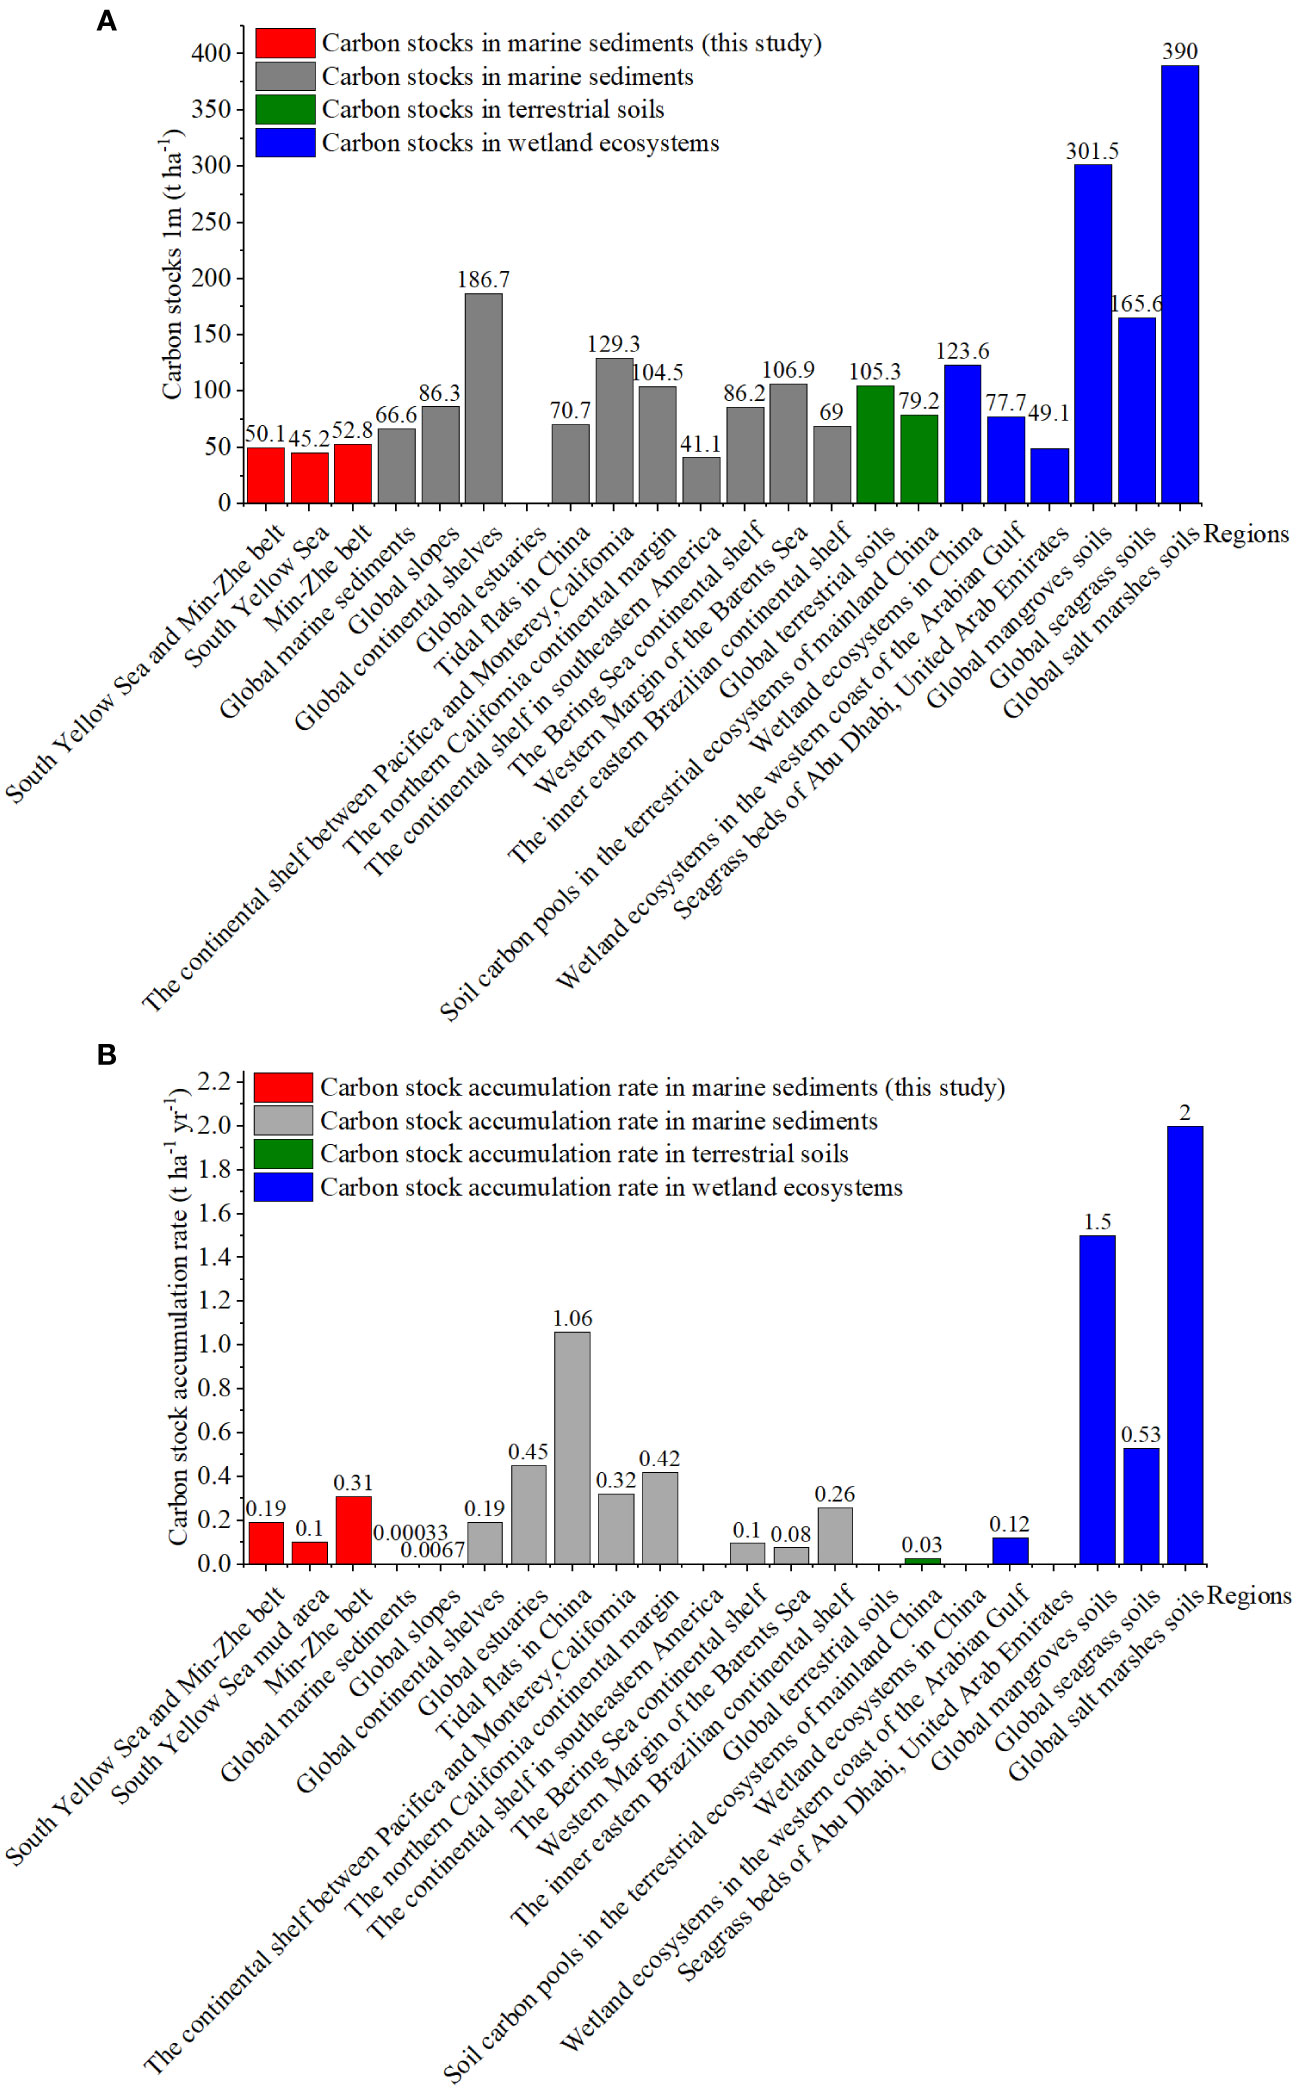
Figure 8 Comparison of (A) average carbon stocks and (B) average carbon stock accumulation rate between different regions all over the world.
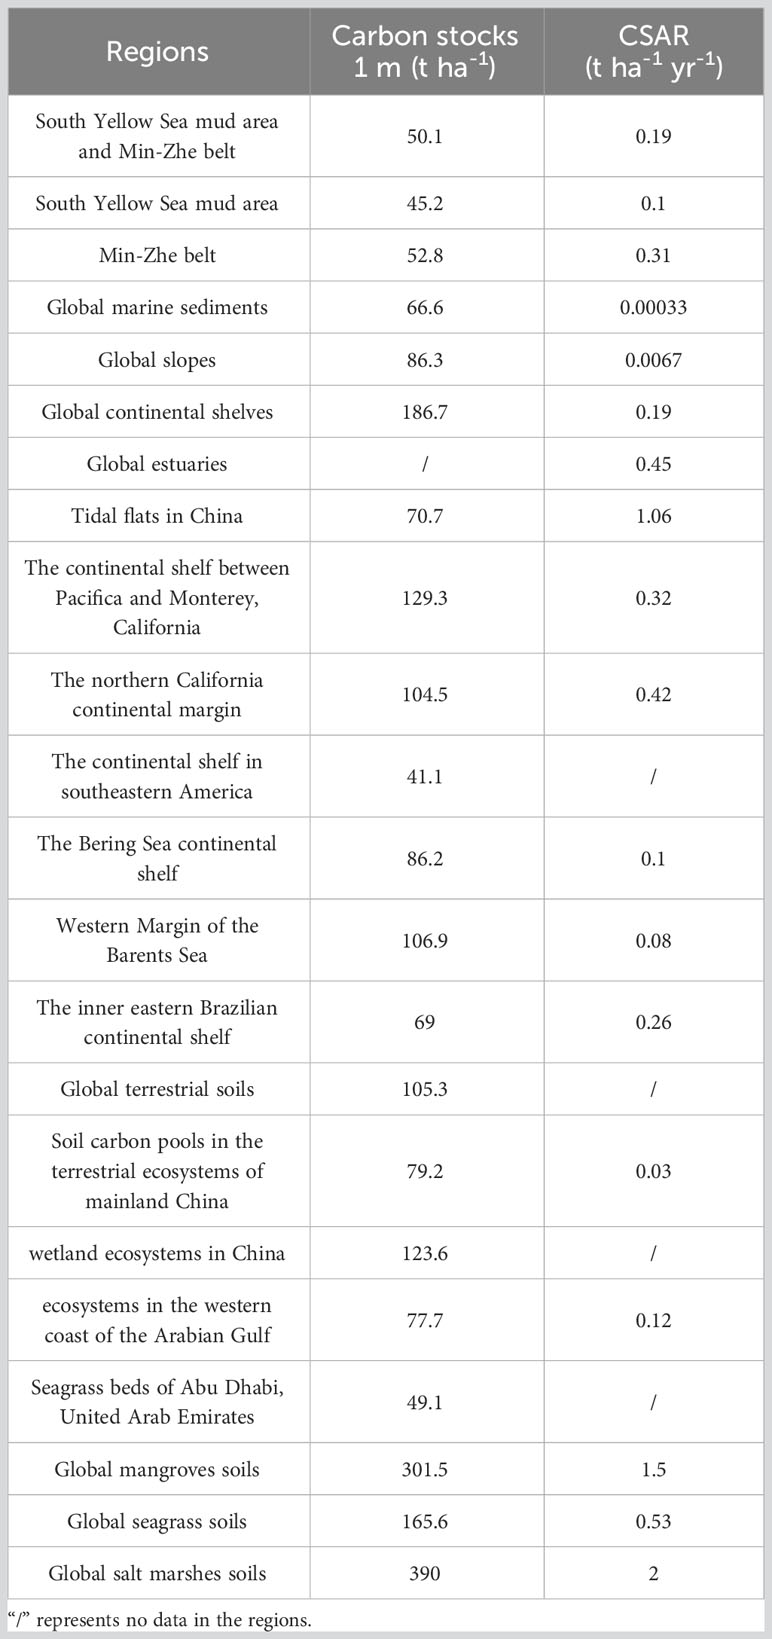
Table 1 Comparison of average carbon stocks and average carbon stock accumulation rate (CSAR) between different regions all over the world.
The carbon stock accumulation rate ranged from 0.06 to 0.44 t ha-1 yr-1 for 10 sediment cores, with the carbon stock accumulation rate in South Yellow Sea (average of 0.10 t ha-1 yr-1) being much lower than that in Min-Zhe belt (average of 0.31 t ha-1 yr-1) (Figure 3D). Carbon stock accumulation rate in the Min-Zhe belt were much higher than those in the South Yellow Sea (Figure 7B). Worldwide, carbon stock accumulation rate in the study area was at a relatively high level (Figure 8B; Table 1).
The δ13CTOC ranged from –23.0 to –21.4‰ for 6 sediment cores. In the South Yellow Sea, the δ13CTOC ranged from –22.6 to –21.8‰, –22.2 to –21.6‰ and –22.5 to –21.4‰ for sediment cores N05, HH12 and S07, respectively. The δ13CTOC showed a trend of increasing and then decreasing around 1950s from ancient times to the present (Figure 6A). In the Min-Zhe belt, the δ13CTOC ranged from –23.0 to –21.8‰, –23.0 to –22.3‰ and –22.4 to –22.0‰ for sediment cores 34, 42-A and H3-A, respectively. The δ13CTOC showed a trend of decreasing and then increasing around 1950s from ancient times to the present for cores 34 and H3-A, while displayed fluctuating variations for core 42-A (Figure 6B).
The calculation of sedimentary carbon stocks based on two principal parameters TOC and dry bulk density. The dry bulk density, i.e., the compaction of the sediments, was related to the weight and volume of the sediment, and the contents of sand, silt and clay (Banerjee et al., 2021). In general, low sedimentary TOC contents accompanied with high dry bulk density values (Campbell et al., 2014). The TOC contents and dry bulk density showed a significant negative correlation in this study (Figure 4), which was also reported in previous studies about soils in China, seagrass meadows along the Gulf coast of peninsular Florida, sediments in the southern Red Sea coast and also in the global ocean (Xie et al., 2007; Barry et al., 2018; Eid et al., 2019; Atwood et al., 2020). Generally, the linear relationship between the sedimentary TOC and dry bulk density in the Min-Zhe belt was stronger than that in the South Yellow Sea, and the correlation was significant in the relatively low range of TOC contents (< 0.8%, Figure 4B). To better assess the spatial and temporal variability of carbon stocks, a conventional δ13CTOC approach based on a binary mixing model was used to assess the proportions of terrestrial and marine carbon stocks in sediments with the age control from the South Yellow Sea and Min-Zhe belt (Figure 6).
The vertical variations of carbon stocks in the Min-Zhe belt sediment cores were significantly larger than that in the South Yellow Sea (Figures 2, 5), because the Min-Zhe belt was influenced by seasonal monsoon and storm (Xing et al., 2011; Zhao et al., 2021). There were age controls for all 6 sediment cores in the South Yellow Sea, but for 4 of the 11 sediment cores in Min-Zhe belt (Figure 5).
In the South Yellow Sea, the carbon stocks showed a relatively small variation trend until 1855 AD (Figure 5A), with similar proportions of terrestrial and marine carbon stocks (Figure 6A). Between 1855 and 1950, carbon stocks in the northern cores HH11 and N05 showed decreasing trends (Figure 5A). Furthermore, carbon stocks in cores from the middle and south of the South Yellow Sea were distinctly lower than that in the northern cores during this time interval (Figure 5A). This was consistent with previous studies that the relocation of Yellow River estuary from Yellow Sea to Bohai Sea since 1855 (Qiao et al., 2011; Zhou et al., 2014) caused the reduced terrestrial OC input to the South Yellow Sea, especially to the mid and southern South Yellow Sea (Liu et al., 2022). Coincidently, decreased terrestrial carbon stocks contents were found in the mid and southern cores (HH12 and S07, Figure 6A) since 1855 accompanied with lower terrestrial OC percentage (i.e., increased δ13CTOC values, Figure 6A). Since the 1950s, the carbon stocks generally increased in the South Yellow Sea (Figure 5A). In the northern core N05, the decrease of δ13CTOC indicated increased terrestrial OC contribution, causing higher terrestrial carbon stocks (Figure 6A). Despite the significant decrease in the runoff and sediment load of the Yellow River after 1950 AD (Cui et al., 2014), the increase of terrestrial carbon stocks may be influenced by the sediment input via stronger South Shandong Coastal Current under the influence of enhanced winter monsoon (Xing et al., 2009; Cai et al., 2014). Terrestrial carbon stocks in core HH12 from the middle part of the South Yellow Sea also increased, attributed to the erosion of both relocated and Old Yellow River delta (Bi et al., 2021; Qi et al., 2021; Yu et al., 2022). Similarly, a recent study reported increased terrestrial biomarker Σ(C27 + C29 + C31) n-alkanes in core HH12 since 1950 AD (Liu et al., 2022). In the southern core S07, although the terrestrial OC contribution increased, both terrestrial and marine carbon stocks obviously increased during the past 40 years (Figure 6A). Besides the influence of relocated and/or Old Yellow River (delta) sediments input, 12–27% of the Yangtze River water could flow to the South Yellow Sea in summer (Liu et al., 2003). Enhanced human activities (e.g., fertilizer use and sewage discharge) could elevate nutrient levels, leading to a trend of elevated marine carbon stocks (Zhu et al., 2018). Since core S07 was located in the south of the mud area, the marine primary productivity was triggered by the Yangtze River water as the nutrient input to the East China Sea from the Yangtze River increased during the past decades (Wei et al., 2015).
Overall, the relocation of Yellow River estuary from Yellow Sea to Bohai Sea had greatly affected the carbon stocks in the South Yellow Sea during 1855 to 1950 AD, resulting in an obvious reduction of terrestrial carbon stocks (Figure 6A). Since 1950s, terrestrial carbon stocks obviously increased in the South Yellow Sea attributed to the erosion of both relocated and Old Yellow River delta.
In the Min-Zhe belt, carbon stocks before 1950s were relative stable (Figure 5B), showing higher marine carbon stocks than terrestrial carbon stocks (Figure 6B). This could be interpreted as that the relatively low level of industrial and agricultural development prior to 1950 resulted in relatively constant sediment load from Yangtze River (Yang et al., 2012; Cao et al., 2017). Since 1950, the sediment flux from the Yangtze River to the East China Sea was mostly dominated by human activities (Yang et al., 2006; Wang et al., 2008), with 50% of sediments (390.0 × 10⁶ t yr-1) buried in the mud area (Qiao et al., 2017). During 1950–2000, carbon stocks in the Min-Zhe belt generally showed increasing trends (Figure 5B). The increased marine carbon stocks during this period (Figure 6B) were attributed to higher nutrient concentrations and higher productivity in the Yangtze River and the coastal sea as a result of the use of fertilizers and industry developments (Duan et al., 2014). Previous study also reported DIN and DIP transported by the Yangtze River began to increase rapidly in the 1980s (Chen et al., 2017). Obviously, carbon stocks showed peak values with lower δ13C in core 42-A during this period (Figure 6B), because this core was close to the Ou River Estuary and was likely influenced by the great flood of Ou River in 1970s with the deposition of a large amount of terrestrial materials (Song et al., 2012). However, the construction of reservoirs in the Ou River basin in 1988 and 1989 reduced the sediment export (Song et al., 2012), thus, the carbon stocks in core 42-A showed a decrease trend since 1990 (Figures 5B, 6B). Since the 21st century, the carbon stocks declined (Figure 5B), because the construction of the Three Gorges Dam in 2003 had significantly reduced the sediment load from the Yangtze River to the East China Sea, which was only 37% of that during 1950s to 1960s (Yang et al., 2006; Wang et al., 2008). Thus, terrestrial carbon stocks were also reduced (Figure 6B). In general, the carbon stocks in the Min-Zhe belt had shown an overall decreasing trend in recent years due to the construction of reservoirs in the Yangtze River basin. Moreover, the marine carbon stocks were distinctly higher than terrestrial carbon stocks during the past one hundred years, because the high nutrient levels triggered the primary productivity. This was consistent with increased marine biomarker records in the Min-Zhe belt (Peng et al., 2023).
The sediments in the South Yellow Sea mainly originated from the Yellow River via the Yellow River Estuary and the Old Yellow River Estuary (Zhao et al., 2021). The hydrodynamic environment allowed the deposition of large amounts of terrestrial OC from the Yellow River in the South Yellow Sea (Hu et al., 2016). Additionally, the erosion of Old Yellow River delta was another important source of the terrestrial OC in the South Yellow Sea (Qiao et al., 2017). The TOC contents showed high values in the north of South Yellow Sea and low values in the south (Figure 3A), which was opposite to the distribution patterns of dry bulk density (Figure 3B). This was interpreted as that the grain size of the sediments in the South Yellow Sea became coarser from north towards south (Xing et al., 2011), which resulted in higher dry bulk density values in the south. In addition, grain size is a key property for OC protection (Volkman et al., 2000), thus resulting in high TOC in the north and low TOC in the South.
The spatial distribution of carbon stocks showed a similar pattern with that of the TOC in the South Yellow Sea (Figures 3A, C). The highest carbon stocks occurred in the north of the South Yellow Sea (66.7 t ha-1 and 66.4 t ha-1 for cores HH11 and N05, respectively), which was related to high TOC contents of HH11 and N05 (1.00% and 0.99%, respectively). Cores HH11 and N05 were close to the Shandong subaqueous delta, which can received large amounts of terrestrial OC transported by the Yellow River (Cai et al., 2003; Fan et al., 2014).
The average carbon stock accumulation rate in each core was calculated to evaluate the burial rates in the mud areas, to include the influences of sedimentation rates. The carbon stock accumulation rate in the South Yellow Sea ranged from 0.06 t ha-1 yr-1 to 0.15 t ha-1 yr-1 (average 0.1 t ha-1 yr-1) (Figure 3D), comparable with that in surface sediments from Bohai and Yellow seas (0.153 t ha-1 yr-1) reported by Hu et al. (2016). The values of average terrestrial and marine carbon stock accumulation rate in the South Yellow Sea were 0.039 t ha-1 yr-1 and 0.04 t ha-1 yr-1, respectively (Table 2; Figure 7B).
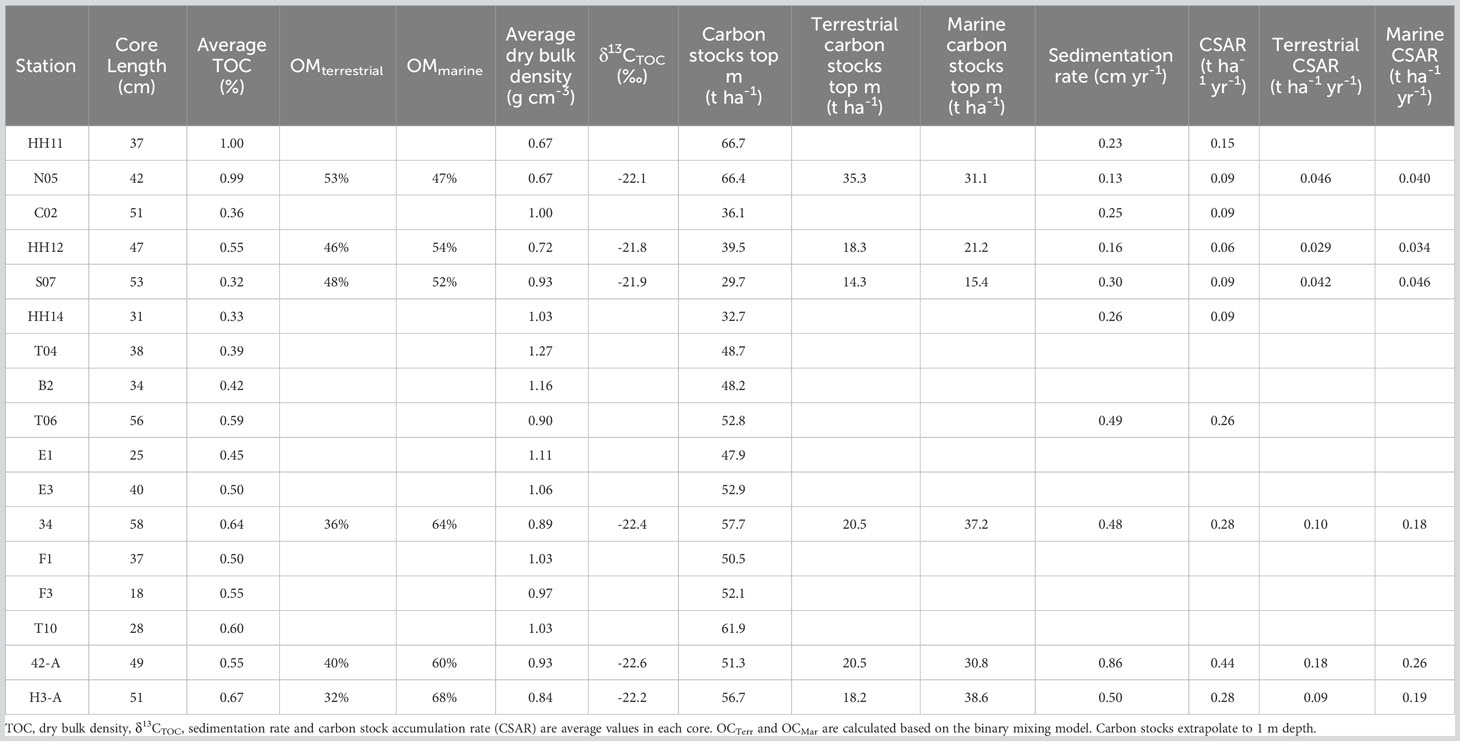
Table 2 Locations and parameters in sediment cores of this study.
The sediments in the Min-Zhe belt mud area were mainly transported from the Yangtze River (Hu et al., 2012). The sedimentary OC in the Min-Zhe belt displayed relatively low values (Figure 3A) due to the complex hydrodynamic inducing OC remineralization (Levin et al., 2009; Xu et al., 2015; Zhu et al., 2016; Zhao et al., 2018; Zhao et al., 2021). The average TOC value of the sediment cores in the Min-Zhe belt was 0.53% (Figure 3A), which was similar with the previous study of TOC in the sediment cores from this area (Wang et al., 2016; Cao et al., 2017; Chen et al., 2017). The TOC contents in the southern part of the Min-Zhe belt was higher than that in the northern part (Figure 3A), mainly owing to that the sediment grain size gradually became finer from north to south (Hu et al., 2012). Similar with the South Yellow Sea, the distribution of dry bulk density in the Min-Zhe belt showed an opposite trend to the distribution of TOC (Figure 3B).
The distribution pattern of carbon stocks (48.2 t ha-1 – 61.9 t ha-1) in the Min-Zhe belt were similar with TOC, showing an increasing trend from the north towards the south, as well as from the nearshore towards the offshore (Figure 3C). The terrestrial and marine carbon stocks were 19.9 t ha-1 and 35.4 t ha-1, respectively (Figure 7A; Table 2), consistent with the previous study of dominant marine OC contribution in sediment cores DZ28 (65.29%) and DZ41 (62.43%) in the Min-Zhe belt (Chen et al., 2017). The carbon stock accumulation rate in the Min-Zhe belt (average 0.31 t ha-1 yr-1; Table 2) was about twice as high as that in the East China Sea from the coast across the shelf (average 0.15 t ha-1 yr-1 in surface sediments) reported by Deng et al. (2006). The terrestrial and marine carbon stock accumulation rate were 0.12 t ha-1 yr-1 and 0.21 t ha-1 yr-1, respectively (Table 2). Deng et al. (2006) also reported that both the terrestrial carbon stock accumulation rate and marine carbon stock accumulation rate in the Min-Zhe belt were relatively high, exceeding 0.1 t ha-1 yr-1, especially in the Yangtze River Estuary, reaching 0.77 t ha-1 yr-1 and 1 t ha-1 yr-1. Overall, the Min-Zhe belt was characterized by high sedimentation rate and high terrestrial deposition due to the riverine input (Thomas et al., 2004; Wang et al., 2018).
Overall, in the mud areas of this study, the highest carbon stocks were found in the northern South Yellow Sea, the second were in the Min-Zhe belt and the lowest occurred in the southern South Yellow Sea. However, the carbon stock accumulation rate in the Min-Zhe belt were much higher than that in the South Yellow Sea, because the sedimentation rates were generally high in the Min-Zhe belt under the influence of the Yangtze River.
The distribution of carbon stocks were mainly influenced by terrestrial OC via river input and phytoplankton productivity under different nutrient conditions (Atwood et al., 2020) as well as sediment sources. In this study, the average downcore TOC contents (0.55%) were comparable to the previous report of 0.47 ± 0.24% in the surface sediments of the Chinese marginal seas (Zhao et al., 2021), while were lower than that of 1.1% in global marine sediments (Hayes et al., 2021). The dry bulk density is in the range of 0.93 g cm-3 to 2.6 g cm-3 (average 1.47 g cm-3) for the top 1 m of global marine sediments based on 2,106 data (Graw et al., 2021). Dry bulk density values in South Yellow Sea (0.84 g cm-3) and Min-Zhe belt (1.02 g cm-3) of this study were below the global average. Therefore, the average carbon stocks in 1 m depth of the South Yellow Sea (45.2 t ha-1) and Min-Zhe belt (52.8 t ha-1) were lower than that in global marine sediments (66.6 t ha-1), and much lower than global continental shelves (186.7 t ha-1) (Figure 8A, Table 1, Table S1) (Cusack et al., 2018; Atwood et al., 2020; Chen et al., 2020). However, the average sedimentation rates in the South Yellow Sea (0.22 cm yr-1) and Min-Zhe belt (0.58 cm yr-1) were much higher than the average sedimentation rate in the global marine sediments (coastal, shelf and upper slope, 0.01 cm yr-1) (Patchineelam and Smoak, 1999; Sommerfield et al., 2001; Lewis et al., 2002; Zaborska et al., 2008; Zhang et al., 2017). The higher sedimentation rates could result in a high OC burial rates, which facilitate the preservation of OC and lead to a high burial efficiency (Chen et al., 2020). Thus, the average carbon stock accumulation rate in the South Yellow Sea (0.1 t ha-1 yr-1) and in the Min-Zhe belt (0.31 t ha-1 yr-1) were higher than the global marine sediments (coastal, shelf and upper slope, 0.0067 t ha-1 yr-1) (Figure 8B; Table 1, Table S1). Likewise, although carbon stocks in mud area from the Chinese marginal seas were lower than soil carbon stocks of mainland China (79.2 t ha-1) and global average (105.3 t ha-1) (Tang et al., 2018; Atwood et al., 2020), the capability of storing OC were significantly higher in marine sediments (Figure 8; Table 1).
Additionally, carbon stocks in this study were generally lower than that in the tidal flats (70.7 t ha-1) and wetland (123.6 t ha-1) in China (Figure 8A; Table 1, Table S1) (Fourqurean et al., 2012; Siikamäki et al., 2012; Campbell et al., 2014; Atwood et al., 2017; Atwood et al., 2020; Chen et al., 2020). By considering the coverage area, the total carbon stocks in 1 m depth were 0.45 Pg C in the South Yellow Sea and 0.3 Pg C in the Min-Zhe belt, much higher than that of the tidal flats (0.078 Pg C) and blue carbon ecosystem (0.021 Pg C) in China (Tang et al., 2018; Chen et al., 2020). The total carbon stocks in 1 m sediments from the mud areas of this study was equivalent to 2.75 Pg CO2, thus, the vast area of Chinese marginal seas enabled it to preserve a large amount of OC and was an important area for OC burial and preservation. The stable depositional environment allowed the burial efficiency of the terrestrial OC in South Yellow Sea to reach about 68 ± 30% (Zhao et al., 2021). Although the burial efficiency of the marine OC in the South Yellow Sea and Min-Zhe belt was much lower (7 ± 3% and 14 ± 4%, respectively), it was still much higher than that of the global ocean (0.25%) (Zhao et al., 2021). It was noteworthy that the carbon stocks partly showed a decreasing trend in recent years due to the construction of dams and hydrological facilities in rivers, especially Min-Zhe belt (Figure 5), which may affect the burial of OC in the Chinese marginal seas to some extent (Xu and Milliman, 2009). The impact of human activities on the marginal seas was increasing over time (Halpern et al., 2015). The reduced carbon stocks allow OC to re-enter the atmosphere, which may exacerbate the global greenhouse effect to some degree.
In this study, we calculated carbon stocks and carbon stock accumulation rate in 17 sediment cores from the South Yellow Sea and Min-Zhe belt to evaluate the spatiotemporal variabilities of organic carbon preservation of the Chinese marginal seas.
1. In the South Yellow Sea, terrestrial carbon stocks showed a decreasing trend from 1855 to 1950 caused by the relocation of the Yellow River Estuary in 1855. After the 1950s, terrestrial carbon stocks increased in the South Yellow Sea mainly due to the enhancement of South Shandong Coastal Current.
2. In the Min-Zhe belt, the marine carbon stocks were relatively high due high nutrient concentration from riverine inputs. During the past decades, the terrestrial carbon stocks decreased because the construction of reservoirs in the Yangtze River led to lower sediment inputs.
3. In terms of spatial distribution, the highest carbon stocks were in the northern part of the South Yellow Sea, followed by the Min-Zhe belt and the lowest in the central and southern parts of the South Yellow Sea. Although the carbon stocks in this study were lower compared to the global shelf sediments, the high sedimentation rates in mud areas from Chinese marginal seas resulted in a higher organic carbon burial capacity.
The original contributions presented in the study are included in the article/Supplementary Material. Further inquiries can be directed to the corresponding authors.
HM: Conceptualization, Writing – original draft. XX: Conceptualization, Writing – Review & Editing, Supervision. YD: Validation, Resources. XF: Resources. WC: Resources. LS: Resources. XB: Validation, Resources. SD: Validation, Resources. MZ: Conceptualization, Writing – Review & Editing, Funding acquisition.
The author(s) declare financial support was received for the research, authorship, and/or publication of this article. This study was financially supported by Laoshan Laboratory (LSKJ202204002), the National Natural Science Foundation of China (Grant No. U1706219) and the Fundamental Research Funds for the Central Universities (202242001).
We thank the crew of R/V Dongfanghong II of the Ocean University of China, R/V Runjiang I and R/V HaiLi for the assistance in sediment coring. We thank Jianying Liu, Peng Peng, Zhong Cao and Gui’e Jin for sampling help. We thank Yonghui Cui and Ke Liu for scholarly discussions.
The authors declare that the research was conducted in the absence of any commercial or financial relationships that could be construed as a potential conflict of interest.
All claims expressed in this article are solely those of the authors and do not necessarily represent those of their affiliated organizations, or those of the publisher, the editors and the reviewers. Any product that may be evaluated in this article, or claim that may be made by its manufacturer, is not guaranteed or endorsed by the publisher.
The Supplementary Material for this article can be found online at: https://www.frontiersin.org/articles/10.3389/fmars.2023.1282891/full#supplementary-material
Asner G. P., Powell G. V. N., Mascaro J., Knapp D. E., Clark J. K., Jacobson J., et al. (2010). High-resolution forest carbon stocks and emissions in the Amazon. Proc. Natl. Acad. Sci. U. S. A. 107, 16738–16742. doi: 10.1073/pnas.1004875107
Atwood T. B., Connolly R. M., Almahasheer H., Carnell P. E., Duarte C. M., Lewis C. J. E., et al. (2017). Global patterns in mangrove soil carbon stocks and losses. Nature. Clim. Change. 7, 523–528. doi: 10.1038/nclimate3326
Atwood T. B., Witt A., Mayorga J., Hammill E., Sala E. (2020). Global patterns in marine sediment carbon stocks. Front. Mar. Sci. 7. doi: 10.3389/fmars.2020.00165
Avelar S., van der Voort T. S., Eglinton T. I. (2017). Relevance of carbon stocks of marine sediments for national greenhouse gas inventories of maritime nations. Carbon Balance Manage. 12, 1–10. doi: 10.1186/s13021-017-0077-x
Banerjee K., Bal G., Mallik K., Paul R. (2021). Variation in sediment organic carbon stock in Bhitarkanika wetlands, India. Indian J. Geo-Marine Sci. 50, 310–319. Available at: http://nopr.niscpr.res.in/handle/123456789/57370.
Barry S. C., Bianchi T. S., Shields M. R., Hutchings J. A., Jacoby C. A., Frazer T. K. (2018). Characterizing blue carbon stocks in Thalassia testudinum meadows subjected to different phosphorus supplies: A lignin biomarker approach. Limnol. Oceanogr. 63, 2630–2646. doi: 10.1002/lno.10965
Bi N., Wang H., Wu X., Saito Y., Xu C., Yang Z. (2021). Phase change in evolution of the modern Huanghe (Yellow River) Delta: Process, pattern, and mechanisms. Mar. Geol. 437, 106516. doi: 10.1016/j.margeo.2021.106516
Bianchi T. S., Cui X., Blair N. E., Burdige D. J., Eglinton T. I., Galy V. (2018). Centers of organic carbon burial and oxidation at the land-ocean interface. Org. Geochem. 115, 138–155. doi: 10.1016/j.orggeochem.2017.09.008
Burdige D. J. (2005). Burial of terrestrial organic matter in marine sediments: A re-assessment. Global Biogeochem. Cycles 19, GB4011. doi: 10.1029/2004GB002368
Burdige D. J. (2007). Preservation of organic matter in marine sediments: controls, mechanisms, and an imbalance in sediment organic carbon budgets? Chem. Rev. 107, 467–485. doi: 10.1021/cr050347q
Cai D. L., Shi X., Zhou W., Liu W., Zhang S., Cao Y., et al. (2003). Sources and transportation of suspended matter and sediment in the southern Yellow Sea: Evidence from stable carbon isotopes. Chin. Sci. Bull. 48 (Suppl 1), 21–29. doi: 10.1007/BF02900936
Cai F., Su X., Liu J., Li B., Lei G. (2009). Coastal erosion in China under the condition of global climate change and measures for its prevention. Prog. Nat. Sci. 19, 415–426. doi: 10.1016/j.pnsc.2008.05.034
Cai D., Sun Y., Zhang X., Su Y., Wu Y., Chen Z., et al. (2014). Reconstructing a primary productivity history over the past 200 a using sediment organic carbon content and the stable isotope composition from the East China Sea and the Yellow Sea. Acta Oceanol. Sin. 36, 46–50. doi: 10.3969/j.issn.02534193.2014.02.005
Campbell J. E., Lacey E. A., Decker R. A., Crooks S., Fourqurean J. W. (2014). Carbon storage in seagrass beds of Abu Dhabi, United Arab Emirates. Estuaries Coasts 38, 242–251. doi: 10.1007/s12237-014-9802-9
Cao M., Woodward F. I. (1998). Net primary and ecosystem production and carbon stocks of terrestrial ecosystems and their responses to climate change. Glob. Change Biol. 4, 185–198. doi: 10.1046/j.1365-2486.1998.00125.x
Cao Y., Xing L., Zhang T., Liao W.-H. (2017). Multi-proxy evidence for decreased terrestrial contribution to sedimentary organic matter in coastal areas of the East China Sea during the past 100 years. Sci. Total Environ. 599–600, 1895–1902. doi: 10.1016/j.scitotenv.2017.05.159
Chen C.-T. A., Borges A. V. (2009). Reconciling opposing views on carbon cycling in the coastal ocean: Continental shelves as sinks and near-shore ecosystems as sources of atmospheric CO2. Deep Sea Res. Part II Top. Stud. Oceanogr. 56, 578–590. doi: 10.1016/j.dsr2.2009.01.001
Chen L., Liu J., Xing L., Krauss K. W., Wang J., Xu G., et al. (2017). Historical changes in organic matter input to the muddy sediments along the Zhejiang-Fujian Coast, China over the past 160 years. Org. Geochem. 111, 13–25. doi: 10.1016/j.orggeochem.2017.06.003
Chen J., Wang D., Li Y., Yu Z., Chen S. (2020). The carbon stock and sequestration rate in tidal flats from coastal China. Global Biogeochem. Cycles 34, e2020GB006772. doi: 10.1029/2020GB006772
Chu M., Xiao X., Ding Y., Zhao M. (2021). Sediment organic matter sources and carbon stock associated with a mangrove reserve in Danzhou Bay, Hainan, China. Mar. Sci. 45, 22–31. doi: 10.11759/hykx20200215001
Cui B.-L., Chang X.-L., Shi W.-Y. (2014). Abrupt changes of runoff and sediment load in the lower reaches of the Yellow River, China. Water Resour. 41, 252–260. doi: 10.1134/S009780781403004X
Cusack M., Saderne V., Arias-Ortiz A., Masqué P., Krishnakumar P. K., Rabaoui L., et al. (2018). Organic carbon sequestration and storage in vegetated coastal habitats along the western coast of the Arabian Gulf. Environ. Res. Lett. 13, 074007. doi: 10.1088/1748-9326/aac899
Deng B., Zhang J., Wu Y. (2006). Recent sediment accumulation and carbon burial in the East China Sea. Global Biogeochem. Cycles 20, GB3014. doi: 10.1029/2005GB002559
Don A., Schumacher J., Freibauer A. (2011). Impact of tropical land-use change on soil organic carbon stocks – a meta-analysis. Glob. Change Biol. 17, 1658–1670. doi: 10.1111/j.1365-2486.2010.02336.x
Duan S., Xing L., Zhang H., Feng X., Yang H., Zhao M. (2014). Upwelling and anthropogenic forcing on phytoplankton productivity and community structure changes in the Zhejiang coastal area over the last 100 years. Acta Oceanol. Sin. 33 (10), 1–9. doi: 10.1007/s13131-014-0535-1
Duarte C. M., Middelburg J. J., Caraco N. (2005). Major role of marine vegetation on the oceanic carbon cycle. Biogeosciences 2, 1–8. doi: 10.5194/bg-2-1-2005
Eid E. M., Arshad M., Shaltout K. H., El-Sheikh M. A., Alfarhan A. H., Picó Y., et al. (2019). Effect of the conversion of mangroves into shrimp farms on carbon stock in the sediment along the southern Red Sea coast, Saudi Arabia. Environ. Res. 176, 108536. doi: 10.1016/j.envres.2019.108536
Estrada G. C. D., Soares M. L. G. (2017). Global patterns of aboveground carbon stock and sequestration in mangroves. An. Acad. Bras. Ciênc. 89, 973–989. doi: 10.1590/0001-3765201720160357
Falkowski P., Scholes R. J., Boyle E., Canadell J., Canfield D., Elser J., et al. (2000). The global carbon cycle: A test of our knowledge of earth as a system. Science.> 290, 291–296. doi: 10.1126/science.290.5490.291
Fan Y., Lan J., Zhao Z., Zhao M. (2014). Sedimentary records of hydroxylated and methoxylated polybrominated diphenyl ethers in the southern Yellow Sea. Mar. pollut. Bull. 84, 366–372. doi: 10.1016/j.marpolbul.2014.05.035
Fourqurean J. W., Duarte C. M., Kennedy H., Marbà N., Holmer M., Mateo M. A., et al. (2012). Seagrass ecosystems as a globally significant carbon stock. Nature. Geosci. 5, 505–509. doi: 10.1038/ngeo1477
Friedlingstein P., O’Sullivan M., Jones M. W., Andrew R. M., Hauck J., Olsen A., et al. (2020). Global carbon budget 2020. Earth Syst. Sci. 12, 3269–3340. doi: 10.5194/essd-12-3269-2020
Gibbs H. K., Brown S., Niles J. O., Foley J. A. (2007). Monitoring and estimating tropical forest carbon stocks: Making REDD a reality. Environ. Res. Lett. 2, 45023. doi: 10.1088/1748-9326/2/4/045023
Graw J. H., Wood W. T., Phrampus B. J. (2021). Predicting global marine sediment density using the random forest regressor machine learning algorithm. J. Geophys. Res. Solid Earth 126, e2020JB020135. doi: 10.1029/2020JB020135
Halpern B. S., Frazier M., Potapenko J., Casey K. S., Koenig K., Longo C., et al. (2015). Spatial and temporal changes in cumulative human impacts on the world’s ocean. Nat. Commun. 6, 7615. doi: 10.1038/ncomms8615
Hayes C. T., Costa K. M., Anderson R. F., Calvo E., Chase Z., Demina L. L., et al. (2021). Global ocean sediment composition and burial flux in the deep sea. Global Biogeochem. Cycles 35, e2020GB006769. doi: 10.1029/2020GB006769
Hedges J. I., Keil R. G. (1995). Sedimentary organic matter preservation: an assessment and speculative synthesis. Mar. Chem. 49, 81–115. doi: 10.1016/0304-4203(95)00008-F
Hu L., Shi X., Bai Y., Qiao S., Li L., Yu Y., et al. (2016). Recent organic carbon sequestration in the shelf sediments of the Bohai Sea and Yellow Sea, China. J. Mar. Syst. 155, 50–58. doi: 10.1016/j.jmarsys.2015.10.018
Hu L., Shi X., Yu Z., Lin T., Wang H., Ma D., et al. (2012). Distribution of sedimentary organic matter in estuarine-inner shelf regions of the East China Sea: Implications for hydrodynamic forces and anthropogenic impact. Mar. Chem. 142, 29–40. doi: 10.1016/j.marchem.2012.08.004
Hunt C., Demšar U., Dove D., Smeaton C., Cooper R., Austin W. E. N. (2020). Quantifying marine sedimentary carbon: a new spatial analysis approach using seafloor acoustics, imagery, and ground-truthing data in Scotland. Front. Mar. Sci. 7. doi: 10.3389/fmars.2020.00588
Jia Y., Li D.-W., Yu M., Zhao X., Xiang R., Li G., et al. (2019). High- and low-latitude forcing on the south Yellow Sea surface water temperature variations during the Holocene. Glob. Planet. Change. 182, 103025. doi: 10.1016/j.gloplacha.2019.103025
Jiang W., Huang T., Chen H., Lian L., Liang X., Jia C., et al. (2018). Contamination of short-chain chlorinated paraffins to the biotic and abiotic environments in the Bohai Sea. Environ. pollut. 233, 114–124. doi: 10.1016/j.envpol.2017.10.034
Jiao N., Herndl G. J., Hansell D. A., Benner R., Kattner G., Wilhelm S. W., et al. (2010). Microbial production of recalcitrant dissolved organic matter: Long-term carbon storage in the global ocean. Nat. Rev. Microbiol. 8, 593–599. doi: 10.1038/nrmicro2386
Jiao N., Liang Y., Zhang Y. Y., Liu J., Zhang Y. Y., Zhang R., et al. (2018). Carbon pools and fluxes in the China Seas and adjacent oceans. Sci. China Earth Sci. 61, 1535–1563. doi: 10.1007/s11430-018-9190-x
Jurado E., Dachs J., Duarte C. M., Simó R. (2008). Atmospheric deposition of organic and black carbon to the global oceans. Atmos. Environ. 42, 7931–7939. doi: 10.1016/j.atmosenv.2008.07.029
Keith H., Mackey B. G., Lindenmayer D. B. (2009). Re-evaluation of forest biomass carbon stocks and lessons from the world’s most carbon-dense forests. Proc. Natl. Acad. Sci. U.S.A. 106, 11635–11640. doi: 10.1073/pnas.0901970106
Levin L. A., Ekau W., Gooday A. J., Jorissen F., Middelburg J. J., Naqvi S. W. A. A., et al. (2009). Effects of natural and human-induced hypoxia on coastal benthos. Biogeosciences 6, 2063–2098. doi: 10.5194/bg-6-2063-2009
Lewis R. C., Coale K. H., Edwards B. D., Marot M., Douglas J. N., Burton E. J. (2002). Accumulation rate and mixing of shelf sediments in the Monterey Bay National Marine Sanctuary. Mar. Geol. 181, 157–169. doi: 10.1016/S0025-3227(01)00265-1
Li J., Hu B., Wei H., Zhao J., Zou L., Bai F., et al. (2014). Provenance variations in the Holocene deposits from the southern Yellow Sea: Clay mineralogy evidence. Cont. Shelf Res. 90, 41–51. doi: 10.1016/j.csr.2014.05.001
Liu J., Li D.-W., Ding Y., Ge T., Chen W., Huh C.-A., et al. (2022). Influences of the 1855 AD Huanghe (Yellow River) relocation on sedimentary organic carbon burial in the southern Yellow Sea. Front. Mar. Sci. 9. doi: 10.3389/fmars.2022.824617
Liu S. M., Zhang J., Chen S. Z., Chen H. T., Hong G. H., Wei H., et al. (2003). Inventory of nutrient compounds in the Yellow Sea. Cont. Shelf Res. 23, 1161–1174. doi: 10.1016/S0278-4343(03)00089-X
Ma H., Xiao X., Jin G., Zhao M. (2021). Carbon stock in the Laizhou bay and evaluation of its ocean health. Quat. Sci. 41, 1181–1191. doi: 10.11928/j.issn.1001-7410.2021.04.24
Meng W., Feagin R. A., Hu B., He M., Li H. (2019). The spatial distribution of blue carbon in the coastal wetlands of China. Estuar. Coast. Shelf Sci. 222, 13–20. doi: 10.1016/j.ecss.2019.03.010
Mentaschi L., Vousdoukas M. I., Pekel J.-F., Voukouvalas E., Feyen L. (2018). Global long-term observations of coastal erosion and accretion. Sci. Rep. 8, 12876. doi: 10.1038/s41598-018-30904-w
Oberle F. K. J., Storlazzi C. D., Hanebuth T. J. J. (2016). What a drag: Quantifying the global impact of chronic bottom trawling on continental shelf sediment. J. Mar. Syst. 159, 109–119. doi: 10.1016/j.jmarsys.2015.12.007
Pan G., Li L., Wu L., Zhang X. (2004). Storage and sequestration potential of topsoil organic carbon in China’s paddy soils. Glob. Change Biol. 10, 79–92. doi: 10.1111/j.1365-2486.2003.00717.x
Patchineelam S. R., Smoak J. M. (1999). Sediment accumulation rates along the inner eastern Brazilian continental shelf. Geo-Marine Lett. 19, 196–201. doi: 10.1007/s003670050109
Peng P., Bi R., Sachs J. P., Shi J., Luo Y., Chen W., et al. (2023). Phytoplankton community changes in a coastal upwelling system during the last century. Glob. Planet. Change. 224, 104101. doi: 10.1016/j.gloplacha.2023.104101
Qi L., Wu Y., Chen S., Wang X. (2021). Evaluation of abandoned Huanghe Delta as an important carbon source for the Chinese marginal seas in recent decades. J. Geophys. Res. Ocean. 126, e2020JC017125. doi: 10.1029/2020JC017125
Qiao S., Shi X., Saito Y., Li X., Yu Y., Bai Y., et al. (2011). Sedimentary records of natural and artificial Huanghe (Yellow River) channel shifts during the Holocene in the southern Bohai Sea. Cont. Shelf Res. 31, 1336–1342. doi: 10.1016/j.csr.2011.05.007
Qiao S., Shi X., Wang G., Zhou L., Hu B., Hu L., et al. (2017). Sediment accumulation and budget in the Bohai Sea, Yellow Sea and East China Sea. Mar. Geol. 390, 270–281. doi: 10.1016/j.margeo.2017.06.004
Scharlemann J. P. W., Tanner E. V. J., Hiederer R., Kapos V. (2014). Global soil carbon: Understanding and managing the largest terrestrial carbon pool. Carbon Manage. 5, 81–91. doi: 10.4155/cmt.13.77
Schlünz B., Schneider R. R. (2000). Transport of terrestrial organic carbon to the oceans by rivers: Re-estimating flux- and burial rates. Int. J. Earth Sci. 88, 599–606. doi: 10.1007/s005310050290
Shi X., Shen S., Yi H., Chen Z., Meng Y. (2003). Modern sedimentary environments and dynamic depositional systems in the southern Yellow Sea. Chin. Sci. Bull. 48 (Suppl 1), 1–7. doi: 10.1007/bf02900933
Siikamäki J. V., Sanchirico J. N., Jardine S., Mclaughlin D., Morris D. F. (2012). Blue carbon: Global option for reducing emissions from the degradation and development of coastal ecosystems (Washington, DC: Resources for the Future).
Smeaton C., Hunt C. A., Turrell W. R., Austin W. E. N. (2021). Marine sedimentary carbon stocks of the United Kingdom’s exclusive economic zone. Front. Earth Sci. 9. doi: 10.3389/feart.2021.593324
Sommerfield C. K., Aller R. C., Nittrouer C. A. (2001). Sedimentary carbon, sulfur, and iron relationships in modern and ancient diagenetic environments of the Eel River Basin (U.S.A.). J. Sediment. Res. 71, 335–345. doi: 10.1306/2DC40947-0E47-11D7-8643000102C1865D
Song J. (2010). Biogeochemical processes of biogenic elements in China marginal seas (Zhejiang: Zhejiang University Press). doi: 10.1007/978-3-642-04060-3
Song L., Xia X., Liu Y., Cai T. (2012). Variations in water and sediment fluxes from Oujiang River to Estuary. J. Sediment. Res. 1, 46–52. doi: 10.16239/j.cnki.0468-155x.2012.01.006
Tang X., Zhao X., Bai Y., Tang Z., Wang W., Zhao Y., et al. (2018). Carbon pools in China’s terrestrial ecosystems: New estimates based on an intensive field survey. Proc. Natl. Acad. Sci. U.S.A. 115, 4021–4026. doi: 10.1073/pnas.1700291115
Tao S., Eglinton T. I., Montluçon D. B., McIntyre C., Zhao M. (2016). Diverse origins and pre-depositional histories of organic matter in contemporary Chinese marginal sea sediments. Geochim. Cosmochim. Acta 191, 70–88. doi: 10.1016/j.gca.2016.07.019
Thomas H., Bozec Y., Elkalay K., de Baar H. J. W. (2004). Enhanced open ocean storage of CO2 from shelf sea pumping. Science.> 304, 1005–1008. doi: 10.1126/science.1095491
Volkman J. K., Rohjans D., Rullkötter J., Scholz-Böttcher B. M., Liebezeit G. (2000). Sources and diagenesis of organic matter in tidal flat sediments from the German Wadden Sea. Cont. Shelf Res. 20, 1139–1158. doi: 10.1016/S0278-4343(00)00016-9
Wang C., Hao Z., Gao J., Feng Z., Ding Y., Zhang C., et al. (2020). Reservoir construction has reduced organic carbon deposition in the East China Sea by half since 2006. Geophys. Res. Lett. 47, e2020GL087357. doi: 10.1029/2020GL087357
Wang H., Kandasamy S., Liu Q., Lin B., Lou J.-Y., Veeran Y., et al. (2021). Roles of sediment supply, geochemical composition and monsoon on organic matter burial along the longitudinal mud belt in the East China Sea in modern times. Geochim. Cosmochim. Acta 305, 66–86. doi: 10.1016/j.gca.2021.04.025
Wang Y., Li G., Zhang W., Dong P. (2014). Sedimentary environment and formation mechanism of the mud deposit in the central South Yellow Sea during the past 40 kyr. Mar. Geol. 347, 123–135. doi: 10.1016/j.margeo.2013.11.008
Wang X., Ma H., Li R., Song Z., Wu J. (2012). Seasonal fluxes and source variation of organic carbon transported by two major Chinese Rivers: The Yellow River and Changjiang (Yangtze) River. Global Biogeochem. Cycles 26, GB2025. doi: 10.1029/2011GB004130
Wang R., Wang J., Li F., Yang S., Tan L. (2016). Vertical distribution and indications of lipids biomarkers in the sediment core from East China Sea. Cont. Shelf Res. 122, 43–50. doi: 10.1016/j.csr.2016.03.027
Wang J., Xiao X., Zhou Q., Xu X., Zhang C., Liu J., et al. (2018). Rates and fluxes of centennial-scale carbon storage in the fine-grained sediments from the central South Yellow Sea and Min-Zhe belt, East China Sea. J. Oceanol. Limnol. 36, 139–152. doi: 10.1007/s00343-017-6242-y
Wang H., Yang Z., Wang Y., Saito Y., Liu J. P. (2008). Reconstruction of sediment flux from the Changjiang (Yangtze River) to the sea since the 1860s. J. Hydrol. 349, 318–332. doi: 10.1016/j.jhydrol.2007.11.005
Wei Q., Yao Q., Wang B., Wang H., Yu Z. (2015). Long-term variation of nutrients in the southern Yellow Sea. Cont. Shelf Res. 111, 184–196. doi: 10.1016/j.csr.2015.08.003
Xie Z., Zhu J., Liu G., Cadisch G., Hasegawa T., Chen C., et al. (2007). Soil organic carbon stocks in China and changes from 1980s to 2000s. Glob. Change Biol. 13, 1989–2007. doi: 10.1111/j.1365-2486.2007.01409.x
Xing L., Tao S., Zhang H., Liu Y., Yu Z., Zhao M. (2011). Distributions and origins of lipid biomarkers in surface sediments from the southern Yellow Sea. Appl. Geochemistry 26, 1584–1593. doi: 10.1016/j.apgeochem.2011.06.024
Xing L., Zhao M., Gao W., Wang F., Zhang H., Li L., et al. (2014). Multiple proxy estimates of source and spatial variation in organic matter in surface sediments from the southern Yellow Sea. Org. Geochem. 76, 72–81. doi: 10.1016/j.orggeochem.2014.07.005
Xing L., Zhao M., Zhang H., Sun Y., Tang Q., Yu Z., et al. (2009). Biomarker records of phytoplankton community structure changes in the Yellow Sea over the last 200 years. Periodical Ocean Univ. China. 39, 317–322. doi: 10.16441/j.cnki.hdxb.2009.02.028
Xu B., Bianchi T. S., Allison M. A., Dimova N. T., Wang H., Zhang L., et al. (2015). Using multi-radiotracer techniques to better understand sedimentary dynamics of reworked muds in the Changjiang River estuary and inner shelf of East China Sea. Mar. Geol. 370, 76–86. doi: 10.1016/j.margeo.2015.10.006
Xu K., Milliman J. D. (2009). Seasonal variations of sediment discharge from the Yangtze River before and after impoundment of the Three Gorges Dam. Geomorphology 104, 276–283. doi: 10.1016/j.geomorph.2008.09.004
Yang Q., Song X., Sun Y., Huang J. (2012). Application of biologic silicon in modern sedimentary section to reconstruction of phytoplankton changes in the East China Sea and the Huanghai Sea during last 200 years. Acta Oceanol. Sin. 31 (3), 70–77. doi: 10.1007/s13131-012-0193-0
Yang D., Yin B., Chai F., Feng X., Xue H., Gao G., et al. (2018). The onshore intrusion of Kuroshio subsurface water from February to July and a mechanism for the intrusion variation. Prog. Oceanogr. 167, 97–115. doi: 10.1016/j.pocean.2018.08.004
Yang Z., Wang H., Saito Y., Milliman J. D., Xu K., Qiao S., et al. (2006). Dam impacts on the Changjiang (Yangtze) River sediment discharge to the sea: The past 55 years and after the Three Gorges Dam. Water Resour. Res. 42, W04407. doi: 10.1029/2005WR003970
Yang S., Yang Q., Liu S., Cai D., Qu K., Sun Y. (2015). Burial fluxes and sources of organic carbon in sediments of the central Yellow Sea mud area over the past 200 years. Acta Oceanol. Sin. 34 (10), 13–22. doi: 10.1007/s13131-015-0723-7
Yoon S. H., Kim J. H., Yi H. III, Yamamoto M., Gal J. K., Kang S., et al. (2016). Source, composition and reactivity of sedimentary organic carbon in the river-dominated marginal seas: A study of the eastern Yellow Sea (the northwestern Pacific). Cont. Shelf Res. 125, 114–126. doi: 10.1016/j.csr.2016.07.010
Yu M., Eglinton T. I., Haghipour N., Dubois N., Wacker L., Zhang H., et al. (2022). Persistently high efficiencies of terrestrial organic carbon burial in Chinese marginal sea sediments over the last 200 years. Chem. Geol. 606, 120999. doi: 10.1016/j.chemgeo.2022.120999
Yu M., Eglinton T. I., Haghipour N., Montluçon D. B., Wacker L., Hou P., et al. (2021). Contrasting fates of terrestrial organic carbon pools in marginal sea sediments. Geochim. Cosmochim. Acta 309, 16–30. doi: 10.1016/j.gca.2021.06.018
Zaborska A., Carroll J. L., Papucci C., Torricelli L., Carroll M. L., Walkusz-Miotk J., et al. (2008). Recent sediment accumulation rates for the Western margin of the Barents Sea. Deep. Res. Part II Top. Stud. Oceanogr. 55, 2352–2360. doi: 10.1016/j.dsr2.2008.05.026
Zeng X., He R., Xue Z., Wang H., Wang Y., Yao Z., et al. (2015). River-derived sediment suspension and transport in the Bohai, Yellow, and East China Seas: A preliminary modeling study. Cont. Shelf Res. 111, 112–125. doi: 10.1016/j.csr.2015.08.015
Zhang H., Chen J., Han Z., Han X., Xu X., Fan G., et al. (2017). Application of 210Pb,carbon and nitrogen isotope in tracing of changes and burial effect of endogenous and terrigenous organic matter in the bering sea over the past 100 years. Metrorological Environ. Reasearch 8 (5), 111–117. doi: 10.19547/j.issn2152-3940.2017.05.020
Zhang Y., Xiao X., Liu D., Wang E., Liu K., Ding Y., et al. (2020). Spatial and seasonal variations of organic carbon distributions in typical intertidal sediments of China. Org. Geochem. 142, 103993. doi: 10.1016/j.orggeochem.2020.103993
Zhao B., Yao P., Bianchi T. S., Arellano A. R., Wang X., Yang J., et al. (2018). The remineralization of sedimentary organic carbon in different sedimentary regimes of the Yellow and East China Seas. Chem. Geol. 495, 104–117. doi: 10.1016/j.chemgeo.2018.08.012
Zhao B., Yao P., Bianchi T. S., Yu Z. G. (2021). Controls on organic carbon burial in the eastern China marginal seas: a regional synthesis. Global Biogeochem. Cycles 35 (4), e2020GB006608. doi: 10.1029/2020GB006608
Zhou L., Liu J., Saito Y., Zhang Z., Chu H., Hu G. (2014). Coastal erosion as a major sediment supplier to continental shelves: example from the abandoned Old Huanghe (Yellow River) delta. Cont. Shelf Res. 82, 43–59. doi: 10.1016/j.csr.2014.03.015
Zhu M. X., Chen K. K., Yang G. P., Fan D. J., Li T. (2016). Sulfur and iron diagenesis in temperate unsteady sediments of the East China Sea inner shelf and a comparison with tropical mobile mud belts (MMBs). J. Geophys. Res. Biogeosciences 121, 2811–2828. doi: 10.1002/2016JG003391
Keywords: carbon stocks, carbon stock accumulation rate, organic carbon, South Yellow Sea, East China Sea
Citation: Ma H, Xiao X, Ding Y, Feng X, Chen W, Sun L, Bao X, Duan S and Zhao M (2023) Carbon stocks in the mud areas of the Chinese marginal seas. Front. Mar. Sci. 10:1282891. doi: 10.3389/fmars.2023.1282891
Received: 25 August 2023; Accepted: 11 October 2023;
Published: 13 November 2023.
Edited by:
Wei-dong Zhai, Southern Marine Science and Engineering Guangdong Laboratory (Zhuhai), ChinaReviewed by:
Shan Jiang, East China Normal University, ChinaCopyright © 2023 Ma, Xiao, Ding, Feng, Chen, Sun, Bao, Duan and Zhao. This is an open-access article distributed under the terms of the Creative Commons Attribution License (CC BY). The use, distribution or reproduction in other forums is permitted, provided the original author(s) and the copyright owner(s) are credited and that the original publication in this journal is cited, in accordance with accepted academic practice. No use, distribution or reproduction is permitted which does not comply with these terms.
*Correspondence: Xiaotong Xiao, eHR4aWFvQG91Yy5lZHUuY24=; Meixun Zhao, bWF4emhhb0BvdWMuZWR1LmNu
Disclaimer: All claims expressed in this article are solely those of the authors and do not necessarily represent those of their affiliated organizations, or those of the publisher, the editors and the reviewers. Any product that may be evaluated in this article or claim that may be made by its manufacturer is not guaranteed or endorsed by the publisher.
Research integrity at Frontiers
Learn more about the work of our research integrity team to safeguard the quality of each article we publish.