 Laélien Bassi
 Rejean Tremblay
 Olivier Morissette
 Pascal Sirois
95% of researchers rate our articles as excellent or good
Learn more about the work of our research integrity team to safeguard the quality of each article we publish.
Find out more
ORIGINAL RESEARCH article
Front. Mar. Sci. , 05 January 2024
Sec. Marine Fisheries, Aquaculture and Living Resources
Volume 10 - 2023 | https://doi.org/10.3389/fmars.2023.1282264
Greenland Halibut (Reinhardtius hippoglossoides) is a deepwater flatfish having a circumpolar distribution. Understanding the spatial connectivity and migratory patterns of this commercially valuable species is essential for ensuring a sustainable fishery; nonetheless, this information remains relatively scarce for many Greenland Halibut populations. Here we evaluate the connectivity and the population structure of halibut along coastal Greenland and Canada to better characterize the contribution of each production zone to the various stocks found in the northwestern Atlantic Ocean. In 2014 and 2016, we sampled 411 large Greenland Halibut from coastal Nunavut, Labrador, and Greenland. We used the elemental fingerprint (magnesium, strontium, and barium) from the otolith core and margin of the sampled fish to determine spatial differentiation of the source areas of the collected halibut. From the 17 sample sites, margin elemental fingerprint delineated four “elemental sectors”, representing pooled adjacent sites having similar chemistry. Overall, 62% of Greenland Halibut were correctly assigned to their sampled coast. Elemental fingerprint of the otolith cores indicated three chemically distinct natal sources for the captured halibut. The chemical record in the otolith cores suggested a high connectivity of Greenland Halibut in the northwestern Atlantic and a main natal source located potentially along the west coast of Greenland. Given that our results suggest the presence of a large nursery around Disko Bay–Hellefiske Bank, protection measures should be considered for this area.
Science-based policies aiming to produce sustainable fisheries depend on high-quality information related to fish stocks (Pauly et al., 2002). Knowledge related to the spatial connectivity and migration patterns of commercial fish is indispensable for understanding population dynamics, establishing marine protected areas, determining the level of population isolation, and ensuring a sustainable fishery. However, stock delineation is poorly known for many commercial fish species, especially in terms of nursery localization, ontogenetic migrations, and the general contribution of nurseries to the different stocks (Volckaert, 2013; Gibson et al., 2014). Juvenile and adults can occupy different regions through age-related migration or continue to share the same habitat, reflecting a resident behavior of adult fish. The lack of knowledge about movement during ontogeny is related primarily to difficulties in identifying fish natal origins, thereby complicating the defining of a stock (Bowering, 1984; Boje, 2002) and limiting the effectiveness of exploited population management.
Quantifying the exchange between regions for marine fish requires using appropriate tools to determine movement and migration patterns. Tagging is commonly used; however, its application can be difficult depending on species, fish size/stage (e.g., early larval or juvenile stages), mortality rates associated with fish manipulation, and recapture rates in open and deep marine environments (Bowering, 1984; Simonsen and Treble, 2003; Campana et al., 2007). Several studies have summarized the established direct and indirect methods for estimating the connectivity of fish populations (Begg and Waldman, 1999; Gillanders, 2009). Newer technologies, using geolocation by satellite tagging, are highly accurate, but their application is currently limited to large fish, such as Atlantic Halibut (Le Bris et al., 2018). Among the indirect methods, genetic markers are widely used. The quality of results depends, however, on marker sensitivity (Knutsen et al., 2007; Pomilla et al., 2008; Roy et al., 2014); for example, the detection of genetic structures in the open ocean is often limited because even the sampling of a few migrants is sufficient to prevent the detectable differentiation of stocks (Hellberg et al., 2002). Nonetheless, genomic tools continue to develop and become increasingly apt at revealing details of the genetic structure of marine fish populations (e.g. Carrier et al., 2020).
An alternative and complementary method for determining the origins of fish and their connectivity is the use of the chemical composition of calcified structures as a natural tag of water masses frequented by fish during their lives (Kerr and Campana, 2014). The incorporation of elements within otoliths depends on several factors, including water chemistry, environmental conditions (e.g., temperature and salinity), and fish physiology (Miller, 2011; Reis-Santos et al., 2013; Sturrock et al., 2014). The elemental composition of otoliths, also called the elemental fingerprint, can provide a tool for estimating the different source contributions in mixed-stock fisheries, as demonstrated for cod (Campana et al., 2000) and redfish (Campana et al., 2007). Elemental fingerprints also serve as natural tags to describe fish connectivity (Fairclough et al., 2011), identify migration patterns (Cook et al., 2014; Bassi et al., 2023a), detect anadromy (Kalish, 1990), and determine the number of natal origin (Gibb et al., 2017; Régnier et al., 2017; Bassi et al., 2023b; Coussau et al., 2023). This approach has been successfully applied to several fish species within different aquatic environments (Gillanders, 2002; Lazartigues et al., 2016; Wright et al., 2018).
Greenland Halibut (Reinhardtius hippoglossoides (Walbaum 1792)) is a cold-water, long-lived flatfish having a circumpolar distribution. This species is generally found within 0 to 6°C marine waters and at depths from 200 to 2200 m, although juveniles are found at shallower depths (Bowering and Nedreaas, 2000). Thus, Greenland Halibut exhibit ontogenetic migration by gradually moving to deeper water as they grow (Riget and Boje, 1988; Bowering and Brodie, 1995; Jørgensen, 1997a; Morgan et al., 2003). Seasonal migrations and long-range migration behavior are also observed (Boje, 2002; Boje et al., 2014), and recent work has found an inshore–offshore connectivity characterized by diverse and complex migratory movements (Barkley et al., 2018). Greenland Halibut is an atypical flatfish; it is considered a bathypelagic species that lives both on the ocean bottom and in open-water settings. The pelagic behavior of Greenland Halibut is well documented (Jørgensen, 1997b; Vollen and Albert, 2007; Boje et al., 2014; Giraldo et al., 2018). Greenland Halibut is found in the North Pacific Ocean, in the Estuary and Gulf of St. Lawrence (EGSL), and on both sides of the North Atlantic (Fedorov, 1971). In the northeastern Atlantic Ocean, this fish is very common around Iceland, within the Greenland, Barents, and Norwegian seas, and southward toward the Faroe–Shetland Ridge. In this latter region, the spawning, feeding, and nursery areas around Svalbard and Tasilaq are well known (Gundersen et al., 2013; Albert and Vollen, 2015). In the EGSL system, the main Greenland Halibut nursery has been identified within the estuary (Ait Youcef et al., 2013).
In the northwestern Atlantic (NWA), Greenland Halibut have a high commercial value and support several local and international fisheries, mainly in Canada and Greenland (Bowering and Brodie, 1995; Delaney et al., 2012). Along the west coast of Greenland, this flatfish is found from Qaanaaq (77°30′N) to Cape Farewell (59°46′N). On the Canadian east coast, this species is found along Baffin Island and the Newfoundland and Labrador coasts (Bowering and Brodie, 1991; Bowering and Brodie, 1995). In the NWA, Greenland Halibut occupy several habitats, including deepwater, continental slopes and shelves, and channels, as well as relatively shallower waters in bays, fjords, and estuaries. The locations of the spawning areas are not yet known in detail. The main spawning area for Greenland Halibut appears, however, to be located on the Davis Strait/Canadian continental shelf, and the spawning season occurs from February to March (Gundersen et al., 2010). Nonetheless, a single spawning area would seem insufficient a priori to sustain the entire population (Simonsen and Gundersen, 2005). Baffin Bay has also been identified as another possible spawning area for Greenland Halibut in the NWA (Gundersen et al., 2010). The eggs of Greenland halibut are primarily mesopelagic, found at depths between 600-1000m (Stene et al., 1999). Hatching may occur in deep water, and larvae rise in the water column as they grow to reach plankton preys when first feeding occurs and continuing their development. Larvae have a long pelagic period, more than half year before settle to the bottom (Jensen, 1935; Smidt, 1969). During that pelagic phase, larvae are subject to extended drift, transported by surface currents to their settling area (Sohn et al., 2010). In the NWA, eggs and larvae from the Davis Strait drift toward the coasts of Labrador and eastern Newfoundland or along the coast of western Greenland. Their settlement is determined by the position of the longitudinal spawners (Stenberg et al., 2016). Juvenile halibut, on the west coast of Greenland, are found at high densities in Disko Bay and Hellefiske Bank, and these locations are considered as a nursery and settling area, respectively (Jørgensen, 1997a; Boje and Hjörleifsson, 2000; Bowering and Nedreaas, 2000; Jørgensen, 2013; Stenberg et al., 2016). Currently, there are no other known NWA nurseries, and the identified sites involve a connectivity between the two coasts and a significant migration capacity for the halibut. If several nurseries do exist, distributed along the Canadian and Greenlandic coasts, Greenland Halibut may have a more local sourcing.
Currently, Greenland Halibut exploitation is managed by the North Atlantic Fisheries Organization (NAFO) and the International Council for the Exploration of the Sea (ICES) management divisions (Bowering and Brodie, 1995; Bowering and Nedreaas, 2000; Albert et al., 2002). These groups base exploitation estimates on seven stocks; however, there is limited empirical evidence to support this subdivision of Greenland Halibut. The stock will continue to be assessed through the NAFO Scientific Council and monitoring of the fishery will be accomplished using several tools including quota reports, daily hails, logbooks, dockside monitoring programs, at-sea observers, air surveillance and at-sea patrols. More information about stock assessment can be found on the NAFO website at the following link: www.nafo.int/Science/Science-Advice/Stock-advice. Since the 1980s, studies have attempted to delineate stocks using morphological features (Riget et al., 1992), growth and fecundity rates (Morgan et al., 2003), tag-recovery data (Boje, 2002), physiological patterns, and the abundance and prevalence of parasites (Arthur and Albert, 1993). Ambiguous and contradictory results have limited establishing a clear stock structure. Genetic studies have attempted to define a clearer portrait of population structure across the Atlantic (Knutsen et al., 2007) and more regionally in the NWA (Pomilla et al., 2008; Roy et al., 2014); however, the selected genetic markers showed limited divergence capacity. Roy et al. (2014) concluded the existence of a NWA panmixia, although the use of only a few microsatellite markers limited the precision of this study. Next-generation sequencing, through the use of thousands of potential genomic markers, can greatly increase the resolution of stock structures (Westgaard et al., 2017).
Here we use otolith microchemistry to assess the potential connectivity of Greenland Halibut between the Greenlandic and Canadian coasts. We analyze the elemental fingerprints recorded in the margins and cores of otoliths of collected adult Greenland Halibut to test the null hypothesis that juvenile dispersal, adult mixing, or both prevent a population structure in this region of the NWA. We use a clustering approach for the elemental fingerprint data collected within the core of these otoliths to identify the number of possible chemically distinct natal sources. Finally, we explore the potential natal sources of Greenland Halibut along each coast by characterizing the elemental fingerprints and comparing the margin and core elemental signals. Our results offer new perspectives regarding the connectivity, stock structure, and ecology of Greenland Halibut in the NWA, and we highlight the importance of these data in the context of current fisheries management.
We sampled Greenland Halibut from 17 sites along the eastern Canadian coast (Nunavut and Labrador) and western Greenlandic coast (Figure 1, Table A1: Nunavut: n = 10, Labrador: n = 3, and Greenland: n = 4). The distance between the northernmost site in Nunavut and the southernmost site in Labrador is approximately 2360 km. Two sites (GrlB and GrlC) are located on the Hellefiske Bank. The Canadian Arctic coast is bordered by the Baffin current to the north and the Labrador current to the south, while the West Greenland current runs along the entire coast of Greenland, from south to north (Figure A4). Greenland Halibut were sampled during the summer–fall period through the multiple bottom-trawl surveys conducted by the Arctic University of Norway for sampling off Greenland and by Fisheries and Oceans Canada (DFO) for the Canadian sampling campaign. The Nunavut and Labrador regions were sampled in 2016 (October), and coastal Greenland was sampled in 2014 (September). Sampling times depended on the presence and availability of scientific surveys to cover this very large region. Thus, in the complex environment of the NWA where seasonal sampling is limited, the variability in sampling season could not be avoided. For both surveys, fish were sampled using an Alfredo III bottom otter trawl having a 140 mm mesh and a 30 mm mesh liner in the cod end. A total of 754 large Greenland Halibut were collected (Nunavut, n = 499; Labrador n =115; and Greenland n = 140; details regarding the collected samples are available in Table A1). For each site, we selected 25 otoliths. The only exception was site LabB where only 17 large Greenland Halibut were captured; 11 otoliths from this site were kept and 6 were not usable. Thus, we analyzed 411 otoliths for elemental fingerprints.
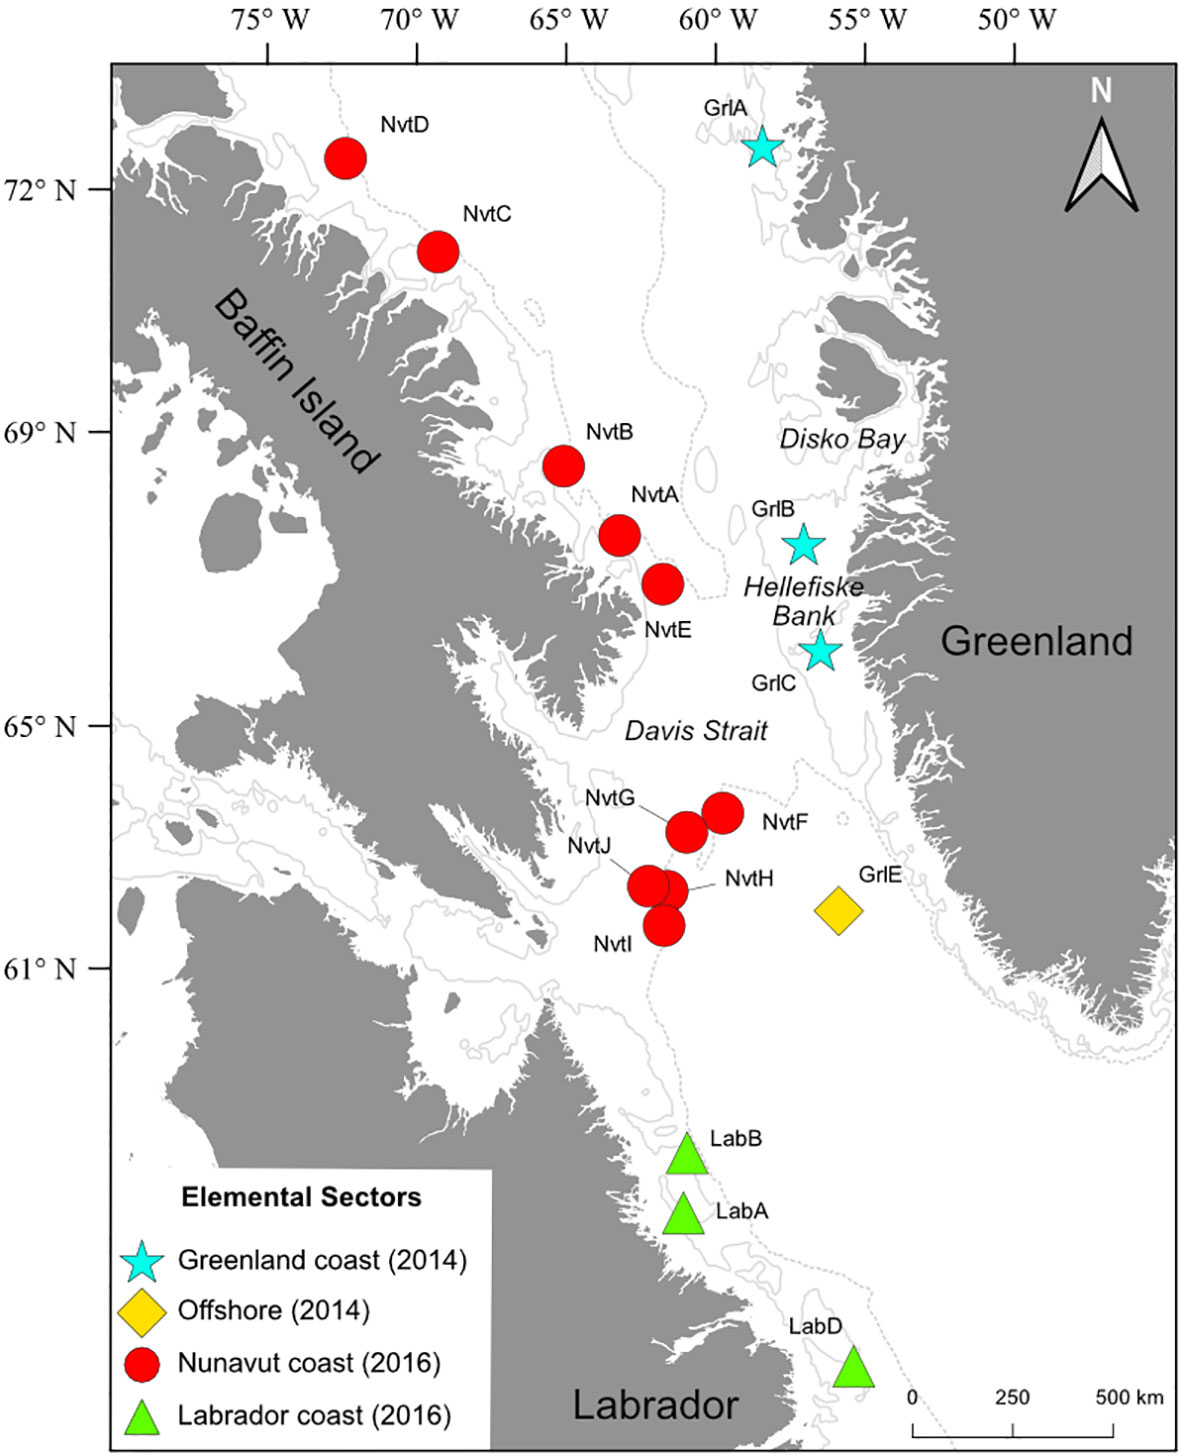
Figure 1 Location of sampling sites (color) and elemental fingerprint sectors (shape) for Greenland Halibut (Reinhardtius hippoglossoides); Nunavut coast (filled red circles), Labrador coast (filled green triangles), Greenland coast (turquoise stars), and offshore (yellow diamond) sectors. The map presents the 200 m (solid lines) and 1000 m (dashed lines) bathymetric curves.
Because Greenland Halibut is a flatfish of the Pleuronectidae family, its sagittal otoliths are asymmetrical. We therefore used the right sagittal otolith of each sampled halibut to obtain a more regular-shaped otolith and allow for an easier locating of the core (Figure 2A). Otoliths were extracted from caught halibut on the ship immediately after sampling, and the otoliths were stored individually in paper sleeves. In the laboratory, each otolith was cleaned with Super-Q water and then stored in an acid-washed polypropylene vial until analysis. After cleaning, otoliths were manipulated only with Teflon™, polyethylene, or polypropylene tools cleaned with nitric acid (10%), and we manipulated all samples and vials while wearing Nitech gloves (replaced every 2 h). The cleaned otoliths were embedded into two-part epoxy resin (Miapoxy 95, Miapoxy 100, Avon, OH, USA). The core was located with a colored LED (Figure 2B) and was marked on the resin. We used a low-speed diamond-bladed saw (Isomet, Buehler, Lake Bluff, IL, USA) to section each otolith along the transversal plane (Figure 2C). Slices were ground and polished on both sides using different grades of aluminum oxide lapping films (3M Wetordry™ polishing paper #400, #1200, 5M, and 1M) to expose the core and transverse growth radius. All otolith sections were placed randomly on petrographic slides (12 otoliths per slide) to avoid artificial bias due to instrumental drift. We sonicated each petrographic slide in ultrapure water for 5 min, triple-rinsed the slides in Super-Q water, and then dried them in a class-100 laminar flow hood for 24 h (Lazartigues et al., 2016; Bassi et al., 2023b).
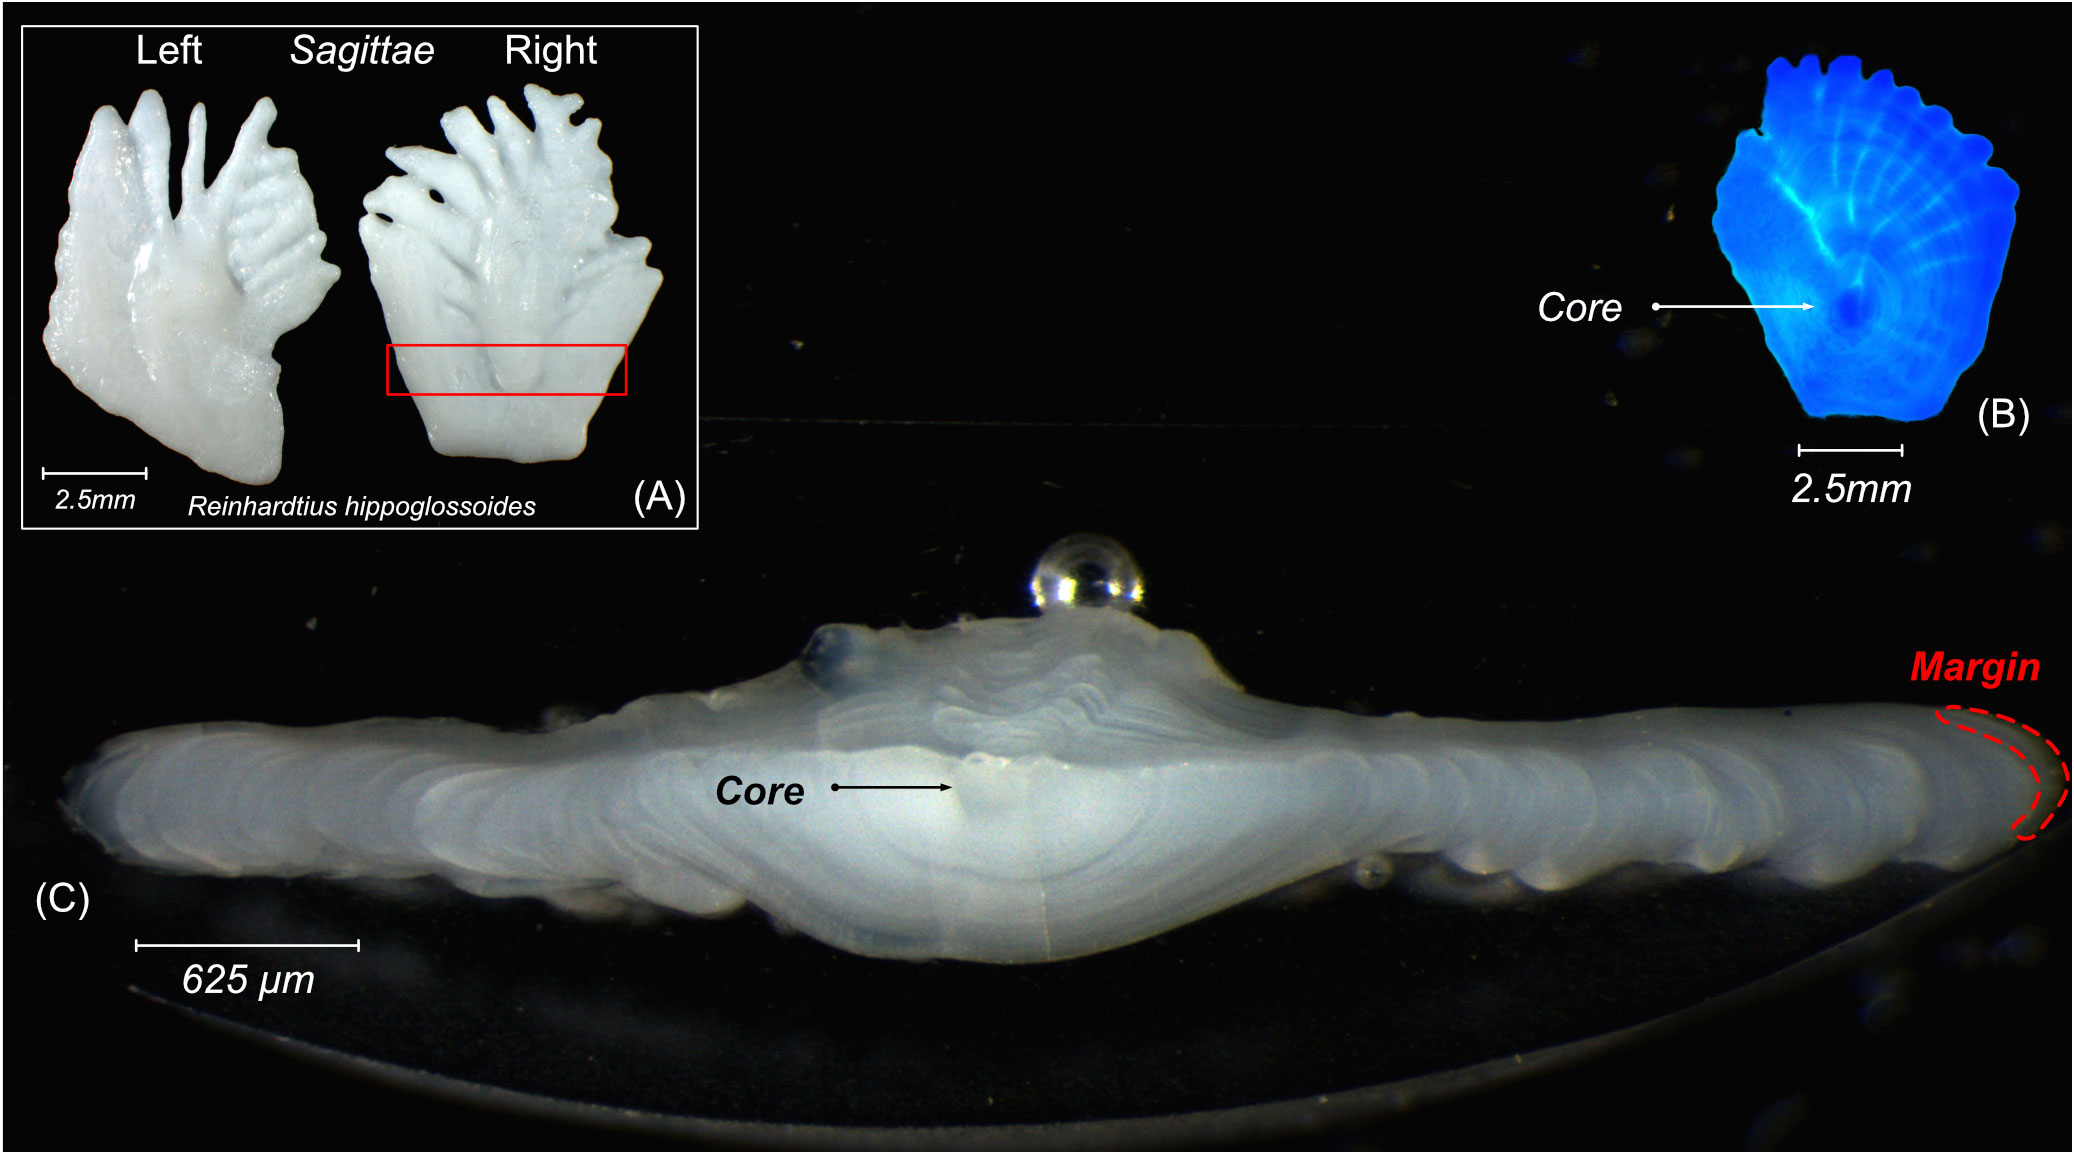
Figure 2 (A) Pair of otoliths extracted from Greenland Halibut (×8 magnification). Section in red rectangle is presented in (C); (B) core of a right sagittal otolith under blue LED (×8 magnification); (C) cross-section of an otolith slice showing the location of the core and margin (×25 magnification).
The most common method for estimating the age of an individual fish is to count growth zones in calcified structures such as otoliths (Matta and Kimura, 2012). For slow-growing deepwater species such as Greenland Halibut, the absence of clear successive opaque and translucent growth bands (see Figure 2C) complicates their age determination (Treble et al., 2008). In the last decade, alternative experimental methods have been developed for North Atlantic Greenland Halibut via otolith chemical tagging (oxytetracycline) and recapture (Albert, 2016). This aging technique appears accurate for 5- to 10-year-old individuals, although the age of older fish (>10 years old) tends to be underestimated. Recently, Brogan et al. (2021) used bomb-produced radiocarbon to determine a maximum age for Greenland Halibut of 53 years, 15 years older than the previous maximum-age estimate. Given the longevity of this species and the complexity of determining ages, we did not attempt to monitor differential cohorts when assessing connectivity among groups.
We determined the elemental fingerprints of the sampled Greenland Halibut otoliths using laser ablation inductively coupled plasma mass spectrometry (LA-ICP-MS) at LabMaTer (Université du Québec à Chicoutimi, Canada; Agilent 7900 ICP-MS, Agilent, Santa Clara, CA, USA coupled to a Resolution (ASI) 193 nm Excimer laser system equipped cell with S-155 ablation, Australian Scientific Instruments, Fyshwick, Australia). Two laser ablation segments were performed on each otolith. The first ablation was carried out on the otolith margin, following the otolith edge curve (~475 µm). We assumed this material corresponded to the elemental fingerprint of the sampling site. The second laser ablation was performed across the core (~680 µm total ablation) to obtain the natal elemental fingerprint. The LA-ICP-MS parameters were fluency (5 J·cm-2), diameter (20 µm), frequency (15 Hz), speed (5 µm·s-1), and dwell time (0.233 s). The selected elements were 7Li, 23Na, 24Mg, 25Mg, 27Al, 34S, 43Ca, 44Ca, 55Mn, 64Zn, 65Cu, 66Zn, 69Ga, 85Rb, 86Sr, 87Sr, 88Sr, 136Ba, 137Ba, 138Ba, and 208Pb. The internal 44Ca standard was assumed to be 38.02% in each otolith (Campana, 1999), and we used this value as an internal standard for calibration. Standard materials were ablated every hour (after approximately 12 samples) to correct for any temporal drift in the sensitivity of the mass spectrometer. Because 7Li, 55Mn, 85Rb, 136Ba, and 208Pb concentrations were near or below the limit of detection (LOD), these data were not analyzed. LOD was determined as three times the standard deviation of the gas blank (SDblank) divided by the sensitivity of the signal (Lazartigues et al., 2014). We used 27Al to confirm the absence of contamination owing to the manipulation of otoliths. Calibration was performed using the NIST SRM 610 reference material (Chen et al., 2011) with reference working values (± uncertainties) obtained from the GeoReM (Geological and Environmental Reference Materials) database (http://georem.mpch-mainz.gwdg.de/). The United States Geological Survey in Denver provided the MACS-3 working values (± uncertainties) for quality control (Ca, 38.02%; http://crustal.usgs.gov/geochemical_reference_standards/microanalytical_RM.html). ICP-MS signal treatments were performed using Iolite (Paton et al., 2011), a free add-on of the Igor Pro software (Wavemetrics Incorporated, Portland, OR, USA). Integration was performed on a stable 20-second signal (100 µm) of calcium.
We used the otolith margins to assess the elemental variation among sampling sites. Each element concentration was analyzed by univariate analysis of variance (ANOVA), conducted with R software (R Core Team, 2020 version 4.0.3) and using the 17 sampling sites as tested factors. A stepwise QDA was run to identify which element, among all the elements tested (n= 21) contributed most to the differences in element concentration between sites. ANOVA was run after we had screened the data residuals for normality, using the expected normal probability plot, and we also assessed the homoscedasticity of the data, which were transformed (natural log for Mg, Sr, and Ba) when necessary (Quinn and Keough, 2002). In cases where differences were detected, we applied Tukey–Kramer’s honest (HSD) multiple comparison tests (p < 0.05) to determine significant differences between means (multcomp R package 1.4-17, Hothorn et al., 2008). Multivariate analysis of variance (MANOVA, Pillai’s trace) was used to test the overall among-site differences in elemental fingerprint composition using elements showing spatial variability. We name only the elemental symbols for the sake of simplicity (e.g., 24Mg = Mg). When adjacent sites showed no significant difference in their elemental fingerprints, they were grouped to form “elemental sectors.”
To discriminate among the elemental sectors, we assessed the overall performance of the margin otolith elemental fingerprint of Greenland Halibut using quadratic discriminant analysis (QDA) (MASS R package 7.3-54, Venables and Ripley 2002). The quadratic method is more flexible than linear discriminant analysis because of its non-assumption of variance/covariance equality, and this approach is recommended for large data sets such as that of our study (James et al., 2013). To prevent the imbalance effect within the QDA—caused by the unequal representation of sampling sites in the composition of each elemental sector (Table A1)—we specified the prior probability of data equally among each group.
We initially attempted to determine the origin of Greenland Halibut from mixed-stock sampling by the otolith core elemental fingerprint reassignment method. Source reassignment generally bases its inferences on a training data set composed of samples from each contributing nursery to create an accurate and complete baseline reference. For Greenland Halibut, the nursery areas are generally unknown in the NWA, except for that in Disko Bay. As our samples contained both immature and mature fish, we performed a cluster analysis without a reference baseline. To explore the number of putative natal sources and the connectivity with the sampling sites, we therefore performed a clustering analysis that did not require any reference baseline. The unsupervised random-forest classification (randomForest R package 4.6-14, Liaw and Wiener, 2002 – UnsupRF R package 1.0, Ngufor, 2021) was applied to produce a dissimilarity matrix; we then applied a clustering algorithm (Shi and Horvath, 2006). Here, we refer to “natal source” as either a nursery or a settling area, a location where juveniles grow before their migration; hence, we do not refer to the spawning ground. This method has been applied successfully to otolith chemistry in recent studies (see Gibb et al., 2017; Régnier et al., 2017; Wright et al., 2018; Bassi et al., 2023b). In an unsupervised random forest, an artificial data set is produced by randomly sampling the product of the empirical marginal distribution of elements (Shi and Horvath, 2006). The method discriminates actual data from artificial data and produces a similarity matrix defined by the frequency at which two samples are classified within the same terminal node of the trees (Breiman, 2001). In a second step, we transformed the similarity matrix into a dissimilarity matrix that was used to partition the medoid clustering algorithm (Kaufman and Rousseeuw, 2009). The appropriate number of clusters was determined using the Dunn index (Halkidi et al., 2001: clValid R package 0.7, Brock et al., 2008).
The elemental composition of otoliths varied between sites (Pillai’s trace value: 0.75, F = 3.79, p < 0.0001). The first step is to use stepwise analysis to indicate the informative elements in our dataset to discriminate between elemental sectors based on their concentrations. Stepwise QDA showed that Mg, Sr, and Ba contributed most to the between-site differences in element concentrations; we therefore used these three elements in the subsequent analyses. All target elements showed significant between-site differences when assessed by univariate analysis (ANOVA and HSD Tukey–Kramer, p < 0.05, Figure 3 and Table 1). We observed that otoliths from individuals collected in the Nunavut and Labrador sites contained similar Mg concentrations (19.39 ± 5.48 µg·g−1 and 23.69 ± 10.88 µg·g−1, respectively), in contrast to otoliths from the Greenland sites, which showed higher Mg concentrations (37.23 ± 22.21 µg·g−1, Table 2). Halibut otoliths from the Nunavut sites contained the highest Sr concentrations (3222.73 ± 653.38 µg·g−1), except for NvtC and NvtE, which had concentrations (2826.6 ± 535.22 µg·g−1) similar to those of the Labrador sites (2908.63 ± 447.54 µg·g−1). The otoliths from the Greenland sites had the lowest concentrations of Sr (2407.42 ± 714.91 µg·g−1), except for GrlE having a mean concentration of 3183.55 ± 643.1 µg·g−1, similar to concentrations observed in the Nunavut sites (Table 2). The Ba concentrations were highest in the Nunavut and Labrador sites (2.31 ± 0.99 µg·g−1 and 2.47 ± 0.81 µg·g−1, respectively), except for NvtC and NvtE, which had lower concentrations of Ba (1.83 ± 0.75 µg·g−1 and 1.64 ± 0.6 µg·g−1, respectively) with values similar to those of samples collected along coastal Greenland (1.59 ± 0.65 µg·g−1).
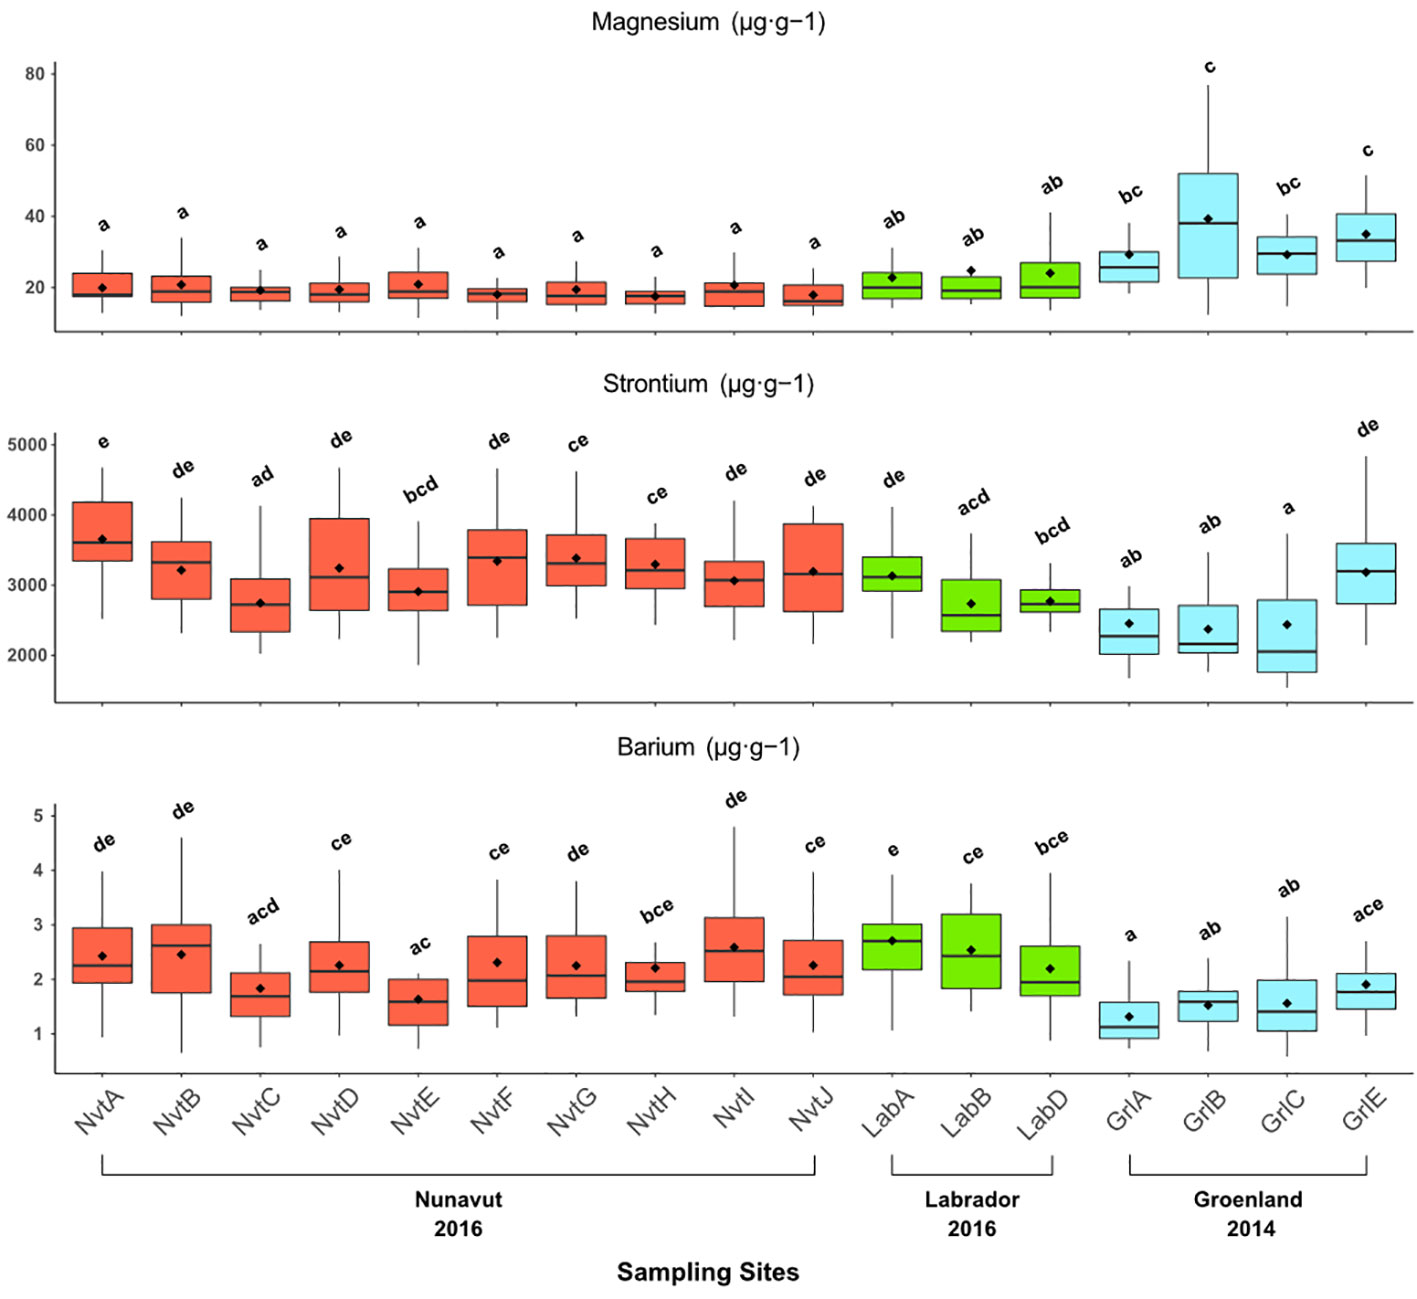
Figure 3 Box and whisker plots of the mean concentrations (µg·g−1) of three elements (Mg, Sr, Ba) in the otolith margins of Greenland Halibut per sampling site. Box plots also indicate both the mean (diamond) and the median values (drawbar). Mean concentrations (mean ± SD) not sharing any letter are significantly different at a 95% level of significance by ANOVA, Tukey–Kramer HSD performed on the transformed (natural log) data.
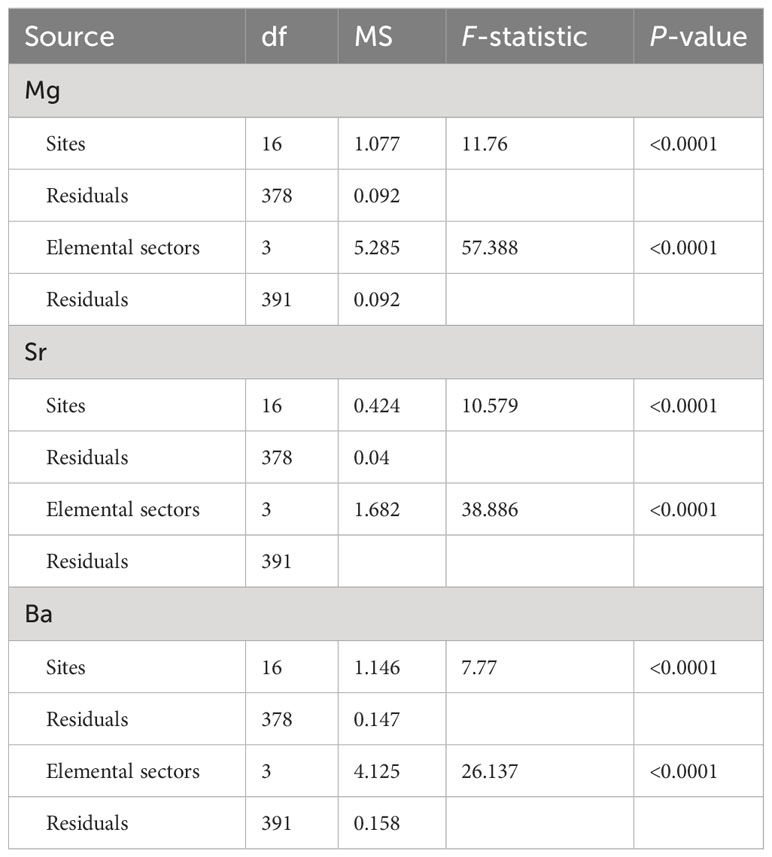
Table 1 Univariate ANOVA comparing the elemental concentrations of otolith margins between sampling sites and elemental sectors.

Table 2 Mean concentrations (and standard deviation) of the elemental fingerprints (recorded in otolith margins) with the highest (bold) and lowest (italics) values for each element.
Elemental concentrations were relatively similar in sites from the same coast (Greenland, Labrador, and Nunavut). Sr concentrations explained much of the discrimination of elemental fingerprints of the different coasts. Sr concentrations were highest in Nunavut, followed by Labrador and Greenland, except for GrlE site who display similar concentration than Nunavut. Magnesium (Mg) and Barium (Ba) concentrations mainly differentiated the Greenlandic sites from the Canadian sites (Labrador and Nunavut). We then used the coastal sites at a regional scale on the basis of their elemental fingerprint similarity and their geographical localization (Figure 4 and see details of the composition of each elemental sector in Table A1), as validated by statistical similarities, to identify three elemental sectors: Nunavut Coast, Labrador Coast, and Greenland Coast. The GrlE site was an exception along the west coast of Greenland, being sampled at a much greater depth (2741 m) than samples from the other coastal Greenland sites (<181 m depth; see Table A1). The otolith elemental fingerprint of the GrlE site differed from that of the other Greenlandic sites. Thus, this site constituted a distinct sector called the “offshore sector” (Figures 1, Table A1). For visual comparison, all sites have been represented in an MDS and labelled by elemental sectors (Figure A5). MANOVA, run using the combined Mg, Sr, and Ba concentrations, confirmed the degree of discrimination between the four elemental sectors (Pillai’s trace value: 0.612, F = 25.985, p < 0.0001).
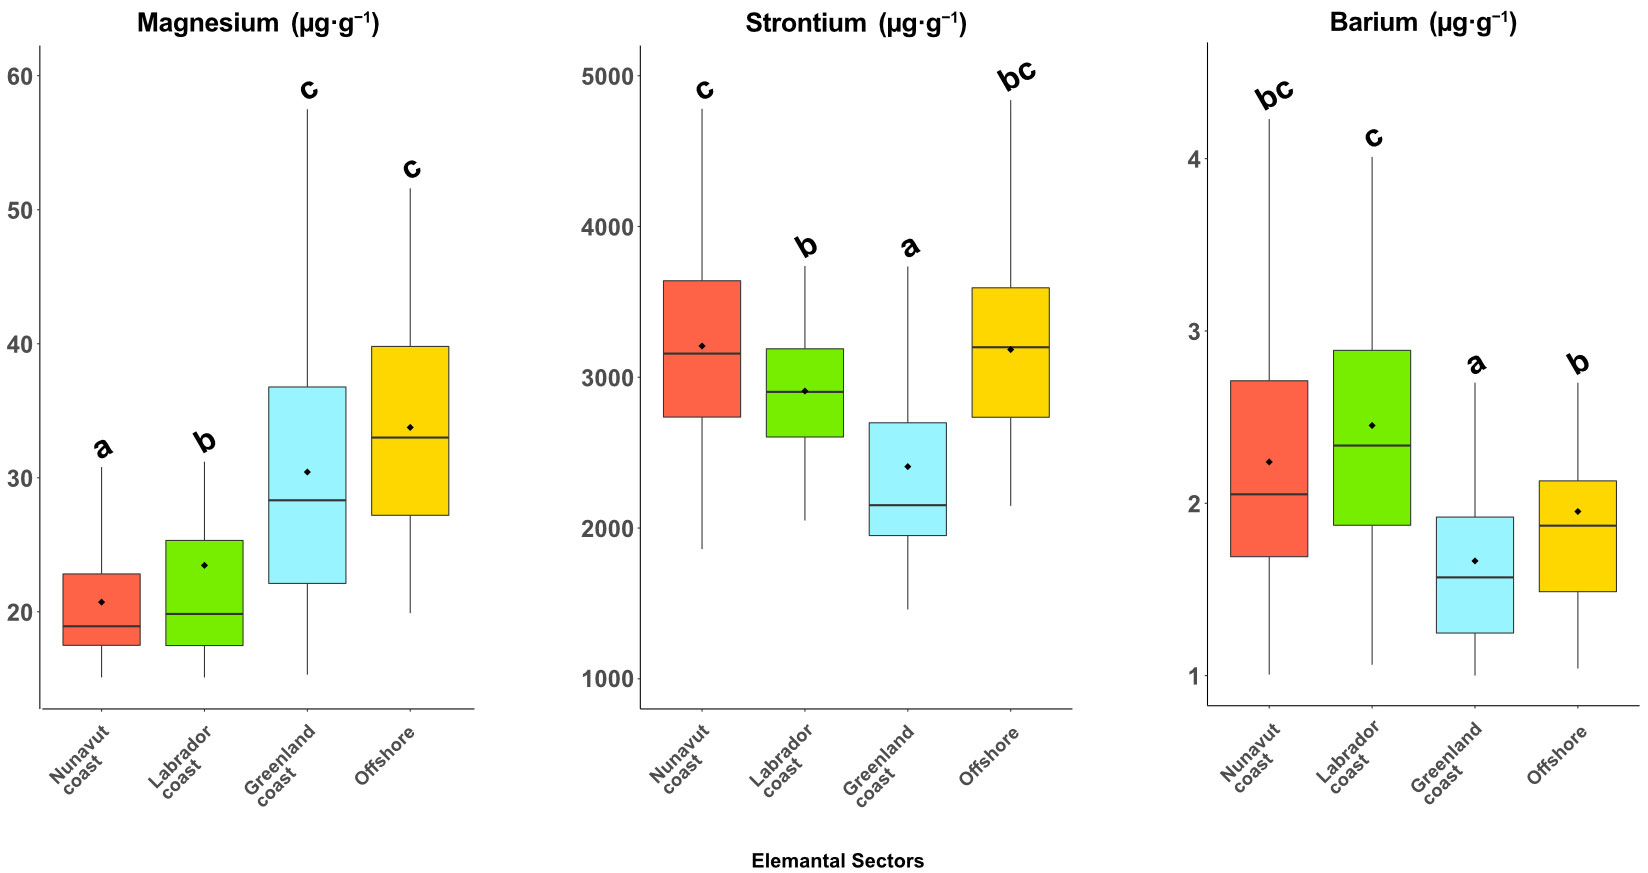
Figure 4 Box and whisker plots of the mean concentrations (µg·g−1) of three elements (Mg, Sr, and Ba) in otolith margins of Greenland Halibut sampled from the four identified elemental sectors. Box plots also indicate both the mean (diamond) and the median values (drawbar). Mean concentrations (mean ± SD) not sharing any letter are significantly different at a 95% level of significance by ANOVA, Tukey–Kramer HSD performed on the transformed (natural log) data.
Discriminant analyses showed a fairly consistent reclassification success among sectors identified based on sectors’ elemental fingerprints. Overall, QDA correctly reclassified 62% of the Greenland Halibut to their sampling coast (Table 3), with success ranging from 53% to 73%. Both Greenlandic sectors showed the highest success for reclassification, with 67% of halibut captured along the Greenland coast correctly classified to their sample origin, and 73% of halibut from the offshore sector showed a good classification. The Canadian sectors were also well discriminated, having 53% and 62% successful reclassification for the Labrador and Nunavut coasts, respectively. These latter two sectors were clearly differentiated from the Greenlandic sectors, with less than 8% of classification error in the Greenland Coast or offshore sector.
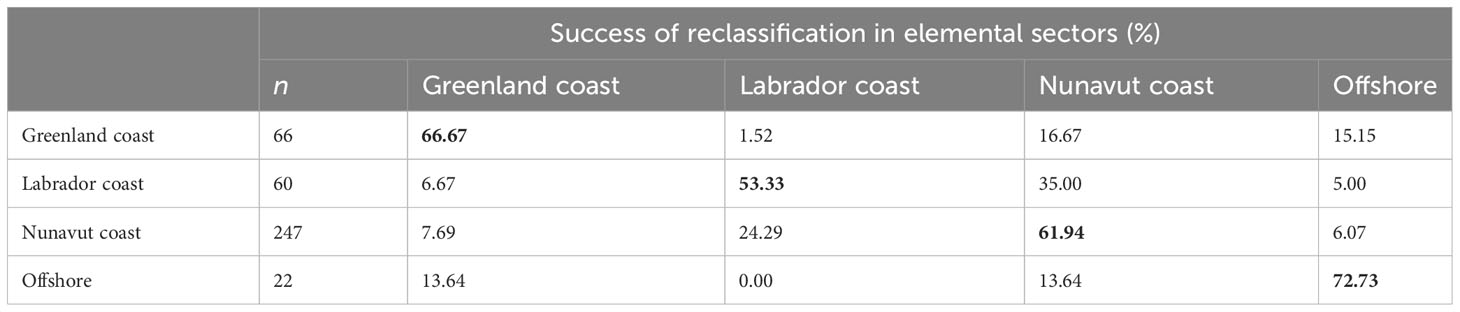
Table 3 Reclassification of matching sampled Greenland Halibut to their predicted elemental fingerprint sectors (based on otolith margins) using quadratic discriminant analysis (QDA), showing the identified successful reclassifications (bold).
The unsupervised random-forest procedure identified three sources (A, B, and C) based on elemental fingerprints in the core of the otoliths. Source A was characterized by the highest Mg (27.39 ± 8.21 µg·g−1), lowest Sr (1468.96 ± 122.24 µg·g−1), and intermediate Ba (1.15 ± 0.47 µg·g−1) concentrations. Source B showed higher Sr and Ba concentrations (1908.23 ± 377.51 and 2.43 ± 1.32 µg·g−1 respectively, see Table 4 and Figure A3) than Source C, and the latter had the lowest Mg and Ba concentrations (18.15 ± 6.17 and 1.03 ± 0.45 24 µg·g−1 respectively) of the three sources. When determining the natal origin, Source A was the main contributor to all elemental sectors representing 35% to 70% of all captured halibut. Source A represented more than half the contributions along the Labrador and Greenland coasts and the offshore sector. Sources B and C were more represented along the Canadian coast (Nunavut coast: 32%–34% and Labrador coast: 25%–22%) than along the Greenland coast and offshore sector. Source C was the second-greatest contributor to the Nunavut coast sector (34%). Contrary to the Greenland coast and the offshore sector, both Canadian coasts showed a more balanced contribution from each source. Along coastal Nunavut, the contribution was 35%, 32%, and 34% for sources A, B, and C, respectively, and coastal Labrador had respective contributions of 53%, 25%, and 22% from sources A, B, and C (see Table 5 and Figure A2).
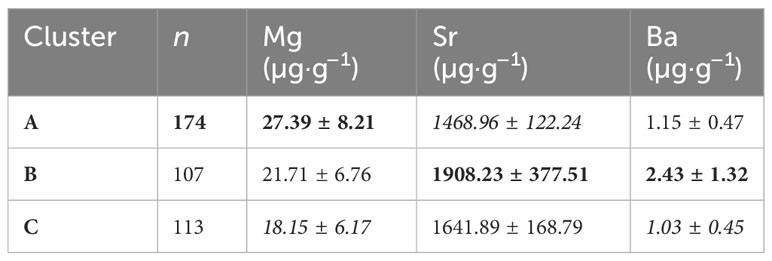
Table 4 Mean concentrations (and standard deviation) of the elemental fingerprints (recorded in otolith cores) of the natal source clusters with the highest (bold) and lowest (italics) values for each element.
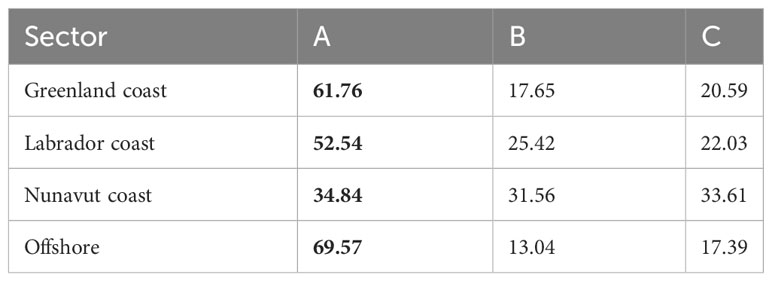
Table 5 Individuals assigned to each cluster (A, B, C, in %) produced from the random-forest clustering of the elemental composition of sampled otolith cores and identification of the cluster having the highest contribution to each coastal sector (bold).
Our analysis of otolith margins confirmed the spatial variability of the elemental fingerprint of Greenland Halibut in the NWA and highlighted the connectivity between the eastern coast of Canada and the western coast of Greenland. We identified three natal sources of Greenland Halibut, and each source contributed to the stocks of Greenland Halibut sampled from all sites and sectors, with the main contribution from Source A. This connectivity, revealed by otolith chemistry, prevents recognizing the population structure in the NWA, which appears to act as a global metapopulation. The elemental composition of Source A was comparable to the elemental fingerprints from otolith margins obtained in samples from the west coast of Greenland, suggesting a Greenlandic natal source. The elemental fingerprints from Source B appear mainly related to a Canadian source area, likely from the Labrador coast. The origin of the third source (Source C) remains uncertain, as we found no correspondence associated with the elemental fingerprints from otolith margins. The connectivity of Greenland Halibut between Canadian and Greenland, corresponding to long-range migratory individuals, may therefore occur through the Davis Strait or other migration routes that remain yet to be identified. This study supports the genetic study of Roy et al. (2014), demonstrating the existence of a panmixia population of Greenland Halibut from the NWA. Similar results have also been observed through a genomic population assessment based on whole-genome re-sequencing (SNP) (Ferchaud et al., 2022).
We relied on the three most informative elements (Mg, Sr, and Ba) to build a robust model for demonstrating the spatial variability of otolith margin elemental fingerprints in the NWA. This model showed a differentiation among the elemental fingerprints from the east coast of Canada to the west coast of Greenland. We identified four elemental sectors from the differences in elemental fingerprint among sites: Nunavut coast, Labrador coast, Greenland coast, and offshore. This differentiation provides the evidence of the large-scale spatial variation of elemental fingerprints in the NWA for Greenland Halibut.
The elements of Mg, Sr, and Ba are commonly used in population studies based on otolith microchemistry; however, the causes of elemental variation within the otoliths are complex and difficult to tease apart. Strontium (Sr) is widely used for environmental reconstruction and the detection of anadromy, as Sr concentrations tend to be lower in freshwater systems and higher (and relatively constant) in oceans (Walther and Limburg, 2012). Multiple studies have confirmed the strong and positive relationship between Sr concentrations in water and otoliths (Bath et al., 2000; Miller, 2011; Reis-Santos et al., 2013). In their review, Hüssy et al. (2021) hold that Sr otolith patterns likely result from movements between waters that differ in Sr concentrations, intersite differences mainly driven by bedrock geology and salinity. They also provide several lines of evidence of how temperature influences Sr concentrations in otoliths. The authors nonetheless point out that contradictory results remain an issue, and a generalized temperature–Sr relationship remains unclear, although Sr incorporation into otoliths appears mainly to be of an environmental origin (Hüssy et al., 2021). In our study, Sr incorporation could be affected by salinity, temperature, or both, as we recorded higher otolith Sr concentrations from samples collected at deeper sampling sites (Nunavut coast and offshore). In Baffin Bay, salinity and temperature increases with the depth—reaching 34.4 psu and 0.8°C at 500 m depth (Münchow et al., 2015). The Greenland coast consisted of shallower sampling sites (<200 m), and the elemental fingerprint of the associated otolith margins produced lower Sr values. Greenland Halibut from coastal Labrador were collected from an intermediate depth (~200–400 m), and otolith margins had Sr levels that fell between those from the Greenlandic coast and from the Nunavut coast and offshore.
The Mg and Ba concentrations in otoliths of Greenland Halibut appear uninfluenced by sampling depth—and the consequential changes in salinity and temperature. We recorded variable Mg values in the otolith margins of Greenland Halibut sampled from the Nunavut and Labrador coasts, and these values corresponded to the lowest Mg levels of all samples. Greenland Halibut from coastal Greenland and the offshore sector (shallower and deeper sites, respectively) showed generally higher Mg concentrations in their otolith margins. We observed an opposite trend for Ba with relatively higher concentrations in otolith margins from the Nunavut and Labrador coasts. Thus, Mg serves as a useful element for differentiating the eastern Canadian and western Greenland coasts, as well as distinguishing the Nunavut and Labrador coasts. Barium was effective in differentiating the eastern Canadian coast from the western Greenland coast.
We observed a spatial variation in the elemental fingerprints among the elemental sectors; nonetheless, differences between the Canadian and Greenlandic coasts must be carefully interpreted because of our sample design in which the two coasts were sampled in separate years (2014 and 2016). The temporal variability of trace element markers, however, is generally less than that related to geographical location. Jónsdóttir et al. (2006) demonstrated that temporal changes in cod otoliths, albeit over a limited interannual period (2002–2003), were consistently less than elemental composition changes stemming from spatial variation. Tournois et al. (2013) determined the otolith fingerprint of sea bream (Sparus aurata) collected from four lagoons along the Mediterranean coast across multiple years (2008, 2010, and 2011). They observed that the lagoonal elemental fingerprints remain sufficiently consistent between years to produce a successful random forest global classification of approximately 80% when the data from the three years were pooled. In another paper, (Xiong et al., 2021) evaluated the core-to-margin Sr concentrations of otoliths from yellow croaker (Larimichthys polyactis) for samples collected in 2003, 2012, and 2013. The collected otoliths had similar patterns of Sr along the core-to-margin transects showing nonsignificant interannual differences between all samples (Xiong et al., 2021). Finally, Hüssy et al. (2022) and Albertsen et al. (2021) both used otolith chemistry to assess the population structure of cod (Gadus morhua) within a large-scale, multiyear design and observed no apparent seasonality among their samples. The abovementioned studies suggest that the temporal variability of chemical markers with large-scale studies, such as ours, is sufficiently stable to provide inter-regional inferences. Strontium within the otolith margins of Greenland Halibut samples collected from the deepest sites—the offshore sector (2014) and Nunavut coast (2016)—were similar (approximately 3200 µg·g−1). We therefore believe that potential temporal variation is less than the spatial variation for this element. The Mg content in the otolith margins (Table 2) differed between the Nunavut and Labrador coasts, between sectors sampled the same year, and also between Canadian and Greenlandic coasts. Only Ba concentrations in otolith margins differed between the two sampling years (Greenlandic coast and the offshore sector in 2014 and Nunavut and Labrador coasts in 2016), with higher Ba concentrations in the fish sampled along Canadian coasts. Given that the Ba concentrations of the otolith cores and margins were similar (approximately 1–2.5 µg·g−1), the measured concentrations appear led mainly by spatial variation; both ontogenetic changes and the temporal effect have a minimal effect on Ba concentrations.
Differences between the water masses imported by currents in the NWA can explain much of the observed difference between the sectors and coasts. The Nunavut coastal samples are influenced by the Baffin Island Current (BIC), whereas the Labrador Current is the main water mass influence along the Labrador coast (see Figure A4). The BIC originates from Arctic waters inflowing through the Nares Strait and, to a lesser extent, the Barrow Strait. Arctic waters show a marked seasonal variability and are characterized by multiple sources of freshwater input (Melling et al., 2008); this seasonal variability mainly affects the upper 300 m of the water column, whereas deep water remains relatively more conservative (Tang et al., 2004; Cuny et al., 2005; Münchow et al., 2015). The Labrador Current is influenced by the cold waters of the BIC in the northern sector, which could explain the overlapping elemental fingerprints for sectors along the Nunavut and Labrador coasts, as observed in the QDA analysis. Moreover, the Labrador Current is also influenced by water from the West Greenland Current (WGC), Irminger Water (IW), and from Hudson Bay outflow through the Huston Strait (Aksenov et al., 2010; Sicre et al., 2014). These complex, multisource currents affect the elemental fingerprints of otolith and favor greater spatial differentiation.
In summary, the homogeneity of elemental fingerprints among sites distributed along the Nunavut coast likely relates to sampling depth (558–1287 m) in waters influenced by the stable and conservative Baffin Island Current. Elemental fingerprints along the Labrador coast, subject to influence from the Labrador Current, and the shallow sampling (<400 m depth) explain the difference in otolith chemistry between the Labrador and Nunavut coasts. The Labrador Current is also impacted by BIC; thus, we observe an overlap in fingerprint chemistry between the Nunavut and Labrador coasts. The Greenlandic coastal samples, influenced by the WGC, were collected at depths shallower than 200 m, a sampling depth largely different from that of the offshore sector (~2700 m); this difference in sampling depth likely explains much of the difference in the elemental fingerprints of the two regions. Both depth and location determine how a water mass affects trace element incorporation and concentration within otoliths.
The clustering approach allows determining natal sources without previous information about the location. This advantage is important, particularly for studies of species such as the Greenland Halibut in the NWA for which we only have limited knowledge regarding the connectivity, population dynamics, and nursery locations. We found three potential natal sources (A, B, and C), all contributing to the Greenland Halibut collected from each sector. Of these three potential origins, Source A was the most frequently identified natal origin source (Figure A2, Table 5). The importance of this source for fish collected from all sampled sectors provides the first evidence of the large-scale connectivity of Greenland Halibut in the NWA and supports the absence of genetic population structure (panmixia), as per Roy et al. (2014). The high contribution of Source A in specimens captured from the Greenlandic sectors (62% for the Greenlandic coast and 70% for the offshore sector) suggests a local natal source, and the contribution of this natal source in fish sampled from Canadian sites could represent emigration from Greenland. The Disko Bay–Store Hellefiske Bank is the only known Greenland Halibut nursery area in the NWA (Stenberg et al., 2016).
The RF approach does not provide the natal location directly; only the number of putative sources based on otolith core chemistry can be determined (Shi and Horvath, 2006; Gibb et al., 2017). Inferences related to the elemental fingerprints observed in both otolith core sections and margins require some caution, as the observed concentrations in otolith margins from adults and subadults may not be readily comparable with core concentrations. Sr concentrations within margins (adult stages) were always greater than those of the otolith core (juvenile stages). This observation agrees with de Pontual et al. (2003), who showed that flatfish otoliths display Sr concentrations that suggest an ontogenetic decrease between the larval and juvenile stages, independent of ambient concentrations. This kind of ontogenetic effect could affect Sr concentrations in otoliths of Greenland Halibut and could be inextricable from variation induced by migration to a deeper environment, thereby limiting the interpretation of Sr concentrations in this context. However, Mg and Ba concentrations are less affected by ontogenetic modification allowing for their use as elemental fingerprinting indicators of source locations.
Source A was characterized by high concentrations of Mg and low concentrations of Ba. Otolith samples collected from the Greenlandic coast and offshore sectors contained the highest Mg concentrations. Although the margin elemental fingerprint of offshore sector samples contained the highest Mg concentrations of all sectors (~35 µg·µ−1), the deep sampling depth (2741 m) mostly excludes this sector as a potential juvenile source. Current knowledge places all Greenland Halibut nurseries in relatively shallow coastal zones (Bowering and Nedreaas, 2000; Ait Youcef et al., 2013; Gundersen et al., 2013; Albert and Vollen, 2015). A second elemental sector characterized by high Mg values is the Greenlandic coast (~32 µg·µ−1). This extended area includes Disko Bay and Hellefiske Bank Store, where abundant juvenile halibut have been previously observed (Boje and Simonsen, 2004). The elemental fingerprint similarities for Mg and, to a lesser extent, Ba, the presence of a known Greenland Halibut nursery, and the major contribution of Source A in samples from the Greenlandic coast all support the argument that natal Source A is likely located along coastal Greenland.
Similarities exist between the Source B elemental fingerprints and those of Canadian samples (Nunavut and Labrador coasts), suggesting a potential natal source in this area. We observed Mg and Ba concentrations in Source B that were more related to the Labrador coast than the Nunavut coast, which suggests a natal source located along coastal Labrador. This observation would agree with existing information for the sector. The Newfoundland–Labrador region is a hotspot for flatfish fisheries, and a high biomass of Greenland Halibut is fished mainly at depths between 500 and 1000 m along the continental slope (Bowering and Brodie, 1991; Bowering and Brodie, 1995). Such an assertion also matches our personal observations; we collected some juveniles (22 ± 4.2 cm) at ~150 m depth during our monitoring of coastal Labrador (53°37’2.00”N, 54°40’8.00”W; unpublished data). Moreover, a recent study based on genotyping by-sequencing (GBS) revealed a fluctuating contribution from the Newfoundland – Labrador area to the EGSL stock through the years (Carrier et al., 2020). In our previous study on otolith chemistry of Greenland Halibut sampled in the EGSL in 2016, we identified that one source could be potentially outside the system, in the area of the Labrador coast because a high concentration of Ba (4.04 ± 2.38 μg·g-1) was observed in their otolith cores (Bassi et al., 2023b). Bowering and Brodie (1995) describe the potential link between the spawning of Greenland Halibut in the Davis Strait and the settling of juveniles in the Newfoundland–Labrador region. They suggest that after hatching in the Davis Strait, larvae rise toward the ocean surface and become trapped by currents and transported, depending on the spawners’ location, along the western coast of Greenland to the northern Davis Strait or southward of Baffin Island (Bowering and Chumakov, 1989). Thus, larvae trapped by this latter current could drift south with the Labrador Current and settle along the Labrador and Newfoundland coasts (Stenberg et al., 2016).
Elemental concentrations in otolith cores from the putative natal Source C differed markedly from the otolith margins; these cores presented the lowest Mg and Ba concentrations and intermediate Sr values. We could not establish any correspondence with the samples’ elemental fingerprinting margins. These differences likely indicate a still-unknown source area in the NWA. This potential nursery remains to be identified and appears to be characterized by a very different water chemistry, possibly influenced by a marked freshwater input, an anthropic influence, or a specific bedrock geology.
Source elemental fingerprinting refined the understanding of the population structure and the main natal sources of Greenland Halibut. The specific locations of these natal sites must be confirmed by future research, possibly involving targeted sampling near the coast to establish the source–sink dynamics of this species. Nevertheless, our results reiterate the important role of the Disko Bay–Hellefiske Bank nursery for the adult halibut population along much of west coast Greenland as well as for halibut populations along the eastern Canadian coasts. Preserving this nursery area is of critical importance for the sustainability of the NWA stocks. Fisheries management and conservation strategies should consider this species to live within an extended Canada–Greenland complex rather than being viewed as separate stocks. Overexploitation of this species in sensitive areas, e.g., nurseries, and the local degradation of habitat will directly impact the abundance and health of Greenland Halibut stocks along other more distant coastal regions.
Trace elements deposited within the otoliths of Greenland Halibut helped identify a robust geographical variation of elemental fingerprints in the NWA and highlighted the connectivity of this species along the coasts of western Greenland and eastern Canada. We identified three putative natal sources for this species, all contributing to the mixed-stock catches at each site; therefore, we confirm an important connectivity between the Canadian and Greenlandic halibut populations and therefore support the panmixia hypothesis proposed by Roy et al. (2014). Thus, the main proportion of individuals native from the Greenlandic coast (source A) seems to be sedentary. This information is essential for sustainable fisheries management of these stocks. This absence of a clear population structure is likely related to the migratory capacity of Greenland Halibut and the long drifting period of eggs and larvae between populations in the NWA and possibly those with the eastern Atlantic Ocean (Stenberg et al., 2016).
The raw data supporting the conclusions of this article will be made available by the authors, without undue reservation.
This study used strains obtained from Fisheries and Oceans Canada (DFO) and did not require the study to be reviewed or approved by an ethics committee because samples were collected during commercial fisheries.
LB: Data curation, Formal analysis, Methodology, Software, Writing – original draft, Writing – review & editing. RT: Conceptualization, Funding acquisition, Project administration, Supervision, Writing – review & editing. OM: Formal analysis, Supervision, Writing – review & editing. PS: Conceptualization, Funding acquisition, Supervision, Validation, Writing – review & editing.
The author(s) declare financial support was received for the research, authorship, and/or publication of this article. This project was funded by a National Sciences and Engineering Research Council of Canada (NSERC strategic partnership program) grant to Louis Bernatchez, Céline Audet, PS, and RT, as well as by the Institut des Sciences de la Mer de Rimouski (ISMER), and Ressources Aquatiques Québec (RAQ).
The Natural Sciences and Engineering Research Council of Canada (NSERC), the Institut des Sciences de la Mer de Rimouski (ISMER), and the Ressources Aquatiques Québec (RAQ) are sincerely acknowledged for their financial support. We thank the Arctic University of Norway and Fisheries and Oceans Canada (DFO) for undertaking the respective Greenlandic and Canadian field sampling. The authors are grateful to Anne-Lise Fortin and Isabelle Allie of Université du Québec à Chicoutimi (UQAC) for technical assistance and to Dany Savard and Audrey Lavoie from LabMaTer (UQAC) for help with the LA ICP-MS, and Murray Hay from Maxafeau scientific editing for language proofreading.
The authors declare that the research was conducted in the absence of any commercial or financial relationships that could be construed as a potential conflict of interest.
All claims expressed in this article are solely those of the authors and do not necessarily represent those of their affiliated organizations, or those of the publisher, the editors and the reviewers. Any product that may be evaluated in this article, or claim that may be made by its manufacturer, is not guaranteed or endorsed by the publisher.
The Supplementary Material for this article can be found online at: https://www.frontiersin.org/articles/10.3389/fmars.2023.1282264/full#supplementary-material
Ait Youcef W., Lambert Y., Audet C. (2013). Spatial distribution of Greenland halibut Reinhardtius hippoglossoides in relation to abundance and hypoxia in the estuary and Gulf of St. Lawrence. Fisheries Oceanogr. 22, 41–60. doi: 10.1111/fog.12004
Aksenov Y., Bacon S., Coward A. C., Holliday N. P. (2010). Polar outflow from the Arctic Ocean: A high resolution model study. J. Mar. Syst. 83, 14–37. doi: 10.1016/j.jmarsys.2010.06.007
Albert O. T. (2016). Growth and formation of annual zones in whole otoliths of Greenland halibut, a slow-growing deep-water fish. Mar. Freshw. Res. 67, 937–942. doi: 10.1071/MF15089
Albert O. T., Boje J., Bowering W., Brodie W., Gundersen A., Hjörleifsson E. (2002). Greenland halibut biology and population dynamics: state of the art and identification of research needs: based on a Nordic workshop, Greenland institute of natural resources. Nuuk Greenland. TemaNord 2002, 534.
Albert O. T., Vollen T. (2015). A major nursery area around the Svalbard archipelago provides recruits for the stocks in both Greenland halibut management areas in the Northeast Atlantic. ICES J. Mar. Sci. 72, 872–879. doi: 10.1093/icesjms/fsu191
Albertsen C. M., Hüssy K., Serre S. H., Hansen J. H., Thomsen T. B. (2021). Estimating migration patterns of fish from otolith chemical composition time-series. Can. J. Fish. Aquat. Sci. 78, 1512–1523. doi: 10.1139/cjfas-2020-0356
Arthur J., Albert E. (1993). Use of parasites for separating stocks of Greenland halibut (Reinhardtius hippoglossoides) in the Canadian Northwest Atlantic. Can. J. Fisheries Aquat. Sci. 50, 2175–2181. doi: 10.1139/f93-243
Barkley A. N., Fisk A. T., Hedges K. J., Treble M. A., Hussey N. E. (2018). Transient movements of a deep-water flatfish in coastal waters: Implications of inshore-offshore connectivity for fisheries management. J. Appl. Ecol. 55, 1071–1081. doi: 10.1111/1365-2664.13079
Bassi L., Tremblay R., Ferchaud A.-L., Bernatchez L., Robert D., Sirois P. (2023b). Connectivity and natal sources of Greenland halibut in the Gulf of St. Lawrence inferred from otolith chemistry. Can. J. Fisheries Aquat. Sci. 80, 1301–1312. doi: 10.1139/cjfas-2022-0081
Bassi L., Tremblay R., Morissette O., Sirois P. (2023a). Otolith elemental fingerprints reveal source-sink dynamics between two Greenland halibut nurseries in the St. Lawrence Estuary and Gulf. Mar. Ecol. Prog. Series. doi: 10.3354/meps14303
Bath G. E., Thorrold S. R., Jones C. M., Campana S. E., McLaren J. W., Lam J. W. (2000). Strontium and barium uptake in aragonitic otoliths of marine fish. Geochimica Cosmochimica Acta 64, 1705–1714. doi: 10.1016/S0016-7037(99)00419-6
Begg G. A., Waldman J. R. (1999). An holistic approach to fish stock identification. Fisheries Res. 43, 35–44. doi: 10.1016/S0165-7836(99)00065-X
Boje J. (2002). Intermingling and seasonal migrations of Greenland halibut (Reinhardtius hippoglossoides) populations determined from tagging studies. Fishery Bull. 100, 414–422. Available at: https://fisherybulletin.nmfs.noaa.gov/sites/default/files/pdf-content/2002/1003/bojefi.pdf.
Boje J., Hjörleifsson E. (2000). Nursery grounds for the West Nordic Greenland halibut stock-where are they. ICES Concil Meeting 2000/N 03, 12 p.
Boje J., Neuenfeldt S., Sparrevohn C. R., Eigaard O., Behrens J. W. (2014). Seasonal migration, vertical activity, and winter temperature experience of Greenland halibut Reinhardtius hippoglossoides in West Greenland waters. Mar. Ecol. Prog. Ser. 508, 211–222. doi: 10.3354/meps10874
Boje J., Simonsen C. S. (2004). Settling and factors affecting 0-group distribution of Greenland halibut, R. hippoglossoides (Walbaum), in West Greenland waters. ICES CM 2004/, 1–15.
Bowering W. (1984). Migrations of Greenland halibut, Reinhardtius hippoglossoides, in the Northwest Atlantic from tagging in the Labrador-Newfoundland region. J. Northwest Atlantic Fishery Sci. 5, 85–91. doi: 10.2960/J.v5.a11
Bowering W., Brodie W. (1991). Distribution of commercial flatfishes in the Newfoundland-Labrador region of the Canadian Northwest Atlantic and changes in certain biological parameters since exploitation. Netherlands J. Sea Res. 27, 407–422. doi: 10.1016/0077-7579(91)90042-Y
Bowering W., Brodie W. (1995). “Greenland halibut (Reinhardtius hippoglossoides). A review of the dynamics of its distribution and fisheries off eastern Canada and Greenland,” in Deep-water fisheries of the north Atlantic oceanic slope. Ed. Hopper A. G. (Dordrecht, The Netherlands.: Kluwer Academic Publishers), 113–160.
Bowering W., Chumakov A. (1989). Distribution and relative abundance of Greenland halibut (Reinhardtius hippoglossoides (Walbaum)) in the Canadian Northwest Atlantic from Davis Strait to the northern Grand Bank. Fisheries Res. 7, 301–327. doi: 10.1016/0165-7836(89)90064-7
Bowering W. R., Nedreaas K. H. (2000). A comparison of Greenland halibut (Reinhardtius hippoglossoides (Walbaum)) fisheries and distribution in the Northwest and Northeast Atlantic. Sarsia 85, 61–76. doi: 10.1080/00364827.2000.10414555
Brock G., Pihur V., Datta S., Datta S. (2008). clValid: An R Package for Cluster Validation. Journal of Statistical Software 25, 1–22. doi: 10.18637/jss.v025.i04
Brogan J. D., Kastelle C. R., Helser T. E., Anderl D. M. (2021). Bomb-produced radiocarbon age validation of Greenland halibut (Reinhardtius hippoglossoides) suggests a new maximum longevity. Fisheries Res. 241, 106000. doi: 10.1016/j.fishres.2021.106000
Campana S. E. (1999). Chemistry and composition of fish otoliths: pathways, mechanisms and applications. Mar. Ecol. Prog. Ser. 188, 263–297. doi: 10.3354/meps188263
Campana S., Chouinard G., Hanson J., Frechet A., Brattey J. (2000). Otolith elemental fingerprints as biological tracers of fish stocks. Fisheries Res. 46, 343–357. doi: 10.1016/S0165-7836(00)00158-2
Campana S. E., Valentin A., Sévigny J.-M., Power D. (2007). Tracking seasonal migrations of redfish (Sebastes spp.) in and around the Gulf of St. Lawrence using otolith elemental fingerprints. Can. J. Fisheries Aquat. Sci. 64, 6–18. doi: 10.1139/f06-162
Carrier E., Ferchaud A. L., Normandeau E., Sirois P., Bernatchez L. (2020). Estimating the contribution of Greenland Halibut (Reinhardtius hippoglossoides) stocks to nurseries by means of genotyping-by-sequencing: Sex and time matter. Evolutionary Appl. 13, 2155–2167. doi: 10.1111/eva.12979
Chen L., Liu Y., Hu Z., Gao S., Zong K., Chen H. (2011). Accurate determinations of fifty-four major and trace elements in carbonate by LA–ICP-MS using normalization strategy of bulk components as 100%. Chem. Geology 284, 283–295. doi: 10.1016/j.chemgeo.2011.03.007
Cook G. S., Parnell P. E., Levin L. A. (2014). Population connectivity shifts at high frequency within an open-coast marine protected area network. PLoS One 9, e103654. doi: 10.1371/journal.pone.0103654
Coussau L., Robert D., Sirois P. (2023). Spatiotemporal variability in otolith elemental fingerprint and the potential to determine deepwater redfish (Sebastes mentella) origins and migrations in the Estuary and Gulf of St. Lawrence, Canada. Fisheries Res. 265, 106739. doi: 10.1016/j.fishres.2023.106739
Cuny J., Rhines P. B., Kwok R. (2005). Davis Strait volume, freshwater and heat fluxes. Deep Sea Res. Part I: Oceanographic Res. Papers 52, 519–542. doi: 10.1016/j.dsr.2004.10.006
Delaney A., Jacobsen R. B., Hendriksen K. (2012). Greenland Halibut in Upernavik: a preliminary study of the importance of the stock for the fishing populace (Aalborg: Innovative Fisheries Management, Aalborg University).
de Pontual H., Lagardère F., Amara R., Bohn M., Ogor A. (2003). Influence of ontogenetic and environmental changes in the otolith microchemistry of juvenile sole (Solea solea). J. Sea Res. 50, 199–211. doi: 10.1016/S1385-1101(03)00080-7
Fairclough D. V., Edmonds J. S., Lenanton R. C., Jackson G., Keay I. S., Crisafulli B. M., et al. (2011). Rapid and cost-effective assessment of connectivity among assemblages of Choerodon rubescens (Labridae), using laser ablation ICP-MS of sagittal otoliths. J. Exp. Mar. Biol. Ecol. 403, 46–53. doi: 10.1016/j.jembe.2011.04.005
Fedorov K. Y. (1971). Zoogeographic characteristics of the Greenland halibut (Reinhardtius hippoglossoides (Walbaum)). J. Ichthyology 11, 971–976.
Ferchaud A.-L., Normandeau E., Babin C., Præbel K., Hedeholm R., Audet C., et al. (2022). A cold-water fish striving in a warming ocean: Insights from whole-genome sequencing of the Greenland halibut in the Northwest Atlantic. Front. Mar. Sci. 9, 992504. doi: 10.3389/fmars.2022.992504
Gibb F. M., Régnier T., Donald K., Wright P. J. (2017). Connectivity in the early life history of sandeel inferred from otolith microchemistry. J. Sea Res. 119, 8–16. doi: 10.1016/j.seares.2016.10.003
Gibson R. N., Nash R. D., Geffen A. J., van der Veer H. W. (2014). Flatfishes: biology and exploitation, Blackwell Science (Oxford: John Wiley & Sons).
Gillanders B. M. (2002). Connectivity between juvenile and adult fish populations: do adults remain near their recruitment estuaries? Mar. Ecol. Prog. Ser. 240, 215–223. doi: 10.3354/meps240215
Gillanders B. M. (2009). “Tools for studying biological marine ecosystem interactions—natural and artificial tags,” in Ecological connectivity among tropical coastal ecosystems, vol. 2009. (Dordrecht: Springer).
Giraldo C., Stasko A., Walkusz W., Majewski A., Rosenberg B., Power M., et al. (2018). Feeding of Greenland halibut (Reinhardtius hippoglossoides) in the Canadian Beaufort Sea. J. Mar. Syst. 183, 32–41. doi: 10.1016/j.jmarsys.2018.03.009
Gundersen A., Kennedy J., Woll A., Fossen I., Boje J. (2013). Identifying potential Greenland halibut spawning areas and nursery grounds off East and South-western Greenland and its management implications. J. sea Res. 75, 110–117. doi: 10.1016/j.seares.2012.05.016
Gundersen A., Stenberg C., Fossen I., Lyberth B., Boje J., Jørgensen O. A. (2010). Sexual maturity cycle and spawning of Greenland halibut Reinhardtius hippoglossoides in the Davis Strait. J. fish Biol. 77, 211–226. doi: 10.1111/j.1095-8649.2010.02671.x
Halkidi M., Batistakis Y., Vazirgiannis M. (2001). On clustering validation techniques. J. Intelligent Inf. Syst. 17, 107–145. doi: 10.1023/A:1012801612483
Hellberg M. E., Burton R. S., Neigel J. E., Palumbi S. R. (2002). Genetic assessment of connectivity among marine populations. Bull. Mar. Sci. 70, 273–290. Available at: https://www.ingentaconnect.com/content/umrsmas/bullmar/2002/00000070/A00101s1/art00003#.
Hothorn T., Bretz F., Westfall P. (2008). Simultaneous inference in general parametric models. Biometrical Journal 50, 346–363. doi: 10.1002/bimj.200810425
Hüssy K., Limburg K. E., De Pontual H., Thomas O. R., Cook P. K., Heimbrand Y., et al. (2021). Trace element patterns in otoliths: the role of biomineralization. Rev. Fisheries Sci. Aquaculture 29, 445–477. doi: 10.1080/23308249.2020.1760204
Hüssy K., Albertsen C. M., Hemmer-Hansen J., Vinther M., Serre S. H., Thomsen T. B., et al. (2022). Where do you come from, where do you go: Early life stage drift and migrations of cod inferred from otolith microchemistry and genetic population assignment. Can. J. Fish. Aquat. Sci. 79, 300–313. doi: 10.1139/cjfas-2020-0409
James G., Witten D., Hastie T., Tibshirani R. (2013). An introduction to statistical learning: with applications in R. (Berlin, Germany: Spinger).
Jensen A. S. (1935). The Greenland halibut (Reinhardtius hippoglossoides), its development and migrations. K. Dan. Vidensk. Selsk. Skr. 9, 1–32.
Jónsdóttir I. G., Campana S., Marteinsdottir G. (2006). Stock structure of Icelandic cod Gadus morhua L. based on otolith chemistry. J. Fish Biol. 69, 136–150. doi: 10.1111/j.1095-8649.2006.01271.x
Jørgensen O. A. (1997a). Movement patterns of Greenland halibut, Reinhardtius hippoglossoides (Walbaum), at West Greenland, as inferred from trawl survey distribution and size data. J. Northwest Atlantic Fishery Sci. 21, 23–37. doi: 10.2960/J.v21.a2
Jørgensen O. A. (1997b). Pelagic occurrence of Greenland halibut, Reinhardtius hippoglossoides (Walbaum), in west Greenland waters. J. Northwest Atlantic Fishery Sci. 21, 39–50. doi: 10.2960/J.v21.a3
Jørgensen O. A. (2013). Distribution of small Greenland halibut in Baffin Bay. Greenland Institute of Natural Resources. Technical report / Greenland Institute of Natural Resources No. 89.
Kalish J. (1990). Use of otolith microchemistry to distinguish the progeny of sympatric anadromous and nonanadromous salmonids. Fishery Bull. United States 88, 657–666. Available at: https://fisherybulletin.nmfs.noaa.gov/sites/default/files/pdf-content/1990/884/kalish.pdf.
Kaufman L., Rousseeuw P. J. (2009). Finding groups in data: an introduction to cluster analysis (Hoboken, NJ, USA: John Wiley & Sons).
Kerr L. A., Campana S. E. (2014). “Chemical composition of fish hard parts as a natural marker of fish stocks,” in Stock identification methods, 2nd ed (San Diego: Academic Press.: Elsevier).
Knutsen H., Jorde P. E., Albert O. T., Hoelzel A. R., Stenseth N. C. (2007). Population genetic structure in the North Atlantic Greenland halibut (Reinhardtius hippoglossoides): influenced by oceanic current systems? Can. J. Fisheries Aquat. Sci. 64, 857–866. doi: 10.1139/f07-070
Lazartigues A. V., Plourde S., Dodson J. J., Morissette O., Ouellet P., Sirois P. (2016). Determining natal sources of capelin in a boreal marine park using otolith microchemistry. ICES J. Mar. Sci. 73, 2644–2652. doi: 10.1093/icesjms/fsw104
Lazartigues A. V., Sirois P., Savard D. (2014). LA-ICP-MS analysis of small samples: Carbonate reference materials and larval fish otoliths. Geostandards Geoanalytical Res. 38, 225–240. doi: 10.1111/j.1751-908X.2013.00248.x
Le Bris A., Fisher J. A., Murphy H. M., Galbraith P. S., Castonguay M., Loher T., et al. (2018). Migration patterns and putative spawning habitats of Atlantic halibut (Hippoglossus hippoglossus) in the Gulf of St. Lawrence revealed by geolocation of pop-up satellite archival tags. ICES J. Mar. Sci. 75, 135–147. doi: 10.1093/icesjms/fsx098
Matta M. E., Kimura D. K. (2012). “Age determination manual of the Alaska fisheries science center age and growth program,” in NOAA Professional Paper NMFS, Vol. 13. NOAA, National Marine Fisheries Service, Seattle, Washington.
Melling H., Agnew T. A., Falkner K. K., Greenberg D. A., Lee C. M., Münchow A., et al. (2008). Fresh-water fluxes via Pacific and Arctic outflows across the Canadian polar shelf. In Arctic-Subarctic Ocean Fluxes, edited by: Dickson R. R., Meincke J., Rhines P. (Dordrecht: Springer), pp. 193–248. doi: 10.1007/978-1-4020-6774-7_10
Miller J. (2011). Effects of water temperature and barium concentration on otolith composition along a salinity gradient: implications for migratory reconstructions. J. Exp. Mar. Biol. Ecol. 405, 42–52. doi: 10.1016/j.jembe.2011.05.017
Morgan M., Bowering W., Gundersen A., Hoines Å., Morin B., Smirnov O., et al. (2003). A comparison of the maturation of Greenland halibut (Reinhardtius hippoglossoides) from populations throughout the North Atlantic. J. Northwest Atlantic Fishery Sci. 31, 352−361. doi: 10.2960/J.v31.a7
Münchow A., Falkner K. K., Melling H. (2015). Baffin island and west Greenland current systems in northern Baffin bay. Prog. Oceanogr. 132, 305–317. doi: 10.1016/j.pocean.2014.04.001
Paton C., Hellstrom J., Paul B., Woodhead J., Hergt J. (2011). Iolite: Freeware for the visualisation and processing of mass spectrometric data. J. Analytical Atomic Spectrometry 26, 2508–2518. doi: 10.1039/c1ja10172b
Pauly D., Christensen V., Guénette S., Pitcher T. J., Sumaila U. R., Walters C. J., et al. (2002). Towards sustainability in world fisheries. Nature 418, 689–695. doi: 10.1038/nature01017
Pomilla C., Treble M. A., Postma L. D., Lindsay M. M., Reist J. D. (2008). Initial genetic evidence of population structure of Greenland halibut (Reinhardtius hippoglossoides) in the Northwest Atlantic. J. Northwest Atlantic Fishery Sci. 40, 1–15. doi: 10.2960/J.v40.m637
Quinn G. P., Keough M. J. (2002). Experimental design and data analysis for biologists. (Cambridge, UK: Cambridge university press).
Régnier T., Augley J., Devalla S., Robinson C. D., Wright P. J., Neat F. C. (2017). Otolith chemistry reveals seamount fidelity in a deepwater fish. Deep Sea Res. Part I: Oceanographic Res. Papers 121, 183–189. doi: 10.1016/j.dsr.2017.01.010
Reis-Santos P., Tanner S. E., Elsdon T. S., Cabral H. N., Gillanders B. M. (2013). Effects of temperature, salinity and water composition on otolith elemental incorporation of Dicentrarchus labrax. J. Exp. Mar. Biol. Ecol. 446, 245–252. doi: 10.1016/j.jembe.2013.05.027
Riget F., Boje J. (1988). Distribution and abundance of young Greenland halibut Reinhardtius hippoglossoides in west Greenland waters. Northwest Atlantic Fisheries Organ. Sci. Council Stud. 12, 7–12.
Riget F., Boje J., Simonsen V. (1992). Analysis of meristic characters and genetic differentiation in Greenland halibut (Reinhardtius hippoglossoides) in the Northwest Atlantic. J. Northwest Atlantic Fishery Sci. 12, 7–14. doi: 10.2960/J.v12.a1
Roy D., Hardie D. C., Treble M. A., Reist J. D., Ruzzante D. E. (2014). Evidence supporting panmixia in Greenland halibut (Reinhardtius hippoglossoides) in the Northwest Atlantic. Can. J. Fisheries Aquat. Sci. 71, 763–774. doi: 10.1139/cjfas-2014-0004
Shi T., Horvath S. (2006). Unsupervised learning with random forest predictors. J. Comput. Graphical Stat 15, 118–138. doi: 10.1198/106186006X94072
Sicre M.-A., Weckström K., Seidenkrantz M.-S., Kuijpers A., Benetti M., Massé G., et al. (2014). Labrador current variability over the last 2000 years. Earth Planetary Sci. Lett. 400, 26–32. doi: 10.1016/j.epsl.2014.05.016
Simonsen C., Gundersen A. (2005). Ovary development in Greenland halibut Reinhardtius hippoglossoides in west Greenland waters. J. Fish Biol. 67, 1299–1317. doi: 10.1111/j.1095-8649.2005.00825.x
Simonsen C. S., Treble M. A. (2003). Tagging mortality of Greenland halibut Reinhardtius hippoglossoides (Walbaum). J. Northwest Atlantic Fishery Sci. 31, 373–385. doi: 10.2960/J.v31.a29
Smidt E. (1969). The Greenland Halibut Reinhardtius Hippoglossoides (Walb.), biology and explotation in Greenland Waters. Medd. Damn. Fisk-og Havund. NS 6, 79–148.
Sohn D., Ciannelli L., Duffy-Anderson J. (2010). Distribution and drift pathways of Greenland halibut (Reinhardtius hippoglossoides) during early life stages in the eastern Bering Sea and Aleutian Islands. Fisheries Oceanogr. 19, 339–353. doi: 10.1111/j.1365-2419.2010.00549.x
Stenberg C., Ribergaard M. H., Boje J., Sundby S. (2016). Larval drift and settling of Greenland halibut (R. hippoglossoides Walbaum) in Northwest Atlantic with special focus on Greenlandic waters. Danish Meteorological Institute. DMI Rep., 16–21.
Stene A., Gundersen A. C., Albert O. T., Solemdal P., Nedreaas K. H. (1999). Early development of northeast Arctic Greenland halibut (Reinhardtius hippoglossoides). J. Northwest Atlantic Fisheries Sci. 25, 171–177. doi: 10.2960/J.v25.a16
Sturrock A. M., Trueman C. N., Milton J. A., Waring C. P., Cooper M. J., Hunter E. (2014). Physiological influences can outweigh environmental signals in otolith microchemistry research. Mar. Ecol. Prog. Ser. 500, 245–264. doi: 10.3354/meps10699
Tang C. C., Ross C. K., Yao T., Petrie B., Detracey B. M., Dunlap E. (2004). The circulation, water masses and sea-ice of Baffin Bay. Prog. Oceanogr. 63, 183–228. doi: 10.1016/j.pocean.2004.09.005
Tournois J., Ferraton F., Velez L., Mckenzie D. J., Aliaume C., Mercier L., et al. (2013). Temporal stability of otolith elemental fingerprints discriminates among lagoon nursery habitats. Estuarine Coast. Shelf Sci. 131, 182–193. doi: 10.1016/j.ecss.2013.07.006
Treble M. A., Campana S. E., Wastle R. J., Jones C. M., Boje J. (2008). Growth analysis and age validation of a deepwater Arctic fish, the Greenland halibut (Reinhardtius hippoglossoides). Can. J. fisheries Aquat. Sci. 65, 1047–1059. doi: 10.1139/F08-030
Venables W. N., Ripley B. D. (2002). Modern applied statistics with S. Fourth Edition. Springer, New York.
Volckaert F. A. (2013). (Flat) fish stocks in an ecosystem and evolutionary perspective. J. sea Res. 75, 19–32. doi: 10.1016/j.seares.2012.06.011
Vollen T., Albert O. T. (2007). Pelagic behavior of adult Greenland halibut (Reinhardtius hippoglossoides). Fishery Bull. 106, 457–471. Available at: https://fisherybulletin.nmfs.noaa.gov/sites/default/files/pdf-content/2008/1064/vollen.pdf.
Walther B., Limburg K. (2012). The use of otolith chemistry to characterize diadromous migrations. J. Fish Biol. 81, 796–825. doi: 10.1111/j.1095-8649.2012.03371.x
Westgaard J.-I., Saha A., Kent M., Hansen H. H., Knutsen H., Hauser L., et al. (2017). Genetic population structure in Greenland halibut (Reinhardtius hippoglossoides) and its relevance to fishery management. Can. J. Fisheries Aquat. Sci. 74, 475–485. doi: 10.1139/cjfas-2015-0430
Wright P. J., Régnier T., Gibb F. M., Augley J., Devalla S. (2018). Assessing the role of ontogenetic movement in maintaining population structure in fish using otolith microchemistry. Ecol. Evol. 8, 7907–7920. doi: 10.1002/ece3.4186
Keywords: connectivity, Reinhardtius hippoglossoides, otolith chemistry, population structure, Northwestern Atlantic Ocean
Citation: Bassi L, Tremblay R, Morissette O and Sirois P (2024) Connectivity of Greenland halibut in the northwestern Atlantic Ocean inferred from otolith chemistry. Front. Mar. Sci. 10:1282264. doi: 10.3389/fmars.2023.1282264
Received: 23 August 2023; Accepted: 28 November 2023;
Published: 05 January 2024.
Edited by:
David Seth Portnoy, Texas A&M University Corpus Christi, United StatesReviewed by:
Marco Barra, National Research Council (CNR), ItalyCopyright © 2024 Bassi, Tremblay, Morissette and Sirois. This is an open-access article distributed under the terms of the Creative Commons Attribution License (CC BY). The use, distribution or reproduction in other forums is permitted, provided the original author(s) and the copyright owner(s) are credited and that the original publication in this journal is cited, in accordance with accepted academic practice. No use, distribution or reproduction is permitted which does not comply with these terms.
*Correspondence: Laélien Bassi, bGFlbGllbi5iYXNzaUBnbWFpbC5jb20=
Disclaimer: All claims expressed in this article are solely those of the authors and do not necessarily represent those of their affiliated organizations, or those of the publisher, the editors and the reviewers. Any product that may be evaluated in this article or claim that may be made by its manufacturer is not guaranteed or endorsed by the publisher.
Research integrity at Frontiers
Learn more about the work of our research integrity team to safeguard the quality of each article we publish.