 Yan Wang
 Hao Zhang*
 Wei Huang
- Department of Electrical Engineering, Ocean University of China, Qingdao, China
Passive recognition of ship-radiated noise plays a crucial role in military and economic domains. However, underwater environments pose significant challenges due to inherent noise, reverberation, and time-varying acoustic channels. This paper introduces a novel approach for ship target recognition and classification by leveraging the power of three-dimensional (3D) Mel-spectrograms and an additive attention based Transformer (ADDTr). The proposed method utilizes 3D Mel-spectrograms to capture the temporal variations in both target signal and ambient noise, thereby enhancing both categories’ distinguishable characteristics. By incorporating an additional spatial dimension, the modeling of reverberation effects becomes possible. Through analysis of spatial patterns and changes within the spectrograms, distortions caused by reverberation can be estimated and compensated, so that the clarity of the target signals can be improved. The proposed ADDTr leverages an additive attention mechanism to focus on informative acoustic features while suppressing the influence of noisy or distorted components. This attention-based approach not only enhances the discriminative power of the model but also accelerates the recognition process. It efficiently captures both temporal and spatial dependencies, enabling accurate analysis of complex acoustic signals and precise predictions. Comprehensive comparisons with state-of-the-art acoustic target recognition models on the ShipsEar dataset demonstrate the superiority of the proposed ADDTr approach. Achieving an accuracy of 96.82% with the lowest computation costs, ADDTr outperforms other models.
1 Introduction
Since ship-radiated noise stands as a prominent source of oceanic noise, its recognition possesses crucial importance across diverse domains, such as maritime security, navigation, environmental monitoring, and ocean research. However, the underwater environment is a challenging domain for passive target recognition. The performance is predominantly influenced by the presence of ambient noise interference, the time-varying acoustic channel, and the impact of reverberation. Additionally, ship-radiated noise is the result of vibrations from various ship components and possesses a relatively complex generation mechanism. It primarily involves mechanical noise, propeller noise, and hydrodynamic noise (Li and Yang, 2021). Hence, ship target recognition is a challenging task.
Feature extraction methods, such as the short-time Fourier transform (STFT) (Gabor, 1946), the discrete wavelet transform (DWT) (Mallat, 1989), the Hilbert–Huang transform (Yu et al., 2016), and the limit cycle (Goldobin et al., 2010), have been proven to be simple yet effective in acoustic signal processing (Zeng and Wang, 2014; Liu et al., 2017; Li et al., 2021; Tuncer et al., 2021). These methods mainly focus on time domain features and have succeeded due to the assumption of a homogenous propagation environment, such as air, where the frequency characteristics of received signals remain constant over time (Salomons and Havinga, 2015). However, the underwater propagation environment is completely inhomogeneous in both time and space. Consequently, the amplitude and phase of received signals undergo changes with time and space (Lurton, 2010).
Mutual time-frequency feature extraction methods, including time-scale decomposition (Frei and Osorio, 2007), resonance-based sparse signal decomposition (Selesnick, 2011), multiresolution signal decomposition (Mallat, 1989), Mel-spectrogram (Hermansky, 1980), and adaptive sparse non-negative matrix factorization (Jia et al., 2021), have shown improved performance in signal analysis (Virtanen and Cemgil, 2009; Gao et al., 2014; Wang and Chen, 2019; Monaco et al., 2020). However, these conventional techniques often focus on stationary signals or specific signal properties (Su et al., 2020). Unfortunately, underwater ship-radiated noise signals are non-stationary and highly dependent on factors like ship speed, depth, and distance from the receiver. As a result, the accuracy will decrease and their application will be limited.
Multi-stage feature extraction methods have been proposed to mitigate the mentioned limitations. For example, the resonance-based time-frequency manifold (RTFM) (Yan et al., 2018) combines sparse signal decomposition and a time-frequency manifold to extract oscillatory information and mitigate noise. Additionally, Esmaiel et al. (2021) combine enhanced variational mode decomposition, weighted permutation entropy, local tangent space alignment, and particle swarm optimization-based support vector machine to improve ship-radiated noise feature extraction in passive sonar. Zhang et al. (2020) combine adaptive variational mode decomposition and Wigner-Ville Distribution to accurately extract local features and construct time-frequency images.
Inspired by the multi-stage methods, this paper introduces a feature extraction approach that combines Mel-spectrogram with temporal derivative analysis stage by stage. The generated multi-dimensional Mel-spectrograms can effectively capture the temporal variations of both the target signals and the ambient noise. Consequently, the unique characteristics of these signals become more distinguishable. Furthermore, the inclusion of an additional spatial dimension allows for the modeling of reverberation effects, enhancing the overall feature representation.
Previous studies have demonstrated the application of statistical classifiers in the field, showcasing notable achievements (Filho et al., 2011; Yang et al., 2016; Tong et al., 2020). However, achieving promising results often requires sophisticated feature engineering. Furthermore, this kind of approach entails a relatively complex process of partitioning the problem into multiple subsections and then accumulating the results (Khishe, 2022).
Deep learning has opened up new possibilities for ship-radiated noise recognition. One of the greatest advantages is that relevant features from the acoustic signal can be automatically extracted. In (Purwins et al., 2019), a multilayer perceptron (MLP) based algorithm successfully defines underwater acoustic radiated noise (Yang et al., 1104; Shen et al., 2018; Zhao et al., 2019; Doan et al., 2020). demonstrate that a convolutional neural network (CNN) based model can model the original signal waveform directly and excels at capturing local spatial patterns. However, Yang et al. (2020) point out a limitation of CNNs in their ability to effectively capture the input data’s long-range dependencies. The authors address the limitation by employing recurrent neural network (RNN) units to learn the temporal dependencies. By doing so, the classification accuracy is improved.
The Transformer framework was originally introduced in the field of natural language processing with the primary goals of reducing training time and effectively capturing long-range dependencies (Vaswani et al., 2017; Devlin et al., 2018; Brown et al., 2020). Unlike the RNN, the Transformer is a non-sequential architecture that does not rely on past hidden states, allowing for stronger global computation abilities and perfect memory capacity. The Transformer framework has demonstrated exceptional efficiency and outstanding performance in denoising and recognizing underwater acoustic signals (Feng and Zhu, 2022; Li et al., 2022; Song et al., 2022), despite being relatively new to ship-radiated noise recognition.
Within the Transformer, the self-attention mechanism enables global interactions between all positions in the input sequence, which is freed from the limitations caused by localized receptive field and temporal/spatial distance. However, the self-attention mechanism employed by the Transformer has quadratic complexity to the input length, resulting in computational resource wasting and inefficiency. There are many researches focusing on accelerating the Transformer model (Beltagy et al., 2020; Kitaev et al., 2020; Wang et al., 2020; Zaheer et al., 2020; Tay et al., 2021), but they usually either suffer from insufficient modeling of global information or insufficient modeling of local information (Wu et al., 2021).
To balance both modeling efficiency and modeling capability, we propose an efficient variant of the Transformer for ship-radiated noise recognition. This variant incorporates an additive attention mechanism rather than a self-attention mechanism, resulting in linear computational complexity. It also effectively addresses challenges present in the acoustic signal data received from the real ocean environment, including ambient noise interference and reverberation distortion. By doing so, the performance of ship-radiated noise recognition tasks is significantly enhanced, enabling more accurate and reliable results.
Figure 1 provides a comprehensive overview of the proposed model’s technological process, encompassing three key stages: patching, embedding, and classification. In the subsequent section, each stage will be elaborated upon in detail.
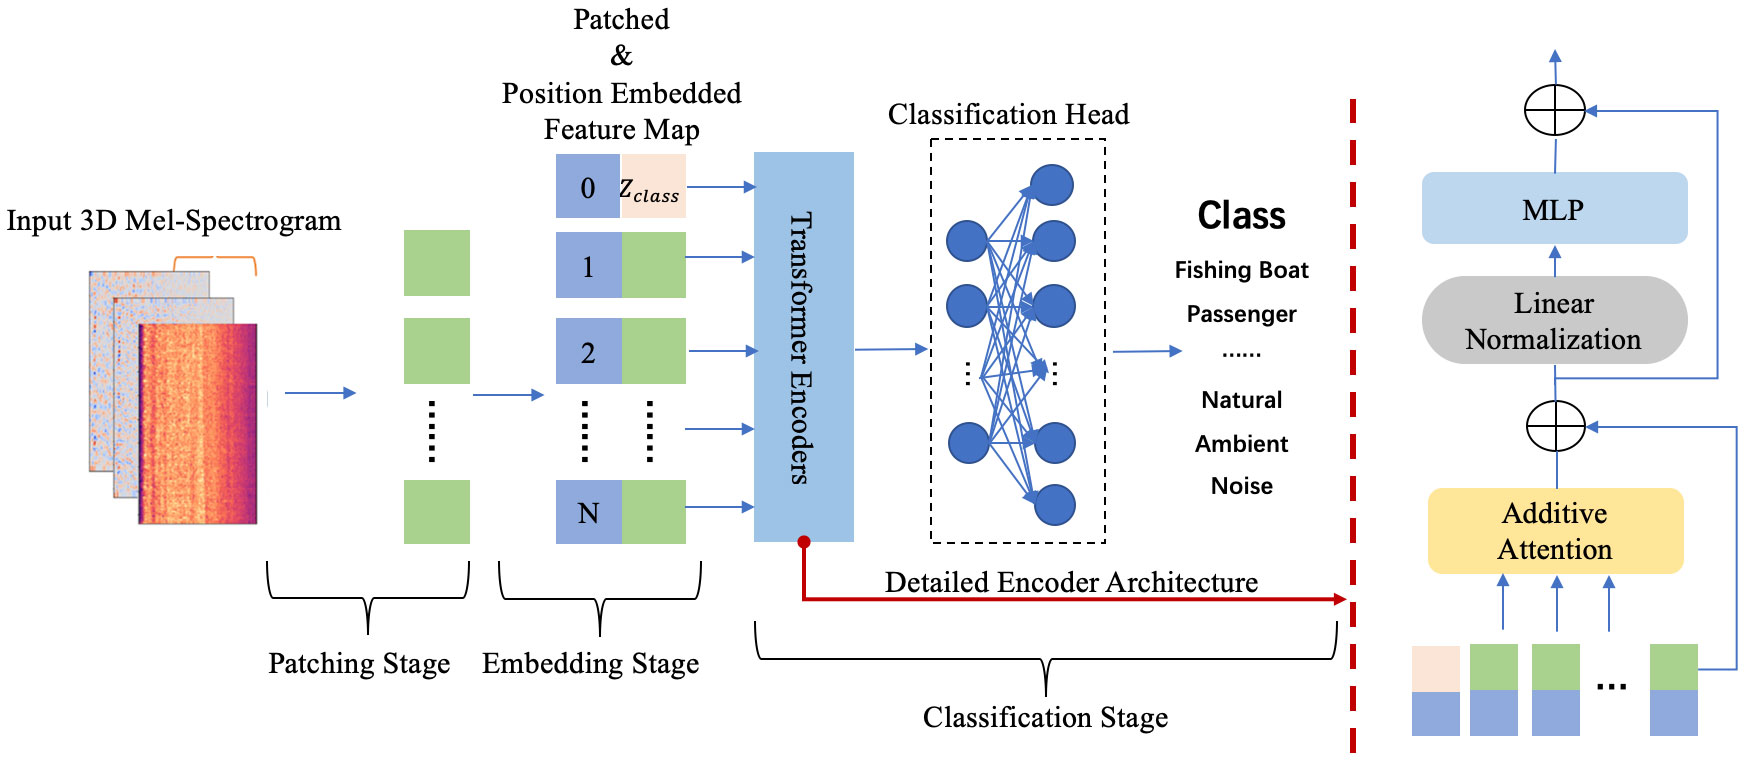
Figure 1 The overall technological process of the proposed model for acoustic signal recognition. The right side of the dotted line provides a detailed illustration of a single Transformer encoder.
The contributions in this paper can be summarized as:
1. In order to address the performance degradation resulting from long-term dependencies and noisy input data, we introduce an additive attention based Transformer approach, ADDTr. By utilizing the attention mechanism, our model can automatically assign higher importance to relevant information frames, thereby enabling improved modeling of spectral dependencies and capturing critical local dependencies.
2. In order to enhance both the modeling efficiency and modeling capability of the Transformer framework, we propose an additive attention mechanism that replaces the traditional self-attention mechanism. This substitution enables direct modeling of the interaction between global information and local frame representations. Hence it enables the model to attain attention scores with linear computational complexity, without sacrificing the modeling capacity of both global and local information.
3. In order to generate a more comprehensive feature representation of acoustic signals, we propose to use three-dimensional Mel-spectrograms, which are gained by concatenating the delta and delta-delta features with the Mel-spectrogram. This approach facilitates the estimation and compensation of distortions caused by reverberation, thereby enhancing the clarity of the target signals.
The rest of the paper is structured as follows. Section II, which detailedly describes the methodology of feature extraction and the proposed neural network, is followed by Section III, which presents the dataset used in the paper and the analyses conducted from experimental results. Finally, conclusions are given in section IV.
2 Methodology
2.1 System overview
In acoustic signal analysis, Mel-spectrograms are often adopted to extract relevant acoustic features that can be used as input for machine learning models. However, for accurate acoustic data classification, Mel-spectrograms themselves cannot provide enough information. They lack the incorporation of temporal dynamics and have a fixed resolution that may not capture fine details in complex scenes. Thus, they may not fully represent important acoustic characteristics such as spatial distribution and temporal evolution. To tackle these issues, we propose an approach to generate a more comprehensive feature representation by incorporating additional temporal and spatial dimensions with the original Mel-spectrograms. This is achieved by concatenating the delta features and the delta-delta features.
To reduce the negative impacts of irregular ocean noise interference, reverberation distortion, and traditional deep learning framework’s inherent deficiencies on the ship targets recognition accuracy, we propose a novel ADDTr model.
Figure 1 illustrates the overall process for handling three-dimensional Mel-spectrograms in the model. Initially, the input data undergoes a patching stage where the enriched Mel-spectrogram is flattened and divided into fixed-sized patches. Subsequently, in the embedding stage, the sequence of patches is augmented with a position embedding tensor that captures spatial information and a class token that summarizes the global information of the Mel-spectrogram. During the classification stage, the encoders utilize additive attention to dynamically prioritize essential information for accurate target recognition. Finally, the output from the Transformer encoder is passed to a classification head, enabling the input data to be classified into the appropriate category.
The architecture of ADDTr is inspired by the Vision Transformer (Dosovitskiy et al., 2020), with a notable modification. Instead of the traditional dot-product-based self-attention mechanism, ADDTr incorporates an innovative additive attention mechanism. This modification improves the efficiency and accelerates the computational speed of the model. More details are provided in subsection C.
2.2 Feature extraction
In the dataset, each recorded ship-radiated noise is stored as a one-dimensional array based on the audio length and sampling rate. To extract informative feature representations from the raw data, Mel-spectrograms are commonly used. However, Mel-spectrograms alone can only capture the static characteristics of the signal, limiting their ability to capture essential temporal dynamics for accurate feature extraction. To solve this problem, we propose three-dimensional Mel-spectrograms. By incorporating the dynamic characteristics of the signal, the resulting feature representations become more comprehensive, thereby enhancing robustness. Figure 2 illustrates the process of extracting a three-dimensional Mel-spectrogram.
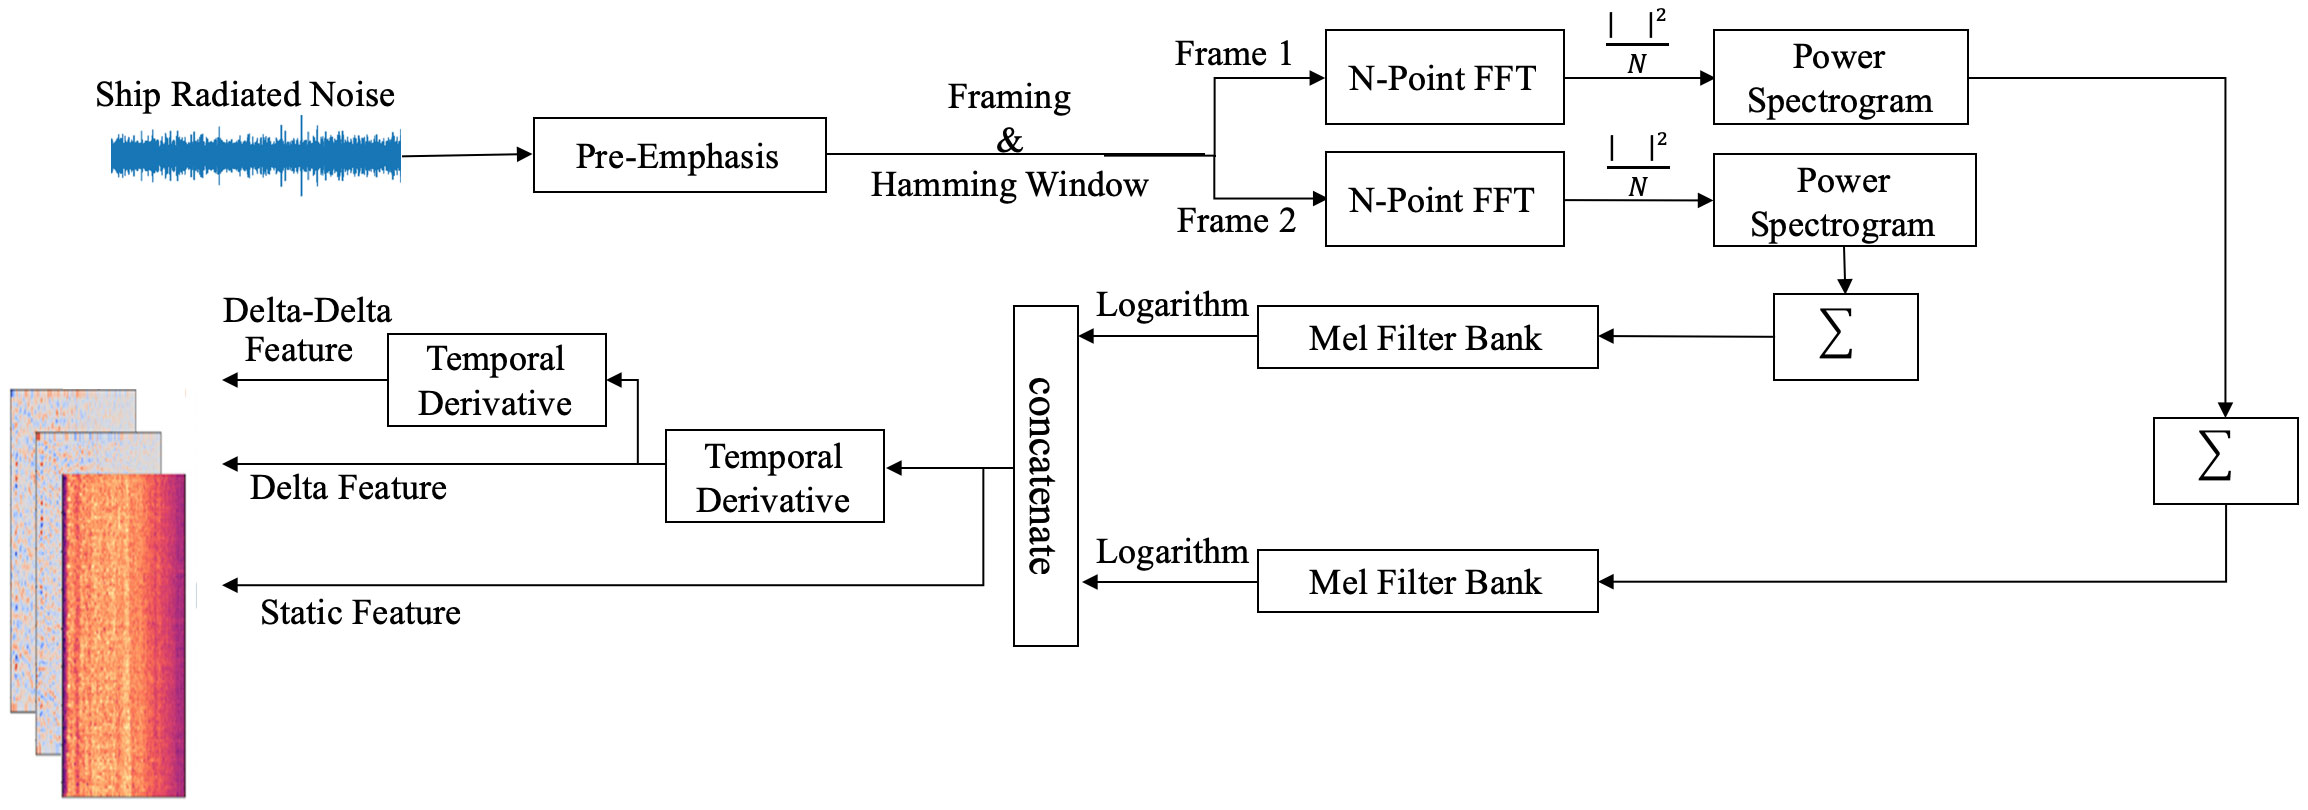
Figure 2 Block diagram of the 3-D Mel spectrogram formation process. The process can be divided into three main parts. First, the original signal undergoes pre-emphasis, frame blocking, and windowing as a pre-processing step. Then, the Mel-spectrogram is extracted by performing operations such as N-point fast Fourier transform (FFT), squaring, cumulative sum, Mel-filter bank application, and logarithm. In the end, the delta and delta-delta features are obtained by calculating the temporal derivative with consecutive frames.
During the extraction process, the acoustic signal is initially subjected to a pre-emphasis filter. This filter plays a crucial role in equalizing the frequency spectrum of the signal by amplifying the amplitudes of higher-frequency components. This amplification is particularly beneficial as higher-frequency components tend to exhibit lower levels of noise in comparison to their lower-frequency counterparts. By mitigating the natural attenuation of high frequencies, the pre-emphasis filter effectively restores the balance of the frequency spectrum. As a result, the clarity of the signal is enhanced and the prominence of noise is diminished, thereby improving the overall quality of the raw data.
The following Fourier transformation constitutes a fundamental step in the conversion of acoustic signals into Mel-spectrograms, as it enables the analysis of frequency content. However, a direct application of the Fourier transform to the entire signal often leads to adverse effects, such as the generation of nonsensical results and the obliteration of the underlying frequency characteristics. It is widely acknowledged that the frequencies present in a signal tend to remain stationary over brief temporal windows. Accordingly, the frequency characteristics can be accurately captured by combining the outcomes of Fourier transform from neighboring frames. To minimize intra-frame fluctuations, a small frame size is commonly employed, typically on the order of milliseconds. Hence, in this paper, a frame size of 25ms is adopted for ship-radiated noise analysis, with feature aggregation conducted over a temporal interval of 1 second.
Spectral leakage occurs when the signal does not have an integer number of cycles within the chosen window length for the Fourier transform. To counteract spectral leakage and faithfully preserve the frequency characteristics inherent in the acoustic data, a Hanning window is incorporated into the methodology. It gently tapers the signal’s edges, thereby mitigating the adverse effects of spectral leakage and enhancing frequency resolution. The power spectrum is subsequently computed using the equation:
where stands for N-point fast Fourier Transform, and is the th frame of signal . Subsequently, the power spectrum is subjected to the Mel filter bank consisting of 128 bins to extract the Mel-spectrogram. The choice of 128 bins is justified by its alignment with the power of 2, which facilitates efficient computations within the neural network architecture. The Mel-scale, employed in this process, is intentionally designed to exhibit higher resolution at lower frequencies while being less discriminative at higher frequencies. The conversion of Hertz and Mel can be accomplished through the utilization of the following equations:
The filter bank consists of triangular filters characterized by a response of 1 at their center frequencies. From the center frequency, the response linearly diminishes until it reaches 0 at the center frequencies of the two adjacent filters. This triangular response profile ensures that the filter bank can capture the frequency content of the signal in a localized manner, with higher sensitivity around the center frequencies and reduced sensitivity towards the neighboring frequencies. By employing such triangular filters, the Mel filter bank effectively partitions the frequency spectrum into distinct frequency bands, facilitating the extraction of relevant information for the subsequent generation of Mel-spectrograms. The process can be expressed by the following equation:
where is the number of filters, and is the list of Mel-spaced frequencies. is the th coefficient for the.th filter bank.
The coefficients obtained from the previous steps, known as static coefficients, exhibit a high degree of correlation and reflect the static characteristics of the signal. However, to capture the dynamic characteristics of the target, this paper incorporates additional features in the form of delta spectrograms and delta-delta spectrograms. The additional features are obtained by utilizing the following equation:
where is a delta coefficient, from frame t computed in terms of the static coefficients and . While setting , the deltas-delta coefficients can be calculated using the same equation. By analyzing the variations between adjacent frames, these dynamic features provide valuable information about the temporal changes in the signal. By including delta and delta-delta spectrograms, the model becomes capable of capturing and utilizing the evolving patterns and trends present in the acoustic data. This enhancement significantly improves the overall representation of the data, leading to a more effective recognition and analysis of ship-radiated noise.
In this paper, the sampling rate for each audio record is 22050 Hz. Hence, a one-second signal can generate a three-dimensional Mel-spectrogram with the size of . Figure 3 represents an original ship-radiated noise signal and its corresponding three-dimensional Mel-spectrogram.
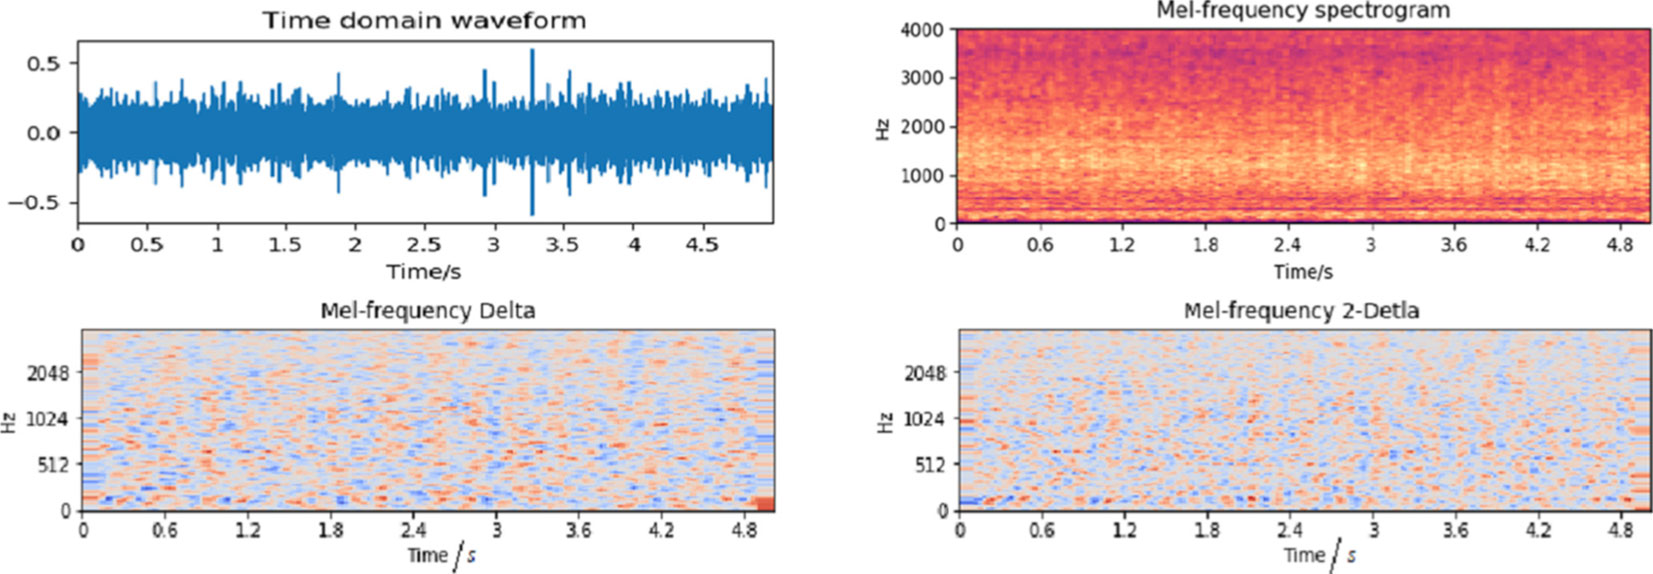
Figure 3 The original signal and its corresponding 3D Mel-spectrogram.
2.3 Model architecture
ADDTr adopts the Transformer framework, which operates on input data represented as a one-dimensional sequence of embedded patches. In order to handle three-dimensional Mel-spectrograms denoted as , with representing the number of Mel filter bins, denoting the time dimensions, indicating the spectrogram’s dimension, and standing for the real number space, the model initiates a patching stage, as illustrated in Figure 1. In this stage, a trainable linear projection is utilized to transform the Mel-spectrograms. This projection reshapes the spectrograms into sequences of patches denoted as , where and correspond to the height and width of each patch, which are typically set to be equivalent. The parameter represents the total number of patches, and serves as the effective input sequence length for the Transformer.
Within the Transformer, a constant latent vector size D is used across all layers. Then, the patches are flattened and transformed to D dimensions using another trainable linear projection known as the patch embedding, denoted as . This mapping ensures that the patches are represented in a suitable format for subsequent processing within the Transformer layers.
The model proceeds to the second stage, known as embedding. Based on the approach described in (Devlin et al., 2018), our model first incorporates a learnable class token that is inserted at the beginning of the sequence of the flattened patches. This class token serves as a representation of the spectrogram. By consistently placing it at the start of the sequence, the Transformer encoder can easily locate and utilize this token without the need to search the entire sequence. This design choice ensures that the model can effectively capture and utilize the global information present in the spectrogram representation.
The model then incorporates a learnable position embedding tensor, denoted as , during the embedding stage. The tensor is appended to the patch sequence and enables the model to effectively capture the positional information of each patch within the original spectrogram. By including this positional information, the model can better preserve the higher-dimensional context of the input feature map, even when it undergoes dimensionality reduction, reshaping, and segmentation. This ensures that the model retains crucial spatial information during the subsequent processing stages. The whole process can be expressed as:
In the subsequent step, the model extracts more abstract features from the embedded patches through a series of encoder layers. As illustrated in Figure 1, each encoder layer follows the same architecture, consisting of an attention layer, a feed-forward MLP layer, and a normalization layer (LN) positioned in between. By incorporating the attention mechanism, the proposed model gains the ability to automatically assign higher importance to relevant information frames within the input sequence. This allows for enhanced modeling of spectral dependencies and the capture of critical local dependencies. Consequently, the model becomes more resilient to the interference of ambient noise present in the raw data. By selectively concentrating on relevant features and suppressing irrelevant ones, the model can effectively filter out noise and focus on the salient aspects of the acoustic signals, leading to improved performance in the presence of challenging environmental conditions.
Different layers in a Transformer encoder are interconnected by residual connections, which effectively alleviate the vanishing gradient problem during back-propagation, and ensure the preservation of the learned information. Additionally, the weighted matrices employed in the proposed attention mechanism are protected from degeneration, ensuring their effectiveness throughout the learning process.
The detailed computing process of the proposed additive attention mechanism is depicted in Figure 4. The input , derived from the embedding stage, is initially split into query, key, and value matrices by utilizing three independent linear transformation layers. The generated query matrix ( ), key matrix (), and value matrix () are written as , , and , respectively.
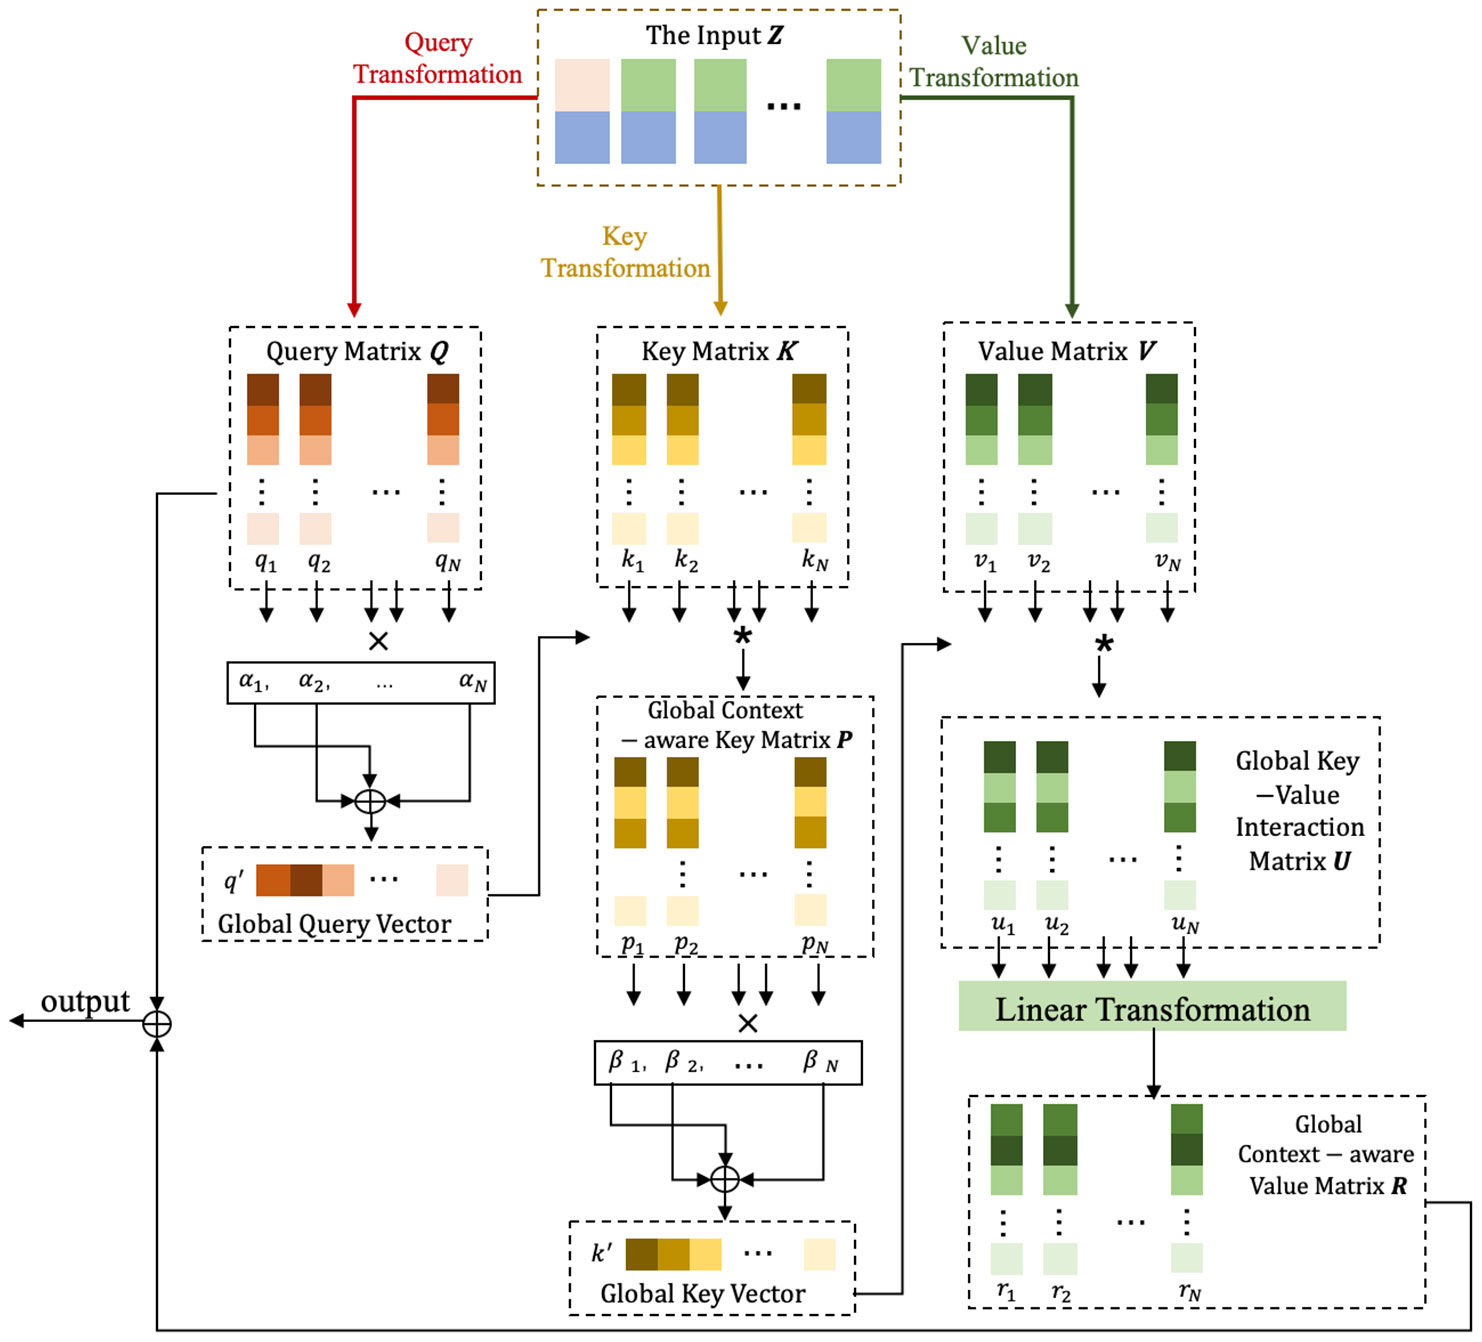
Figure 4 The technical process of the additive attention mechanism. It first transforms the input into query, key, and value matrices, Q, K, V, via three independent linear transformations. Q is then summarized into a global query vector q′ by multiplying each vector qi with its corresponding attention weight αi and summarizing the results. Next, the interaction between the attention key K and q′ is modeled through element-wise product, yielding the global context-aware key matrix P. P is further summarized into a global key vector k′ by multiplying each vector pi with its corresponding attention weight βiand summarizing the results. Afterward, an element-wise production combines the global key and attention value V, resulting in an aggregated representation U. U is then processed through a linear transformation to generate the global context-aware attention value R. Finally, Q and R are added to form the final output. Notations: ∗ denotes element-wise product, × denotes multiplication, and ⊕ denotes summarization.
Subsequently, the model summarizes the query matrix into a global query vector, denoted as . This global query vector can effectively capture the consolidated global contextual information within the attention query. This summarization process is accomplished by multiplying each vector in the matrix with its corresponding attention weight vector and then aggregating the results. The left column of Figure 4 visually illustrates this summarization process.
To be more specific, the attention weight of the i-th query vector is computed as:
where . is a learnable parameter vector and represents the exponential function. Then, the global query vector can be computed by:
When modeling the interaction between the summarized global query vector and the key matrix, simply adding or concatenating the query to each vector in the key matrix will yield unsatisfactory results. This is because such approaches fail to differentiate the influence of the global query on different keys. In other words, they treat every key in the same manner and lack the ability to allocate attention selectively. To address this issue, this paper employs element-wise production, which proves effective in capturing the nonlinear relations between two vectors.
The global query vector undergoes an element-wise multiplication with the key matrix , resulting in the generation of a global context-aware key matrix denoted as . This matrix allows the model to differentiate the influence of the global query across different keys. is then summarized into a global key vector, represented as . This summarization is achieved by multiplying each vector in with its corresponding attention weight and summing the results. The middle column of Figure 4 provides a visual depiction of this summarization process. By incorporating this approach, the model will be able to effectively capture relevant information and adapt its attention distribution based on the global context, ultimately leading to enhanced modeling capability and improved performance.
The attention weight of the i-th global context-aware key vector is computed as the following equation:
, where (the symbol denotes element-wise production) and is the attention parameter vector. The global key vector is computed as follows:
The right column of Figure 4 illustrates the process of modeling global dependencies through the interactions between the attention-value matrix and the global key vector. Similar to the query-key interaction, the global key vector is combined with each value vector through element-wise product, yielding the key-value interaction vector . To capture the underlying information in these interaction vectors, a linear transformation layer is applied to each key-value interaction vector, enabling the learning of its hidden representation. The resulting output matrix is then added to the query matrix, forming the final output.
By stacking multiple encoders, the network is able to comprehensively model global attention and generate a representation for each input spectrogram based on the class token. This process facilitates the integration of both local and global information, resulting in a more informative and context-aware representation of the input data. The computations conducted in the Transformer Encoders can be expressed as follows:
where denotes the output generated from the former layer, denotes the additive attention mechanism that is employed in our ADDTr. and represent the feed-forward multilayer perceptron layer and the linear normalization layer, respectively.
The generated representation is then passed to a classification head, constructed using another MLP with one hidden layer, to fulfill the final stage depicted in Figure 1. LN layers and dropout layers are interspersed in the proposed Transformer in order to stabilize the model while deepening the network.
2.4 Complexity analysis
In this subsection, all instances of , , and mentioned in various equations refer to the same query, key, and value matrices. Additionally, represents the length of the input, while is a constant latent vector size that controls the input dimension, i.e., the dimension of the representations.
The proposed method deviates from the conventional approach of modeling global attention using matrix multiplication. Instead, it leverages element-wise multiplication to compute the additive attention AddictiveAttention(). The additive attention is calculated as:
where is the global key vector, which is obtained by Eq.10. is the learnable linear projection parameter. The computation complexity of the proposed network is . Noted that the complexity of linear transformations is not taken into account by many prior works, it is also omitted in this paper while calculating computational costs.
The dot-product-based self-attention score is computed by measuring the pairwise similarity between two patches within the sequence. Its calculation process can be expressed as:
The softmax() denotes the application of the softmax function along the last axis of the matrix. Then, the computational complexity of original self-attention is , which is much higher than the proposed method since .
An alternative attention mechanism commonly used in acoustic signal classification is the shifted window attention, initially introduced by the Swin Transformer (Liu et al., 2021). This attention mechanism prioritizes modeling global interactions and utilizes a nested window approach with standard self-attention to mitigate computational complexity. The computational complexity of this mechanism is , where represents the window size. Since is a constant positive value by definition, compared to the attention mechanism employed in the paper, it is computationally more expensive due to its higher complexity.
3 Experiment
3.1 Dataset
The ShipsEar dataset (Santos-Domínguez et al., 2016), which consists of recordings of underwater vessel noise captured in real shallow oceanic environments, is utilized in the paper. This dataset encompasses a diverse range of natural and anthropogenic environmental noise sources. Without any preprocess, the received signals are influenced by reflections and echoes introduced by reverberations, leading to overlapping and smeared spectrograms. The dataset comprises 90 acoustic samples from 11 distinct vessel types, with each category containing one or more samples. The duration of the audio varies from 15 seconds to 10 minutes.
The dataset was divided into three subsets: training set, testing set, and validation set. The training set was allocated 70% of the data and used for model training and fitting. The testing set, comprising 20% of the data, was used to fine-tune the model’s hyperparameters and perform an initial assessment of its performance. The remaining 10% constituted the validation set, which remained unknown to the model during training and testing, allowing for the evaluation of the model’s generalization ability and robustness.
To ensure consistency in the dataset, a slicing method was applied during the data preprocessing stage, dividing all signals into fixed 1-second durations. This preprocessing step augmented the dataset, resulting in adequate samples to allocate to each category’s three subsets. The samples were randomly selected and distributed among the subsets according to the predefined ratio.
3.2 Training and testing
In this paper, the training and testing of the proposed model were conducted utilizing Nvidia’s RTX3090 GPU, which is equipped with 24 GB of G6X memory. Table 1 lists the parameters used during the training and testing stages, while Figure 5 provides a detailed view of the model’s performance in each epoch of these stages.
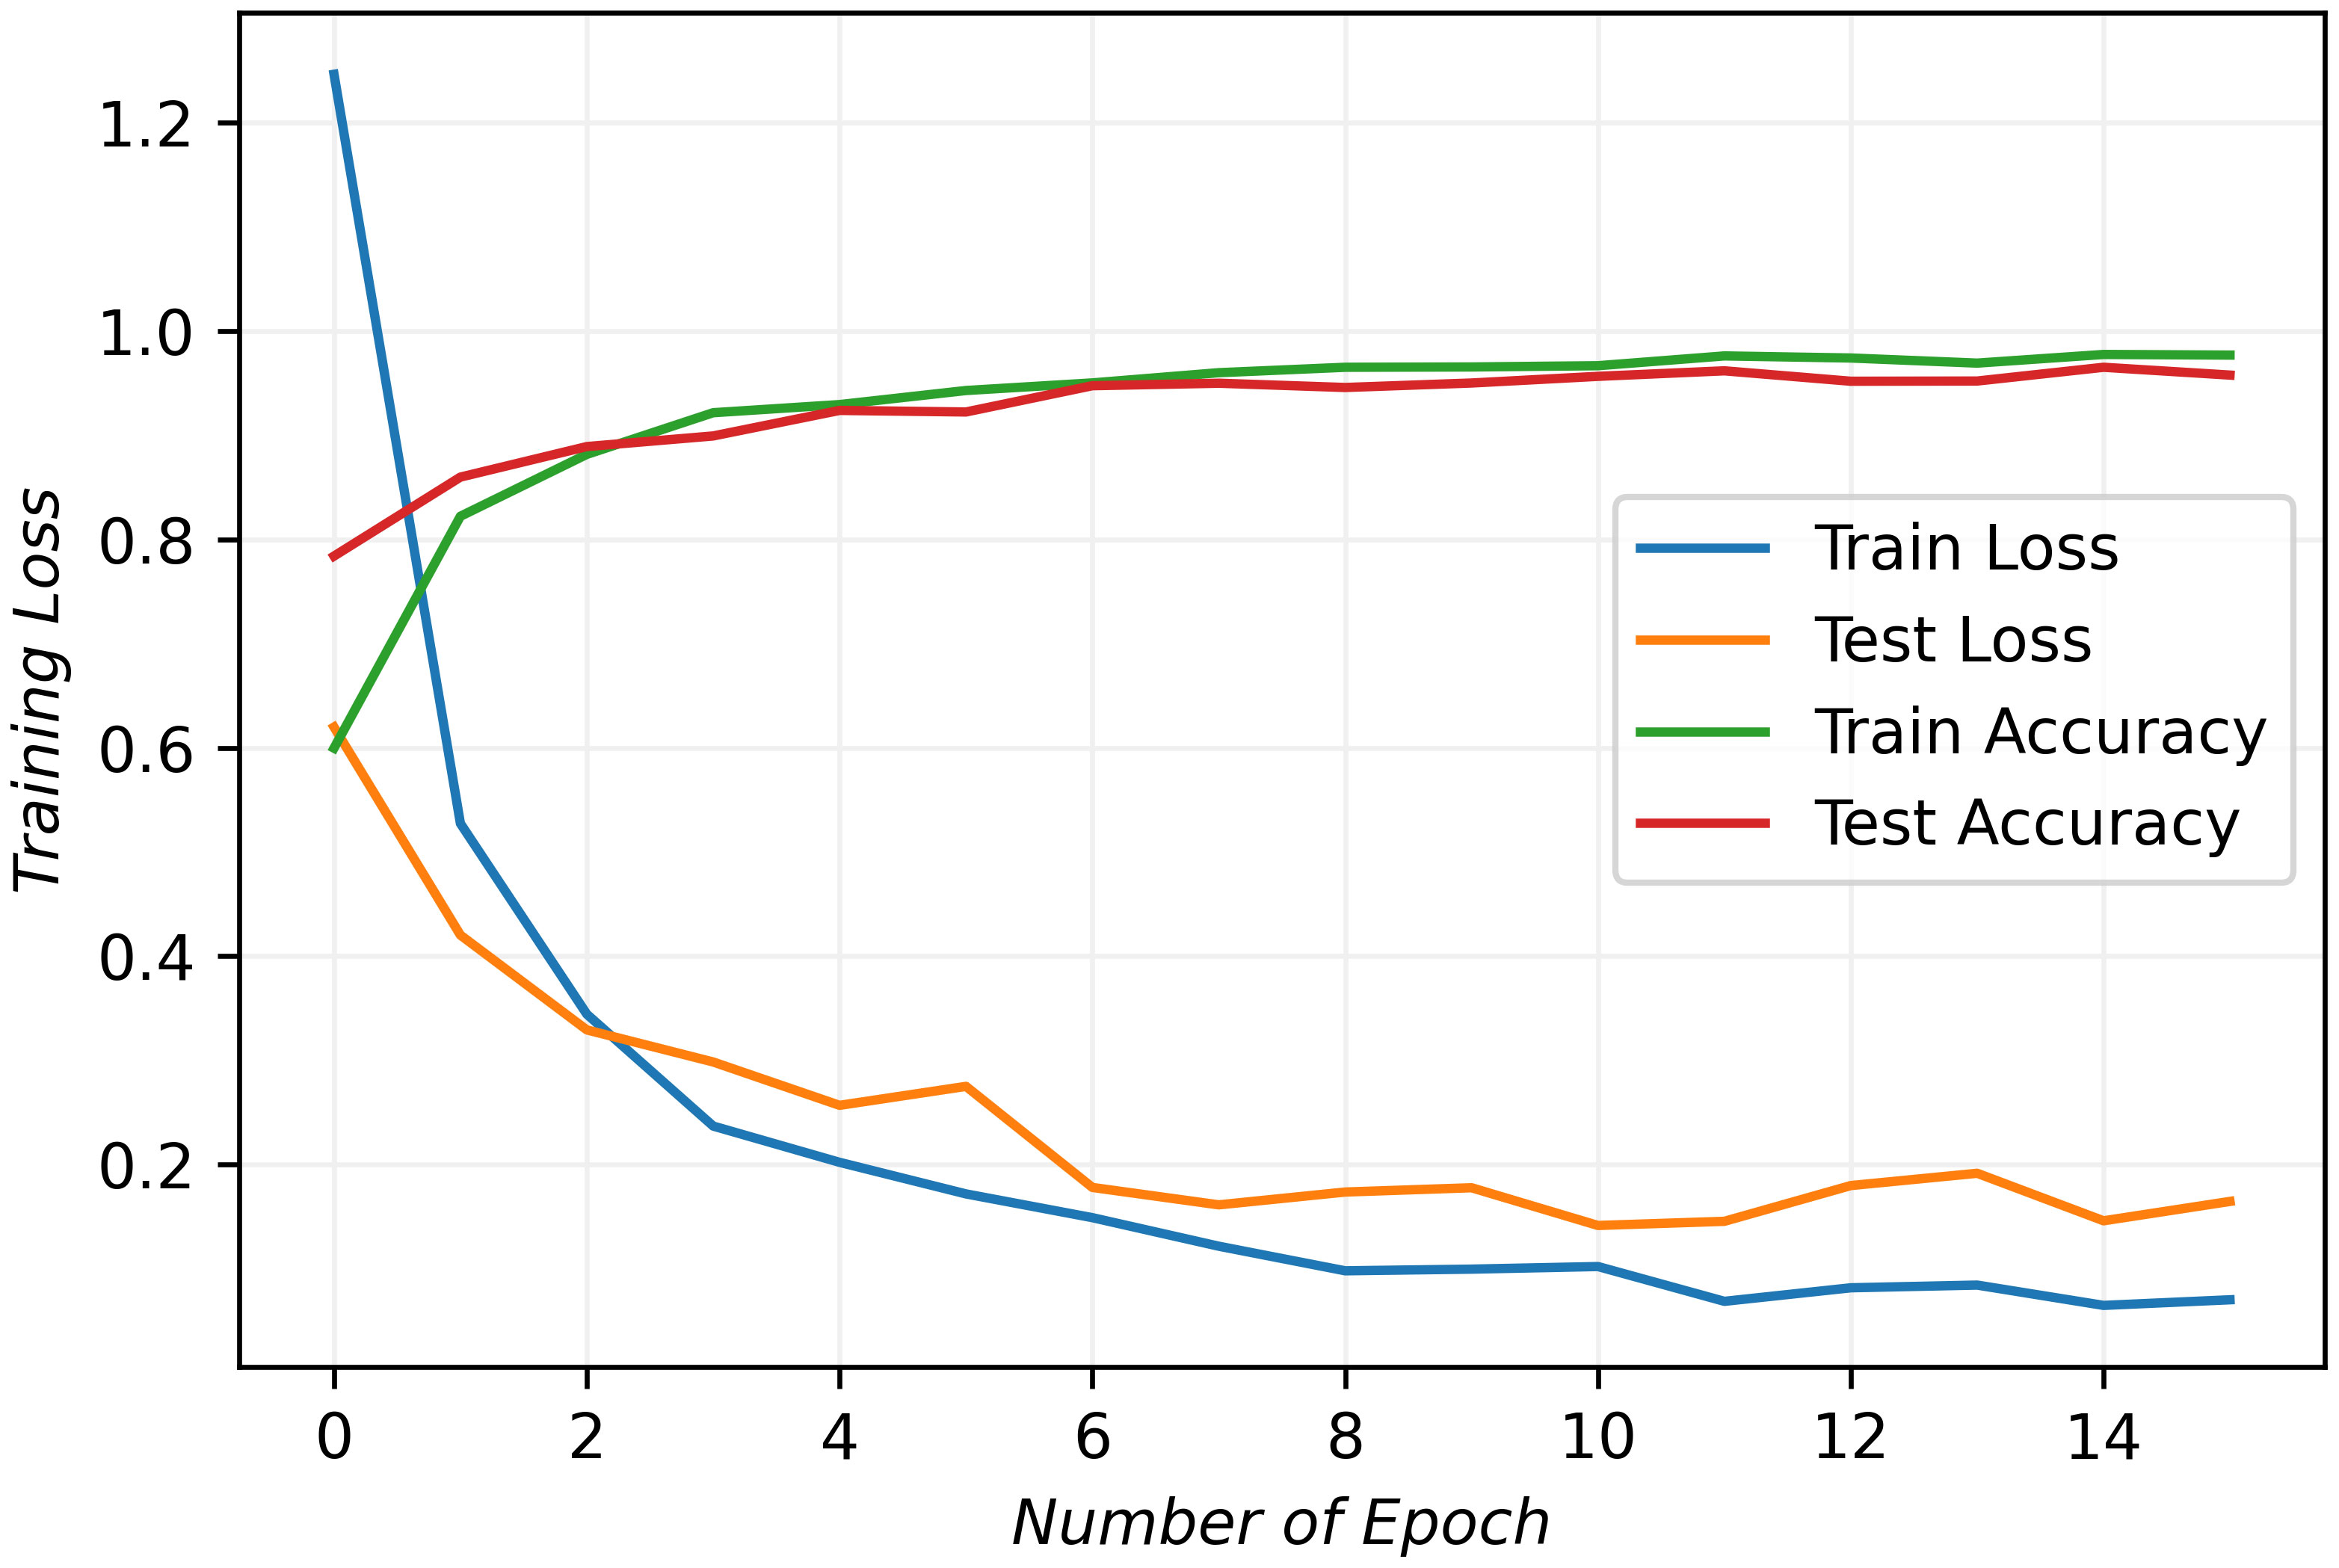
Figure 5 The detailed training process and results. The tendency of lines indicates an optimal fit.
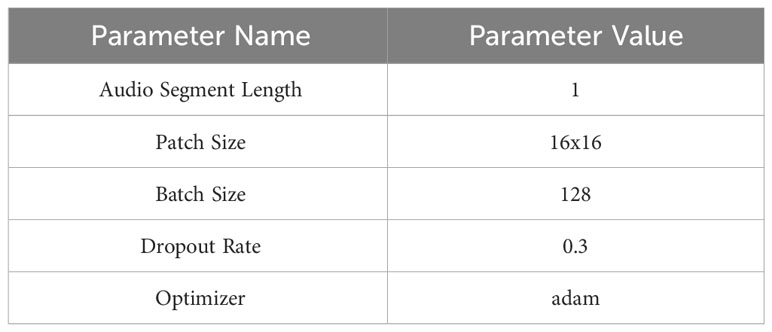
Table 1 The following parameters are utilized in the proposed model during both the training and testing stages.
The initial assessment of a deep learning model typically involves analyzing training and testing losses, which measure the errors for each example in their respective datasets. As depicted in the figure, both training and testing losses exhibit a decreasing trend, while training and testing accuracies steadily increase. They start to stabilize after ten epochs and stop after fourteen epochs. The behavior indicates the model’s effective convergence to an optimal fit.
Overfitting and underfitting are common challenges in deep learning. They usually arise when the model struggles to generalize well on new data or experiences significant errors in the training data. These issues often result in diverging loss lines due to gradient disappearance or explosion. However, as evident from the figure, the convergence lines of the proposed model demonstrate its capability to mitigate these problems and effectively learn the underlying data features. Consequently, the results demonstrate our model’s high performance and its potential as a robust data analysis and prediction tool.
3.3 Evaluation
To comprehensively evaluate the effectiveness of our proposed model and feature extraction method, we conducted several experiments.
The results, as illustrated in Table 2, demonstrate the superiority of three-dimensional Mel-spectrograms over their one-dimensional counterparts when employed with various widely used audio classification models. This improvement can be attributed to the incorporation of the signal’s dynamic features, which enhances the representational power of the spectrograms. By capturing temporal variations in the acoustic signal, the three-dimensional Mel-spectrograms provide richer and more informative features for accurate classification across different acoustic signal recognition models. The experimental findings highlight the significance of considering dynamic characteristics in feature extraction for acoustic classification tasks.
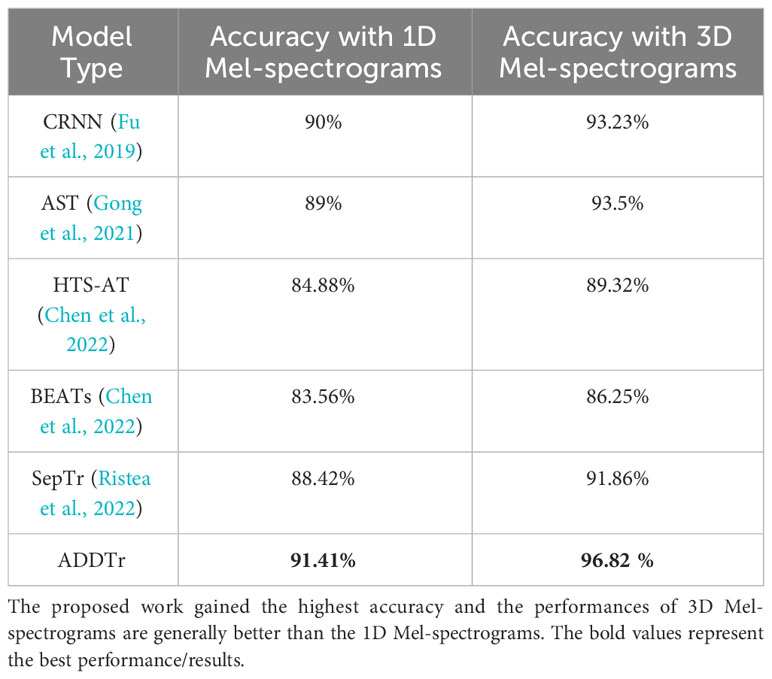
Table 2 Accuracy comparison between different models using 1D and 3D mel-spectrograms as input.
We conducted a series of experiments to determine the optimal number of Transformer encoders required for effective learning of the three-dimensional Mel-spectrogram features. The results of these experiments, as illustrated in Figure 6, involved training and testing the model with varying numbers of encoders. The findings indicated that the best performance is achieved when employing eight Transformer encoders, highlighting the importance of this specific number. When using more or fewer encoders, it is observed that the classification performance became suboptimal or the computational resources were inefficiently utilized. Hence, the study suggests that the selection of the appropriate number of encoders plays a crucial role in maximizing the model’s learning capabilities and achieving superior classification outcomes.
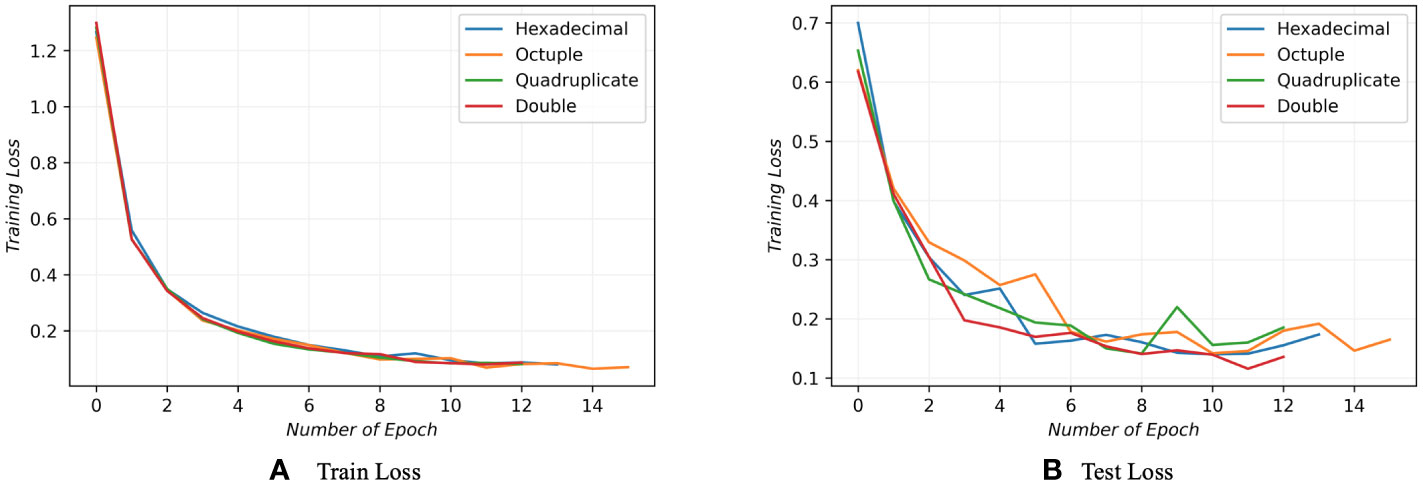
Figure 6 A comparison of model performance was conducted by employing 2, 4, 8, and 16 Transformer encoders during both training and testing phases. Each performance is distinguished by a distinct line color, with red, green, orange, and blue lines representing the different encoder counts, respectively. The results reveal that when using 8 encoders, the model demonstrates the highest learning capacity and attains the lowest loss value.
In order to determine the optimal hyper-parameter settings, we conducted experiments with different combinations of patch sizes, batch sizes, and audio segment lengths. The evaluation results, presented in Figure 7, offer a comprehensive analysis of the performance. The patch size refers to the size of patches extracted from the input data by the transformer block. It is shown that models with smaller patch sizes tend to be more computationally intensive due to the inverse square relationship between the transformer’s sequence length and the patch size. However, it should be noted that larger patch sizes do not necessarily lead to improved classification performance. In fact, a larger patch size results in fewer patches for the same input, limiting the model’s learning opportunities and yielding poorer results, as depicted in Figure 7.
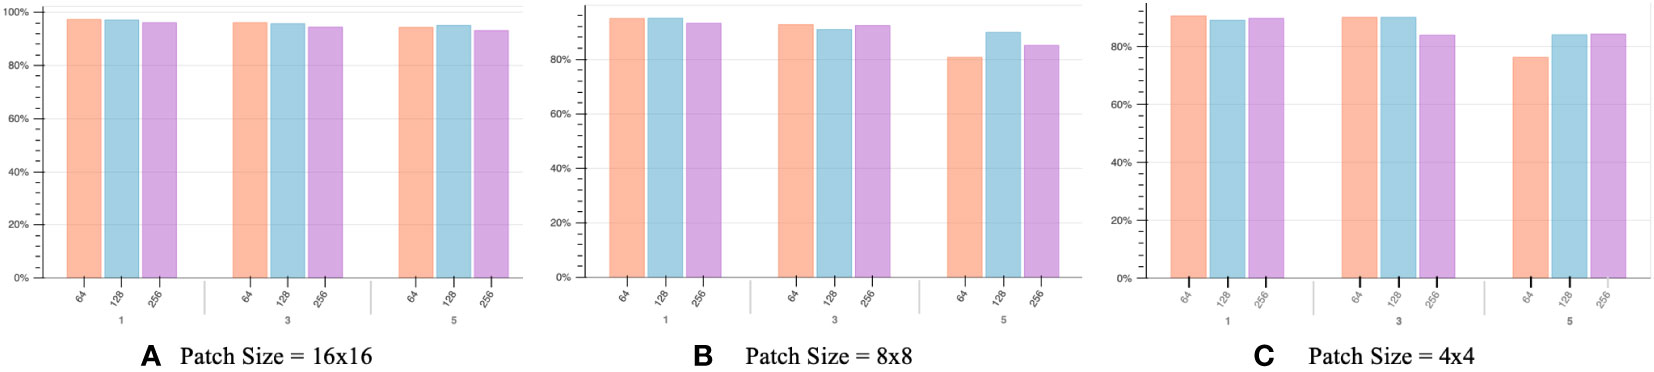
Figure 7 Below the x-axis, values 1, 3, and 5 represent the audio segment length in seconds. The x-axis displays values 64, 128, and 256, indicating different batch sizes. The y-axis represents the classification accuracy of our proposed model. The best result is achieved with a patch size of 16x16, a batch size of 128, and an audio segment length of 1 second.
Another crucial factor to consider is the batch size, which determines the number of samples processed before updating the model’s internal parameters. Typically, it is recommended to choose a batch size that aligns with the number of GPUs’ physical processors, often a power of 2. Deviating from this configuration may result in suboptimal performance. The x-axis in Figure 7 represents different audio clip lengths, denoted as 1, 3, and 5 seconds.
The classification accuracy reaches an optimal value of approximately 97% with a patch size 16x16, an audio segment length of 1 second, and a batch size of 128, as illustrated in the figure. This remarkable result highlights the model’s ability to accurately identify almost all of the ship-radiated noise, even when recorded in challenging environments. For a more detailed understanding of the recognition performance across different classes, please refer to the graphical representation presented in Figure 8.
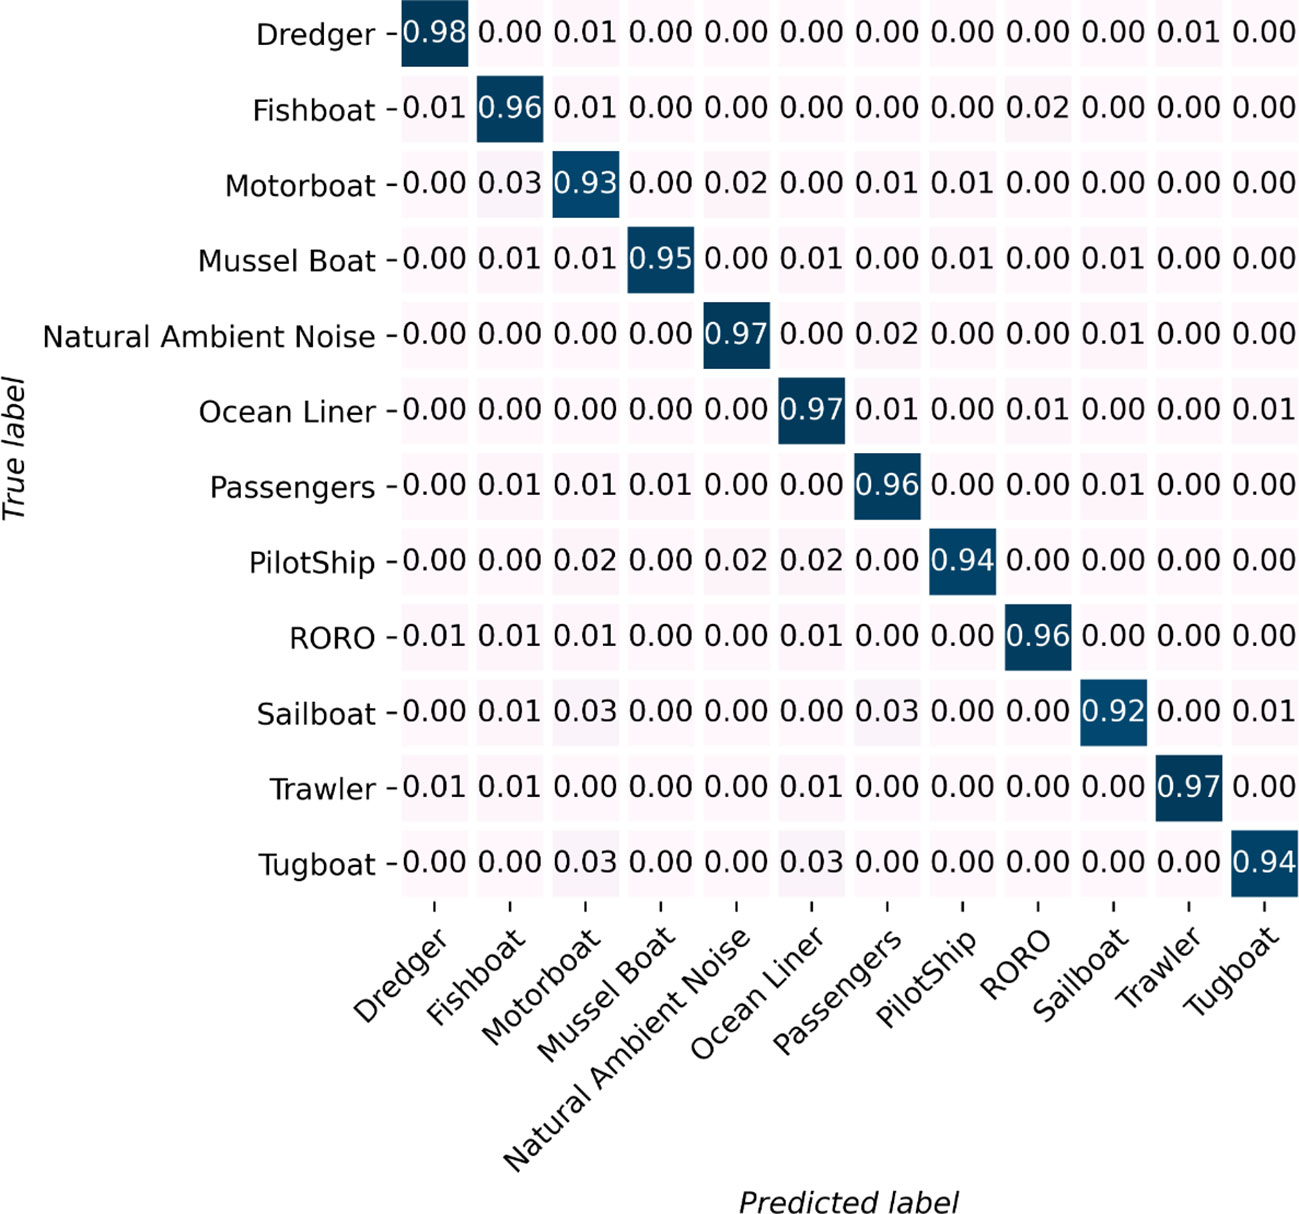
Figure 8 Each class’s identification result. All of the categories have an identification accuracy higher than 92%. Eight out of twelve categories’ identification accuracy is higher than 95%.
Figure 9 provides insights into the classification performance of the proposed model, considering different optimizers and dropout rates. An optimizer plays a crucial role in updating the model’s parameters based on the gradients of the loss function with respect to the weights. We evaluated five commonly used optimizers in acoustic deep learning models: adaptive moment estimation (Adam), root mean square propagation (RMSprop), stochastic gradient descent (SGD), adaptive gradient (Adagrad), and adaptive delta (Adadelta).
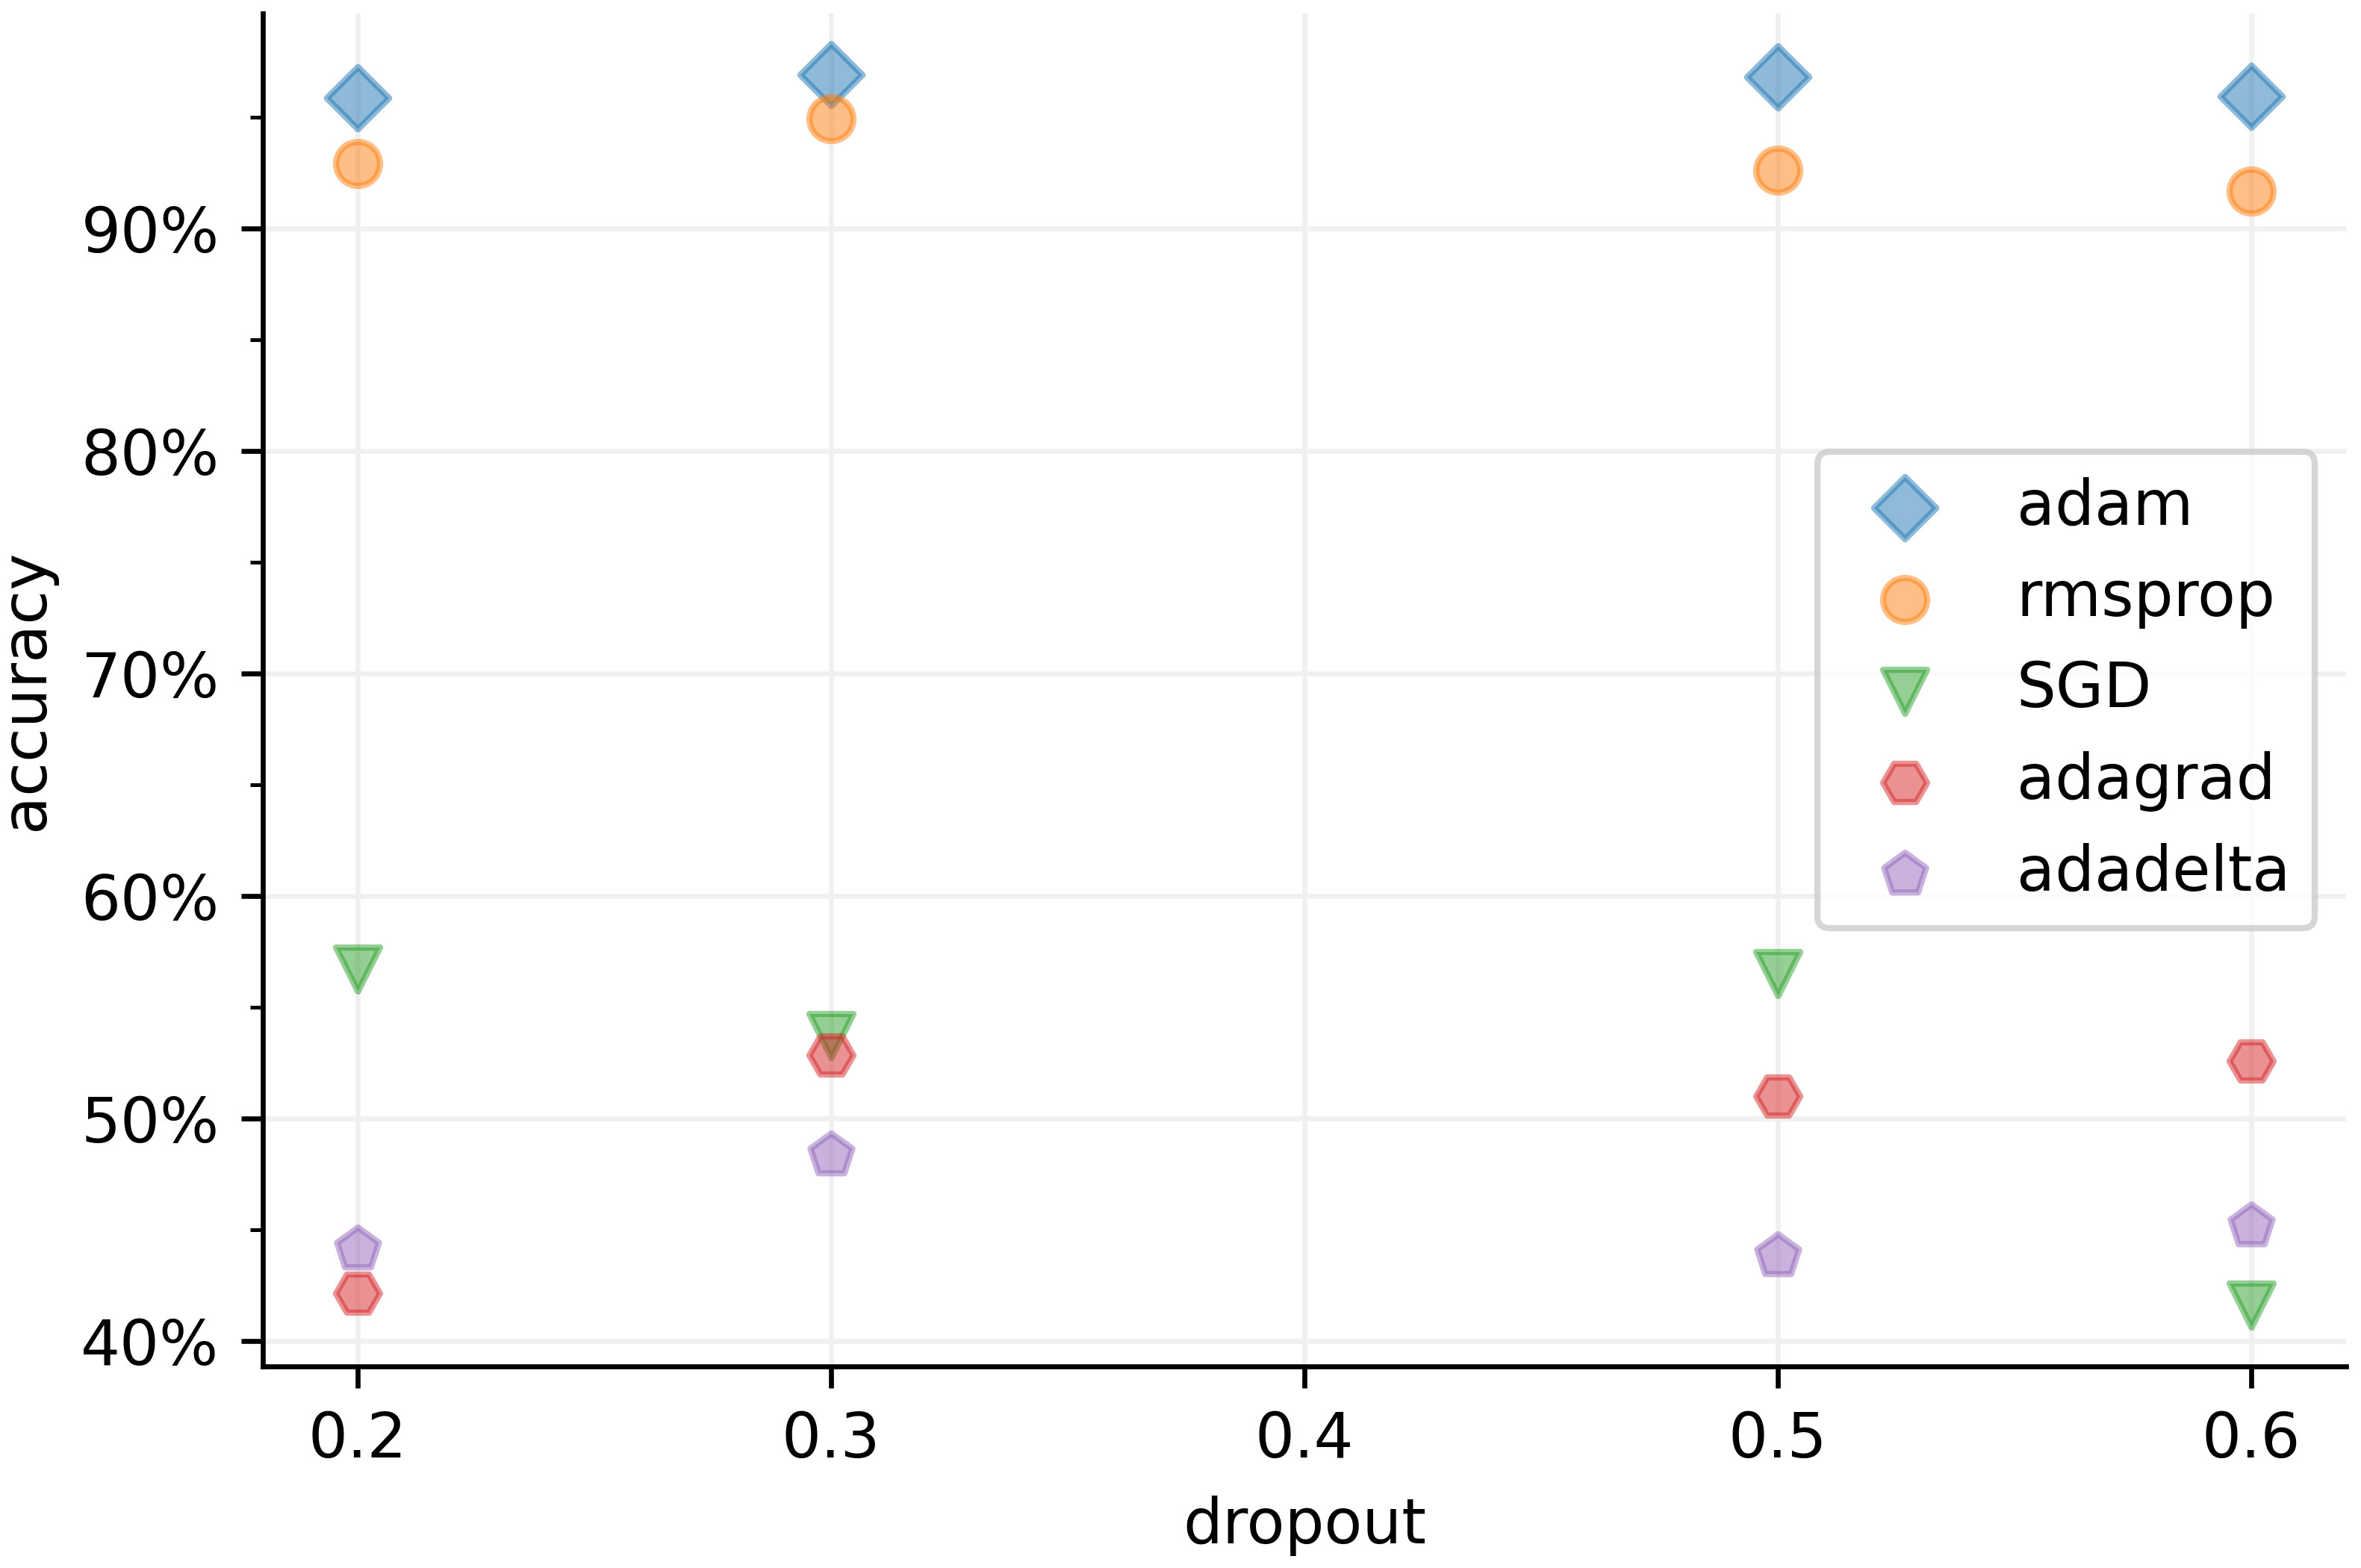
Figure 9 Comparison of different identification accuracies in different optimizers and dropouts. The adam optimizer reaches the local minimum most effective in the ship target recognition task while the dropout rate should set to 0.3 to achieve the optimal result.
The results depicted in Figure 9 reveal that Adam outperforms other optimizers when applied to the non-convex underwater signal dataset. Underwater acoustic signals can be sparse and noisy, making it difficult to estimate accurate gradients during training. Both Adam and RMSprop adaptively adjust learning rates based on historical gradient information, enabling them to effectively handle sparse and noisy gradients. This adaptability leads to more stable and efficient optimization in the presence of such challenges. Adam combines momentum and adaptive learning rates, maintaining separate learning rates for each parameter and utilizing adaptive estimates of both first-order (mean) and second-order (variance) moments of the gradients. RMSprop also adapts learning rates but only considers the first-order moment of the gradients, making it slightly less effective than Adam in handling underwater acoustic data.
On the other hand, SGD suffers from slow convergence due to its fixed learning rate, which can also be sensitive to the choice of learning rate. The fixed learning rate in SGD cannot adjust automatically through the training process, potentially causing oscillations or divergence with a high learning rate, and slow convergence or suboptimal solutions with a low learning rate. Adadelta struggles with sparse gradients, limiting its ability to update parameters effectively. Additionally, Adadelta requires more memory due to the accumulation of squared gradients. Adagrad’s diminishing learning rates over time can hinder adaptation in the underwater acoustic target recognition model, and its accumulation of historical gradients may result in less relevance of recent gradients during optimization.
Dropout is a regularization technique that randomly drops nodes in a layer during training to mitigate overfitting. By incorporating dropout, the training process introduces noise and forces the remaining nodes to learn more robust and independent features. Through experiments, it has been determined that the optimal dropout rate is 0.3, indicating that approximately one-third of the inputs are randomly excluded from each update iteration.
A dropout rate lower than 0.3 can result in the model relying too heavily on specific nodes, discouraging the network from learning more diverse representations and degrading its generalization ability. Moreover, when a large number of nodes are randomly dropped, the remaining nodes need to compensate for the missing information. This can lead to slower convergence or difficulties in finding an optimal solution during the training process. Hence, a dropout rate greater than 0.3 can limit the model’s ability to learn complex patterns and relationships in the data, also leading to a lower performance.
Figure 10 provides a comparison between the proposed method and several commonly used acoustic data classification models utilizing three-dimensional Mel-spectrograms as inputs. The graph displays different lines representing our proposed ADDTr, convolutional recurrent neural network (CRNN), BEATs, hierarchical token-semantic audio Transformer (HTS-AT), audio spectrogram Transformer (AST), and separable Transformer (SepTr). The results show that the proposed model achieves the optimal performance at epoch 14, outperforming the other models in terms of efficiency. Even after thorough training, the proposed model consistently maintains higher classification accuracies compared to the other models. Figure 10B shows that the proposed model exhibits smoother performance, indicating its robustness on unseen data.
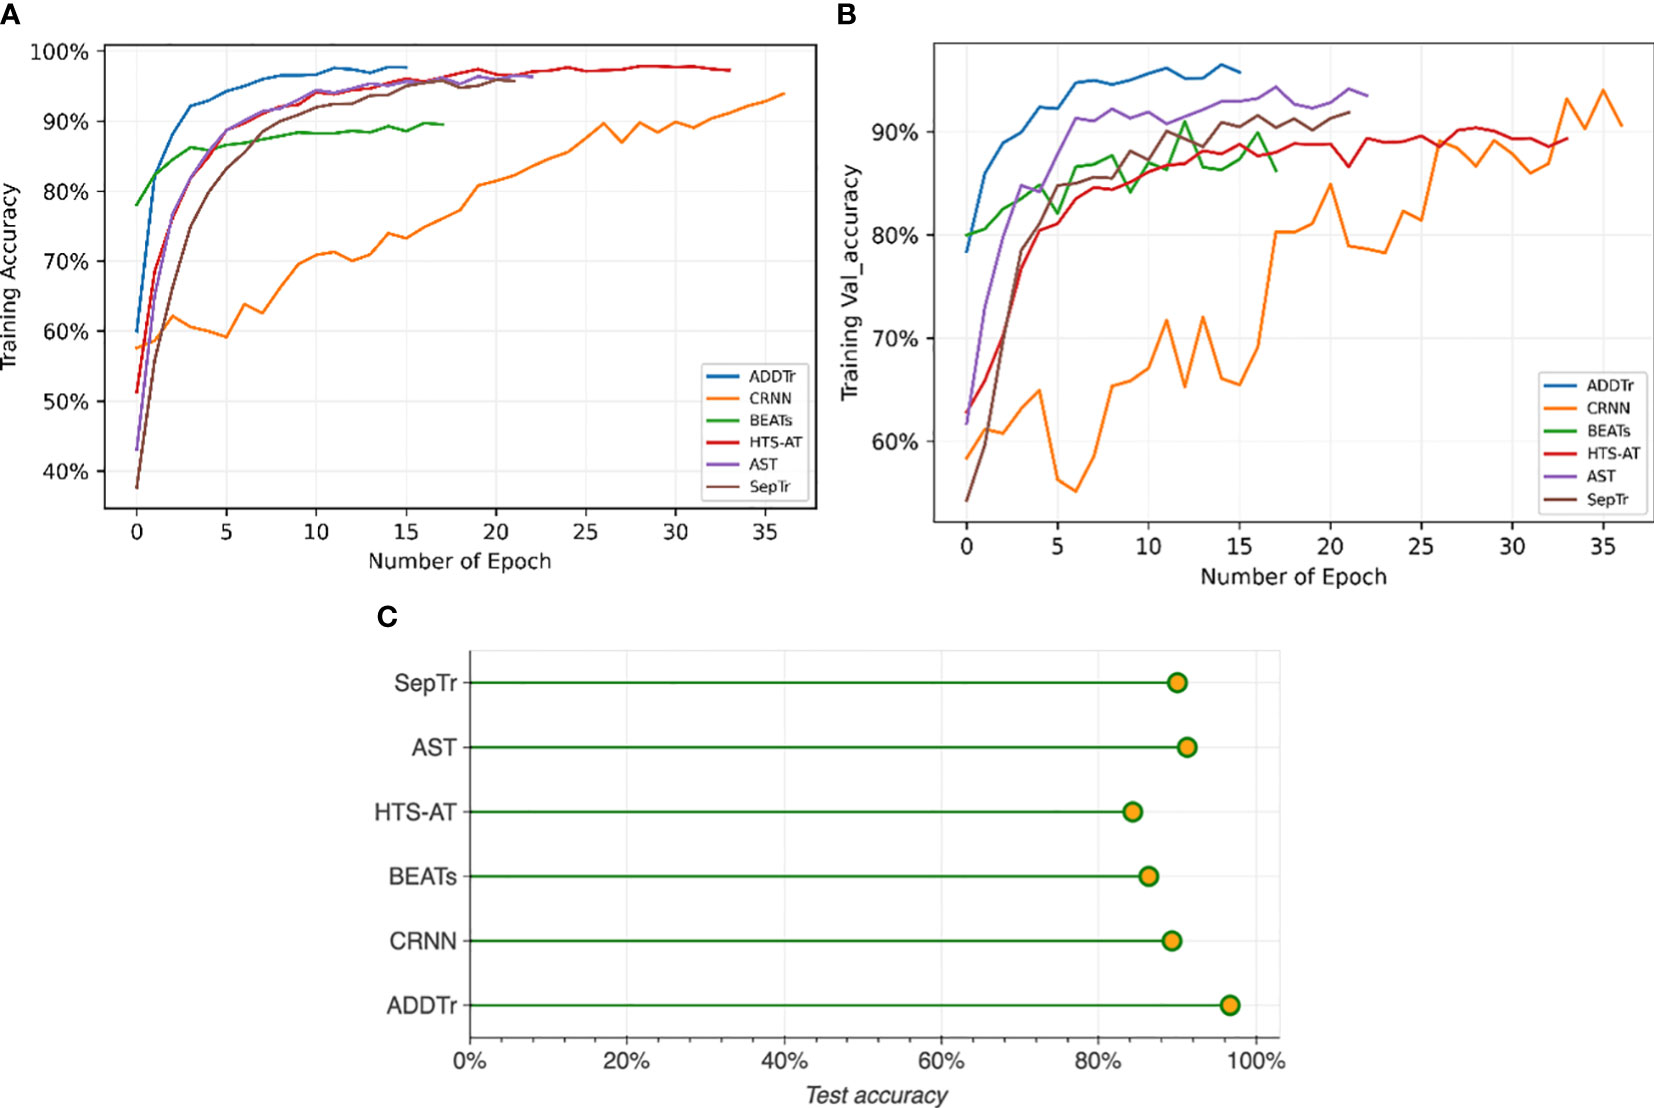
Figure 10 Comparison of identification accuracy between the proposed model and other mainstream neural networks based on the number of epochs. The number of epochs represents how many times the entire dataset is processed by the learning algorithm. Our proposed model attains the highest accuracy while requiring the least amount of time during the training, testing, and validation processes.
The better performance of ADDTr can be attributed to the following reasons. While CRNNs have shown promise in audio processing tasks, their limited modeling capabilities due to the sequential nature of recurrent layers may make it challenging for them to capture long-term dependencies in audio data. BEASTs, although they leverage acoustic tokenizers for audio pre-training, may not be optimized for underwater acoustic signals. The employed tokenization strategy may fail to capture the specific acoustic information relevant to underwater acoustics, leading to suboptimal representations and reduced classification performance. HTS-AT relies on the token-semantic audio transformer architecture, which incorporates hierarchical token semantics. However, this approach may not fully capture the complex temporal patterns and dependencies in underwater acoustic signals, resulting in reduced classification performance.
Similarly, SepTr and AST, like other transformer-based models, depend on self-attention mechanisms to capture long-range dependencies in audio signals. Yet, the complex temporal patterns in underwater acoustic data, such as non-linear dependencies and irregular sequences, may pose challenges for self-attention. This can compromise the models’ ability to accurately capture temporal dynamics, leading to suboptimal performance in tasks where such dynamics are crucial.
In contrast, our proposed model circumvents these deficiencies. It avoids acoustic tokenizers and self-attention mechanisms, instead utilizing additive attention to directly model the interactions between global and local representations. By summing the attended representations, it effectively suppresses noise and enhances relevant acoustic features. This robustness makes our model highly effective for handling underwater acoustic data.
Table 3 presents a comparison of the parameter counts, number of epochs, and time consumption for each step among the different models. The results clearly highlight the exceptional efficiency of the proposed model, which outperforms the other models in terms of parameter count, number of epochs required, and time consumed in each step. This further emphasizes the superiority and effectiveness of the proposed model.
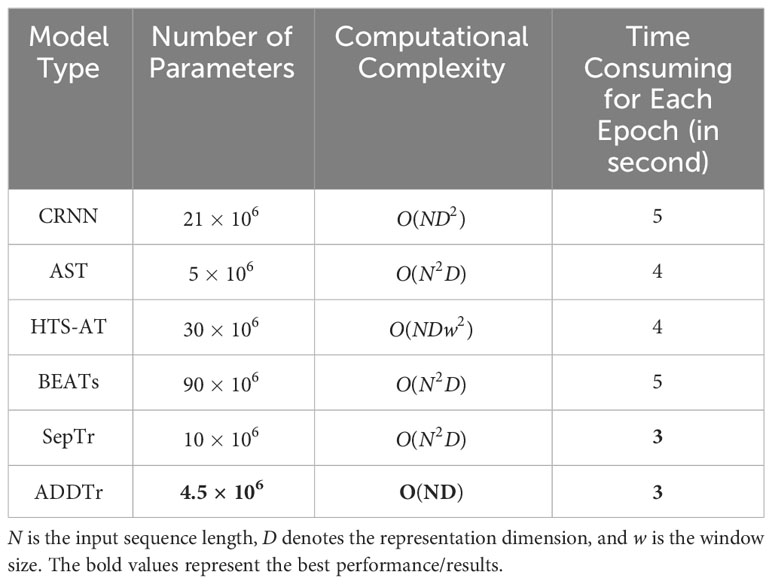
Table 3 Efficiency comparisons between several models.
4 Conclusion
This paper addresses the challenges of passive recognition of ship-radiated noise in underwater environments, characterized by inherent noise, reverberation, and time-varying acoustic channels, through the proposed ADDTr. By utilizing three-dimensional mel-spectrograms, the approach captures the temporal variations of target signals and ambient noise, enabling better distinguishability. The additional spatial dimension in the spectrograms allows for modeling reverberation effects and compensating for distortions, resulting in enhanced clarity of target signals.
The proposed ADDTr, a deep learning Transformer framework with additive attention, effectively models long-term dependencies and spatial information, allowing the model to focus on informative features and suppress noise. By incorporating the additive attention mechanism, our proposed model achieves a significant reduction in computation complexity, transitioning from quadratic complexity to linear complexity. This improvement in computational efficiency enables more efficient and scalable processing of the input data, making the approach highly practical for real-world applications. Comparative evaluations with state-of-the-art models on the ShipsEar dataset demonstrate the superior performance of the proposed approach, achieving the highest accuracy of 96.82% with lower computation costs.
Data availability statement
Publicly available datasets were analyzed in this study. This data can be found here: http://atlanttic.uvigo.es/underwaternoise/.
Author contributions
YW: Writing – original draft, Formal Analysis, Resources, Software, Visualization. HZ: Writing – review & editing, Conceptualization, Funding acquisition, Methodology. WH: Writing – review & editing, Data curation, Investigation, Validation.
Funding
The author(s) declare financial support was received for the research, authorship, and/or publication of this article. This work was financially supported by National Natural Science Foundation of China (NSFC:62271459), National Defense Science and Technology Innovation Special Zone Project: Marine Science and Technology Collaborative Innovation Center (22-05-CXZX-04-01-02), the Qingdao Postdoctoral Science Foundation (QDBSH20220202061), and the Fundamental Research Funds for the Central Universities, Ocean University of China (202313036).
Conflict of interest
The authors declare that the research was conducted in the absence of any commercial or financial relationships that could be construed as a potential conflict of interest.
Publisher’s note
All claims expressed in this article are solely those of the authors and do not necessarily represent those of their affiliated organizations, or those of the publisher, the editors and the reviewers. Any product that may be evaluated in this article, or claim that may be made by its manufacturer, is not guaranteed or endorsed by the publisher.
References
Beltagy I., Peters M. E., Cohan A. (2020). Longformer: The long-document transformer. CoRR. abs/2004.05150. https://arxiv.org/abs/2004.05150
Brown T., Mann B., Ryder N., Subbiah M., Kaplan J. D., Dhariwal P., et al. (2020). Language models are few-shot learners. CoRR 33, 1877–1901.
Chen K., Du X., Zhu B., Ma Z., Berg-Kirkpatrick T., Dubnov S. (2022). HTS-AT: A hierarchical token-semantic audio transformer for sound classification and detection. CoRR 2202, 00874. doi: 10.1109/ICASSP43922.2022.9746312
Chen S., Wu Y., Wang C., Liu S., Tompkins D., Chen Z., et al. (2022). Beats: Audio pre-training with acoustic tokenizers.
Devlin J., Chang M., Lee K., Toutanova K. (2018). BERT: pre-training of deep bidirectional transformers for language understanding. CoRR 1810, 4805. doi: 10.04805
Doan V.-S., Huynh-The T., Kim D.-S. (2020). Underwater acoustic target classification based on dense convolutional neural network. IEEE Geosci. Remote Sens. Lett. 19, 1–5. doi: 10.1109/LGRS.2020.3029584
Dosovitskiy A., Beyer L., Kolesnikov A., Weissenborn D., Zhai X., Unterthiner T., et al. (2020). An image is worth 16x16 words: Transformers for image recognition at scale. CoRR 2010, 11929.
Esmaiel H., Xie D., Qasem Z., Sun H., Qi J., J. W. A. N. G. (2021). Multi-stage feature extraction and classification for ship-radiated noise. Sensors 22, 12. doi: 10.3390/s22010112
Feng S., Zhu X. (2022). A transformer-based deep learning network for underwater acoustic target recognition. IEEE Geosci. Remote Sens. Lett. 19, 1–5. doi: 10.1109/LGRS.2022.3201396
Filho W. S., de Seixas J. M., de Moura N. N. (2011). Preprocessing passive sonar signals for neural classification. IET radar, sonar \& navigation (IET) 5, 605–612. doi: 10.1049/iet-rsn.2010.0157
Frei M. G., Osorio I. (2007). Intrinsic time-scale decomposition: time-frequency-energy analysis and real-time filtering of non-stationary signals. Proc. R. Soc. London Ser. A 463 (2078), 321–342.
Fu Y., Xu K., Mi H., Kong Q., Wang D., Wang H., et al. (2019). Multi model-based distillation for sound event detection. IEICE Trans. Inf. Syst. 102(10), 2055–2058, E102.D. doi: 10.1587/transinf.2019EDL8062
Gabor D. (1946). The Analysis of Complex Signals and Communication Systems Journal of the Institution of Electrical Engineers-Part III: Radio and Communication Engineering (IET) 93, 26, 429–457. doi: 10.1049/ji-3-2.1946.0074
Gao B., Woo W. L., Khor L. (2014). Cochleagram-based audio pattern separation using two-dimensional non-negative matrix factorization with automatic sparsity adaptation. J. Acoustical Soc. America 135 (3), 1171–1185. doi: 10.1121/1.4864294
Goldobin D. S., J. nosuke Teramae H., Nakao, G. B. E. (2010). Dynamics of limit-cycle oscillators subject to general noise. Phys. Rev. Lett. 105 (15), 154101. doi: 10.1103%2Fphysrevlett.105.154101
Gong Y., Chung Y., Glass J. R. (2021). AST: audio spectrogram transformer. CoRR 2104, 01778. doi: 10.21437/Interspeech.2021-698
Hermansky H. (1980). A perceptual linear predictive (plp) analysis of speech. J. Acoustical Soc. America (Acoustical Society of America) 87 (4), 1738-1752.
Jia H., Wang W., Mei S. (2021). Combining adaptive sparse nmf feature extraction and soft mask to optimize dnn for speech enhancement. Appl. Acoustics 171, 107666. doi: 10.1016/j.apacoust.2020.107666
Khishe M. (2022). Drw-ae: A deep recurrent-wavelet auto encoder for underwater target recognition. IEEE J. Oceanic Eng. 47 (4), 1083–1098. doi: 10.1109/JOE.2022.3180764
Li J., Yang H. (2021). The underwater acoustic target timbre perception and recognition based on the auditory inspired deep convolutional neural network. Appl. Acoustics 182, 108210. doi: 10.1016/j.apacoust.2021.108210
Li J., Yuan J., Wang H., Liu S., Guo Q., Ma Y., et al. (2021). Lungattn: advanced lung sound classification using attention mechanism with dual tqwt and triple stft spectrogram. Physiol. Measurement 42 (10), 105006. doi: 10.1088/1361-6579/ac27b9
Li P., Wu J., Wang Y., Lan Q., Xiao W. (2022). Stm: Spectrogram transformer model for underwater acoustic target recognition. J. Mar. Sci. Eng. 10 (10), 1428. doi: 10.3390/jmse10101428
Liu Z., Lin Y., Cao Y., Hu H., Wei Y., Zhang Z., et al. (2021). Swin transformer: Hierarchical vision transformer using shifted windows. CoRR 2103, 14030. doi: 10.1109/ICCV48922.2021.00986
Liu Y.-X., Yang Y., Chen Y.-H. (2017). Lung sound classification based on hilbert-huang transform features and multilayer perceptron network). 2017 Asia-Pacific Signal and Information Processing Association Annual Summit and Conference (APSIPA ASC) (IEEE) 765–768.
Lurton X. (2010) An introduction to underwater acoustics: Principles and applications. Available at: https://api.semanticscholar.org/CorpusID:109354879.
Mallat S. (1989). A theory for multiresolution signal decomposition: the wavelet representation. IEEE Trans. Pattern Anal. Mach. Intell. 11 (7), 674–693. doi: 10.1109/34.192463
Monaco A., Amoroso N., Bellantuono L., Pantaleo E., Tangaro S., Bellotti R. (2020). Multi-time-scale features for accurate respiratory sound classification. Appl. Sci. 10 (23), 8606. doi: 10.3390/app10238606
Purwins H., Li B., Virtanen T., Schlüter J., Chang S.-Y., Sainath T. (2019). Deep learning for audio signal processing. IEEE Journal of Selected Topics in Signal Processing (IEEE) 13, 2, 206–219. doi: 10.1109/JSTSP.2019.2908700
Ristea N.-C., Ionescu R. T., Khan F. S. (2022). Septr: Separable transformer for audio spectrogram processing.
Salomons E. L., Havinga P. J. (2015). A survey on the feasibility of sound classification on wireless sensor node. Sensors 15 (4), 7462–7498. doi: 10.3390/s150407462
Santos-Domínguez D., Torres-Guijarro S., Cardenal-López A., Pena-Gimenez A. (2016). Shipsear: An underwater vessel noise database. Appl. Acoustics 113, 64–69. doi: 10.1016/j.apacoust.2016.06.008
Selesnick I. (2011). Resonance-based signal decomposition: A new sparsity-enabled signal analysis method. Signal Process. 91 (12), 2793–2809. doi: 10.1016/j.sigpro.2010.10.018
Shen S., Yang H., Li J., Xu G., Sheng M. (2018). Auditory inspired convolutional neural networks for ship type classification with raw hydrophone data. Entropy 20 (12), 990. doi: 10.3390/e20120990
Song Y., Liur F., Shen T. (2022). Method of underwater acoustic signal denoising based on dual-path transformer network. IEEE Access. doi: 10.1109/ACCESS.2022.3224752
Su Y., Zhang K., Wang J., Zhou D., Madani K. (2020). Performance analysis of multiple aggregated acoustic features for environment sound classification. Appl. Acoustics 158, 107050. doi: 10.1016/j.apacoust.2019.107050
Tay Y., Bahri D., Metzler D., Juan D.-C., Zhao Z., Zheng C. (2021). Synthesizer: Rethinking self-attention in transformer models.
Tong Y., Zhang X., Ge Y. (2020). Classification and recognition of underwater target based on mfcc feature extraction. 2020 IEEE International Conference on Signal Processing, Communications and Computing (ICSPCC) (IEEE), 1–4.
Tuncer T., Akbal E., Dogan S. (2021). Multileveled ternary pattern and iterative relieff based bird sound classification. Appl. Acoustics 176, 107866. doi: 10.1016/j.apacoust.2020.107866
Vaswani A., Shazeer N., Parmar N., Uszkoreit J., Jones L., Gomez A. N., et al. (2017). Attention is all you need. CoRR 1706, 03762.
Virtanen T., Cemgil A. T. (2009). , Mixtures of gamma priors for non-negative matrix factorization based speech separation. Independent Component Analysis and Signal Separation: 8th International Conference, ICA 2009, Paraty, Brazil, March 15-18, 2009. Proceedings 8 (Springer), 646–653.
Wang J., Chen Z. (2019). Feature extraction of ship-radiated noise based on intrinsic time-scale decomposition and a statistical complexity measure. Entropy 21 (11), 1079. doi: 10.3390/e21111079
Wang S., Li B. Z., Khabsa M., Fang H., Ma H. (2020). Linformer: Self-attention with linear complexity.
Wu C., Wu F., Qi T., Huang Y. (2021). Hi-transformer: Hierarchical interactive transformer for efficient and effective long document modeling. CoRR. abs/2106.01040. doi: 10.18653/v1/2021.acl-short.107
Yan J., Sun H., Chen H., Junejo N., Cheng E. (2018). Resonance-based time-frequency manifold for feature extraction of ship-radiated noise. Sensors 18, 936. doi: 10.3390/s18040936
Yang H., Gan A., Chen H., Pan Y., Tang J., Li J. (2016). Underwater acoustic target recognition using svm ensemble via weighted sample and feature selection. 2016 13th International Bhurban Conference on Applied Sciences and Technology (IBCAST) (IEEE), 522–527.
Yang H., Li J., Shen S., Xu G. (2019). A deep convolutional neural network inspired by auditory perception for underwater acoustic target recognition. Sensors (MDPI) 19 (5), 1104. doi: 10.3390/s19051104
Yang C.-H., Wu C.-H., Hsieh C.-M. (2020). Long short-term memory recurrent neural network for tidal level forecasting. IEEE Access 1–1, 08. doi: 10.1109/ACCESS.2020.3017089
Yu L., Ma N., Gu X. (2016). Early detection of parametric roll by application of the incremental real-time hilbert–huang transform. Ocean Eng. 113, 224–236. doi: 10.1016/j.oceaneng.2015.12.050
Zaheer M., Guruganesh G., Dubey K. A., Ainslie J., Alberti C., Ontanon S., et al. (2020). Big bird: Transformers for longer sequences. Advances in neural information processing systems 33, 17283–17297.
Zeng X., Wang S. (2014). Underwater sound classification based on gammatone filter bank and hilbert-huang transform. 2014 IEEE International Conference on Signal Processing, Communications and Computing (ICSPCC) (IEEE), 707–710.
Zhang H., Junejo N. U. R., Sun W., Chen H., Yan J. (2020). Adaptive variational mode time-frequency analysis of ship radiated noise. 2020 7th international conference on information science and control engineering (ICISCE) (IEEE) 1652–1656.
Keywords: underwater acoustic target recognition, deep learning, additive attention based transformer, 3D mel-spectrogram, ship radiated noise
Citation: Wang Y, Zhang H and Huang W (2023) Fast ship radiated noise recognition using three-dimensional mel-spectrograms with an additive attention based transformer. Front. Mar. Sci. 10:1280708. doi: 10.3389/fmars.2023.1280708
Received: 21 August 2023; Accepted: 06 November 2023;
Published: 24 November 2023.
Edited by:
Haixin Sun, Xiamen University, ChinaReviewed by:
Naveed Ur Rehman Junejo, University of Lahore, PakistanZeyad Qasem, Peking University, China
Copyright © 2023 Wang, Zhang and Huang. This is an open-access article distributed under the terms of the Creative Commons Attribution License (CC BY). The use, distribution or reproduction in other forums is permitted, provided the original author(s) and the copyright owner(s) are credited and that the original publication in this journal is cited, in accordance with accepted academic practice. No use, distribution or reproduction is permitted which does not comply with these terms.
*Correspondence: Hao Zhang, emhhbmdoYW9Ab3VjLmVkdS5jbg==; Wei Huang, aHdAb3VjLmVkdS5jbg==