 Yuhang Wang
 Xifei Wang2
 Demin Zhou
 Yinghai Ke
94% of researchers rate our articles as excellent or good
Learn more about the work of our research integrity team to safeguard the quality of each article we publish.
Find out more
ORIGINAL RESEARCH article
Front. Mar. Sci., 29 November 2023
Sec. Marine Ecosystem Ecology
Volume 10 - 2023 | https://doi.org/10.3389/fmars.2023.1280373
This article is part of the Research TopicDegradation, Ecological Restoration and Adaptive Management of Estuarine Wetlands under Intensifying Global Changes, volume IIView all 11 articles
As one of the most productive marine ecosystems in the coastal wetlands, mangrove forests have been severely threatened by intensive human activities. Many countries and regions have carried out mangrove restoration projects. The evaluation of mangrove restoration effectiveness is of great significance for scientific decision-making for restoration engineering and wetland management. In this study, we presented a remote-sensing-based Mangrove Restoration Effectiveness Index (MREI) to evaluate mangrove restoration effectiveness. We took the Guangxi Shankou Mangrove National Natural Reserve (GSMNNR) in China, a UNESCO Biosphere Reserve, as our study area, where four phases of afforestation were implemented during 1990-2022. The MREI was developed based on Landsat-series images by considering the change in mangrove area and the Normalized Difference Vegetation Index (NDVI) from the start year to the end year of each afforestation phase (evaluation period). We further evaluated the Persistence of Restoration Effectiveness (PRE) based on the MREI change trajectory during the whole evaluation period, and the Process-based Restoration Effectiveness Index (PREI) was developed to evaluate the restoration effectiveness at village scale. The results showed that MREI can effectively represent the trajectory of mangrove restoration and showed consistent pattern with high-spatial-resolution imagery. From 1990 to 2022, the mangrove forest area increased from 235.26 ha in 1990 to 873.27 ha in 2022, and 84.59% of the mangrove forest was converted from tidal flats in the reserve. The average value of MREI in the five evaluation phases were 0.48, 0.24, 0.29, 0.17, and 0.72, respectively. The dynamic change of MREI showed that 5.24% of the zones had poor PRE, 44.17% of the zones had excellent PRE. From the perspective of spatial distribution, the Zones with PREI values ranging from high to low were follows: Zone A, E, J, G, C, H, I (D), F, B. Overall, the high value zones of PREI were mainly distributed in the central of the Dandou Sea and the northern part of the Yingluo Bay. The low value zones were distributed in the northwest of the Dandou Sea. We expect the MREI and PREI have great potential to be applied to other regions to evaluate mangrove restoration effectiveness.
Mangroves have significant social, economic, and ecological values and play an important role in maintaining coastal ecological stability, reducing coastal erosion, and mitigating global warming (Carugati et al., 2018; Worthington et al., 2020). In the 1980s, mangroves were disappearing at about 1% per year, making them one of the most threatened ecosystems in the world (Friess et al., 2019). According to this trend, the global mangrove forests will disappear within 100 years (Duke et al., 2007; Polidoro et al., 2010). After the 21st century, many countries began to pay attention to mangrove restoration and management. The research on the mangrove wetlands restoration mainly focuses on four aspects: 1) selection of suitable afforestation site; 2) selection of tree species; 3) planting techniques; 4) management and monitoring after planting (Peng et al., 2008). With the recognition of the importance of mangroves and the implementation of mangrove restoration projects, the mangrove loss rate gradually slowed down compared to the previous period (Hamilton and Casey, 2016).
Although mangrove restoration strategies include natural and artificial restoration, most restoration focuses on direct mangrove planting (Kamali and Hashim, 2011). In 1988, China proposed the National Coastal Shelterbelt System Construction Project (NCSSCP), and mangrove planting and restoration is one of the important contents. The NCSSCP Phase I Plan (1990-2000) was implemented in 1990. In 2001, the State Forestry Administration launched the NCSSCP Phase II Plan (2001-2010). Subsequently, in order to further expand the scope of construction, the second phase planning period was extended to 2015. The NCSSCP Phase III Plan (2016-2015) was officially launched in 2016, and it is planned to restore 48,650 ha of mangrove by 2025 (Bao and Yang, 2022). Moreover, a number of mangrove nature reserves have been set up since the 1980s in China. At present, 38 mangrove reserves have been established, which cover more than 75% of the existing natural mangroves (Lu et al., 2022). Due to China’s strict protection and large-scale planting restoration of mangrove forests, the mangrove area has grown at an average annual rate of 1.8% since 2001 (Wang et al., 2020; Jia et al., 2021; Huang et al., 2023). The restoration effectiveness of mangroves is often influenced by many factors, including natural factors like soil salinity, water level, and biological invasions, as well as human-related factors like afforestation technology, tree species selection, and post-planting management (Primavera and Esteban, 2008; Wodehouse and Rayment, 2019). However, in some regions the survival and preservation rates of mangrove cultivation are low, posing challenges for mangrove restoration. For example, the preservation rate of afforestation in Fangchenggang City, Guangxi, was only 9.28% from 2002 to 2007 (Fan and Mo, 2018). The mangrove planting cases in the Philippines from 1984 to 1995 showed that the survival rate of directly planting mangroves was less than 20% due to mismatched tree species and planting locations, as well as a lack of post planting management (Primavera and Esteban, 2008). Therefore, some regions have explored community-based mangrove restoration schemes that do not directly plant mangroves. For example, a study in the Mekong Delta shows that if local shrimp farmers are given sufficient economic incentives and legal rights, and assigned responsibility for mangroves, they can participate in the protection and sustainable management of mangroves (Ha et al., 2012). Ayeyarwady Delta in Myanmar planted mangroves under the framework of community-based integrated coastal zone management (ICZM), with a survival rate of over 60% (Veettil et al., 2018). It is important to conduct quantitative evaluations of the mangrove restoration effectiveness in order to guide the government in inspecting the results of restoration projects, adjusting subsequent restoration locations, and improving restoration techniques.
In order to evaluate the success of mangrove ecosystem restoration, indicators such as biodiversity, mangrove area, vegetation growth, and carbon sequestration can be used to characterize the recovery trajectory of mangrove growth over time. Traditional biodiversity monitoring methods such as transect and plot can be used to acquire these indices (Cadier et al., 2020; Gatt et al., 2022; Gerona-Daga and Salmo, 2022). These monitoring methods can finely evaluate the mangrove restoration effectiveness, however, the field measurement is difficult to carry out large-scale monitoring and reveal spatial heterogeneity. Remote sensing technology has the potential to obtain historical images of inaccessible areas, which has been widely used for large-scale and long-term mangrove monitoring efforts (Seto and Fragkias, 2007; Wang et al., 2019). At present, there are many publicly available mangrove mapping datasets which were generated using remote sensing techniques. These datasets include global or regional mangrove maps with spatial resolution of 30 m or 10 m, such as Global Mangrove Watch (Bunting et al., 2022), Global Mangrove Distribution USGS (Giri et al., 2011), LERIS_GLOBAL_MANGROVE (Xiao et al., 2021), Tidal Wetlands in East Asia (Zhang Z. et al., 2022), Mangrove Map of China for 2019 (Zhao and Qin, 2022), CAS_Mangrove (Jia et al., 2018), etc. In addition to global mangrove datasets, many studies carried out mangrove monitoring using land cover classification at regional scale (Gevana et al., 2015). Although global datasets provide necessary baseline mangrove maps in a single year or multiple years, they did not provide other land cover types nearby the mangroves. Therefore, they did not support the analysis of conversion between mangroves and other land cover types. In addition, none of the datasets cover the entire phases of NCSSCP. It is necessary to classify mangroves and other land cover according to specific objectives.
Most studies used dynamic changes in land cover and landscape indices to reveal the effectiveness of mangrove restoration and protection. The commonly used landscape indices include patch area, patch density, boundary density, aggregation, etc., (Suyadi et al., 2018; Zhen, 2019; Du et al., 2023). Some researchers combined multiple landscape indices to build a composite index for evaluation of mangrove restoration effectiveness (Liu et al., 2022). Most of these indices are calculated based on the mangrove distribution maps. Note that the recovery of mangrove ecosystems is characterized by the increase of mangrove area and canopy density, which can be represented by the change in remote sensing spectral indexes, such as Normalized Difference Vegetation Index (NDVI). Zhu et al. (2021) used the method of time series analysis using mangrove NDVI and combined it with land cover data to study the changes in mangrove growth in Qinglan Port, China (Zhu et al., 2021). However, at present, few studies have integrated the mangrove area and the vegetation index to evaluate the restoration effectiveness (Wang et al., 2018; Gilani et al., 2021).
The Guangxi Shankou Mangrove National Natural Reserve (GSMNNR), located in Beihai City, Guangxi, was established in 1990 and is recognized as a UNESCO Biosphere Reserve. The NCSSCP project can be divided into four mangrove afforestation phases in GSMNNR: NCSSCP Phase I during 1990-2000 (Phase 1), the first half of NCSSCP Phase II during 2000-2008 (Phase 2), the second half of NCSSCP Phase II during 2008-2015 (Phase 3), NCSSCP Phase III during 2015-2022 (Phase 4). In this study, we aimed to present remote-sensing-based indices to evaluate the mangrove restoration effectiveness and the Persistence of Restoration Effectiveness (PRE). We took GSMNNR as our study area, and analyzed the conversion between mangroves and other land cover types during the NCSSCP project phases based on remote sensing classification results. Then, we developed Mangrove Restoration Effectiveness Index (MREI) to evaluate the effectiveness of mangrove restoration during each evaluation period by taking account of both mangrove area change and the change in NDVI. Based on the change trajectory of MREI, further developed a Process-based Restoration Effectiveness Index (PREI) to evaluate the persistence of the restoration effectiveness during the whole evaluation period. Note that “restoration” here indicates recovery of mangrove vegetation, and the restoration of the entire ecosystem function was not involved. The objectives of the study are to 1) propose a novel framework for evaluating the effectiveness of mangrove restoration and verify its feasibility; 2) take GSMNNR as a case study, explore the mangrove restoration effectiveness under the background of NCSSCP; 3) propose some suggestions for mangrove restoration.
The GSMNNR(109°37′22″E~109°47′03″E, 21°28′21″N~21°36′59″N) is located on the Shatian peninsula, adjacent to the southern boundary of the Beibu Gulf (Figure 1). It includes Yingluo Bay as its eastern part and the Dandou Sea as its western part, covering an area of 800 km2. The reserve joined the Chinese Man and the Biosphere (MAB) in 1993, joined the UNESCO World Network of Man and the Biosphere Reserves in January 2000, and was listed as a wetland of international importance in February 2002. Most of the mudflats in the reserve are submerged by water during the high tide period, and all of them are exposed when the tide ebbs. The soil is muddy saline-alkali, which is severely eroded by waves, tides, and erosion, resulting in severe collapse of the coastal edges. In the low tidal mudflat zone, pioneer tree species such as Avicennia marina, Aegiceras corniculatum, and Sonneratia caseolaris are planted; In the middle tidal beach area, species such as Acanthus ilicifolius, Bruguiera gymnorrhiza, Ceriops tagal, Kandelia obovate, and Rhizophora stylosa are planted; The high tide zone is mainly composed of semi-mangroves, such as Excoecaria agallocha, Lumnitzera littorea, Hibiscus tiliaceus, etc. The afforestation density of general tree species is about 120 plants per hectare, while the afforestation density of caseolaris and apetala is about 30 plants per hectare. Spartina alterniflora is a salt marsh plant native to the west coast of north America and was introduced in China in 1979 (Min et al., 2023). S. alterniflora spread from 167.0 ha in 2003 to 413.0 ha in 2015 due to its strong ability to adapt and reproduce, posing a threat to native mangrove species and biodiversity (Liu, 2018; Li et al., 2021). According to the boundaries of Beihai’s administrative villages and the Google Earth images, the reserve was divided into ten zones.

Figure 1 Location of the study area. A: Najiang village, B: Najiao village, C: Natan village, D: Dandou village, E: Herong village, F: Shawei village, G: Yongan village, H: Gaopo village, I: Beijie village, J: Yingluo village.
Landsat 5 Thematic Mapper (TM) and Landsat 8 Operational Land Imager (OLI) images with a spatial resolution of 30m in 1990, 2000, 2008, 2015, and 2022 were obtained from Google Earth Engine (GEE), according to the timeline of NCSSCP (Supplementary, Table A). These images are used to acquire land use data in the reserve. Because mangroves are periodically inundated by tides and during the growing season, S. alterniflora has similar spectral characteristics to mangroves. In order to improve interpretation accuracy, all images were screened and the optimal images were downloaded annually for classification. The optimal images are considered to be those of low tide and non-growing seasons. (Xu et al., 2021). In addition, all available Landsat 5 TM and Landsat 8 OLI images in five years were obtained, respectively. After cloud removal, the maximum synthesis method was used to generate the annual maximum NDVI () images in the corresponding years. The image filtering and pre-processing processes were based on GEE.
Mangroves, S. alterniflora, and aquaculture ponds are typical wetland types in the study area, and their accurate mapping is an important part of mangrove wetland research. Scholars have published corresponding mapping products. We downloaded public mapping data of mangroves, S. alterniflora, and aquaculture ponds from the corresponding years close to our research period for accuracy verification. Data products with a resolution of 30 m were selected. The datasets include the mangrove dataset for 1990, 2000, 2010, and 2015; the S. alterniflora dataset for 2000, 2010, and 2015; and the aquaculture pond dataset for 1990, 2000, 2010, 2015, and 2020. These datasets were downloaded from the National Science and Technology Infrastructure Platform - National Earth System Science Data Center.
PlanetScope (PS) images are available in spectral bands: blue (455-515 nm), green (500-590 nm), red (590-670 nm), and near-infrared (NIR, 780-860 nm), with a spatial resolution of 3 m (Roy et al., 2021). In order to facilitate the accuracy validation, we downloaded two cloud-free, atmospherically corrected surface reflectance products (level-3B) for 2016 and 2022 through the education and research program of Planet Labs PBC (Planet Team, 2022).
The Landsat-series images were pre-processed and the land cover types in 1990, 2000, 2008, 2015 and 2022 were classified, at the same time, the maximum NDVI during each year was calculated to represent the growing condition of mangroves. Then, mangrove changes were divided into four categories, and the area of each class was estimated using a stratified random sampling method (section 2.3.1). Next, MREI was developed by taking account of both mangrove area change and NDVI change from the start year and the end year of a period (section 2.3.2). As MREI only evaluated the restoration effectiveness during a single period, we further developed a Process-based Restoration Effectiveness Index (PREI) based on the trajectory of MREI change to evaluate the persistence of the restoration effectiveness during the whole evaluation period (from 1990 to 2022) (section 2.3.3). We analyzed the spatial pattern of MREI and PREI at two different scales: grid and village. Section 3.1 describes the classification map of land cover and the dynamic changes between different land covers; Section 3.2 describes the distribution and changes of MREI in a single period; Section 3.3 shows the accuracy of MREI indication effect; Section 3.4 shows the dynamic changes of MREI over multiple periods. (Supplementary, Figure S1).
In order to extract mangrove extents, spectral indices including Mangrove Vegetation Index (MVI), NDVI, Normalized Difference Built-up Index (NDBI), and Modified Normalized Difference Water Index (mNDWI) were calculated using the following functions (Table 1). is the reflectance of the near-infrared band, is the reflectance of the red band, is the reflectance of the green band, and is the reflectance of a short-wave infrared band in Landsat 5 TM and Landsat 8 OLI images.
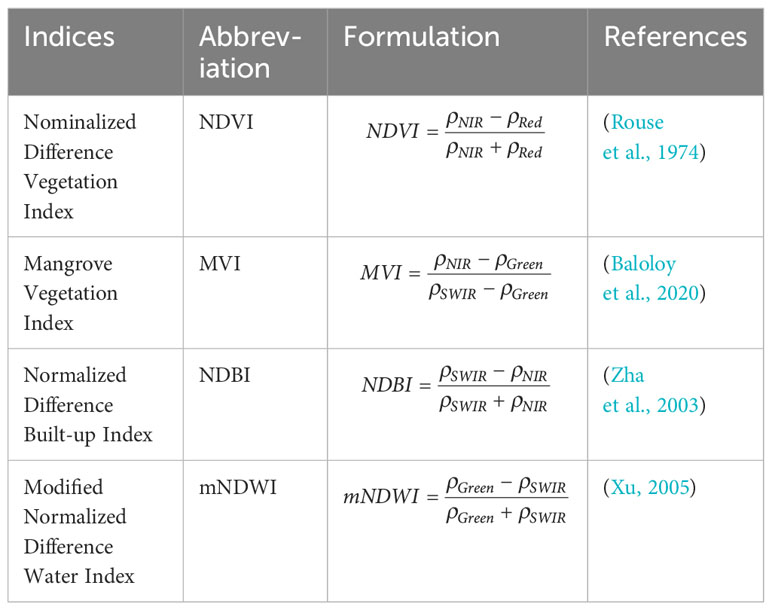
Table 1 Spectral indices used in this study.
Then, the Support Vector Machine (SVM) supervised classification method was used to classify the images from 1990, 2000, 2008, 2015, and 2022 into eight land covers, including mangrove forest, tidal flat, S. alterniflora, water body, woodland, aquaculture pond, built-up land, and grassland. Around 5,000 samples were collected from Google Earth and PlanetScope images between 1990 and 2022, with around 1,000 samples collected each year within the study area. Overall Accuracy (OA), User’s Accuracy (UA), Producer’s Accuracy (PA), and F1 Score (F1) were used to evaluate the classification accuracy of mangroves and other land use types. The F1 combines precision and recall into a single value, providing a balanced measure of accuracy. The accuracy evaluation metrics were calculated using the following functions:
where is the total number of samples, represents the number of samples where both the data to be evaluated and the reference data are classified as class , is the sum of samples classified as class in the reference data, is the sum of samples classified as class in the evaluated data (map data).To further evaluate our resultant map’s reliability, we verified the mangrove, S. alterniflora, and aquaculture pond areas by comparing them to the results from other datasets.
The area of conversion between land cover is usually obtained from remote sensing data. However, the mapping results of remote sensing are rarely perfect, and any map made from remote sensing data may contain some errors. Therefore, there may also be deviations in the area of change calculated based on the mapping results (such as the number of pixels). We adopted the method by Olofsson et al. (2014) to estimate the area change of mangroves, which utilized stratified sampling and error matrices for change area estimation. In this study, we categorized the mangrove change into four classes: stable mangrove, stable non-mangrove, mangrove gain, mangrove loss. The confidence interval for area of change estimation is 95%.
The restoration of mangroves was reflected by area gain, and the improvement of growth status, e.g., the increase in biomass, density of leaves or canopy cover, which can be represented by NDVI. The MREI was developed on a grid basis and considered both factors. First, the study area was divided into grid cells with size of 150 x 150 m (the area =22,500 m2). Then, five evaluation periods were established based on the NCSSCP and the time of the establishment of GSMNNR: 1990-2000 (afforestation phase 1), 2000-2008 (afforestation phase 2), 2008-2015 (afforestation phase 3), 2015-2022 (afforestation phase 4), and 1990-2022 (GSMNNR established - 2022, phase 5). For a certain evaluation period, the change in the mangrove area () within each grid cell was calculated and expressed as . Significant increase in the mangrove area indicated that mangrove has been well restored. However, classification errors are inherent in the remote-sensing-based mangrove maps. Therefore, we considered that should be no less than a tolerance threshold and was defined as the criterion to determine whether there has been any change in the mangrove area. The calculation of is listed in Eq. 5, which adjusts for the classification error.
where represents the average user accuracy of mangrove classification for the five evaluation phases, which was 0.93 in this study. is the area of the grid determined, which is 22,500 m2 in this study, is the minimum area of the mangrove patch, which was 900 m2 in this study.
For the grid cells with , we considered that the mangrove area has not experienced significant increase, and the change in canopy cover should be accounted for. We calculated the average () within the grid cell in the start year and end year, respectively, and the difference in the () was used to represent the change of the canopy cover. Based on changes in mangrove area and vegetation cover (expressed as ), the mangrove restoration effectiveness was categorized into four groups and linked to the four intervals of MREI values (Table 2). The MREI formula is built as follows:

Table 2 Four categories characterizing mangrove growth conditions modeled by MREI.
where operator rescaled the variable to the range of . The maximum and minimum values of in all grids in the five evaluation phases were expressed as , , and the maximum and minimum values of were expressed as , , respectively. Therefore, the four categories of MREI value range represents the four types of restoration effectiveness (Table 2), and the values of MREI represent the degree of restoration effectiveness.
MREI can be used to evaluate the mangrove recovery during a single period. In order to evaluate the Persistence of the Restoration Effectiveness (PRE) during the whole study period (from 1990 to 2022), we defined the four categories of the MREI change trajectory (Table 3). A grid with positive MREI during all the four evaluation periods is considered to have excellent PRE, while a grid with MREI< -0.5 during at least two periods is considered to have poor PRE.
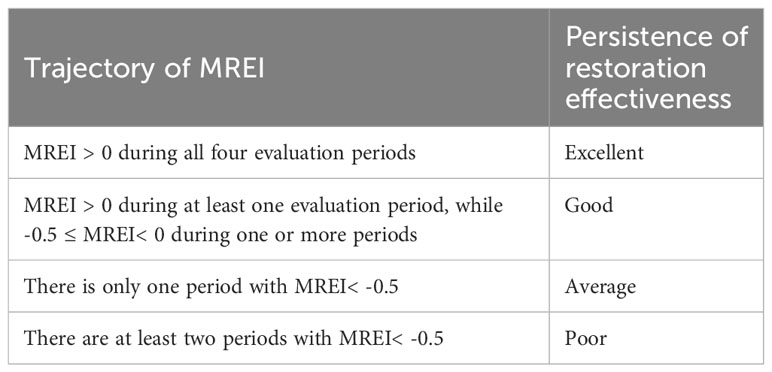
Table 3 Four classes for classifying PRE based on MREI trajectory.
The PRE category represents the process of restoration effectiveness during the whole period at grid scale. We further developed a Process-based Restoration Effectiveness Index (PREI) at village scale (Eq. 7-8).
where VMREI represents the restoration effectiveness of multiple afforestation phases at a village, , , , represent the number of grids with excellent, good, average, and poor PRE, respectively within the village, represents the total number of grids in which restoration activities have taken place in the village, PREI is the result of the normalization of the VMREI of all the villages, and the larger the value of PREI, the better restoration effectiveness persistence in the village.
The land cover classification accuracies of GSMNNR in 1990, 2000, 2008, 2015, and 2022 are shown in Table 4. The OA of the corresponding years was 0.92, 0.95, 0.95, 0.92 and 0.94, respectively. The PA values of mangrove ranged from 0.78 to 0.95, and the UA values ranged from 0.91 to 0.98. The average F1 score of mangrove forests exceeded 0.92.
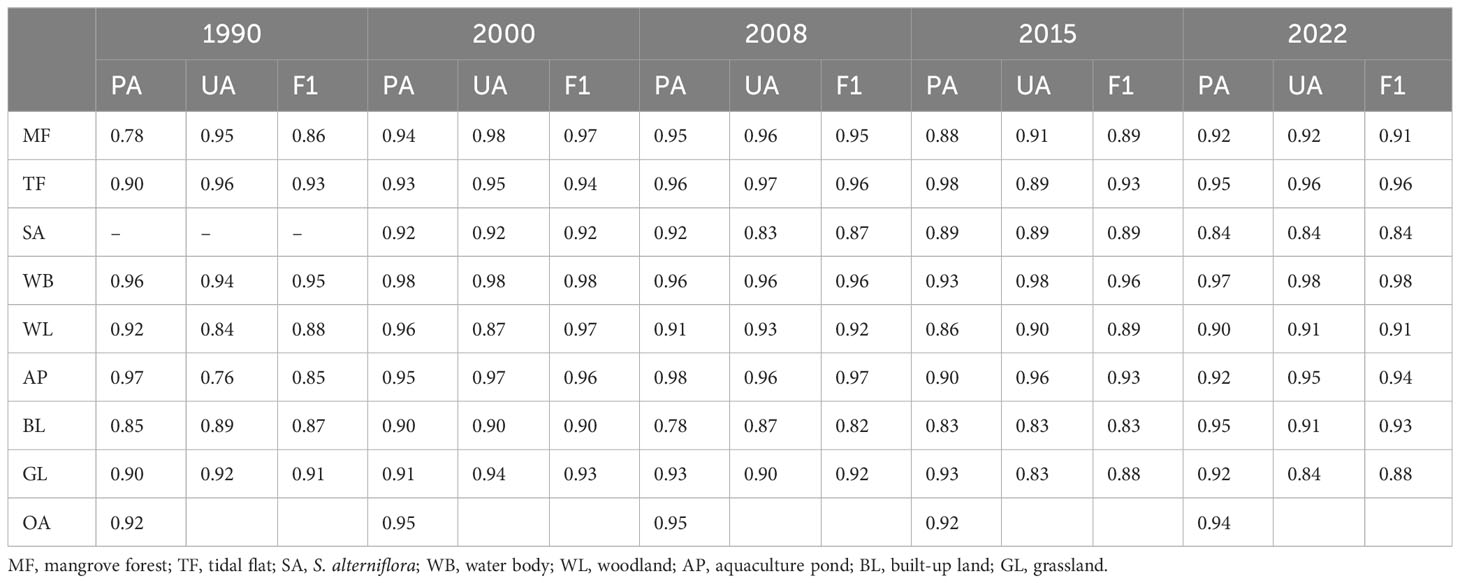
Table 4 Producer’s accuracy (PA), user’s accuracy (UA) and F1-score of land cover classes.
To further assess the accuracy of our resultant map, we compared the area of mangrove forests, aquaculture ponds, and S. alterniflora between our data with the publicly available data. We replaced the missing year data with the data set closest to the corresponding study period. Specifically, the aquaculture pond data from 2008 and 2022 were replaced with data from 2010 and 2020, respectively. The mangrove data in 2008 was replaced with the data from 2010. The results showed that, except for differences between the aquaculture pond data we classified in 2008 and 2022 and the publicly available data, there were no significant differences between the other land cover data we classified for other years and the publicly available data (Figure 2). After further examination, the reasons for the difference include: firstly, the publicly available data did not entirely match the years of our data. Secondly, in the publicly available data of 2022, the classification standard of aquaculture ponds was different from the classification standard in general studies.
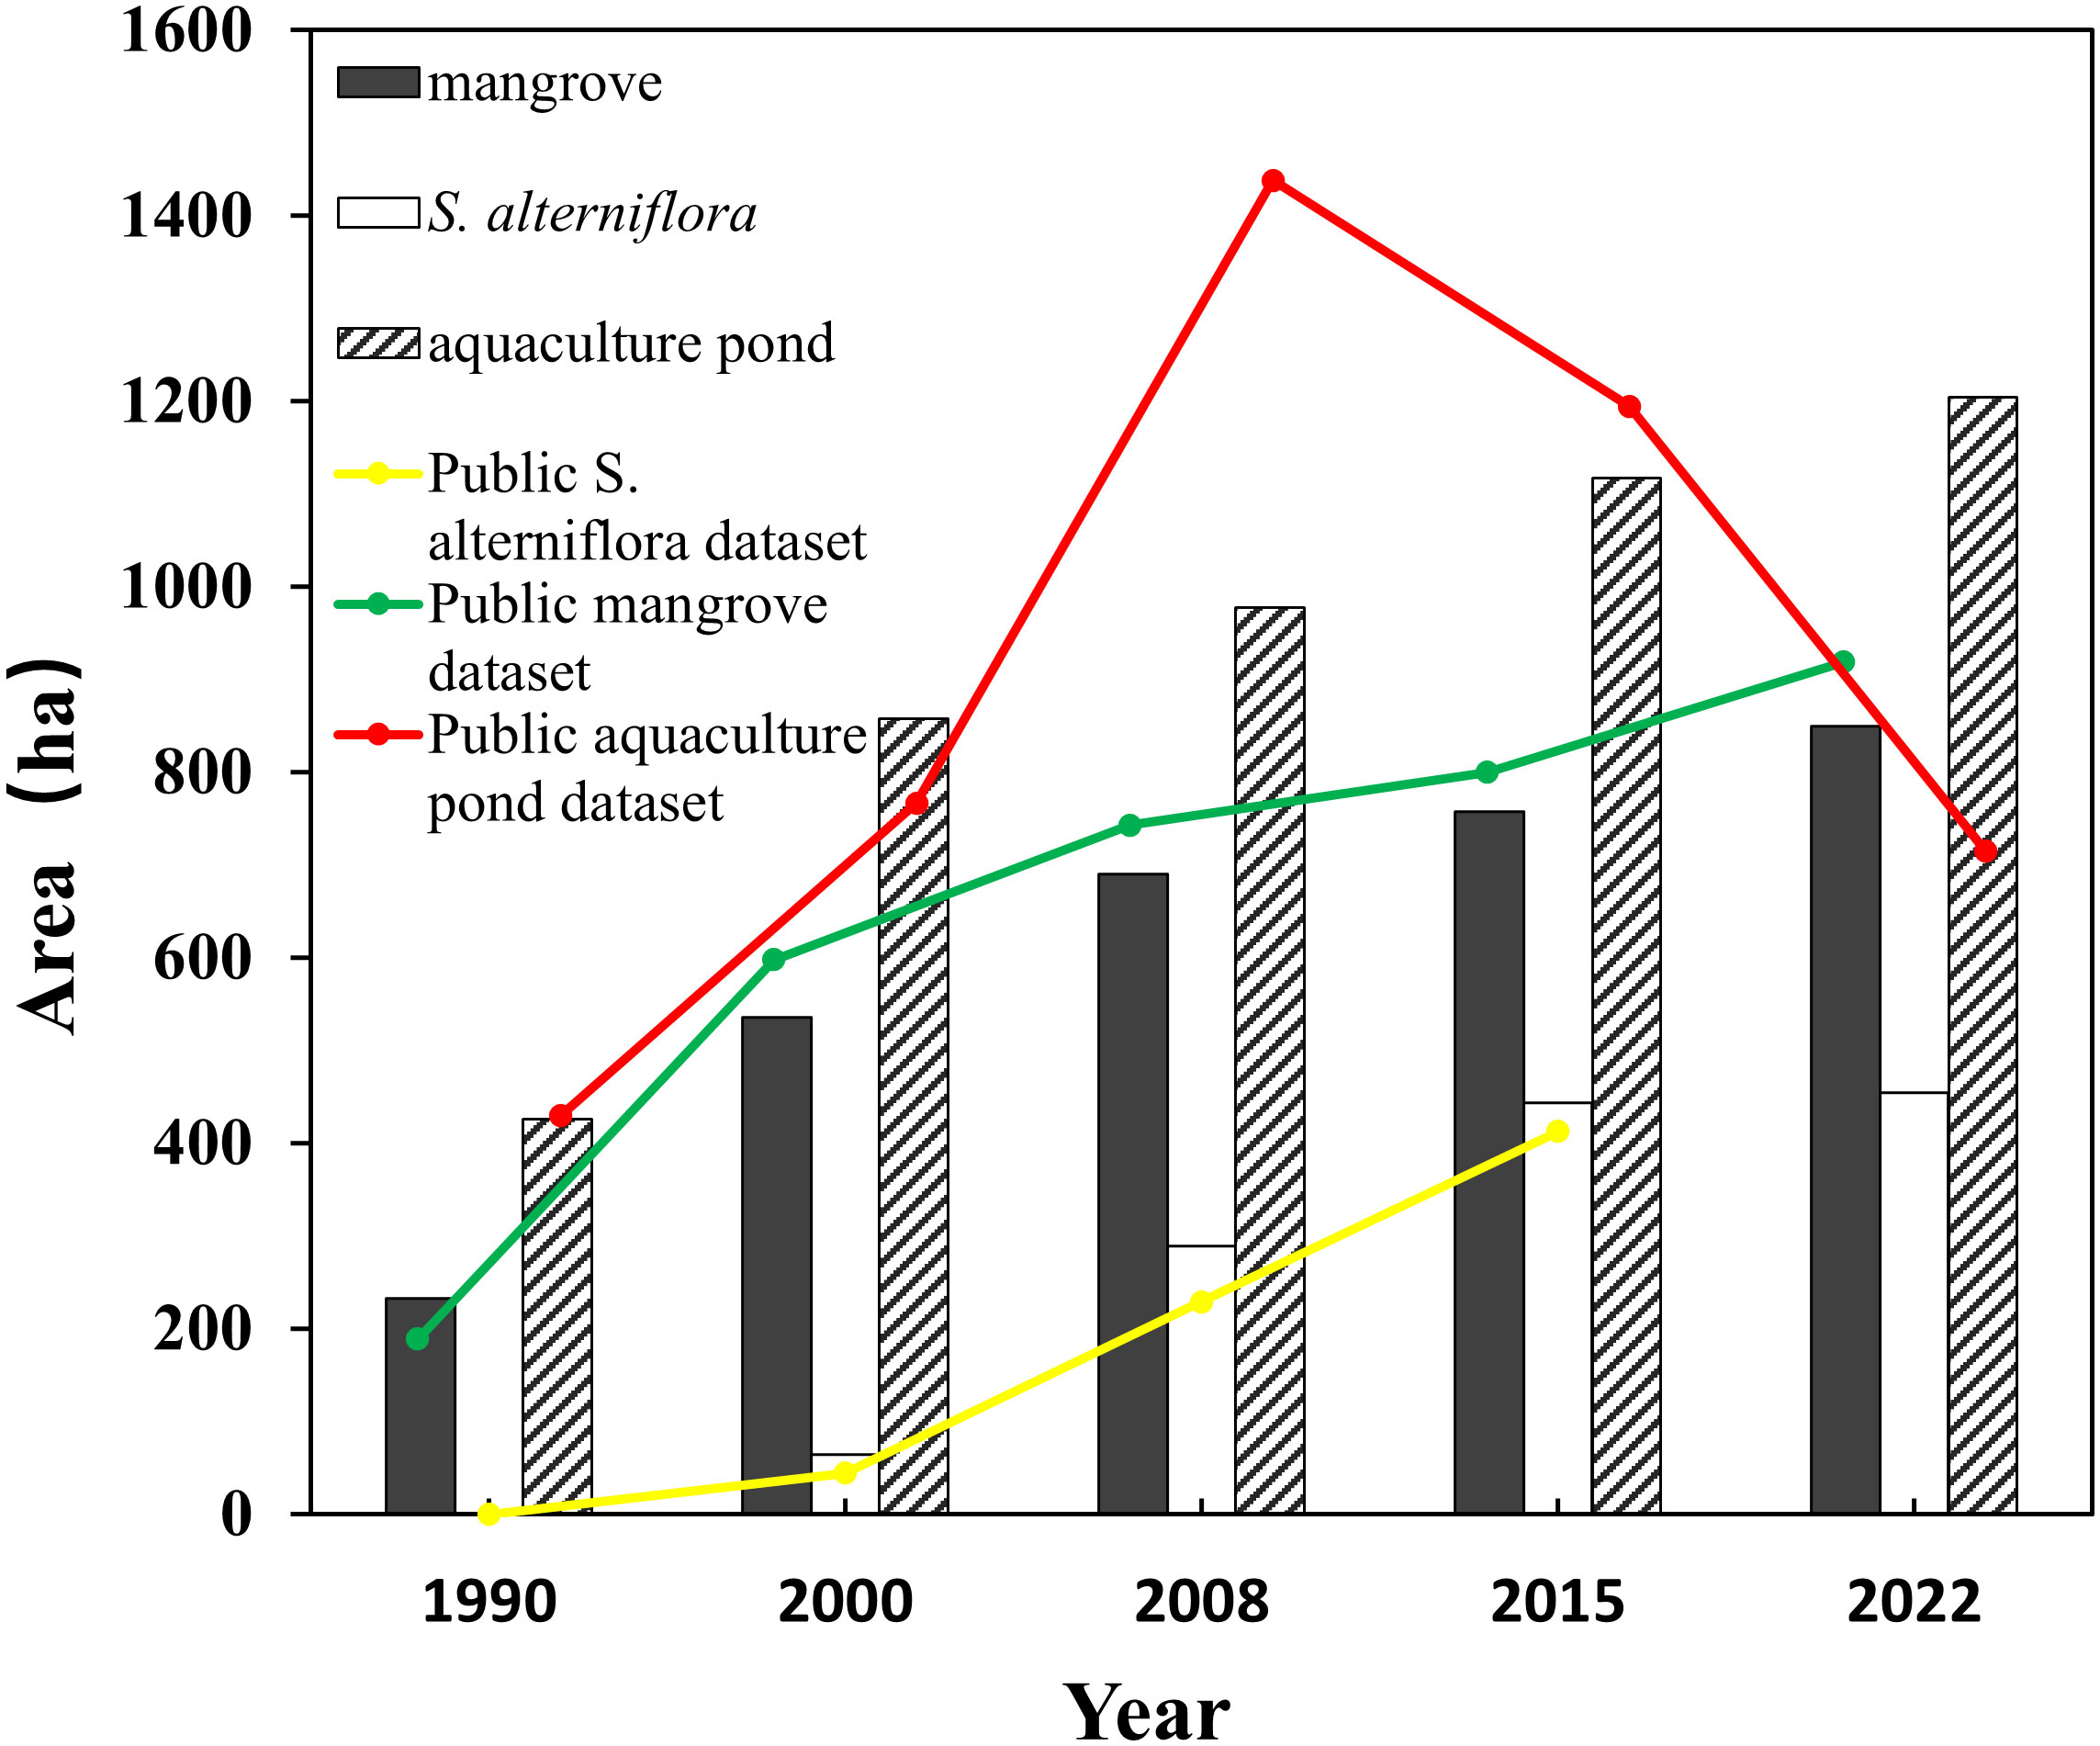
Figure 2 Comparison of our resultant map with the publicly available data.
The distribution of land use types in the study area from 1990 to 2022 is shown in Figure 3A. In 1990, large areas of tidal flats were distributed in the Dandou Sea except for Zone G. In 2000, most of the exposed tidal flats were covered by mangroves. After 2008, the expansion of mangrove forests mainly occurred in the tidal flat around the aquaculture ponds in Zone B and the coastal tidal flat in Zone I. Compared with the period before 2008, the expansion trend is not obvious. In 2000, S. alterniflora appeared in Zone D and Zone G. S. alterniflora spread in the Dandou Sea in 2008 and gradually threatened the mangroves in Zone C. Table 5 shows the area of mangroves and other land cover types in the study area from 1990 to 2022. From 1990 to 2022, the area of mangroves increased from 235.26 ha to 873.27 ha. From 1990 to 2008, the growth rate of the mangrove area was 198.85%, and from 2008 to 2022, the growth rate decreased to 24.2%.
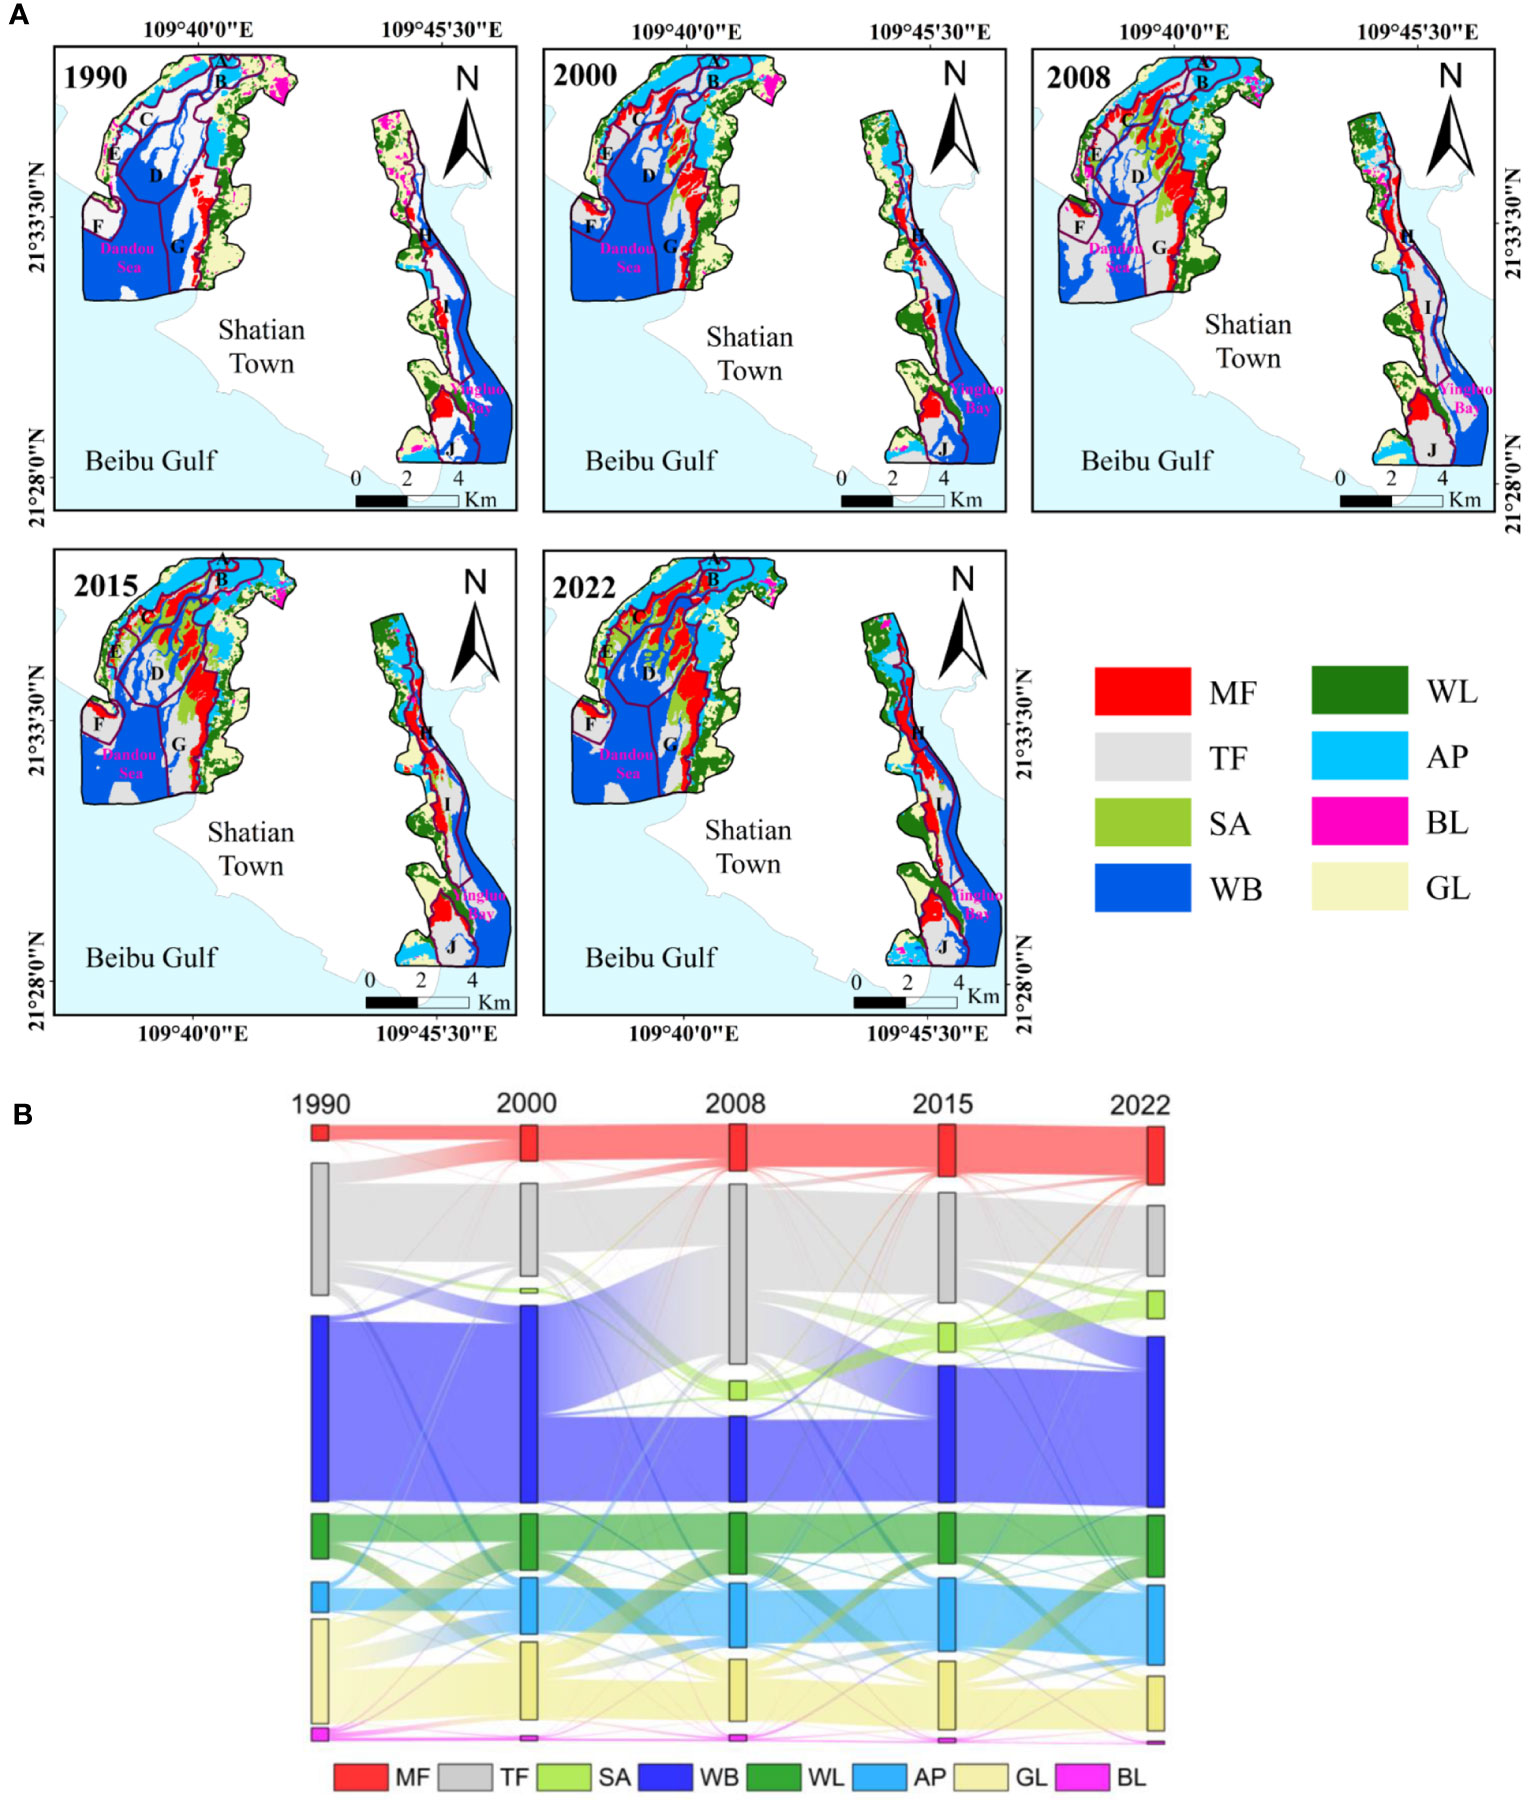
Figure 3 Land cover classification results. (A) Land cover maps of the reserve in 1990-2022 (B) Conversion between mangrove forest and other land cover types in 1990-2022.
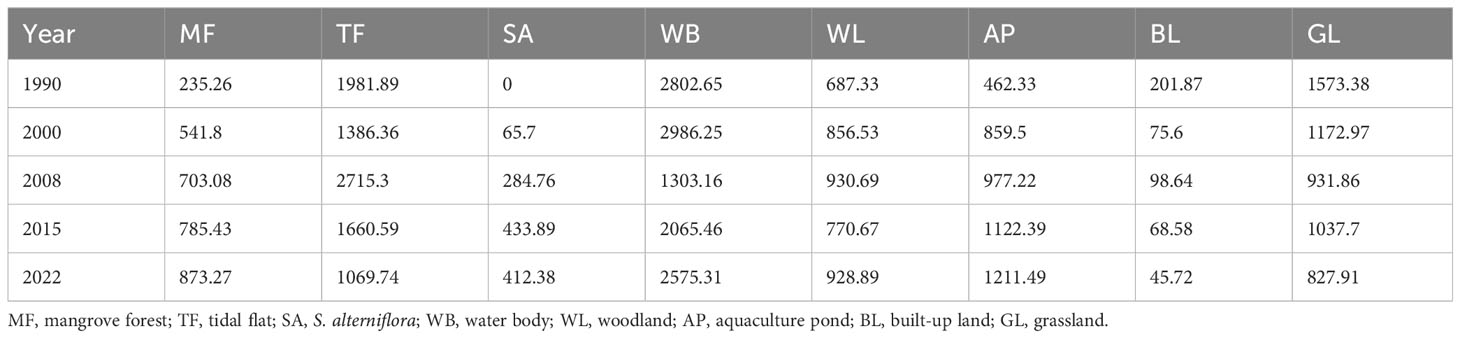
Table 5 The area (ha) of mangroves and other land cover of the reserve in 1990-2022.
Figure 3B shows the conversion between mangroves and other land cover during 1990-2022. From 1990 to 2022, 667.35 ha and 716.88 ha of other land types were converted into mangroves and S. alterniflora, respectively, among which 84.59% and 76.61% were converted from tidal flats. A total of 148.91 ha of mangroves were converted into non-mangroves, among which 19.3 ha was converted to aquaculture ponds, mainly distributed in the joint area between mangroves and aquaculture ponds, accounting for 12.96% of the mangrove conversion. Table B (Supplementary, Table B) presents the estimation of mangrove area change produced from stratified random sampling and mangrove change map for 1990-2022. From 1990 to 2022, The estimated area of mangrove gain was 594.80 ha (± 113.74 ha).
The average MREI values for the five evaluation phases (1990-2000, 2000-2008, 2008-2015, 2015-2022, 1990-2022) were positive: 0.48, 0.24, 0.29, 0.17, and 0.72. The percentage of grid in the ‘Area increase’ category of MREI decreases gradually from 1990-2000 to 2015-2022. The percentage of grid is the highest in the category of ‘Worse growth’ during 2015-2022, while during 2008-2015, the ‘Better growth’ category has the highest percentage of all phases (Figure 4A).
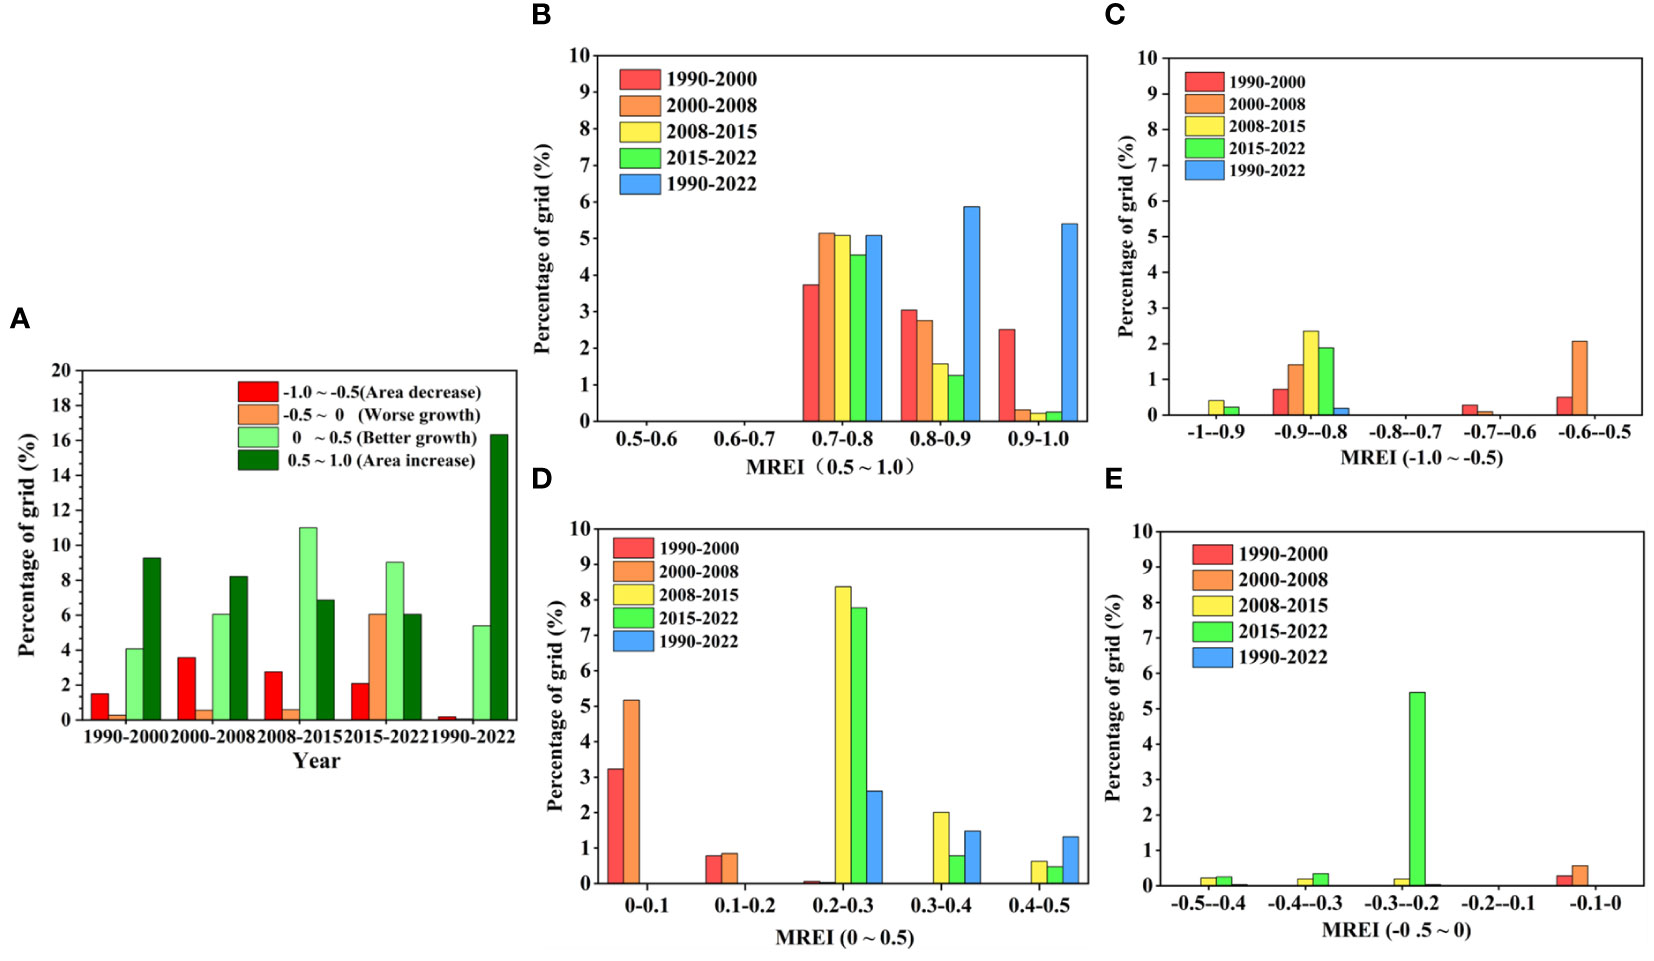
Figure 4 Grid percentage of MREI in different categories and different intervals. (A) Grid percentage for the four MREI categories; (B) Distribution of MREI values for ‘Area increase’ category (0.5 ~ 1.0); (C) Distribution of MREI values for ‘Area decrease’ category(-1.0 ~ -0.5); (D) Distribution of MREI values for ‘Better growth’ category (0 ~ 0.5); (E) Distribution of MREI values for ‘Worse growth’ category (-0.5 ~ 0).
Figures 4B–E show the grid percentage of MREI values in different intervals. In the (0.5 ~ 1.0) range, the MREI values concentrated between 0.7 ~ 1.0 (Figure 4B). In the (-1.0 ~ -0.5) range, the MREI values for 2008-2015 and 2015-2022 are both distributed between -1.0 and -0.8 (Figure 4C). Within the (0 ~ 0.5) range, the MREI values of 1990-2000 and 2000-2008 were distributed in the low-value range (0 ~ 0.2), while the MREI values of the remaining stages were distributed in the high-value range (0.2 ~ 0.5) (Figure 4D). The MREI values from 2015 to 2022 have a larger grid area in the (-0.5 ~ 0) range, but the MREI values of 90.16% of the grid are between the middle range (-0.3 ~ 0.2) (Figure 4E).
The spatial distribution of MREI in five evaluation phases based on the grid scale is shown in Figure 5. From 1990 to 2000, the mangroves located in the southern part of Zone G had MREI values between 0 and -0.5. During this period, the mangrove area in the zone did not change (Figure 3A), but the vegetation coverage decreased. Similarly, from 2000 to 2008, the MREI value of mangroves in Zone C was between 0 and -0.5, and the mangrove vegetation coverage decreased, but the area did not change (Figure 3A). From 2008 to 2015, the MREI values of mangroves in Zone C and Zone E were less than -0.5. During this period, S. alterniflora invaded these two zones and the mangrove area decreased (Figure 3A). From 2015 to 2022, the MREI values of Zone A were less than -0.5, resulting in a decrease in the area of mangrove forests located around aquaculture ponds (Figure 3A). From 1990 to 2022, except for the mangroves in the southern part of Zone G and the mangroves in Zone J, whose MREI values range from 0 to 0.5, all other regions had MREI values greater than 0.5.

Figure 5 The spatial distribution of MREI in five evaluation phases (grid-scale).
Figure 6 shows the spatial distribution of average MREI for each zone over five evaluation phases. Zones with an average MREI value greater than 0 were the most common during the five evaluation phases. From 1990 to 2000, the average MREI value in Zone J was -0.5 ~ 0, while the values in other zones were greater than 0, indicating relatively poor restoration effectiveness in Zone J; From 2000 to 2008, the average MREI values in all zones were 0 to 0.5; From 2015 to 2022, the restoration effectiveness in Zone A was the worst, with an average MREI value of less than -0.5. From 1990 to 2022, only the average MREI value in Zone J was less than 0.5, while values in the other zones were greater than 0.5.
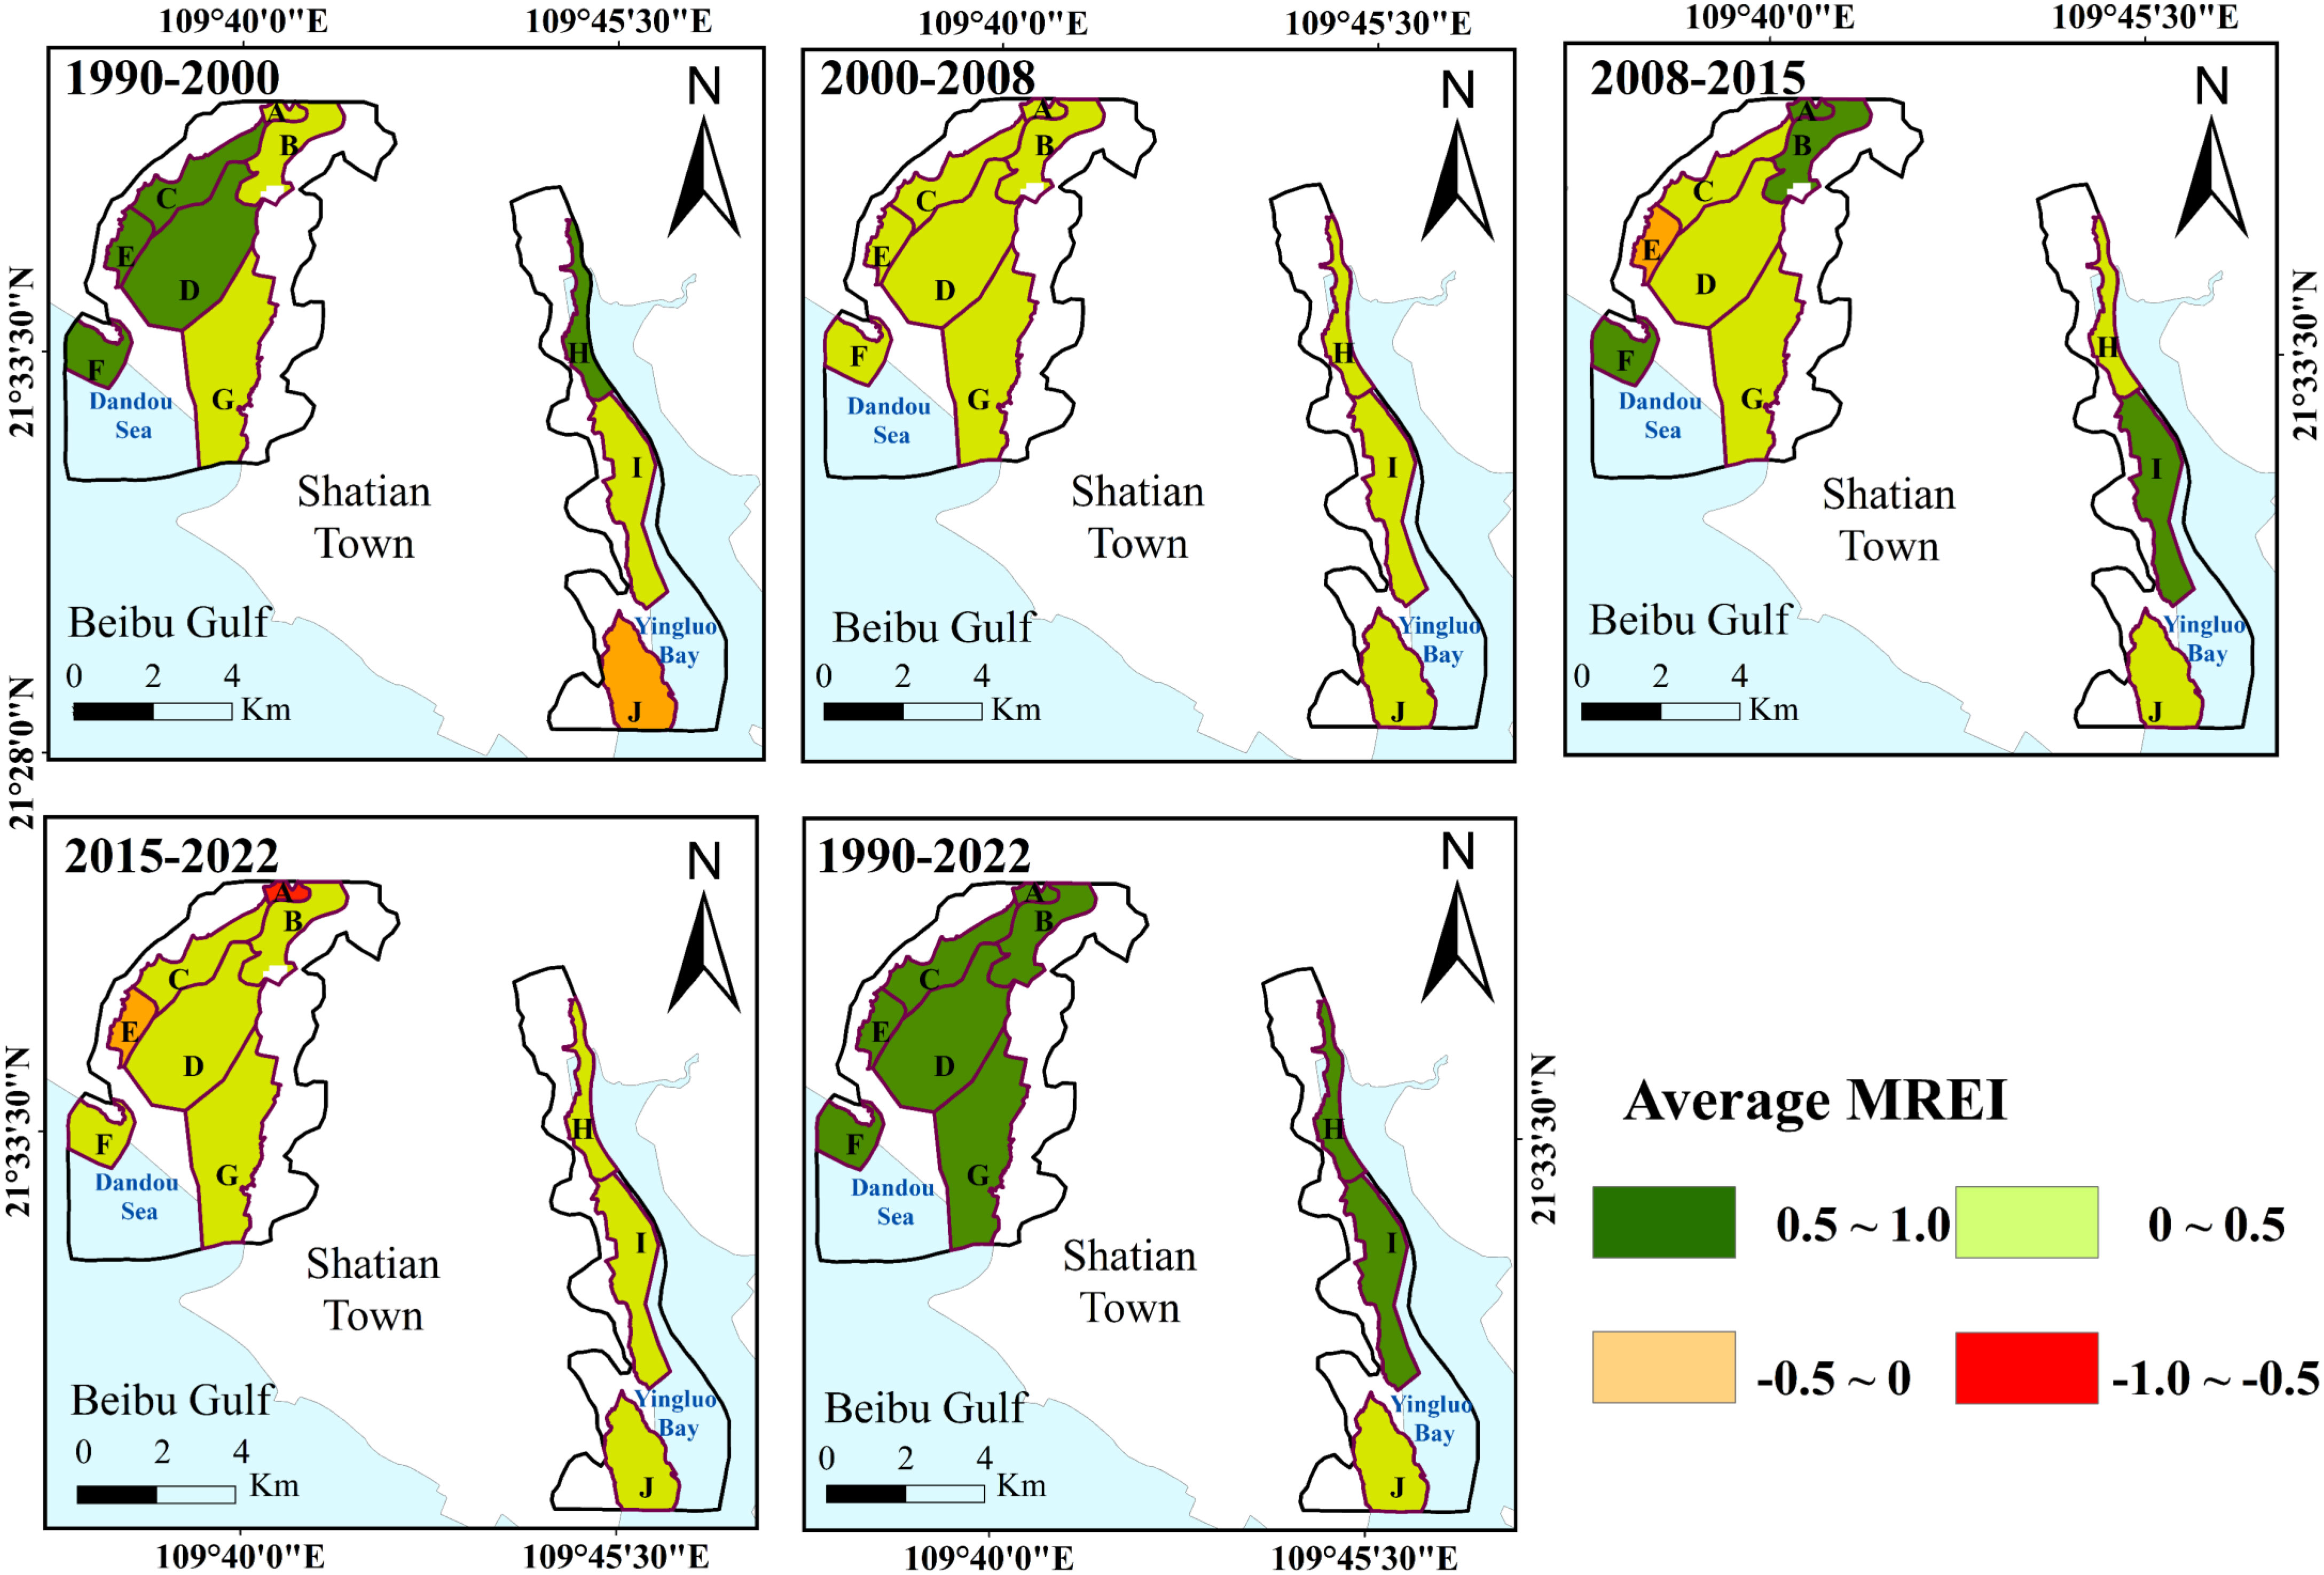
Figure 6 The spatial distribution of average MREI in five evaluation phases (village-scale).
The accuracy of MREI was examined by analyzing Google Earth and PlanetScope images. The distribution of MREI before and after the third phase of NCSSCP (2015-2022) is displayed in Figure 7A. The six Locations (I-VI) in the figure represent typical areas selected for validation. Detailed MREI values for the four locations (I- IV) and their corresponding high-resolution images are presented in Figures 7B–E. It should be noted that some images from 2015 and 2022 had poor quality or even missing. The area of mangroves does not change significantly in a short period, so available images taken from September to December in 2016 and 2021 were used to replace these missing images to verify whether the indication of MREI values is consistent with the actual changes in mangroves. In some zones, the mangrove area has not changed significantly, but the vegetation and canopy cover changed, such as in Locations V and VI. To examine the validity of MREI at these locations, we also used maximum NDVI images. Figures 7F, G show the MREI values and their corresponding NDVI for locations V and VI.
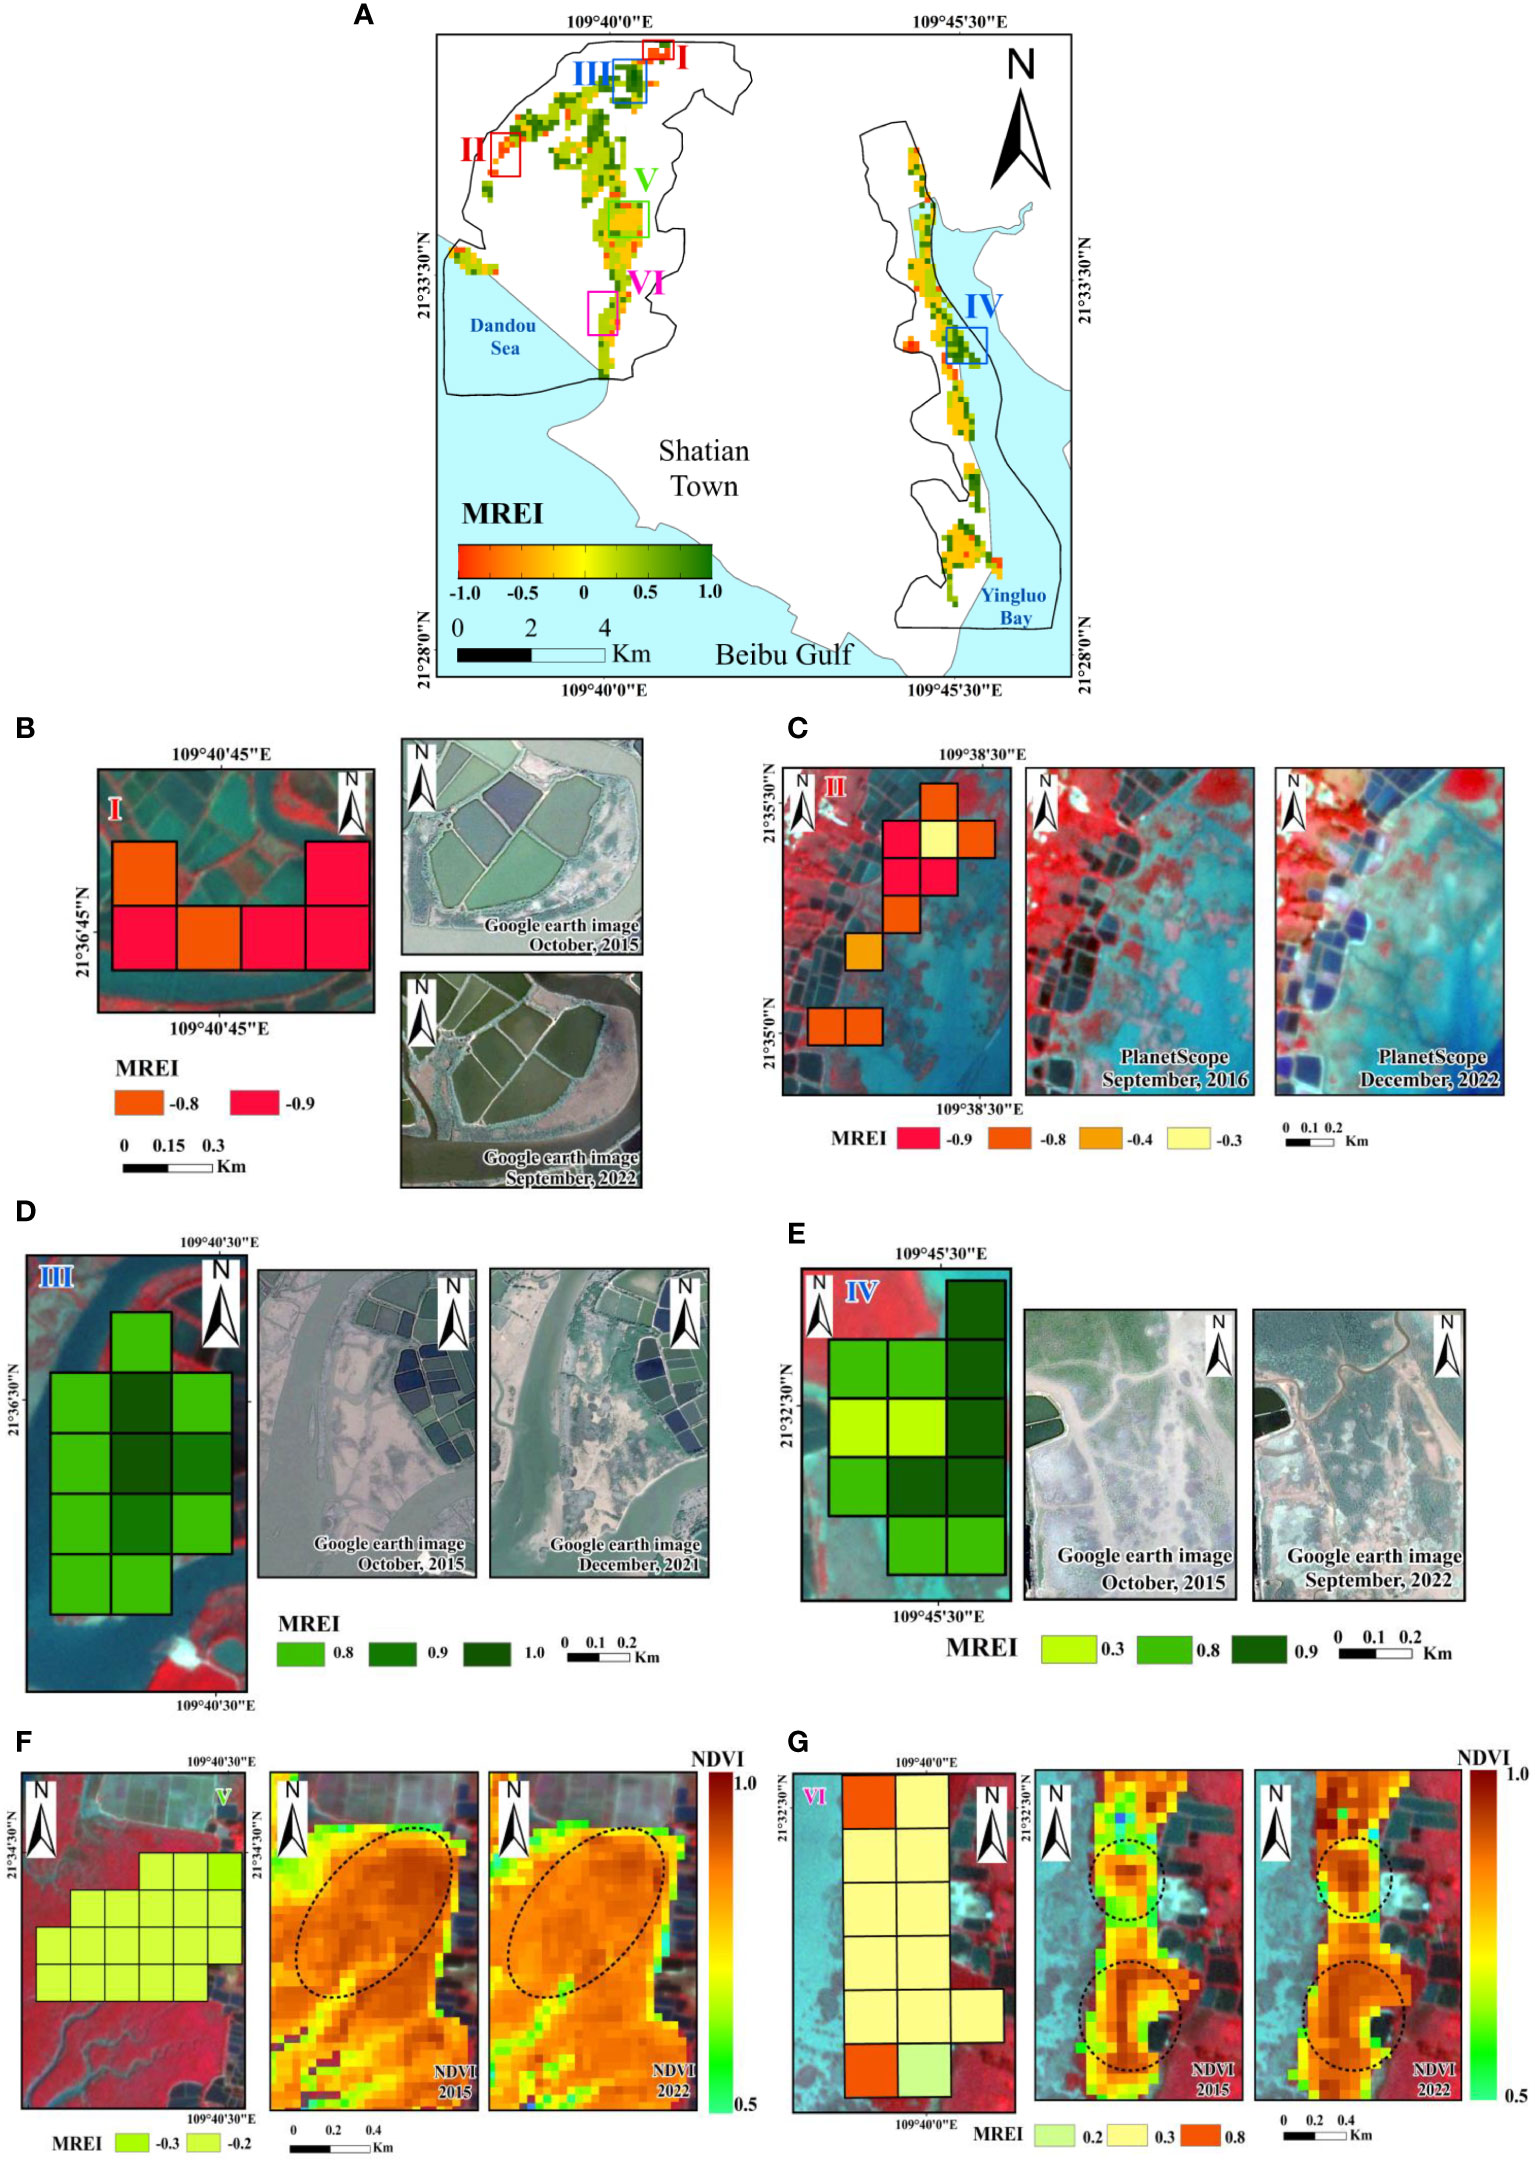
Figure 7 Verification of MREI values based on high-resolution images and maximum NDVI images. (A) Distribution of MREI (2015-2022) and typical Locations I-VI; MREI values of (B) Location I, (C) Location II, (D) Location III, (E) Location IV verified based on high-resolution images; MREI values of (F) Location V, (G) Location VI verified based on maximum NDVI images.
Location I is near the tidal flat around the northern aquaculture pond of Dandou Sea, with an average MREI of -0.87. It can be found from Google Earth images that from 2015 to 2022, mangrove forest was degraded, especially on the right side of the tidal flat, where mangroves almost disappeared. Location II is located on the west side of Dandou Sea, with an average MREI value of -0.74. We can see the loss of mangroves on the PlanetScope images in Figure 7C. The reason for the loss of mangroves may be related to the expansion of S. alterniflora. Location III is near the tidal flat around the aquaculture pond in the north of Dandou Sea, with an average MREI of 0.85. An increase in the area of mangrove forests near the aquaculture pond was observed at the location III. Location IV is located in the central part of Yingluo Bay, and many areas have MREI values greater than 0.5, with an average MREI value of 0.76. From Google Earth images, it can be seen that mangrove forests expanded from 2015 to 2022, and we suspect that there is tree planting activity here. On the side near the coastline, there is less land pollution in living areas, industrial areas, agricultural areas, and other areas, and the concentration of heavy metals in sediment can also become lower due to marine dynamic factors (Xie et al., 2022). Therefore, the MREI value on the seaward side of location IV is higher than on the land side. The mangrove area of Locations V and VI did not change significantly from 2015 to 2022, but the MREI is a good indicator of the changes in their vegetation cover (expressed as NDVI). The average MREI value of location V is -0.21, and NDVI decreased from 2015 to 2022 (Figure 7F). The average MREI value of location VI is 0.37, and NDVI increased from 2015 to 2022 (Figure 7G). Both location V and location VI are mainly distributed in natural mangrove forests, where the increase in mangrove patches is not significant and large-scale tree planting activities are unlikely. Location V is close to the land side, while Location VI is close to the coastline, so the MREI value of location V is lower than that of location VI.
The PRE distribution in entire afforestation phases is shown in Figure 8A. Figure 8B shows the grid percentage of different PRE categories. The percentage of ‘excellent PRE’ grids is the highest, relatively concentrated in zones B, D, I, and H, accounting for 44.17% of the total grid area. The grid number of ‘Poor PRE’ was 40, accounting for 5.24% of the total grid number, which was mainly distributed in the mudflat of Zone C. The grid number of ‘Good PRE’ was 148, accounting for 19.40% of the total grid number. The grid of ‘Average PRE ‘, with varying degrees of distribution in different zones, accounting for 31.19% of the total grid number. The PREI values of ten zones within the reserve indicated (Figure 8C) that for Zone A and Zone E, the PREI values were 0 and 0.38 respectively; Zone J with PREI value of 0.48; the PREI values of Zone C and Zone G were 0.64 and 0.61 respectively; Five regions (Zones H, I, D, F, B) showed PREI values near 1.0.
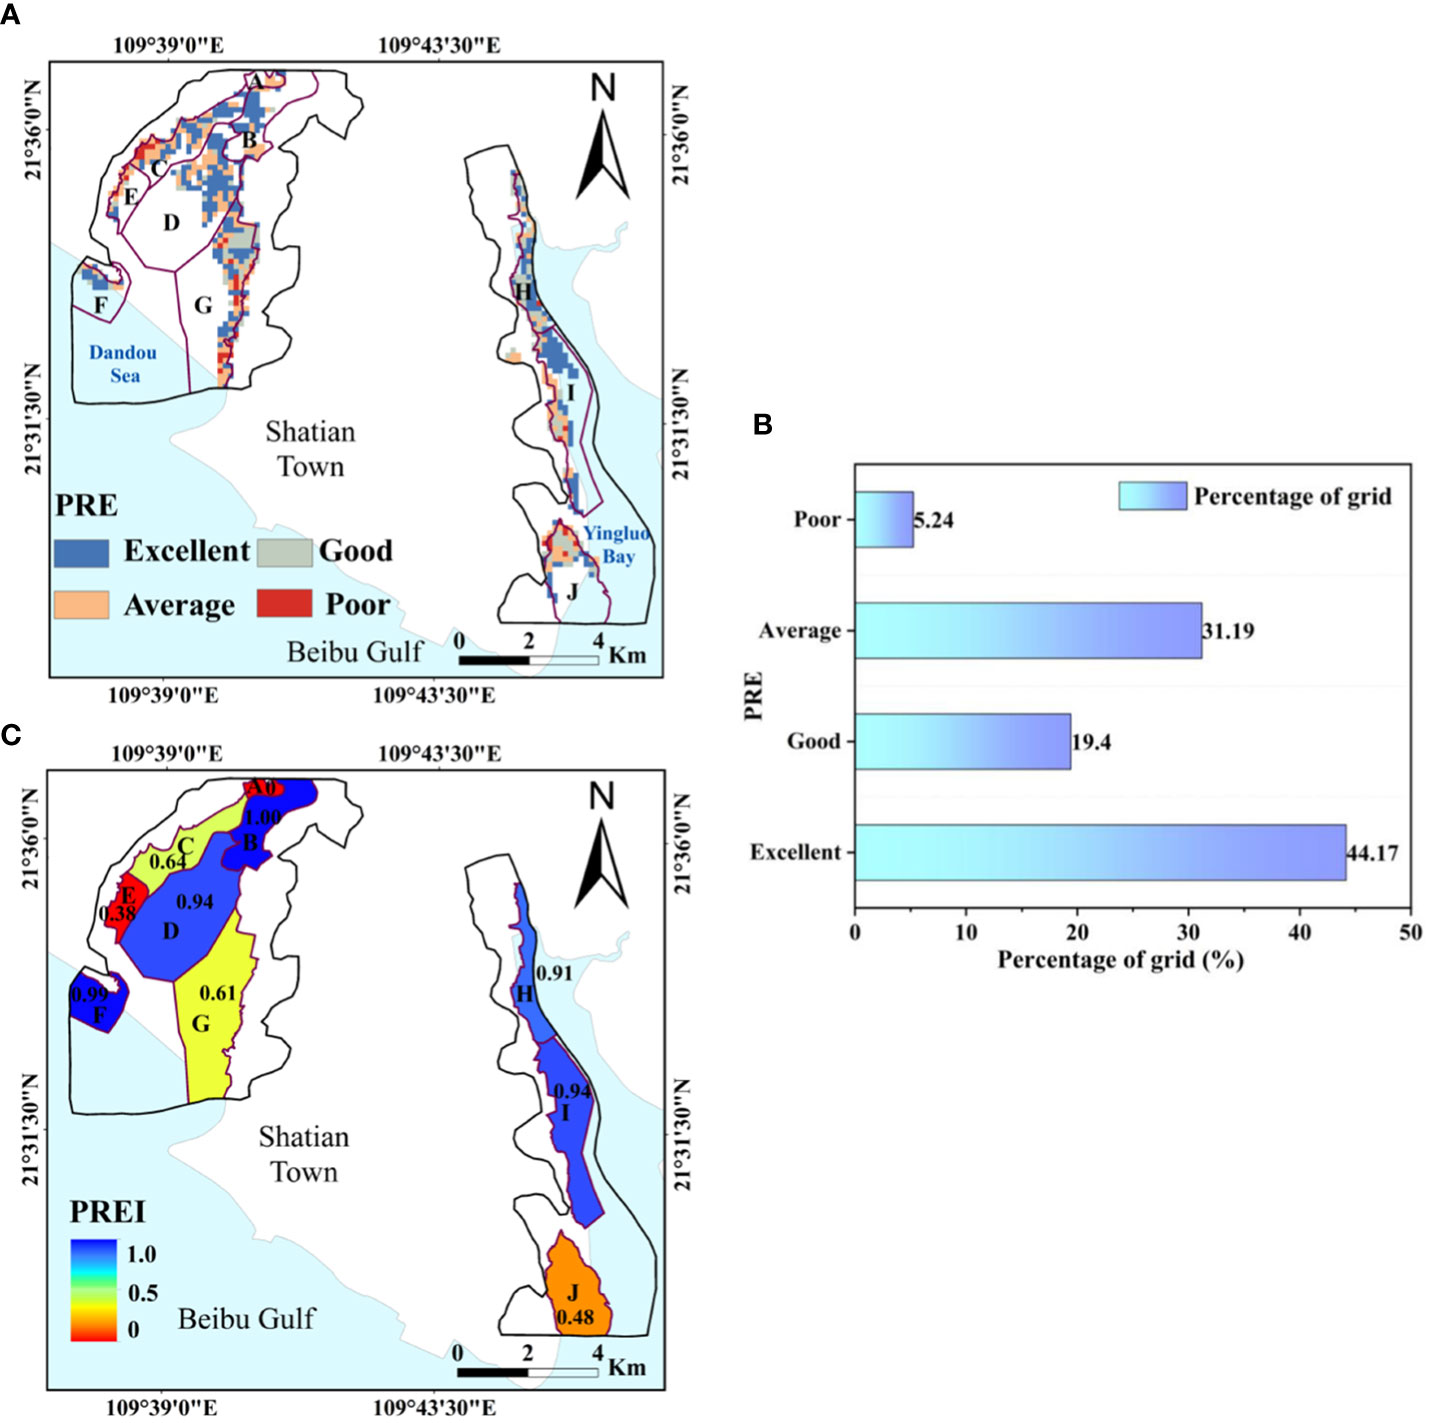
Figure 8 The persistence of mangrove restoration effectiveness (PRE). (A) The PRE based grid-scale; (B) The grid percentage of different PRE categories; (C) The PRE based on village-scale.
The survival rate and preservation rate of mangroves are two important factors that affect the effectiveness of restoration projects focused on mangrove planting. We found that 84.59% of the mangrove area was converted from tidal flats within the reserve. However, this conversion process may face many challenges in the future. GSMNNR is the area with the highest sea salinity along the coast of Guangxi. Although mangroves have salt tolerance and the ability to absorb heavy metals, excessive salinity or heavy metal concentrations in water can also have adverse effects on mangroves, leading to a decrease in mangrove biomass and seedling death (Niu et al., 2020). In addition, mangrove ecosystems are particularly sensitive to sea-level rise, converted mangrove land on exposed coastlines can be highly vulnerable to erosion. The impact of sea level rise on mangroves mainly depends on the relationship between the speed of sea level rise and sediment accumulation (Wang, 2021). According to Li et al. (2015), the rise in sea level will affect mangroves with lower sedimentation rates in the Dandou Sea on the west side of the reserve by 2025. Those mangrove communities in the higher intertidal zone will be lost, converted into lower communities, tidal flats, or will become inundated.
The challenges in the transformation of mudflat to mangroves also include the threat of human activities and alien species. During our fieldwork in GSMNNR and communication with relevant experts in Guangxi, we found that the growth of mangrove seedlings in the reserve is poor, with a survival rate of planting for three years at about 30%, mainly threatened by S. alterniflora and aquaculture ponds (Figure 9). The aquaculture pond is directly connected to the mangrove forests, and sewage from the aquaculture pond is directly discharged into the mangrove habitat through valves (Figure 9D), which is likely the reason for the area reduction of mangrove forests outside the aquaculture pond in Zone A between 2015 and 2022 (Figure 3A). However, similar to the study by Shi et al. (2023), we found an interesting phenomenon that not all mangroves around aquaculture ponds have low preservation rates. For example, mangroves have grown well, and the area has even increased significantly from 2015 to 2022 on the mudflats near the aquaculture ponds in Zone B (Figure 3A). This may be due to the nutrients contained in sewage being absorbed by mangroves, thereby promoting their growth (Jia, 2014). The alien species in the GSMNNR are S. alterniflora, mainly distributed in the Dandou tidal flat and Yingluo tidal flat. S. alterniflora competes with mangroves for sunlight and growth space, making it easy to shade the low mangrove plants.
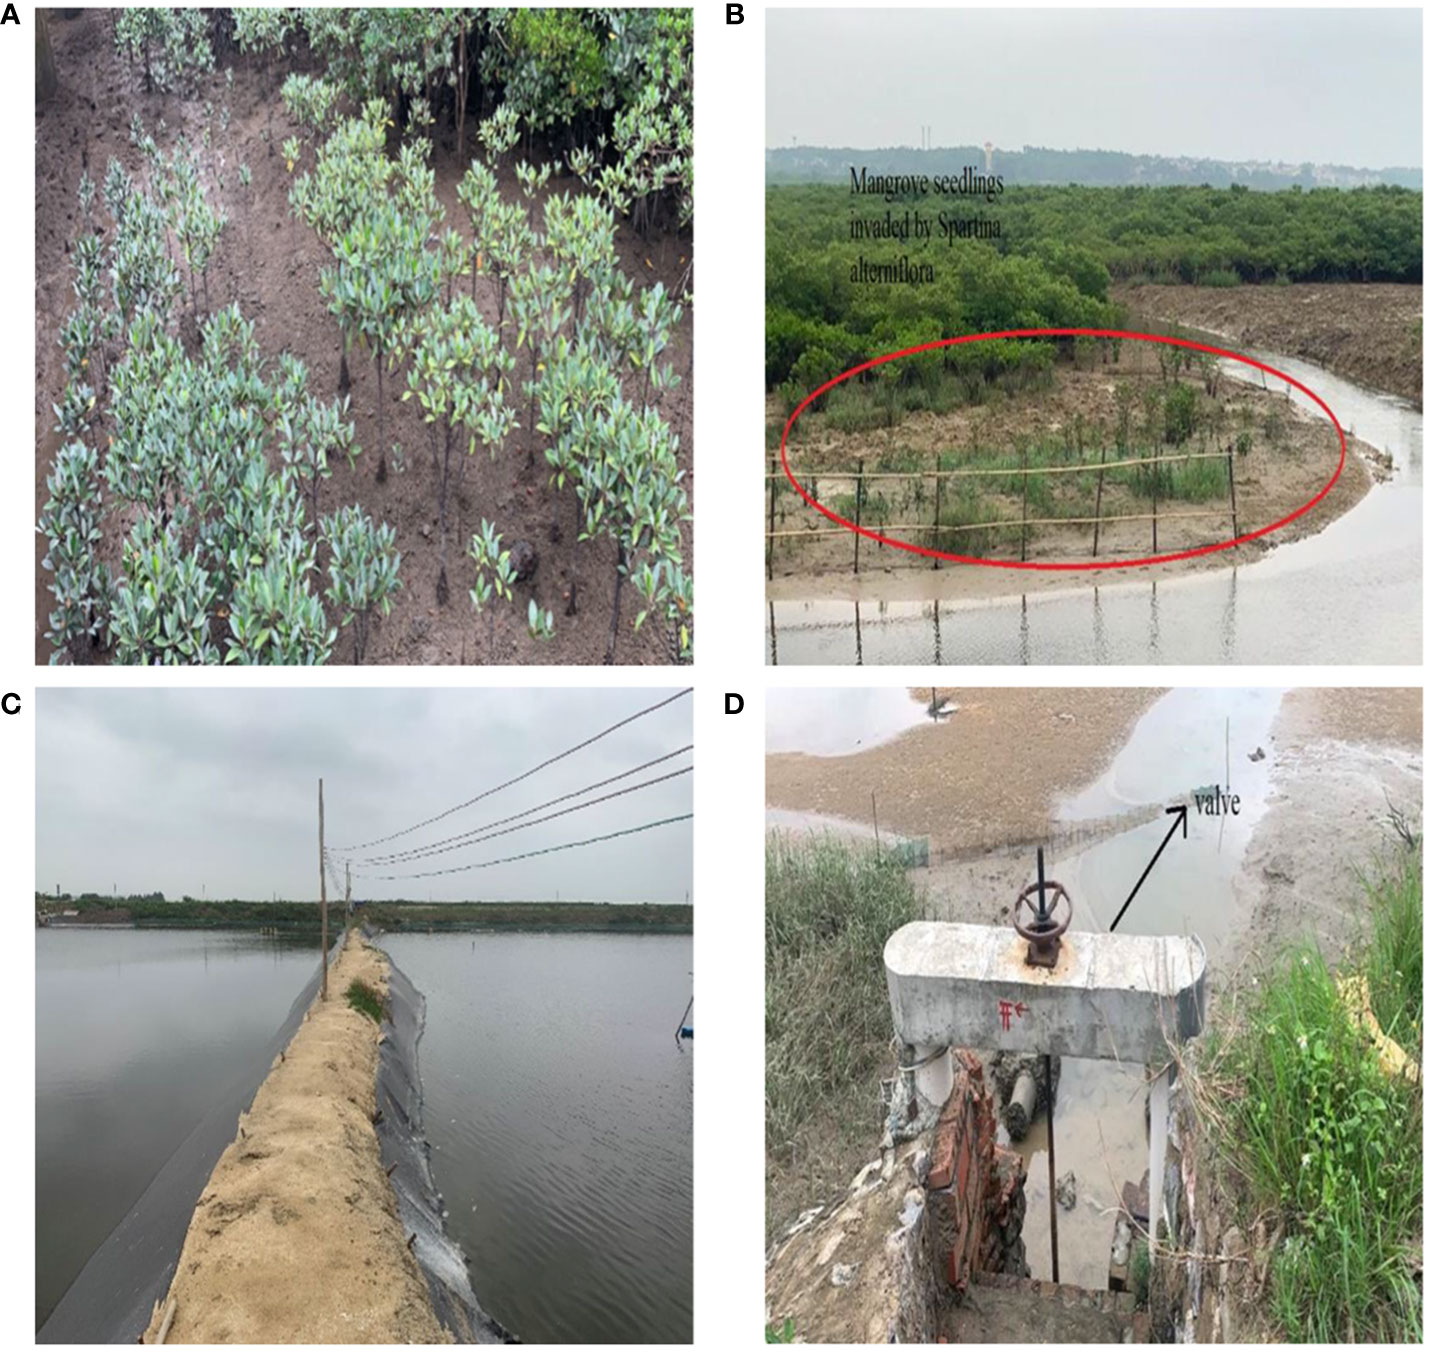
Figure 9 Photographs of some typical landscapes in the reserve (captured on April 11th, 2023). (A) Mangrove seedlings planted in the reserve; (B) Mangrove seedlings invaded by S. alterniflora; (C) aquaculture pond; (D) Water control valves for aquaculture ponds.
In addition, we have sorted out some events that may cause changes in the area and growth (vegetation coverage and canopy cover) of mangroves in GSMNNR after 1990 (Figure 10). During NCSSCP Phase I (1990-2000), 1093 ha of mangroves were planted along the coast of Guangxi, with a survival rate of 71%. There were large areas of exposed mudflat in the reserve (Figure 3A), so it was less difficult to plant mangroves. In 1990, The GSMNNR was established. Around 1995, the emergence of aquaculture ponds in Guangxi led to extensive mangrove deforestation. The establishment of reserve has to some extent reduced the direct deforestation of mangroves within the protected areas (Wang et al., 2021). Mangroves are easy to grow, coupled with the strict management of mangroves in the reserve. From 1990 to 2000, the average MREI value in the reserve was 0.48, which is the highest among the four afforestation phases.
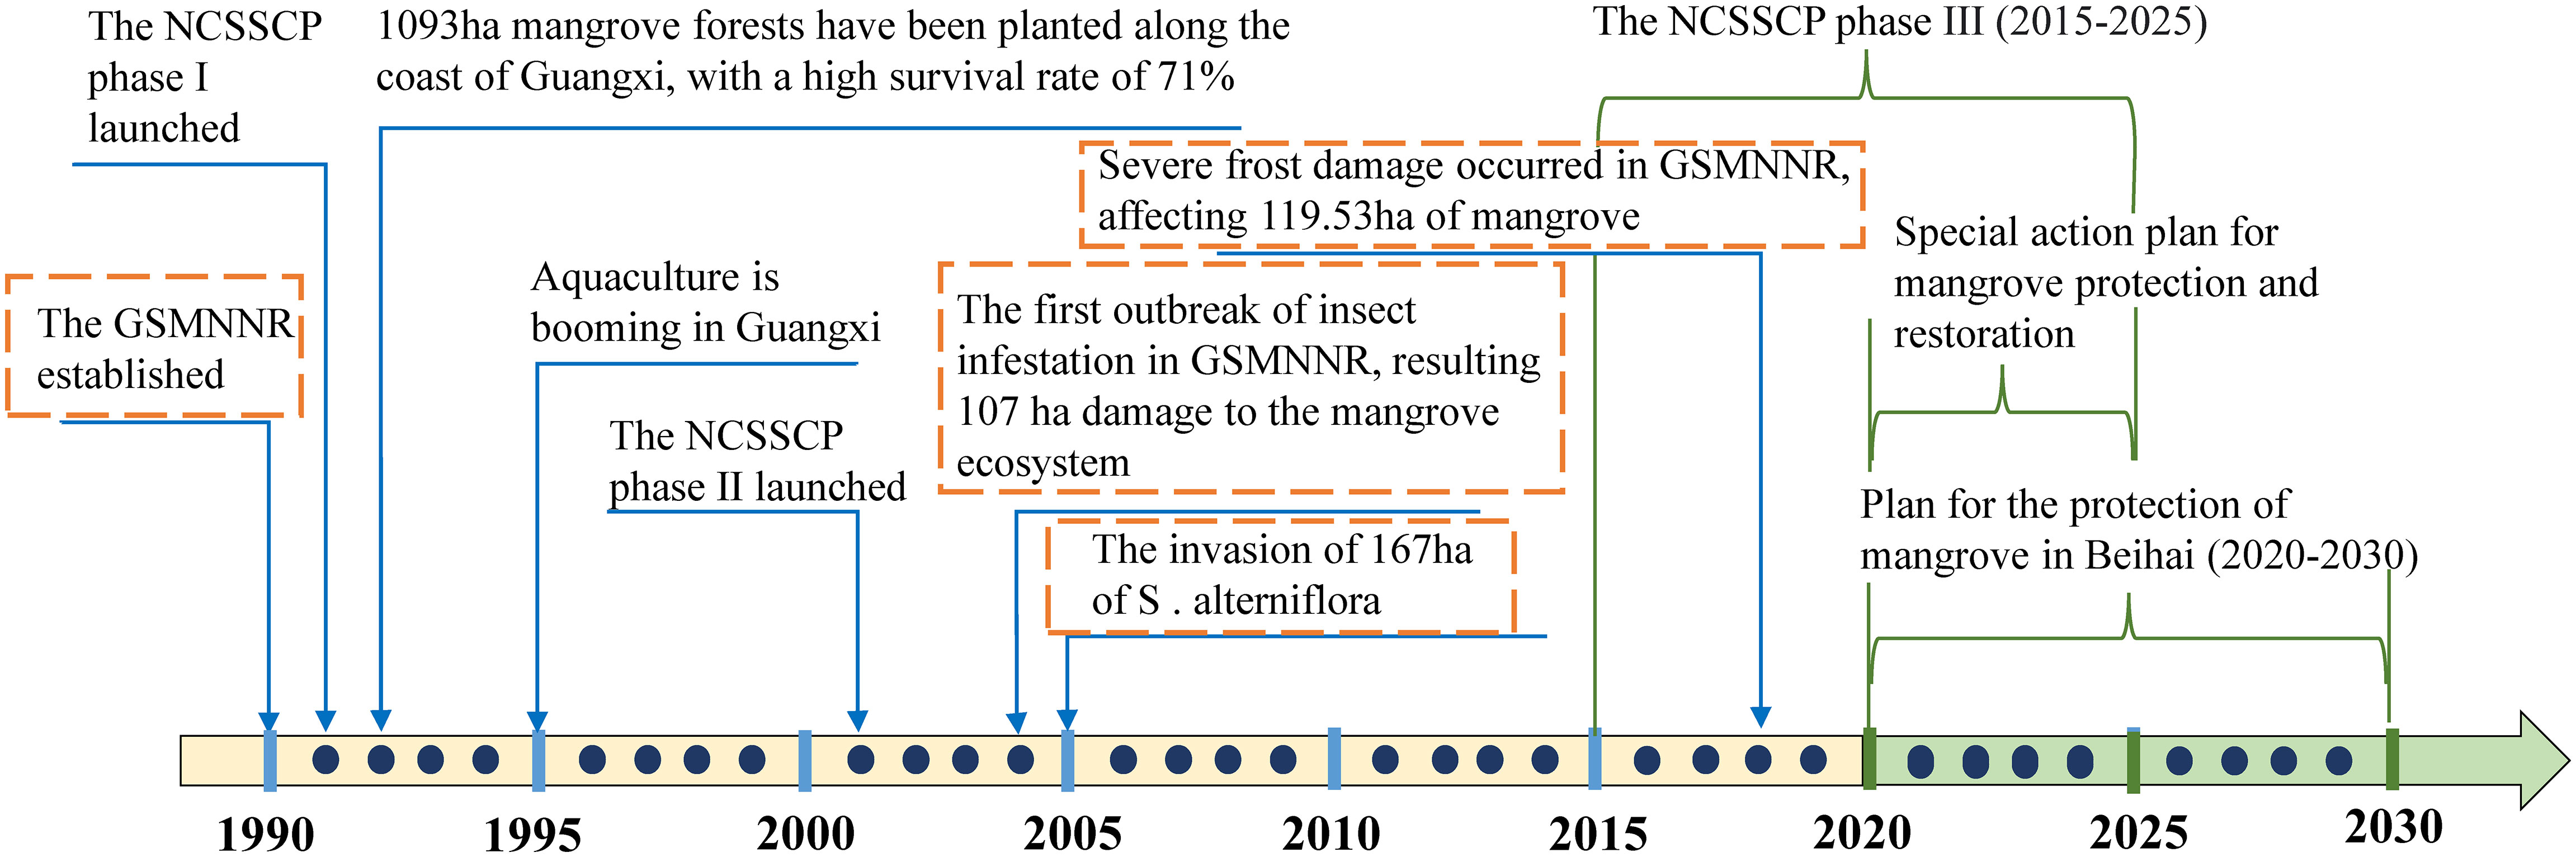
Figure 10 Important time points for mangrove area and growth changes in GSMNNR. Dashed boxes indicate events that only occur within the GSMNNR.
The afforestation area was 2615.5 ha in Guangxi from 2002 to 2007, and it was 1333 ha from 2008 to 2015, but only 37.11% and 26.63% of the artificial afforestation area have been preserved (Fan and Mo, 2018). Pest invasion can lead to the withering of mangrove leaves, and even cause the death of mangroves. In 2004, the first outbreak of pests destroyed 107 ha of mangroves in the reserve (Wei et al., 2019). In 2008, the most severe pest disaster occurred between 2004 and 2018, with an area of 264 ha affected. The main pest species of the two pest disasters were Oligochroa cantonella, and the main threat to the mangrove tree species was Avicennia marina (Wei et al., 2019). Subsequently, in 2005, the invasion area of S. alterniflora exceeded 167 ha, which had adverse effects on the mangrove seedlings. Compared to the NCSSCP Phase I, the impact of this invasion, combined with pests, may result in low preservation rates for the two afforestation attempts in the NCSSCP Phase II. The average MREI for 2000-2008 and 2008-2015 was slightly lower than the NCSSCP Phase I. It is worth noting that in the mudflats of Zone C and Zone E, the MREI value changed from positive to negative and even dropped below -0.5.
The average MREI in the reserve of the NCSSCP Phase III is the lowest, only 0.17. The reason for the lowest MREI value is the deterioration of mangrove growth and a decrease in vegetation coverage in the southern part of Zone G (Figure 5). However, the results of our further exploration (Figure 4E) indicate that although vegetation coverage decreased, the overall decrease was not significant, 90.16% of the MREI values in the negative range were distributed in the grid (-0.3 ~ -0.2). We tried to explain the reason for the relatively low MREI value in the third afforestation stage. The NCSSCP Phase III focuses on ecological restoration, and the intensity of planting mangroves has decreased. After years of planting recovery, the remaining direct afforestation of mudflats is limited, and the planting difficulty increases. In addition, the threat of S. alterniflora and insect pests is still ongoing, and the northern part of Zone E, which is close to Zone C, is gradually being affected.
The increase or decrease in mangrove area is often used to directly reflect the restoration effectiveness of mangroves. An increase in area indicates a good restoration effectiveness, while a decrease in area indicates a poor restoration effectiveness. For example, Zhang R. et al. (2022) analyzed the mangrove conservation effectiveness by mapping the land cover of China’s Mangrove National Nature Reserve from 2016 to 2020 and analyzing the changes in mangrove area and land cover transformation. In addition, vegetation indices such as NDVI and EVI have also been widely used in monitoring vegetation coverage, canopy closure, and vegetation health, which reflect vegetation growth. Healthy and well-growing vegetation absorbs red light and reflects near-infrared light due to the chlorophyll and cellular structure in its leaves, resulting in lower red band reflectance and higher near-infrared band reflectance. Poor growth and unhealthy vegetation have opposite characteristics. NDVI can reflect some vegetation state parameters that are positively correlated with leaf area index, biomass, and vegetation coverage based on this principle. These state parameters are also closely related to the restoration effectiveness of mangroves. Ruan et al. (2022) analyzed the global NDVI changes in mangroves using the Modify Resolution Imaging Spectrometer (MODIS) Normalized Difference Vegetation Index (NDVI) dataset and Landsat Global Mapping of Mangrove Forests (GMMF) from 2000-2018 to identify the Mangrove health conditions and dynamics. Zhu et al. (2021) used the NDVI time series analysis method and combined it with land cover change to divide the changes in mangroves in Qinglangang Nature Reserve, Hainan into three stages. However, there is currently no indicator that combines mangrove NDVI with area to evaluate the mangrove restoration effectiveness. This combination is necessary for understanding the growth status and restoration effectiveness of some mangroves that have not undergone significant changes in area but have undergone changes in growth and health. Based on the distribution characteristics of MREI values in each interval and the spatial distribution characteristics of MREI, we concluded that there were more areas where mangroves had better growth between 2008 and 2015, mainly distributed in Zone D of the Dandou Sea, and Zone G, J of the Yingluo Bay. Between 2015 and 2022, there were many areas with poor growth, mainly distributed in the northeast of Zone G and Zone J of the Dandou Sea, with 90.16% of the growth declining slightly (Figures 4, 5). PREI obtained the persistence of restoration effectiveness of the entire afforestation phase based on village-scale by classifying the trajectory of MREI. These two indices enable a more comprehensive analysis of the restoration effectiveness of mangroves using specific values. The accuracy of MREI had been examined on high-resolution images and NDVI maximum images. Furthermore, this index also takes into account the errors generated during the classification process, making the evaluation results more in line with the real situation. Remote sensing technology provides an effective way to obtain information on mangrove growth during historical periods lacking data. The evaluation method framework based on GIS provides a way for future research on the spatiotemporal changes in the restoration effectiveness, mainly focusing on changes in mangrove area and growth. This method framework can be easily applied to analyze and evaluate different time periods in other regions and has strong replicability.
The results of MREI show the improvement of mangrove growth and area during each afforestation period. Managers should further evaluate the restoration effectiveness based on the actual afforestation statistics of each period, such as afforestation date, time, and area. The results of PRE show several sites with poor persistence of mangrove restoration effectiveness. It is important to focus on these sites, investigate the mudflat elevation, hydrological conditions, sediment environment, etc., and determine whether they are suitable for mangrove growth. At present, the mudflat suitable for afforestation in the reserve has been greatly reduced, and the mangrove area has been slowly increased. On the one hand, mangrove restoration participants should actively explore new ideas for mangrove restoration, such as the policy of “returning ponds to mangroves”; On the other hand, emphasis should be placed on ecological restoration. In addition, the effectiveness of community-based mangrove restoration management has been confirmed in many studies. Managers can refer to the results of PRE and conduct pilot work on villages with good persistence of restoration effectiveness to establish successful mode.
The study represents a case study conducted within a single reserve, yet it holds the potential for broader application across multiple reserves on a larger scale. The index can encompass both within and outside the reserve, in order to study the differences in the mangrove restoration effectiveness inside and outside the reserve, and to explore the impact of the establishment of reserve on the mangrove restoration effectiveness. Moreover, three primary approaches to mangrove restoration exist direct planting, integration of coastal engineering techniques, and hydrological connectivity restoration. Our research background is mangrove planting activities, Therefore, The MREI model specifically focuses on the most pronounced changes, namely mangrove area and vegetation cover, before and after the restoration project based on planting. We only considered the restoration status of mangrove vegetation, ignoring the restoration of animal communities, habitat conditions, the elimination of threatened organisms, and the restoration of ecosystem functions.
During the United Nations Decade of Ecosystem Restoration (2021-2030), countries worldwide are embarking on initiatives to restore mangrove forests. In particular, China is actively engaged in the Special Action Plan for Mangrove Protection and Restoration (2020-2025), which plans to plant and restore 18800 ha of mangrove forests by 2025. In Guangxi’s mangrove protection and special restoration plan, it is planned to plant 1000 ha and restore 3500 ha of mangrove forests by 2025. Mangrove planting strategies include planting on mudflat and returning ponds to mangroves. At present, there are few mudflats suitable for afforestation. The difficulty of mangrove planting and restoration lies in the selection of suitable planting areas and the implementation of the policy of returning ponds to mangroves (Wang et al., 2021). In the future, multi-source remote sensing data, combined with drone and SAR data, can be used to overcome the limitations of remote sensing spatial resolution and weather, evaluate areas with high potential for mangrove planting and restoration, and timely monitor the success rate of mangrove restoration from ponds and the survival rate of mangrove planting.
In this study, we proposed a novel approach for assessing the mangrove restoration effectiveness, which involves integrating changes in mangrove areas and vegetation coverage (represented as NDVI). Taking GSMNNR as a study case, new indices MREI and PREI were constructed to quantitatively evaluate the mangrove restoration effectiveness of each afforestation phase during 1990-2022. Through the dynamic changes of MREI in a single afforestation phase and multiple afforestation phases, combined with land cover change, a method framework for evaluating the effectiveness of mangrove restoration based on grid-scale and village-scale was attempted to be explored.
Through the analysis of land cover and its mutual transformation, we concluded that the mangrove area in the reserve increased from 235.26 ha in 1990 to 873.27 ha in 2022, and 84.59% of mangroves were converted from tidal flats. The MREI we constructed can represent area and vegetation coverage of mangroves, effectively evaluating the effectiveness of planting restoration. The average value of MREI in the five evaluation phases was 0.48, 0.24, 0.29, 0.17, and 0.72, respectively. The results show that the NCSSCP is effective as a whole, and the first phase of the project NCSSCP had the best restoration effectiveness. There are fewer suitable tidal flats in the reserve now, the survival rate of mangrove planting is low, and the effectiveness of the third phase of the afforestation project is not as good as the first two phases. Managers should seek new ideas for mangrove restoration, such as “returning ponds to mangroves”. By analyzing the dynamic changes of MREI over multiple phases, we have concluded that 5.42% of the areas within the reserve have poor persistence of restoration effectiveness; 44.17% of the regions have excellent persistence of restoration effectiveness. Sites with poor persistence of restoration effectiveness should be given special attention. A recovery demonstration area should be established for the sites with excellent persistence of restoration effectiveness. From the perspective of spatial distribution of PREI, the zones with poor to excellent persistence of restoration effectiveness within the reserve were as follows: A, E, J, G, C, H, I (D), F, B. The high value zones of PREI were mainly distributed in the central of the Dandou Sea and the northern part of the Yingluo Bay. The low value zones were distributed in the northwest of the Dandou Sea.
This paper indicates that the MREI index and PREI index can comprehensively evaluate the effectiveness of mangrove restoration in terms of mangrove area, coverage changes, and long-term persistence. We expect that the indices presented in this study have great potential to be applied in broader regions as mangrove restoration efforts have been carried out worldwide. The mangrove restoration in GSMNNR has been carried out for nearly 40 years. Although the overall restoration effectiveness is good, there are still some areas with poor restoration effectiveness and persistence. With the reduction of mudflat suitable for afforestation and the threat of S. alterniflora invasion, the afforestation of GSMNNR mangroves is becoming more and more difficult, which is also a problem that other regions in the world will face. In the future, in addition to the restoration of mangrove area, we hope to focus on improving the functionality of mangroves and develop remote sensing methods to monitor changes in mangrove function.
The raw data supporting the conclusions of this article will be made available by the authors, without undue reservation.
YW: Writing – original draft, Conceptualization, Data curation, Formal analysis, Methodology, Writing – review & editing. XW: Data curation, Formal analysis, Writing – review & editing. SK: Project administration, Supervision, Writing – review & editing. DZ: Conceptualization, Methodology, Project administration, Supervision, Writing – review & editing. YK: Conceptualization, Methodology, Project administration, Supervision, Writing – review & editing.
The author(s) declare financial support was received for the research, authorship, and/or publication of this article. This work was supported by the National Natural Science Foundation of China (No. 42071396), and Beijing Science and Technology Planning Project (No. Z201100006720001).
The authors acknowledge the data support from “National Earth System Science Data Center, National Science & Technology Infrastructure of China”. We are also thankful to the Landsat imagery data provided by the USGS through the Google Earth Engine (GEE). We also thank the Planet Labs Education and Research program for providing PlanetScope satellite imagery.
The authors declare that the research was conducted in the absence of any commercial or financial relationships that could be construed as a potential conflict of interest.
All claims expressed in this article are solely those of the authors and do not necessarily represent those of their affiliated organizations, or those of the publisher, the editors and the reviewers. Any product that may be evaluated in this article, or claim that may be made by its manufacturer, is not guaranteed or endorsed by the publisher.
The Supplementary Material for this article can be found online at: https://www.frontiersin.org/articles/10.3389/fmars.2023.1280373/full#supplementary-material
Baloloy A. B., Blanco A. C., Ana R. R. C. S., Nadaoka K. (2020). Development and application of a new mangrove vegetation index (MVI) for rapid and accurate mangrove mapping. ISPRS J. Photogramm. Remote Sens. 166, 95–117. doi: 10.1016/j.isprsjprs.2020.06.001
Bao S., Yang F. (2022). Spatio-temporal dynamic of the land use/cover change and scenario simulation in the Southeast coastal shelterbelt system construction project region of China. Sustainability 14, 8952. doi: 10.3390/su14148952
Bunting P., Rosenqvist A., Hilarides L., Lucas R. M., Thomas N., Tadono T., et al. (2022). Global mangrove extent change 1996–2020: global mangrove watch version 3.0. Remote Sens. (Basel) 14, 3657. doi: 10.3390/rs14153657
Cadier C., Bayraktarov E., Piccolo R., Adame M. F. (2020). Indicators of coastal wetlands restoration success: A systematic review. Front. Mar. Sci. 7. doi: 10.3389/fmars.2020.600220
Carugati L., Gatto B., Rastelli E., Lo Martire M., Coral C., Greco S., et al. (2018). Impact of mangrove forests degradation on biodiversity and ecosystem functioning. Sci. Rep. 8, 13298. doi: 10.1038/s41598-018-31683-0
Du C., Khan S., Ke Y., Zhou D. (2023). Assessment of spatiotemporal dynamics of mangrove in five typical mangrove reserve wetlands in Asia, Africa and Oceania. Diversity 15, 148. doi: 10.3390/d15020148
Duke N. C., Meynecke J. O., Dittmann S., Ellison A. M., Anger K., Berger U., et al. (2007). A world without mangroves? Science 317, 41–42. doi: 10.1126/science.317.5834.41b
Fan H., Mo Z. (2018). The history, achievements and lessons learnt for mangrove restoration in Guangxi, China. Guangxi Sci. 25, 363–371,387. doi: 10.13656/j.cnki.gxkx.20180918.001
Friess D. A., Rogers K., Lovelock C. E., Krauss K. W., Hamilton S. E., Lee S. Y., et al. (2019). The state of the world's mangrove forests: past, present, and future. Ann. Rev. Environ. Resour. 44, 89–115. doi: 10.1146/annurev-environ-101718
Gatt Y. M., Andradi-Brown D. A., Ahmadia G. N., Martin P. A., Sutherland W. J., Spalding M. D., et al. (2022). Quantifying the reporting, coverage and consistency of key indicators in mangrove restoration projects. Front. For. Glob. Change 5. doi: 10.3389/ffgc.2022.720394
Gerona-Daga M. E. B., Salmo S. G. (2022). A systematic review of mangrove restoration studies in Southeast Asia: Challenges and opportunities for the United Nation’s Decade on Ecosystem Restoration. Front. Mar. Sci. 9. doi: 10.3389/fmars.2022.987737
Gevana D., Camacho L., Carandang A., Camacho S., Im S. (2015). Land use characterization and change detection of a small mangrove area in Banacon Island, Bohol, Philippines using a maximum likelihood classification method. For. Sci. Technol. 11, 197–205. doi: 10.1080/21580103.2014.996611
Gilani H., Naz H. I., Arshad M., Nazim K., Akram U., Abrar A., et al. (2021). Evaluating mangrove conservation and sustainability through spatiotemporal, (1990–2020) mangrove cover change analysis in Pakistan. Estuar. Coast. Shelf Sci. 249, 107128. doi: 10.1016/j.ecss.2020.107128
Giri C., Ochieng E., Tieszen L. L., Zhu Z., Singh A., Loveland T., et al. (2011). Status and distribution of mangrove forests of the world using earth observation satellite data. Glob. Ecol. Biogeogr. 20, 154–159. doi: 10.1111/j.1466-8238.2010.00584.x
Ha T. T. T., van Dijk H., Bush S. R. (2012). Mangrove conservation or shrimp farmer's livelihood? The devolution of forest management and benefit sharing in the Mekong delta, Vietnam. Ocean Coast. Manage. 69, 185–193. doi: 10.1016/j.ocecoaman.2012.07.034
Hamilton S. E., Casey D. (2016). Creation of a high spatio-temporal resolution global database of continuous mangrove forest cover for the 21st century (CGMFC-21). Glob. Ecol. Biogeogr. 25, 729–738. doi: 10.1111/geb.12449
Huang H., Chen K., Wang A., Wu K. (2023). Historical changes, problems and protection countermeasures of mangrove in China. Ocean. Coast. Manage. 40, 125–132. doi: 10.20016/j.cnki.hykfygl.2023.02.011
Jia M. (2014). Remote Sensing analysis of China's mangrove forests dynamics during 1973 to 2013 (China: University of Chinese Academy of Sciences). dissertation/ Doctoral thesis.
Jia M., Wang Z., Mao D., Huang C., Lu C. (2021). Spatial-temporal changes of China's mangrove forests over the past 50 years: An analysis towards the Sustainable Development Goals (SDGs). Chin. Sci. Bull. 66, 3886–3901. doi: 10.1360/TB-2020-1412
Jia M., Wang Z., Zhang Y., Mao D., Wang C. (2018). Monitoring loss and recovery of mangrove forests during 42 years: The achievements of mangrove conservation in China. Int. J. Appl. Earth Obs. Geoinf. 73, 535–545. doi: 10.1016/j.jag.2018.07.025
Kamali B., Hashim R. (2011). Mangrove restoration without planting. Ecol. Eng. 37, 387–391. doi: 10.1016/j.ecoleng.2010.11.025
Li L., Liu W., Tao Y., Xu X., Fu W., Dong J. (2021). Diffusion dynamics and driving forces of Spartina alterniflora in the Guangxi Shankou Mangrove Reserve. Acta Ecol. Sin. 41, 6814–6824. doi: 10.5846/stxb202101260275
Li S., Meng X., Ge Z., Zhang L. (2015). Evaluation of the threat from sea-level rise to the mangrove ecosystems in Tieshangang Bay, southern China. Ocean Coast. Manage. 109, 1–8. doi: 10.1016/j.ocecoaman.2015.02.006
Liu M. (2018). Remote Sensing analysis of Spartina alterniflora in the coastal areas of China during 1990 to 2015 (China: University of Chinese Academy of Sciences). dissertation/Ph D Thesis.
Liu X., Yang X., Zhang T., Wang Z., Zhang J., Liu Y., et al. (2022). Remote sensing based conservation effectiveness evaluation of mangrove reserves in China. Remote Sens. (Basel) 14, 1386. doi: 10.3390/rs14061386
Lu C., Li L., Wang Z., Su Y., Su Y., Huang Y., et al. (2022). The national nature reserves in China: Are they effective in conserving mangroves? Ecol. Indic. 142, 109265. doi: 10.1016/j.ecolind.2022.109265
Min Y., Ke Y., Yue H., Xiaolan Y., Demin Z. (2023). Dynamic monitoring of invasive Spartina alterniflora clearance via fusion of Sentinel-2 and GF-1 time series images. Natl. Remote Sens. Bull. 27, 1467–1479. doi: 10.11834/jrs.20232279
Niu A., Gao Y., Xu S. (2020). Effects of heavy metal pollution on the carbon content of surface sediments of mangroves in the Pearl River Estuary. Acta Ecologica. Sinica. 40, 8549–8558. doi: 10.5846/stxb202002240322
Olofsson P., Foody G. M., Herold M., Stehman S. V., Woodcock C. E., Wulder M. A. (2014). Good practices for estimating area and assessing accuracy of land change. Remote Sens. Environ. 148, 42–57. doi: 10.1016/j.rse.2014.02.015
Peng Y., Zhou Y., Chen G. (2008). The restoration of mangrove wetland: a review. Acta Ecol. Sin. 28, 786–797. doi: 10.3321/j.issn:1000-0933.2008.02.041
Planet Team (2022). Planet Application Program Interface: In Space for Life on Earth (San Francisco, CA). Available at: https://api.planet.com.
Polidoro B. A., Carpenter K. E., Collins L., Duke N. C., Ellison A. M., Ellison J. C., et al. (2010). The loss of species: mangrove extinction risk and geographic areas of global concern. Plos. One 5, e10095. doi: 10.1371/journal.pone.0010095
Primavera J. H., Esteban J. M. A. (2008). A review of mangrove rehabilitation in the Philippines: successes, failures and future prospects. Wetlands Ecol. Manage 16, 345–358. doi: 10.1007/s11273-008-9101-y
Rouse J. W., Haas R. H., Schell J. A., Deering D. W. (1974). Monitoring vegetation systems in the Great Plains with ERTS. NASA. Goddard Space Flight Center 3d ERTS-1 Symp., Vol. 1, Sect. A. [online] Available at: https://ntrs.nasa.gov/citations/19740022614.
Roy D. P., Huang H., Houborg R., Martins V. S. (2021). A global analysis of the temporal availability of PlanetScope high spatial resolution multi-spectral imagery. Remote Sens. Environ. 264, 112586. doi: 10.1016/j.rse.2021.112586
Ruan L., Yan M., Zhang L., Fan X., Yang H. (2022). Spatial-temporal NDVI pattern of global mangroves: a growing trend during 2000–2018. Sci. Total Environ. 844, 157075. doi: 10.1016/j.scitotenv.2022.157075
Seto K. C., Fragkias M. (2007). Mangrove conversion and aquaculture development in Vietnam: A remote sensing-based approach for evaluating the Ramsar Convention on Wetlands. Glob. Environ. Change 17, 486–500. doi: 10.1016/j.gloenvcha.2007.03.001
Shi M., Li H., Jia M. (2023). Spatio-temporal variations in mangrove forest in the Shankou Mangrove Nature Reserve based on the GEE cloud platform and Landsat data. Remote Sens. Nat. Res. 35, 61–69. doi: 10.6046/zrzyyg.2022209
Suyadi, Gao J., Lundquist C. J., Schwendenmann L. (2018). Characterizing landscape patterns in changing mangrove ecosystems at high latitudes using spatial metrics. Estuar. Coast. Shelf Sci. 215, 1–10. doi: 10.1016/j.ecss.2018.10.005
Veettil B. K., Pereira S. F. R., Quang N. X. (2018). Rapidly diminishing mangrove forests in Myanmar (Burma): a review. Hydrobiologia 822, 19–35. doi: 10.1007/s10750-018-3673-1
Wang L., Jia M., Yin D., Tian J. (2019). A review of remote sensing for mangrove forests: 1956–2018. Remote Sens. Environ. 231, 111223. doi: 10.1016/j.rse.2019.111223
Wang L., Shi C., Tian J., Song X., Jia M., Li X., et al. (2018). Researches on mangrove forest monitoring methods based on multi-source remote sensing. Bio. Sci. 26, 838–849. doi: 10.17520/biods.2018067
Wang W., Fu H., Lee S. Y., Fan H., Wang M. (2020). Can strict protection stop the decline of mangrove ecosystems in China? From rapid destruction to rampant degradation. Forests 11, 55. doi: 10.3390/f11010055
Wang W., Zhang L., Zhang Y., Wang M. (2021). Research progress of pond-to-mangrove restoration. J. Xiamen University(Natural Science) 60, 348–354. doi: 10.6043/j.issn.0438-0479.202011015
Wang Y. (2021). Impacts, challenges and opportunities of global climate change on mangrove ecosystems. J. Trop. Oceanogr. 40, 1–14. doi: 10.11978/YG2020006
Wei J., Liu W., Huang Q., Chen Q., Su B. (2019). Investigation of main insect pests in Shankou national mangrove reserve of Guangxi in recent 15 years. J. Fujian Forestry Sci. Technol. 46, 66–69. doi: 10.13428/j.cnki.fjlk.2019.04.015
Wodehouse D. C. J., Rayment M. B. (2019). Mangrove area and propagule number planting targets produce sub-optimal rehabilitation and afforestation outcomes. Estuar. Coast. Shelf Sci. 222, 91–102. doi: 10.1016/j.ecss.2019.04.003
Worthington T. A., Zu Ermgassen P. S. E., Friess D. A., Krauss K. W., Lovelock C. E., Thorley J., et al. (2020). A global biophysical typology of mangroves and its relevance for ecosystem structure and deforestation. Sci. Rep. 10, 14652. doi: 10.1038/s41598-020-71194-5
Xiao H., Su F., Fu D., Yu H., Ju C., Pan T., et al. (2021). 10-M GLOBAL MANGROVE CLASSIFICATION PRODUCTS OF 2018-2020 BASED ON BIG DATA[DS/OL] Vol. V1 (China: Science Data Bank). Available at: https://cstr.cn/31253.11.sciencedb.01019.
Xie Z., Zhu G., Xu M., Zhang H., Yi W., Jiang Y., et al. (2022). Risk assessment of heavy metals in a typical mangrove ecosystem - a case study of Shankou mangrove national natural reserve, southern China. Mar. pollut. Bull. 178, 113642. doi: 10.1016/j.marpolbul.2022.113642
Xu H. (2005). A study on information extraction of water body with the modified normalized difference water index (MNDWI). Natl. Remote Sens. Bull. 9, 589–595. doi: 10.3321/j.issn:1007-4619.2005.05.012
Xu R., Zhao S., Ke Y. (2021). A simple phenology-based vegetation index for mapping invasive spartina alterniflora using google earth engine. IEEE J. Sel. Top. Appl. Earth Obs. Remote Sens. 14, 190–201. doi: 10.1109/JSTARS.2020.3038648
Zha Y., Ni S., Yang S. (2003). An effective approach to automatically extract urban land-use from TM imagery. Natl. Remote Sens. Bull. 7, 37–40. doi: 10.3321/j.issn:1007-4619.2005.05.012
Zhang R., Jia M., Wang Z., Zhou Y., Mao D., Ren C., et al. (2022). Tracking annual dynamics of mangrove forests in mangrove National Nature Reserves of China based on time series Sentinel-2 imagery during 2016–2020. Int. J. Appl. Earth Obs. Geoinf. 112, 102918. doi: 10.1016/j.jag.2022.102918
Zhang Z., Xu N., Li Y., Li Y. (2022). Sub-continental-scale mapping of tidal wetland composition for East Asia: A novel algorithm integrating satellite tide-level and phenological features. Remote Sens. Environ. 269, 112799. doi: 10.1016/j.rse.2021.112799
Zhao C., Qin C. (2022). A detailed mangrove map of China for 2019 derived from sentinel-1 and -2 images and google earth images. Geosci. Data J. 9, 74–88. doi: 10.1002/gdj3.119
Zhen J. (2019). Monitoring and dynamic analysis of mangrove forests in Hainan Island using multi-temporal remote sensing images (China: University of Chinese Academy of Sciences). dissertation/Master's thesis.
Keywords: afforestation, NCSSCP (National Coastal Shelterbelt System Construction Project), mangrove cover, MREI (Mangrove Restoration Effectiveness Index), PREI (Process-based Restoration Effectiveness Index), growth
Citation: Wang Y, Wang X, Khan S, Zhou D and Ke Y (2023) Evaluation of mangrove restoration effectiveness using remote sensing indices - a case study in Guangxi Shankou Mangrove National Natural Reserve, China. Front. Mar. Sci. 10:1280373. doi: 10.3389/fmars.2023.1280373
Received: 20 August 2023; Accepted: 14 November 2023;
Published: 29 November 2023.
Edited by:
Tian Xie, Beijing Normal University, ChinaReviewed by:
Surya Prakash Tiwari, King Fahd University of Petroleum and Minerals, Saudi ArabiaCopyright © 2023 Wang, Wang, Khan, Zhou and Ke. This is an open-access article distributed under the terms of the Creative Commons Attribution License (CC BY). The use, distribution or reproduction in other forums is permitted, provided the original author(s) and the copyright owner(s) are credited and that the original publication in this journal is cited, in accordance with accepted academic practice. No use, distribution or reproduction is permitted which does not comply with these terms.
*Correspondence: Demin Zhou, emhvdWRlbWluQGNudS5lZHUuY24=; Yinghai Ke, eWtlQGNudS5lZHUuY24=
Disclaimer: All claims expressed in this article are solely those of the authors and do not necessarily represent those of their affiliated organizations, or those of the publisher, the editors and the reviewers. Any product that may be evaluated in this article or claim that may be made by its manufacturer is not guaranteed or endorsed by the publisher.
Research integrity at Frontiers
Learn more about the work of our research integrity team to safeguard the quality of each article we publish.