 Zhen Wang1
 Hao Zhang
 Wei Huang
 Xiao Chen
 Yuan An
- 1Faculty of Information Science and Engineering, Ocean University of China, Qingdao, China
- 2Open Studio for Marine High Frequency Communications, Pilot National Laboratory for Marine Science and Technology, Qingdao, China
Reverberation is the primary background interference of active sonar systems in shallow water environments, affecting target position detection accuracy. Reverberation suppression is a signal processing technique used to improve the clarity and accuracy of received signals by eliminating the echoes, reverberations, and noise that occur during underwater propagation. Existing reverberation suppression methods include algorithms based on Time-Frequency domain processing, noise reduction, adaptive filtering, and spectral subtraction, but their performance in high-reverberation environments (echo of small targets) still does not meet the requirements of target detection. To address the impact of high reverberation environments, we propose a structural suppression method based on the Wasserstein gradient penalty generative adversarial network (RSWGAN-GP). The reverberation suppression generation network uses a one-dimensional convolutional network structure to process normalized time-domain signals and achieves the reconstruction of the reverberation signal through Encoder-Decoder. The proposed method is verified through accurate and effective data collection during sea trials. Comparative results show that RSWGAN-GP effectively suppresses reverberation in observation signals with multiple bright spots, improving the signal-to-reverberation ratio by approximately 10 dB compared to other excellent algorithms and enhancing the information analysis and feature extraction capabilities of active sonar signals.
1 Introduction
Sonar can accurately detect fixed targets and determine target distance, it has poor concealment and limited range and is susceptible to reverberation interference. The detection signal emitted by active sonar encounters obstacles or targets in the propagation path of water, and is then affected by reflection, refraction, and scattering, resulting in signal delay and overlap. The signals are subsequently received at the receivers, forming echo signals with reverberation (Huang and Wang, 2019). The influence of reverberation on active sonar like synthetic aperture sonar (Zhang et al., 2023a; Zhang et al., 2023b), communication sonar (Yu et al., 2018), multibeam sonar (Neasham et al., 2007) and other active sonars should be completely reviewed. Underwater interface reverberation is an important factor limiting the detection performance of active sonar in shallow water environments. Unlike noise interference, reverberation has non-smooth statistical characteristics and is usually mixed with the target echo, which is challenging to distinguish (Faure, 1964).
Previous works on reverberation in signal processing mainly focus on the study of detectors under specific reverberation conditions (Bharathi and Mohanty, 2019) and the spatiotemporal distribution characteristics of reverberation; researchers have studied robust detection performance under various reverberation distribution conditions. Some researchers have attempted to reduce the effect of reverberation on target echo by designing a transmission waveform, such as frequency-hopping signals encoded with particular frequencies (Costas, 1984), Q-function sonar signals (Cox and Lai, 1994), and SFM signals (Ward, 2001). However, enough high frequency is needed to achieve a reverberation suppression effect, which leads to a low utilization rate of the low-frequency band and affects the range accuracy.
Some researchers study anti-reverberation processing on signals received by sonar. Marine reverberation has a strong temporal correlation with target echo signals.Target echo signals cannot be effectively found by regularly matched filtering methods as the two spectra overlap in the frequency domain. In order to improve the performance of coherent processing in reverberation, Kay et al. used the AR pre-whitening processing method to filter out reverberation as white noise under certain conditions (Kay and Salisbury, 1990). Higher gain and more effectively detected target echoes can be obtained through matched filter by Wu et al. (Wu et al., 2018), but local stationarity of the reverberation is required as a premise (Widrow et al., 1967), which is widely used in ALE (Adaptive Line Enhancement) algorithm (Ma et al., 2021). However, it has strict requirements for the channel environment. H.M. Ozaktas and L.B. Almeida filtered the signal based on the time-frequency focus difference between the echo and reverberation in the Fourier transform domain to achieve reverberation suppression (Ozaktas et al., 1996; Zhang et al., 2019; Mejjaoli and Omri, 2020). However, The LMS algorithm performs adaptive filtering based on the error between input and output of the channel, which has strict requirements on the channel environment. Freburger et al. used the principal component inversion algorithm to project the received signal into two subspaces based on the power difference between different backgrounds, thereby achieving reverberation separation (Freburger and Tufts, 1997). When the power of the target echo signal is similar to that of the reverberation signal, distinguishing between the two becomes difficult.
With the development of artificial intelligence (AI) technology, deep neural networks have brought new research ideas to solve the shallow sea sonar reverberation problem. As a hot research direction in the field of machine learning, GAN (Ashraf et al., 2021) has become a popular model in the field of deep learning due to its advantages of generating high-quality samples, learning unlabeled data, supporting multi-modal data and innovation (Zhan et al., 2019) (Dong and Yang, 2018). Recently, Gans have evolved from image generation to reverberation data generation Hu et al. (2023). Gans are also used to generate spatial impulse responses, with the aim of enhancing high-quality RIRs with existing real RIRs (Ratnarajah et al., 2023). In the field of underwater acoustic engineering, it is theoretically feasible to use GAN for active sonar reverberation suppression to solve the problem of reverberation suppression under high reverberation environment.
This paper proposes a Wasserstein generative adversarial network model with a gradient penalty (RSWGAN-GP) to solve reverberation suppression of sonar signals. Sonar signals are different from the picture, and a one-dimensional convolutional approach is built in this paper to process the signal data. The generation side of the adversarial network is made according to the U-net network (Ronneberger et al., 2015) to encode the original reverberation signal data, and the decoder generates the anti-reverberant signal data. The discriminator uses the design idea of SkipNet (Abrahamyan et al., 2021) that the discriminator to achieve a balance of speed and accuracy. In order to realize the fast and accurate training of the countermeasure network, the structure design referred to WGAN-GP comprehensively. In the experiment, simulation is used to supplement the data set to solve the difficulty of Marine experiment data sampling and insufficient data set. Our main contributions are concluded as follows:
1) In order to solve the difficulty of feature extraction in a reverberation environment, we propose a Wasserstein generative adversarial network model with a gradient penalty method
2) Underwater active sonar reverberation simulation with echo targets is proposed to obtain many marine reverberation signals, solving the problem of insufficient training sets.
The rest of the article is organized as follows. Section 2 starts with a brief review of some related works. In Section 3, some data preliminary work is presented, which includes RSWGAN-GP reverberation data generation, signal time gain control, and automatic gain control. In Section 4, the reverberation suppression method based on RSWGAN-GP is proposed, and the generation network, discrimination network, and error loss are explained respectively. In Section 5, experiments are given to verify the effectiveness of the method, and in Section 6, conclusions are given. In active sonar, the commonly used detection signals include single continuous wave (CW), LFM, NLFM, BPSK and other signals. In this paper, the research object of active sonar signal feature enhancement is selected as the typical CW signal for research.
2 Related works
2.1 Reverberation suppression methods
Traditional methods for reverberation suppression typically focus on mapping the feature subspace. The differences between reverberation and target echoes have been investigated in the domains of Doppler space, discrete wavelet, and fractional Fourier. Previous research provides essential features for reducing reverberation and aiding target detection. For moving targets, in particular, target tracking can achieve reverberation suppression. However, these methods could be limited in low signal-to-reverberation ratio (SRR) and high reverberation scenes. When the echo of a tiny target is received, the target’s echo is weak and covered by reverberation, and its feature subspace is weak and difficult to find.
Low-rank and sparsity theories developed a decade ago have found wide applications in image processing for tasks such as background modeling, camera calibration, and optical character recognition (Chandrasekaran et al., 2011). They have also been introduced to underwater acoustic engineering for reverberation suppression and target detection (Qian and Cao, 2019). In the case of fixed-position active sonar, the received signal from multiple pings exhibits significant stationarity. Considering the echo data from a single ping as a frame, multiple frames can be constructed over time and decomposed into dynamic and steady components. The steady components display similar strength distributions over time and can be viewed as a low-rank matrix. On the other hand, the dynamic components, consisting of reverberation fluctuations and target echoes, can be treated as a sparse matrix.
Consequently, reverberation suppression methods based on low-rank and sparse matrix decomposition have been proposed. These include techniques such as non-negative matrix factorization, principal component analysis, and robust principal component analysis (RPCA) (Chalapathy et al., 2017). For the implementation of processing large matrix factorization, alternative methods have been developed to expedite the process, such as accelerated proximal gradient, augmented Lagrange multiplier, and alternate direction multiplier methods (ADMM) (LiXiukun et al., 2015). Zhu et al. applied low-rank and sparse matrix estimation to decompose received data, enhancing reverberation suppression techniques’ robustness (Zhu et al., 2022).
These reverberation suppression methods can achieve the purpose of reverb suppression to a certain extent. However, they still perform limited at a low signal-to-reverberation ratio.
2.2 Application of artificial intelligence in reverberation suppression
With the development and rise of artificial intelligence in recent years, algorithms combining artificial intelligence with anti-reverberation technology continue to surge, such as support vector machines, CNN (Song et al., 2019), RNN (Chen et al., 2022), and GAN In the beginning, it was simply a simple addition to machine learning. For example, Zhu et al. designed a feature kernel function SVM based on the non-Gaussian difference between reverberation and target echo to detect the signal in the reverberation background. This method improves the recognition quality of reverberant background, and its effect is better than the adaptive filtering algorithm (Wu et al., 2008). Jiang Keyu et al. processed the lake test data (Jiang et al., 2007) and used RBF neural network to detect the target echo in reverberation to be better. Xiang et al. proposed a reverberation suppression method for underwater moving target detection based on a robust autoencoder (Zhu and Sun, 2008). Xiao et al. proposed an ABNN focusing on the frequency domain characteristics of the target, which suppresses environmental noise and ship interference and makes the accuracy of target detection and recognition higher (Xiao et al., 2021).
The deep learning technology’s continuous development and innovation, many neural network architectures with good performance and robust stability have emerged. For instance, multilayer perceptrons (MLP) and long short-term memory (LSTM) networks have been developed to learn mappings from a window of reverberated frames (or “context” windows) to a source frame, thus learning to deliberate by inverse transformations Han et al. (2015); Wang et al. (2017); Wuth et al. (2020). Additionally, Zhao et al. Zhao et al. (2018) proposed an LSTM-based late reverberation suppression strategy that learned the difference between the source and reverberated signals; therefore, dereverberation is performed by subtracting the late reverberation estimation from the observed reverberated signal.
The application of deep learning provides another effective method for reverberation suppression. Artificial intelligence has relatively excellent performance and effect. It can achieve many effects that cannot be achieved by traditional methods, which makes the development of anti-reverberation technology in recent years mainly biased to- wards the direction of artificial intelligence.
The above studies show that the combination of deep learning has specific feasibility for sonar signal reverberation suppression. However, reverberation suppression still needs to be improved under high reverberation environments and different underwater signal environments. At the same time, the extraction ability of effective information in the signal still cannot meet the needs of the complex environment.
2.3 The relationship between artificial intelligence methods and traditional methods
In terms of underwater reverberation suppression, the initial reference of artificial intelligence (AI) and machine learning methods is to make up for the shortcomings of traditional methods and complement and combine them. In a new study, it was found that artificial intelligence could complete the task better to replace it entirely (Koh et al., 2020).
Traditional methods are mainly based on signal processing and digital filtering techniques, which involve preprocessing, filtering, and noise reduction operations to suppress reverberation in underwater sound signals (Singer et al., 2009). These methods often rely on domain knowledge and expertise to analyze and model the reverberation characteristics, followed by the design of corresponding algorithms for processing. While traditional methods can reduce the impact of underwater reverberation, their effectiveness is limited when dealing with complex reverberation environments and signals.
AI methods, on the other hand, utilize machine learning and deep learning techniques to learn and recognize reverberation features and perform suppression automatically (Hao et al., 2023). By training models with large amounts of data, AI methods can possess more substantial generalization and adaptability, making them capable of handling more complex underwater reverberation environments and signals. Compared to traditional methods, AI methods exhibit higher levels of automation and intelligence in underwater reverberation suppression.
Traditional methods and AI methods can be combined in the context of underwater reverberation suppression. Traditional methods can provide basic processing techniques and approaches for preprocessing and initial reverberation suppression, which AI methods can further optimize and enhance (Yin et al., 2023). For instance, traditional methods can be used for filtering and noise reduction of underwater sound signals, and the processed signals can be used as training data for training AI models to achieve better reverberation suppression.
In the current research, some scholars have found that traditional methods and artificial intelligence methods are complementary in terms of underwater reverberation suppression and can be combined. Other scholars have used AI alone to replace traditional methods and improve reverberation suppression (Weiss et al., 2023).
3 Preliminary
After the signal is received, the received signal will be processed by the active sonar system. In this part, the hardware implementation of the processing will be reproduced by the following algorithm. At the same time, the signals that generate the training set data will be processed in the same way.
The active sonar device processes the received signal in the following way. After the hardware receives the sonar signal, the sonar signal will go through time-varying gain and automatic signal gain control processing so that the long-distance echo signal power is stronger and more convenient for subsequent processing. After processing, the generated training set is closer to the actual data. Figure 1 shows the signal state of each process.
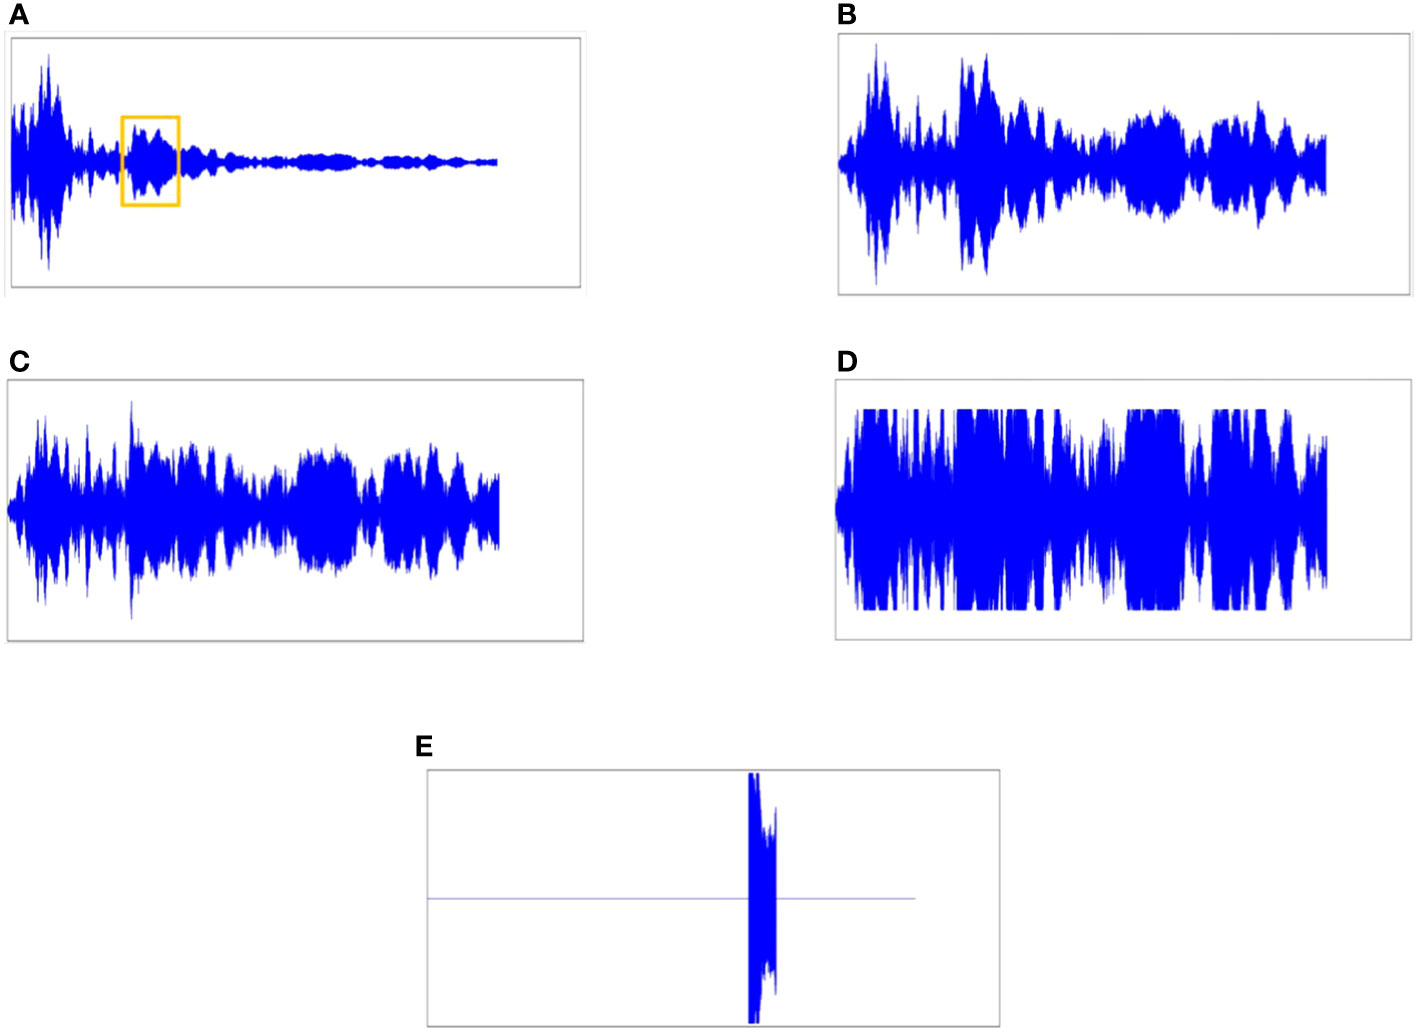
Figure 1 Signal processing. (A) The echo received by the active sonar system. (B) The echo signal is processed by TVG. (C) The echo signal is processed by AGC. (D) The echo signal received and processed by sonar. (E) Target echo signal hidden in sonar signal.
The processing of the signal in the hardware device after receiving is shown in Figures 1B–D, and the signal processing process will be explained below.
The echo received by the active sonar system, and the generated echo signal with target information in Section 4.1 are shown in Figure 1A, and the circled position is the target echo.Time-Variable Gain (TVG) Innami and Kasai (2012). According to the sonar equation, it can be obtained that the echo margin of the sonar is determined by the difference between the echo signal level and the background interference level.
In Eq. (1), DT represents the detection threshold and is the strength of the echo signal received by the sonar, TL represents the propagation loss because the active sonar is bidirectional, so 2TL defines its complete propagation loss; SL represents the sound source level; NL represents the noise level; DI represents the directivity index; TS represents the target strength. For most sonar systems, including multibeam sonar, the propagation loss (TL) is compensated by the TVG device inside the receiver. The ideal TVG curve should follow the expectation of sonar propagation loss, i.e.
In Eq. (2), r represents the action distance, and a is the loss factor, a function of frequency. Figure 1B shows that the signal passes through the TVG and that the distant signal is no longer attenuated as the distance increases.
Signal Automatic Gain Control (AGC) (Zhang et al., 2017). In practice, automatic gain control is typically implemented through circuit design. However, AGC needs to be implemented for the experimental simulation of the sonar data set. The signal adjustment must be automatically adjusted based on the input and output data size, which initially requires numerous logarithmic operations. In order to implement these operations are avoided, a simple comparison operation is used with a gain lookup table instead. The algorithm can be described as follows.
The left side is transformed into the adjusted value between two adjacent gain coefficients G(n + 1) and G(n) in dB format for better clarity. Following the estimation of the average power of the output signal, a comparison is made with the reference power to determine the appropriate method for adjusting the gain coefficient based on the outcome of this comparison. In Figure 1C, the AGC equalizes the signal strength and partially suppresses reverberation through processing. There are hardware limitations to consider in practical usage. The hardware restricts the received signal and simulates how the part of the signal that exceeds the limit would appear. Figure 1D illustrates this simulation. Figure 1E displays the desired output result of the network, which will be utilized to calculate the Jensen-Shannon Divergence (JSD), aiming to bring the output result closer to it.
In both experimental and simulation data, some signals exhibit peak clipping phenomena and cannot be restored to complete sine waves, making traditional methods ineffective. After undergoing the above (B), (C), and (D) processing and normalization, the simulated signal has inputs with the same dynamic range.
4 Reverberation suppression in RSWGAN-GP
In order to solve the problem of limited suppression effect in a high reverberation environment, a reverberation suppression framework based on the Generative adversarial network is proposed. A nonlinear mapping from the sonar detection signal with reverberation to the sonar signal with reverberation suppression is established, where the input data is the signal propagation time series. The output is the corresponding time series after reverberation suppression. Due to the scarcity of actual data with reverberation signals, the training of RSWGAN-GP will face the problem of overfitting, reducing its generalization performance. To this end, the generation of virtual reverberation data is implemented in this section by combining statistical modeling and a multi-highlight model. The training data set is expanded by mixing real and virtual reverberation data while ensuring the consistency of its distribution pattern. Then, the theoretical signal gain control was calculated by signal propagation theory to form a time series signal for artificial intelligence model learning. The implementation of this part is shown in Figure 2.
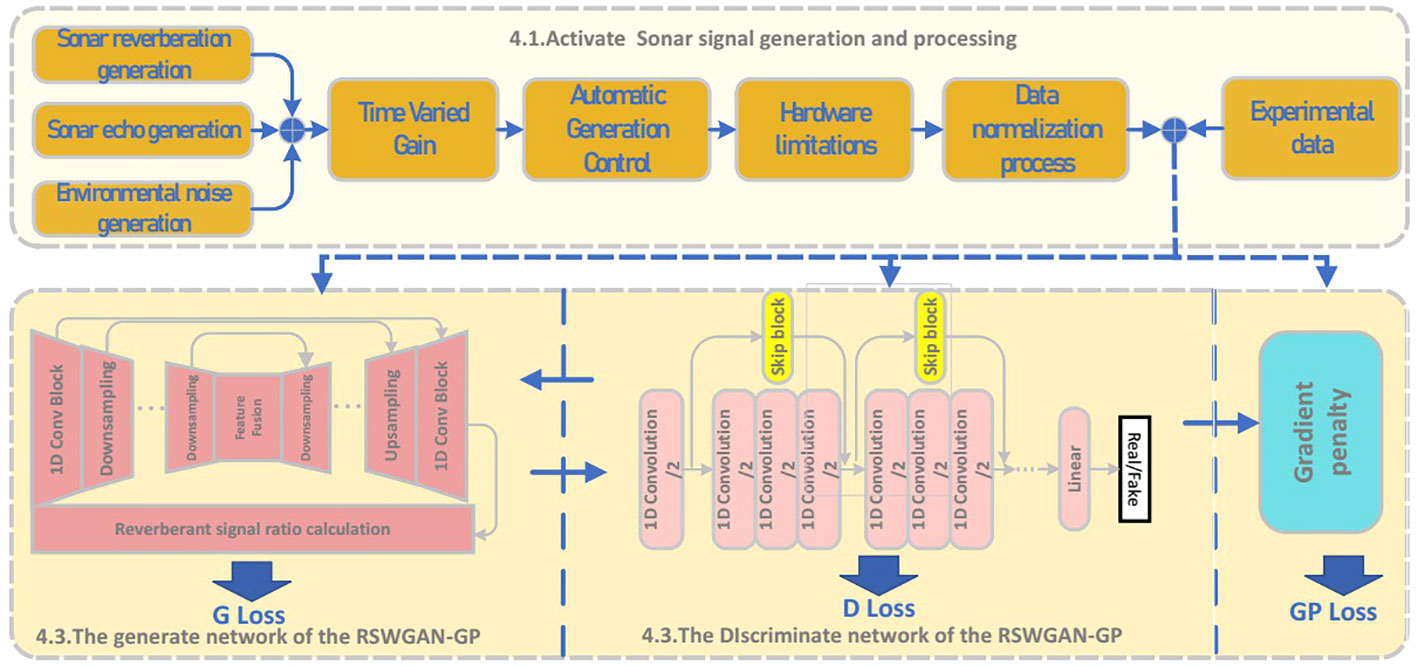
Figure 2 Reverberation suppression RSWGAN-GP construction.
The data generated in Part 4.1 is mixed with real data for Part 4.3, 4.4, and the gradient penalty part is invoked for training.
4.1 Underwater active sonar reverberation simulation
Underwater reverberation consists of volume reverberation, surface reverberation, and submarine reverberation. Sea surface reverberation and submarine reverberation are collectively referred to as interface reverberation.
To model the network, a significant amount of experimental data is necessary. Therefore, in this paper, we will simulate sonar reverberation data. The reverberation simulation comprises three parts: the generation of reverberation, the simulation of echoes, and environmental noise simulation.
As shown in Figure 3, at Point M, a non-directional signal is emitted to activate the ring energizer.. The reverberation model is illustrated in the figure. Point M represents the transducer, the distance from M to the interface xoy is h, and the signal is emitted without any specific direction. At time t, the ring of scatterers contributing to the reverberation is inside the ring. (Sun et al., 2010).
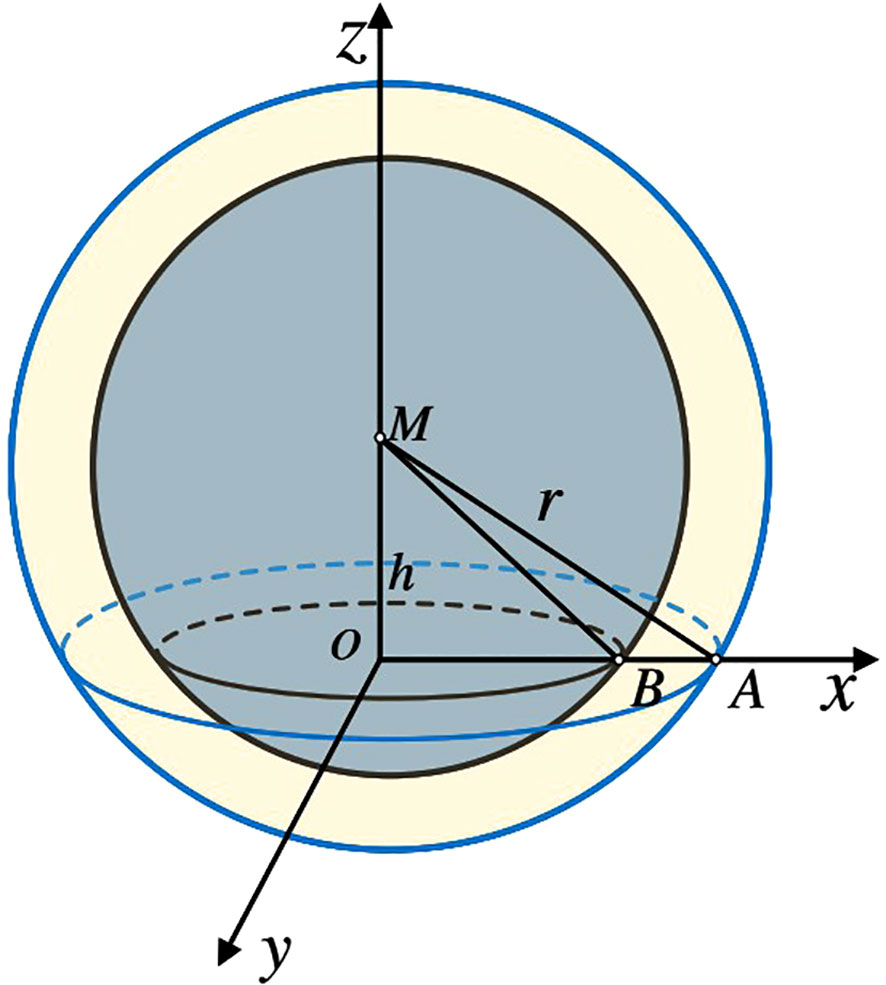
Figure 3 Reverberation model.
It is assumed that the number of scatterers generating reverberation on the i-th ring is . The emitted signal is denoted as , and its strength is A. The length of the MA is represented by r, and the wave number is k, where . The speed of sound in the ocean is represented as c, and the scattering coefficient of the q-th scatterer is . Where , , the ring area . If the unit area is , so the number of scatterers contributing to the reverberation in the ith ring is N, , and denotes the integer command, . Therefore, the scattering characteristic function at time t can be expressed as:
where represents the amplitude and represents the phaseain, and in are both random numbers following the Gaussian distribution with the constraint of, , . The process of generating reverberation involves convolving the emission signal with the scattering characteristic function. Therefore, the reverberation at time t can be expressed as the following formula:
Active sonar is utilized for detecting underwater targets, which involves reverberation and capturing the target echo signal. When the sonar signal hits the object, it generates a new echo through the multi-point superposition of the target body, enabling the active sonar to receive it (Hodges, 2011).
In addition to reverberation noise, target echo is an essential component of active sonar signals. The sonar is assumed to have an array of elements for reception. The target echo signal received by the m-th array element can be expressed as:
In Eq. (7) the coordinate of the m-th array element is represented by a vector . represents the number of highlights of the target, represents the reflection coefficient of the i-th highlight, represents the envelope of the transmitted signal, represents the time delay experienced by the sound wave incident on the i-th highlight and then reflected the m-th array element, represents the angular frequency change of the sound wave irradiated to the i-th highlight and then reflected the m-th array element, represents the Doppler shift, and represents the random phase shift of the i-th highlight echo, uniformly distributed between . Different objects can be simulated by adjusting the number of highlights.
For environmental noise simulation, the spatial and physical characteristics of the Marine environment are complex, and the noise level depends on mixing multiple noise sources. This paper adopts an AR modeling method to simulate and synthesize Marine environmental noise (Chen et al., 2018). Firstly, an uncorrelated Gaussian white noise sequence v(n) is generated, and the Marine environmental noise can be obtained by passing v(n) through an AR filter with a specific temporal correlation. Mark the Marine environmental noise as W(n), then the generation process of Marine environmental noise is shown in Eq. (8):
represents the order of the AR filter, Gaussian white noise, and represents variance of Marine ambient noise.AR filter coefficients and can be solved by Levinson-Durbin (Diniz et al., 2010) method.
The data generated by the above three equations are normalized respectively, and the corresponding weight is assigned. The obtained signal is denoted as S(t), and the obtained signal is shown in Figure 1A, where the signal marked in the yellow box represents the echo position of the target.
Here, represents the trade-off between and . is an adjustable parameter that controls the degree of the strength fluctuation. Through the adjustment of parameters and , enable diversity in the data set, the desired SIR (Signal to interference ratio, ) and SINR (Signal to interference plus noise ratio, ) are achieved, where represents power.
4.2 Implementation mechanism of the generative adversarial network
GAN is an effective data generation network, including Generator (G) and Discriminator (D). The G-analysis process is a minimal game process, and the discriminator and generator finally reach Nash equilibrium.
The adversarial training optimization process for generators and discriminators can be expressed as follows:
In Eq. (9), x is the actual data, is the actual data distribution, is the generated data distribution. The objective function expressed by minG maxD V (G,D) is to minimize the JSD between the expectation data distribution Prand the generated data distribution, provided that the D is optimal.
In that case, the JSD cannot measure the distance between the generated and actual data distribution. Training the GAN by optimizing the JSD will result in not finding the correct optimization target, which is prone to the problem of unstable training gradient and model collapse.
In order to solve the problems mentioned above, the Wasserstein Generative Adversarial (Wasserstein GAN, WGAN) network proposes to use Wasserstein distance as an optimization method for training GANs. To satisfy the Lipschitz continuity, WGAN limits the weights to a specific range to enforce the Lipschitz continuity, but it is leads to poor generation results. WGAN-GP is a gradient penalty-based WGAN. WGAN-GP improves the Lipschitz continuity constraint by using gradient penalty instead of weight clipping in WGAN.
The objective function of WGAN-GP is:
In the formula, is the gradient penalty term coefficient, is the sampling distribution of the gradient penalty term, the discriminator maximization maxD V (G,D), and the generator minimization minG L(G,D).WGAN-GP provides a stable training method that requires little parameter tuning to solve training gradient disappearance and gradient explosion.
4.3 Reverberation suppression generator network
In the previous step, the shape of processed data is , meaning that there are test data of length N. B is divided into multiple b. Our goal is to separate a mixture signal into K source signals with for all , K is set to 1 by default in this paper, B as the batch size at training time and and as the respectivenumbers of signal length. For model variants with no extra input context, we have and make predictions for the echo part of the input. Here we input the data S into the neural network structure and perform feature extraction on the data. It is divided into two parts to introduce the G network. The first part is the realization of data crop and concat, and the second part will introduce the whole generator network.
4.3.1 Data concatenation
It is challenging work to extract sonar signal features using one-dimensional convolution. A well-designed deep network structure is crucial for obtaining more valuable dataset recognition features. As the number of network layers increases, training deep networks becomes labor-intensive due to the common insurmountable problem. To address this issue, optimizing data concatenation when passing network parameters can be more effective. The implementation of this approach in the paper is shown in Figure 4.
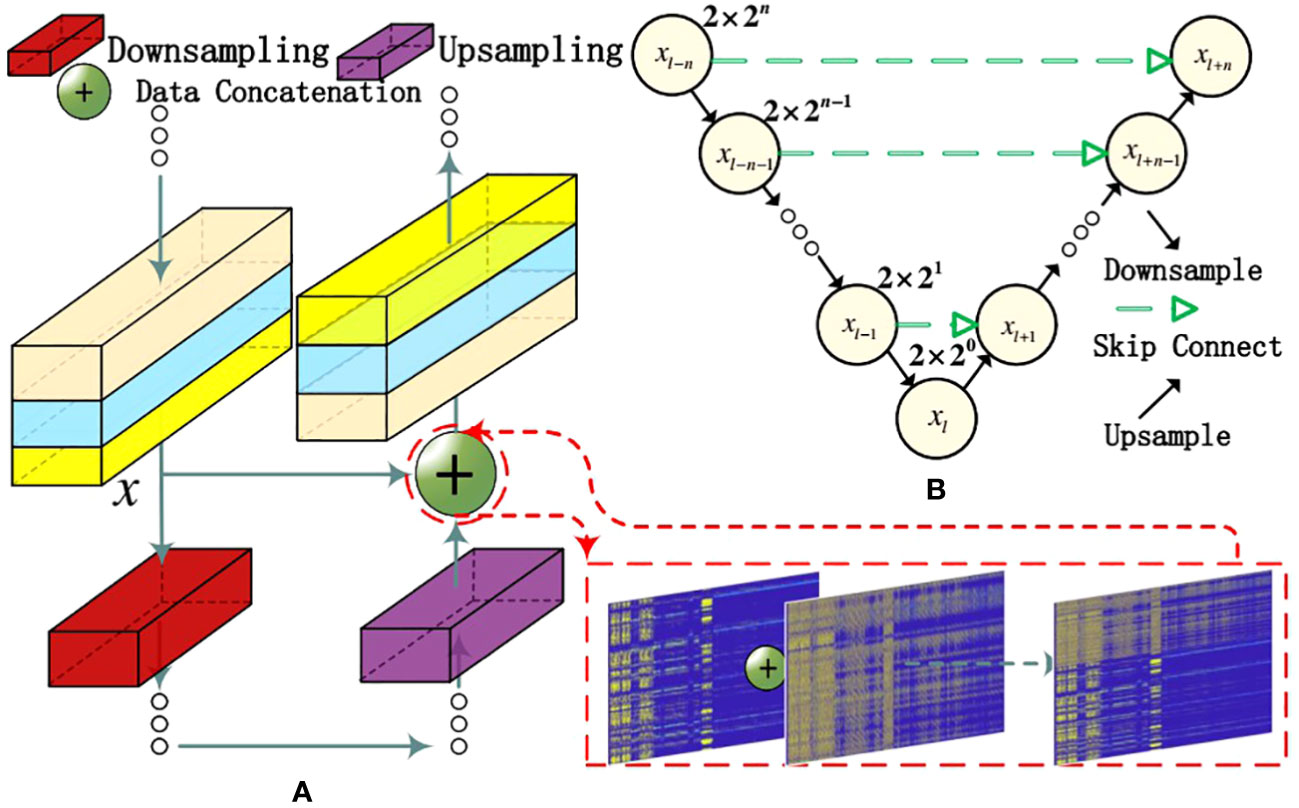
Figure 4 Data concatenation. (A) There are changes in the signal data processing process. (B) Show the process of signal data transmission.
In Figure 4, the signal feature x is passed from the previous layer and is processed by the layers to obtain the data . processes x through another branch line to obtain the result . Then, the result is obtained, and subsequent processing continues, done to prevent the loss of original features after multiple convolutions. The convolution of the branch is used to process the data and obtain the final data. In Figure 4A, the data crop operation is equivalent to , which is the operation of skip connect in Figure 4B.
The network construction will be built with network blocks and have the u-net network structure. The network has layers, and each layer is labelled , where .
For a stacked-layer structure (consisting of several stacked layers), the learned feature is recorded as when the input is x. When is 0, the accumulation layer only performs identity mapping, and the network performance will not be degraded. It allows the accumulation layer to learn new features based on the input features, resulting in better performance. A convolutional block of length can be expressed as:
The convolution result can be obtained by iteratively convolving the output x from block to block, where ranges from to . The input and output of the formula are represented by , and each residual unit typically contains a multi-layer structure. is the downsampling block function, is the upsampling block function, representing the learned residual, and represents the identity mapping. The learned features from the shallow layer to the deep layer are expressed as:
The determination of L depends on the shortest distance detected by the sonar, that is, the number of data points N processed by the sonar equipment. The size of L can be solved by the formula , where is the sampling rate of the active sonar brother and c represents the speed of sound propagation in water (m/s).
4.3.2 The generator network structure of RSWGAN-GP
The generator side of RSWGAN-GP is called G, which is constructed by a U-shaped network. It utilizes a one-dimensional convolution network that convolves specifically on signals while adding skip connections based on their original basis to enhance accuracy in signal feature extraction, as shown in Figure 5.
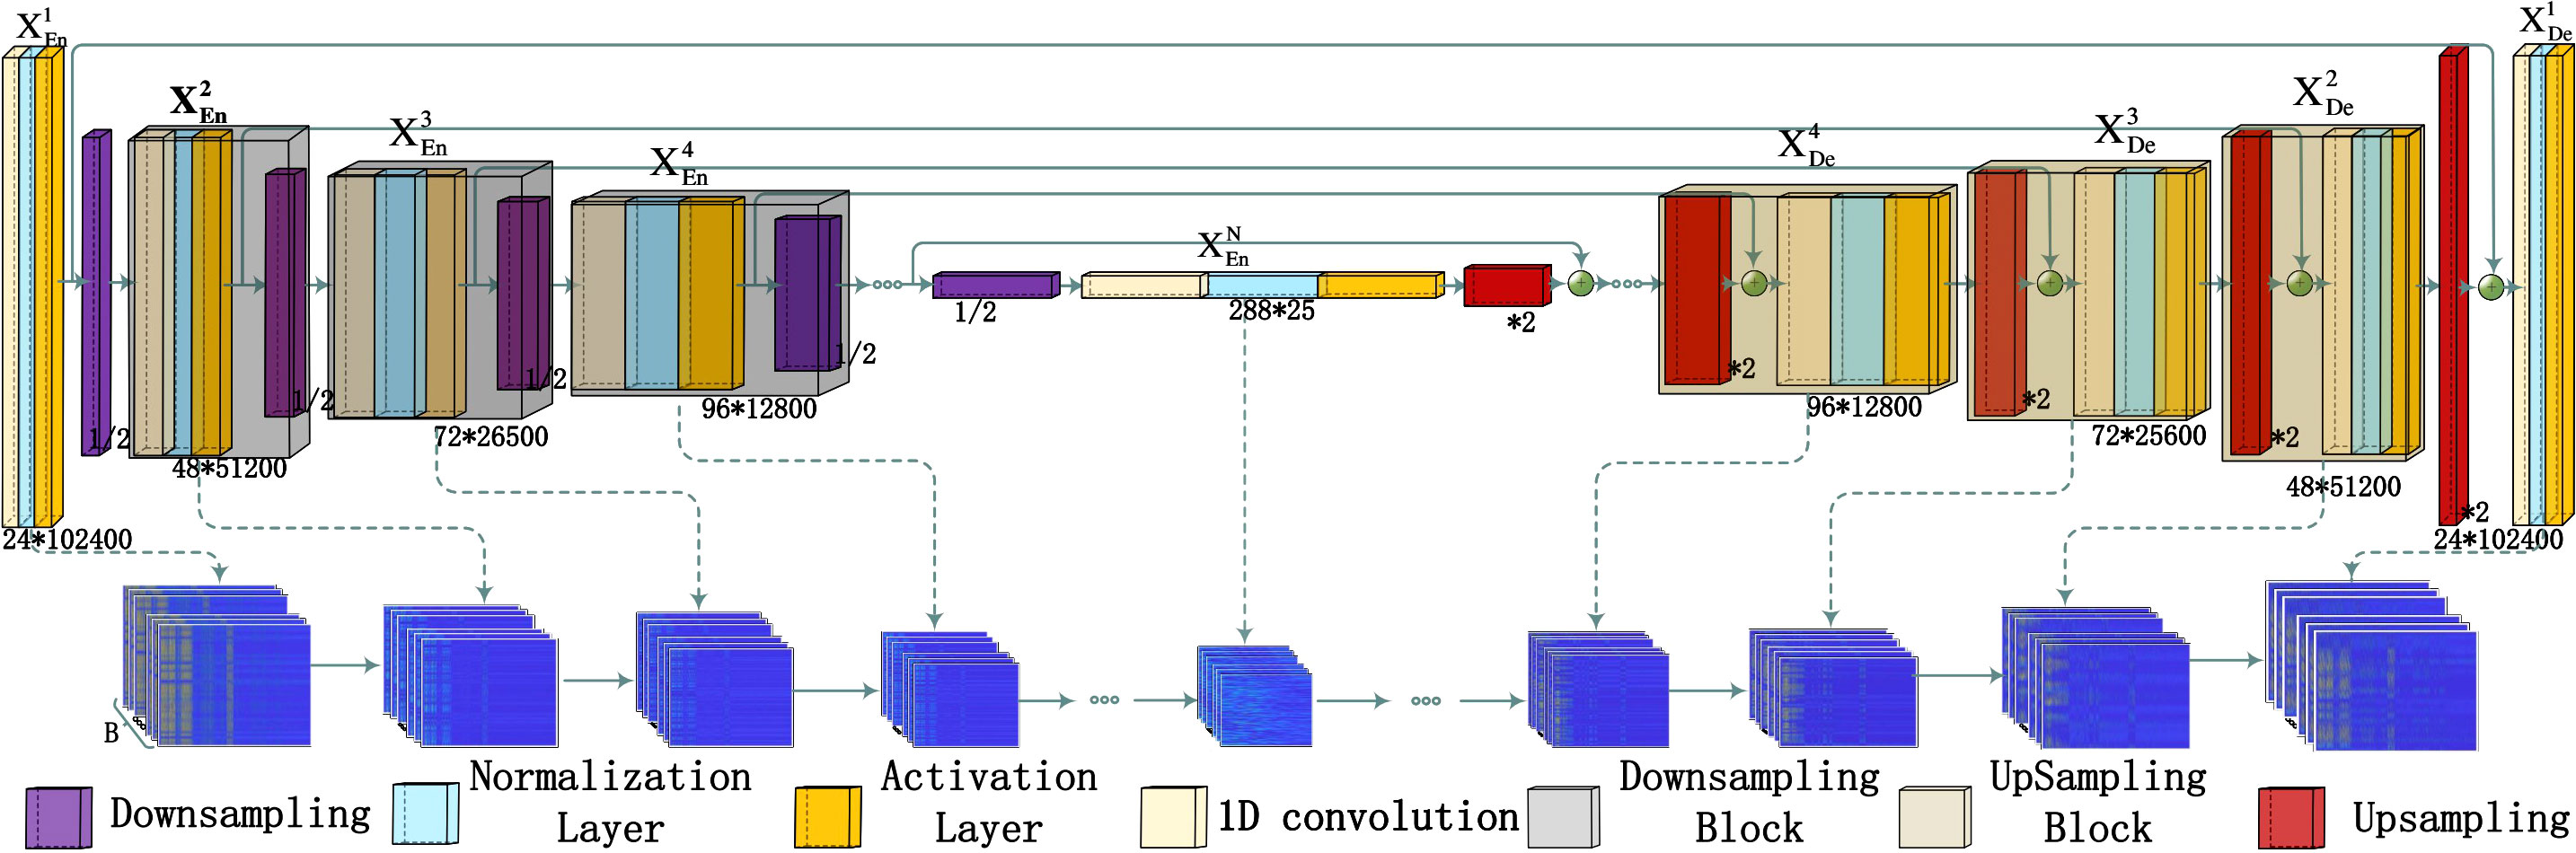
Figure 5 Generator network.
As shown in Figure 5, the signal data S is directly input into the encoder layer to start the one-dimensional convolution operation. The network structure’s transmission process and main characteristics are shown in the figure, where G isspecially designed for processing sonar acoustic signals. The role of the encoder is to transform the input sequence into a low-dimensional representation that can capture the critical features of the input sequence. The decoder transforms the encoding vector into the target sequence and dynamically generates the content related to the target, as shown at . The decoder receives the feature map from the same-scale encoder layer directly. Its data scale will not change, still . The convolution of multiple neural networks may weaken data features with the increase of convolutional layers, so the data crop structure is utilized to reduce the loss of information, as shown in Figure 4.
In the generation part of the RSWGAN-gp network, we formulate the network running result as follows: let i indexes the down-sampling layer along the encoder, N refers to the total number of the encoder. The stack of feature maps represented by , is computed as:
Where function denotes a convolution operation, realizes the feature aggregation mechanism with a convolution followed by a batch normalization and a Leaky-ReLU activation function. and indicate up- and down-sampling operation respectively, and represents the concatenation.
The convolution operation of the signal is shown in the following formula:
Where and are inputs, outputs and weight parameters, respectively; is the size of a single kernel; K is the number of kernels. Here, the kernel size of is shared for the whole input feature maps, called weight sharing.
It is worth mentioning that our proposed generator network is more efficient with fewer parameters. As for the decoder of the generator part, the depth of the feature map in a generation is symmetric to the encoder, and thus , also has , channels. The number of parameters in decoder stage of can be computed as:
where is the convolution kernel size, denotes the depth of the nodes.
In G, the convolution with a stride of 1 maintains the output length equal to the input length. A downsampling method is employed to increase the receptive field of the original data by . The signal data is downsampled to . After convolving the data to obtain its minimum scale, corresponding upsampling is used along with interpolation to restore the data to its original scale. The signal is transformed from to after processing, while the signal length remains unchanged.
The network is symmetric, with the first half using downsampling and the second half using upsampling. The network’s construction affects the length of data processing and the shortest distance for processing sonar signals. When the downsampling block has L layers, the number of input points is at least . An 11-layer symmetric network structure is used in the experiments, so the minimum input signal points are . However, if only the signal data with a length of 2048 is input, it will output only one value after 11 downsamplings, leading to less feature representation. For to be greater than 1 in the middle of the convolution, the data signal length for training should be at least . The shortest detection distance of convolution is , and its formula is as follows:
Where Fs stands for the sampling frequency, based on the example calculation, we can determine that the shortest detection range of the active sonar after processing is 12.3m in the network constructed with an 11-layer downsampling block.
4.4 Reverberation suppression discriminator network
This section describes the discriminator part of building the adversarial network (D). The discriminator plays a crucial role in the GAN. It helps the generator to generate more realistic signals after the downsample (achieving unity in the frequency domain). It improves the GAN’s ability to understand the training data, which lays the foundation for generating higher-quality sonar signals. In this will generate the signal and the required input. In order to improve the accuracy of D, a one-dimensional convolutional discriminator network of SkipNet suitable for underwater acoustic signals is constructed by referring to the DenseNet Gao et al. (2020) structure. The main structure and the overall structure are introduced in the following.
When training the network, the complexity of the GAN network will bring problems such as long training time and difficulty in discovering signal features. The discriminator network uses traditional convolution to process longer underwater acoustic signals, which requires the design of a deeper network, which wastes time and may lead to feature disappearance and network degradation problems. Introducing SkipNet blocks can reduce the construction of network depth and training time. The skip connection makes it a flexible and efficient neural network architecture with good accuracy and resource efficiency performance.
In the more compact convolution, where rich features are less readily available due to the limited number of parameters, the different features that emerge from activation map-pings derived from data points during model inference may indicate the existence of a set of unique descriptors that are necessary to distinguish between different classes of objects. In contrast, data points with low feature diversity may need to provide sufficient unique descriptors to make valid predictions, called random predictions. Random prediction can negatively affect the optimization process and impair the final performance. This paper presents a series of Skipnet block models structured to fuse the previously convolved information using a skip net whenever a portion of the convolution passes to show the importance of diversity.
As shown in Figure 6, After downsampling the signal, the signal features will be put into the next layer and skipnet for multiple convolution. Finally, the results of two parts will be added. The feature signal obtained by addition is subjected to the same processing after downsampling once. This can be expressed using the following formula:
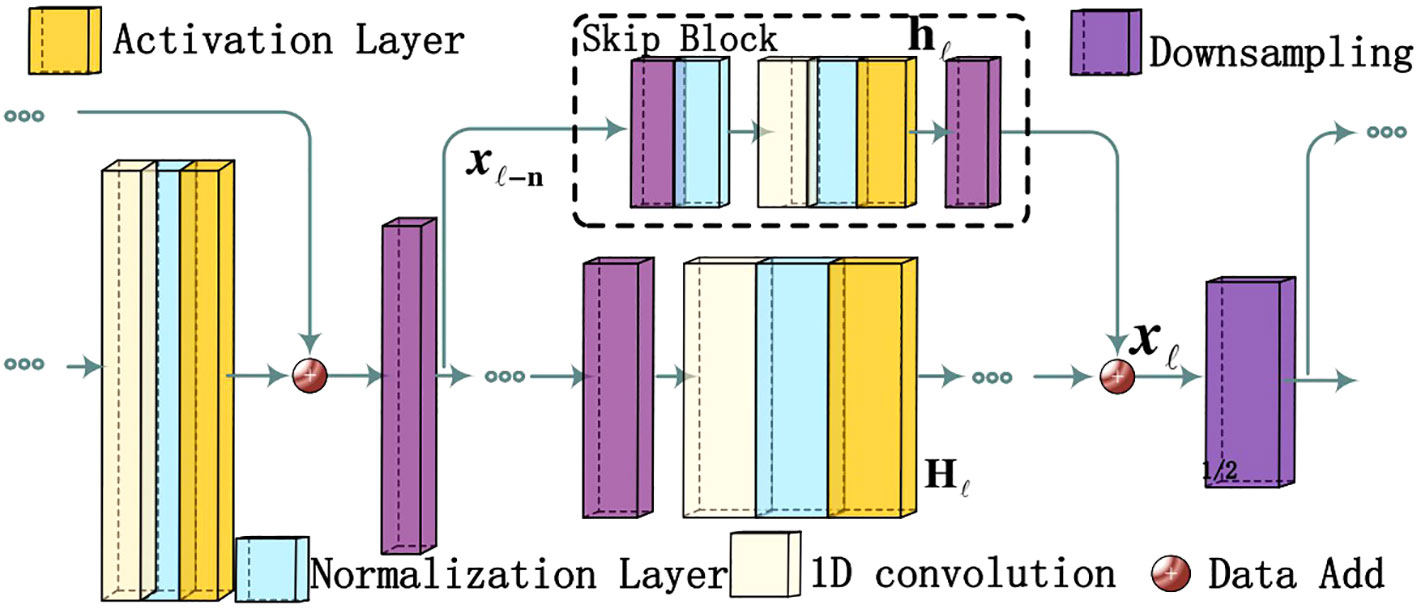
Figure 6 Discriminator SkipNet.
In Eq. (20), X represents the feature data after the convolution operation. stands for SkipBlock, which can be expressed as , and H stands for the main convolution process. adds the results above the main line and the sideline.
The RSWGAN-GP network uses convolution with a skip network with skipBlock to implement the discriminative signal network. Due to the difference between signal and image processing, the feature extraction is carried out in the form of one-dimensional convolution, and the subsequent dimension reduction processing is transformed from pooling to down-sampling processing, which is more suitable for the processing of signal features Nakaoka et al. (2021). Figure 7 shows the implementation of the discriminative signal network.
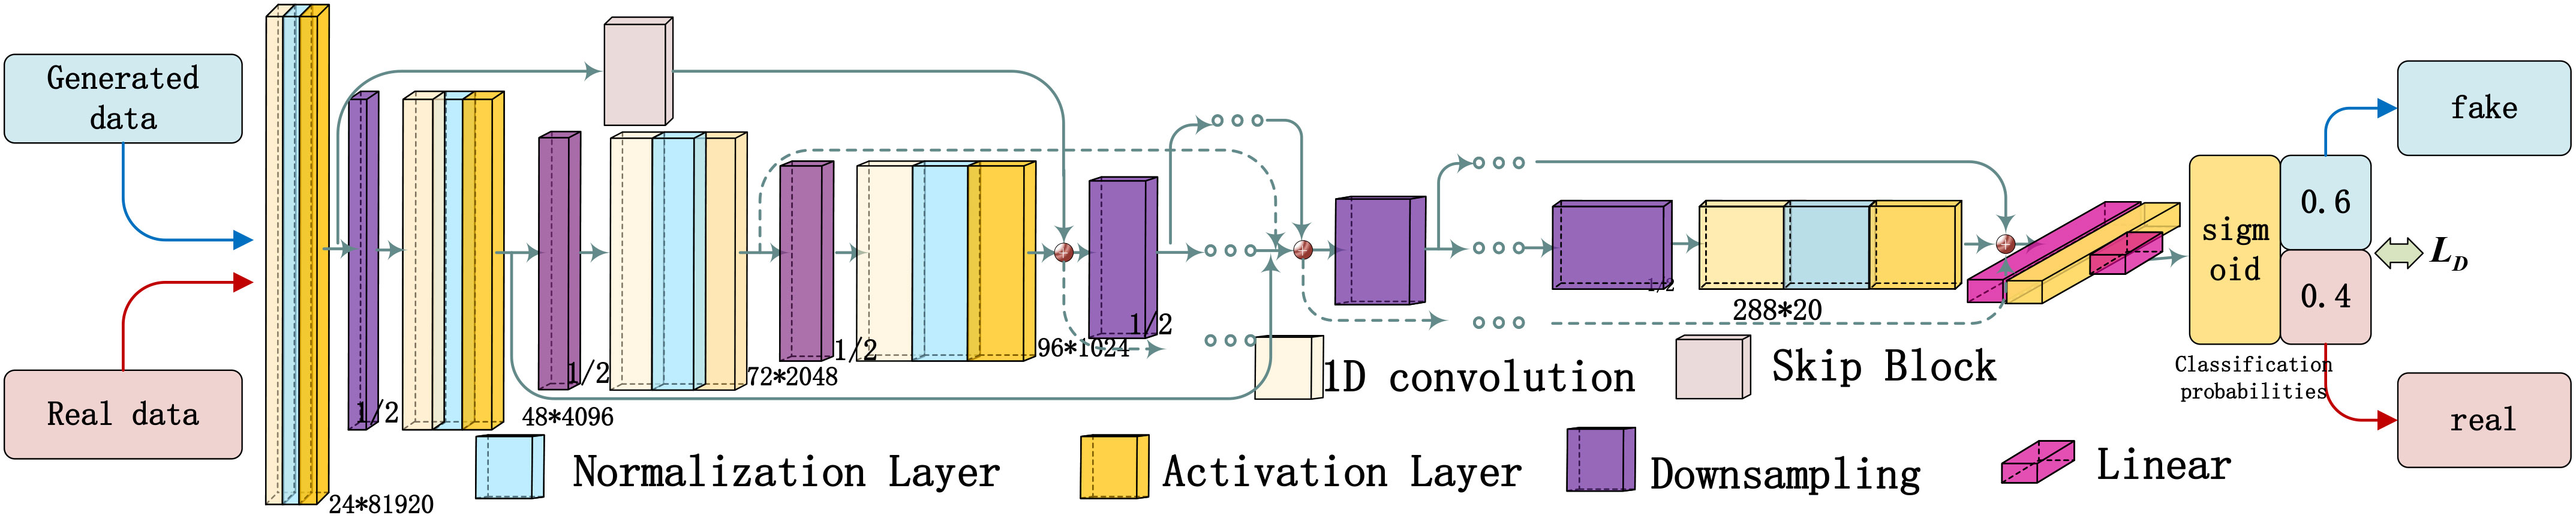
Figure 7 Discriminator network.
In the discriminator network, the generator G is initialized and given a reverberation signal data vector as input. The generator generates signals based on the mapping of the input vector, creating generated data. The discriminator network then judges and identifies the generated data, producing a classification probability that results in a judgment (true or false). During discriminator training, actual data is also inputted to train the discriminator. The de-reverberation signal is labeled 1 (effective reverberation suppression), while the signal without effective reverberation suppression is labeled 0. The loss LDis generated based on the generated result. In this paper, a non-densely connected network is designed to avoid redundancy and too many parameters in the signal processing network. The Desenet is designed without dense connections. Sparse connections are used instead, maintaining the same effect.
When the signal generated by the generator network meets the requirements of the signal-to-reverberation ratio, the generator network will stop training, and the final signal generator is the underwater reverberation suppression model.
4.5 Loss functions
This section presents the calculation of reverberation suppression loss for RSWGAN-GP. Due to the sinusoidal signal characteristics and the influence of phase difference, the original WGAN-GP calculation method cannot converge the training results. Therefore, a new method is used to preprocess the loss calculation before training.
This paper gives the main parameters of the generation network and the discriminant network used in the paper. The main parameters of the network will be described in Tables 1, 2.
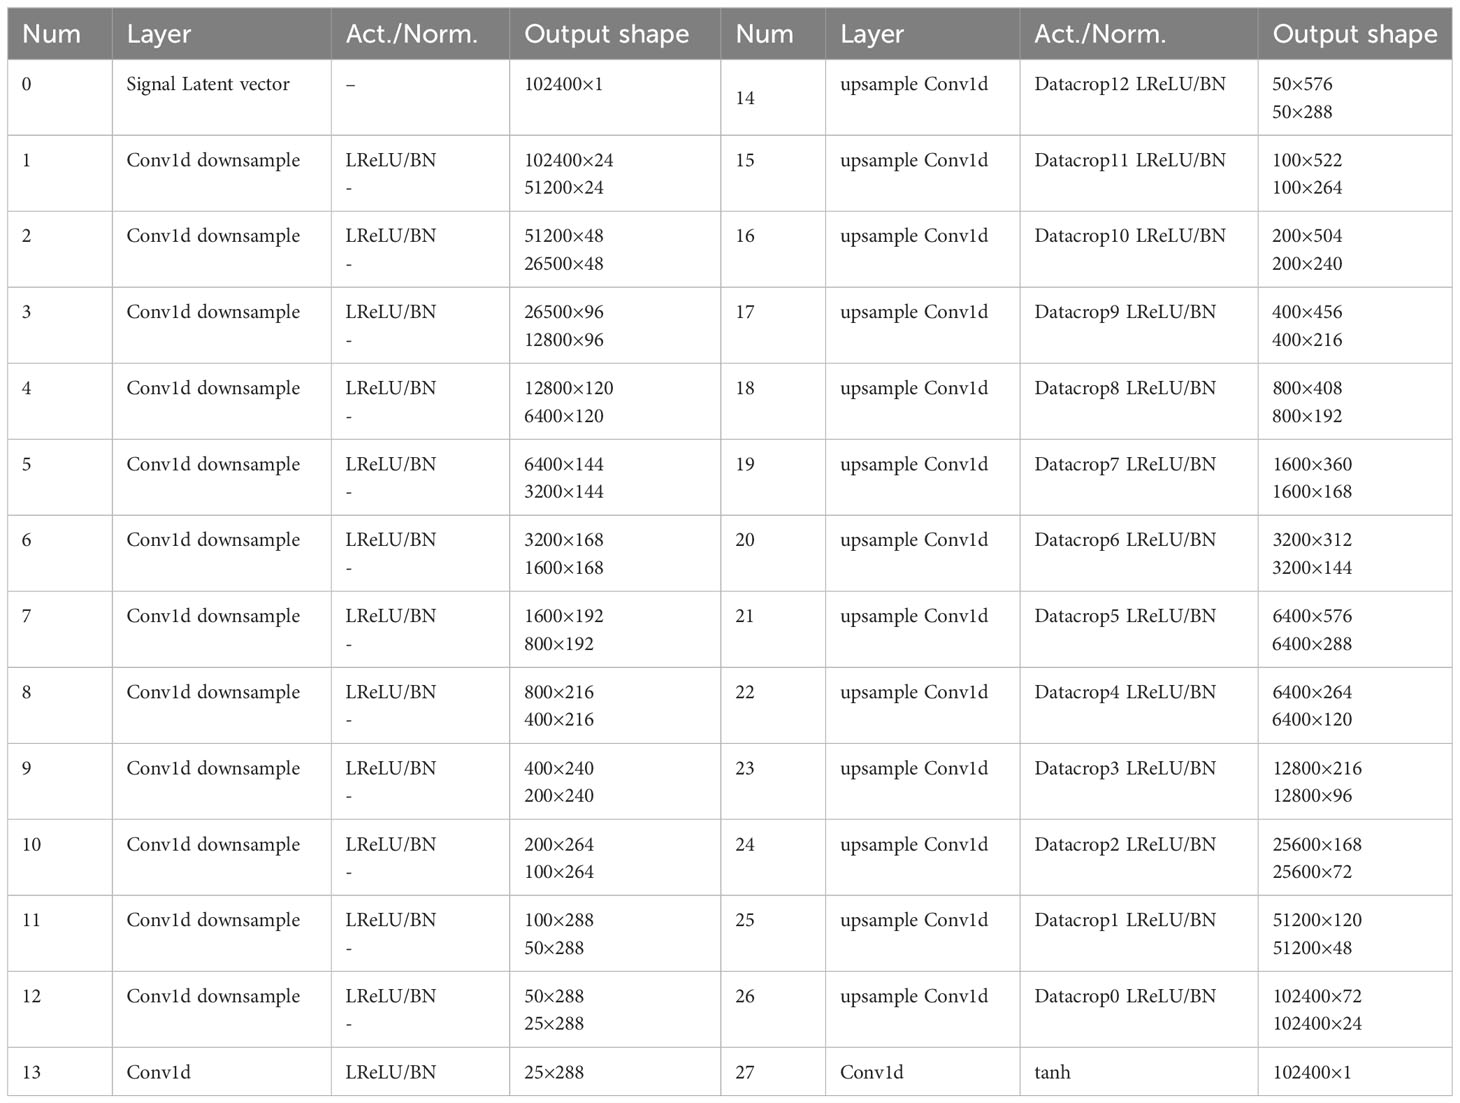
Table 1 Generation network.
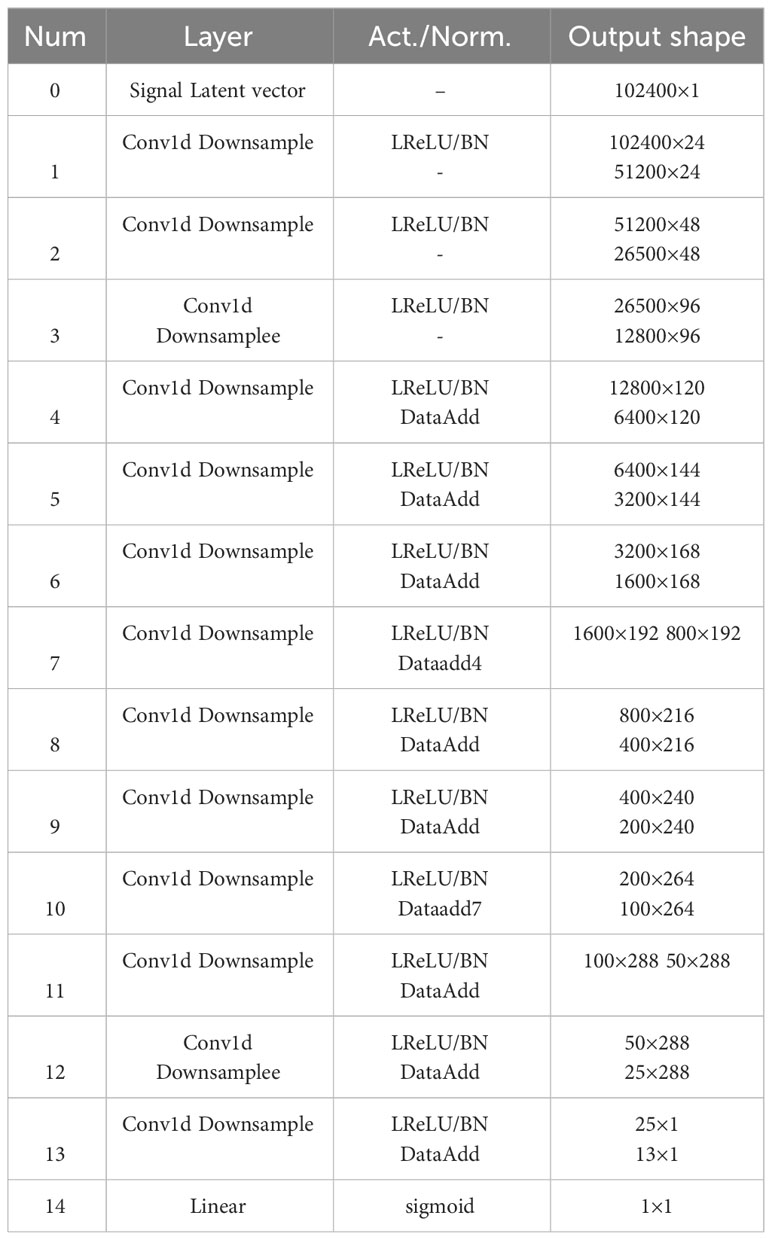
Table 2 Discrimination network.
In Table 1, the signal input is 102400×1, and the data mapped into the same scale by the generation network is also 102400×1. In Table 2, the signal input is 102400×1, and the Classification probabilities are formed after the convolution and linear layer processing. The output scale is 1×1, which is used as the output of the discriminator in GAN.
This paper uses the signal-to-reverberation ratio(SRR) to evaluate the signal after reverberation suppression. The SRR will be used to indicate the degree of signal suppression.
In Eq. (21), is the power of the activated sonar signal, is the power of the reverberation signal, and is the power of the target echo signal. SRR can be used to indicate the degree of reverberation suppression. Denote by in the following calculations.
The reverberation suppression network approach of RSWGAN-GP introduces the Wasserstein distance on top of the reverberation suppression model of GAN, and Eq. (22) shows the distance.
In Eq. (22), is the calculated expectation; is the desired sonar signal after actual reverberation suppression, and is the sonar signal after raw reverberation suppression; is , the set of joint probability distributions of the corresponding expected signal probability distribution and the generated signal ; is the exact bound taken down; is the expected value of the relative distance of the local discharge signal under the set of joint probability distributions .
In Eq. (22), the lower exact expectation bound is difficult to find so that the Wasserstein distance can be converted into the Kantorovich-Rubinstein dual form. Eq. (23) shows the Wasserstein distance’s dual structure.
In Eq. (23). is the distance cost function of discriminator D; indicates that the discriminator distance cost function satisfies the 1-Lipschitz restriction. The GP in RSWGAN-GP indicates the gradient penalty function to satisfy the 1-Lipschitz restriction, and its loss function is shown in Eq. (19).
is the generator loss function; is the discriminator loss function; is the suppressed sonar signal generated by the generator; is the prior distribution of the input sonar signal Z; is the gradient penalty term; is the canonical term coefficient; and is the P-parameter.
5 Experimental verification
This section validates the advancedness of the proposed model and method. For this purpose, we conducted marine experiments to verify that RSWGAN-GP can effectively suppress the reverberation of sonar signals and collect actual data in the field for verification. RSWGAN-GP, with other excellent reverberation suppression methods, compared to prove the effectiveness of the reverberation suppression method proposed. The following sections explain the detailed description and summary of the experiments.
In the experiment, the active sonar with 30-element with a self-receiving function is used to transmit a continuous wave (CW) signal with a sampling rate and a frequency. The size of the training data set is 6000 data samples in total, among which 2520 actual sonar data samples are obtained through experiments, and 3480 data samples are generated by the underwater active sonar reverberation simulation method. The simulation data and actual data are randomly arranged, and the training set and the verification set are in a 5:1 ratio. The actual data are used to verify the reverberation suppression effect of the model obtained at the end of training. The experiments were conducted in one of the bays in Qingdao. Figure 8 shows the experimental scenario.
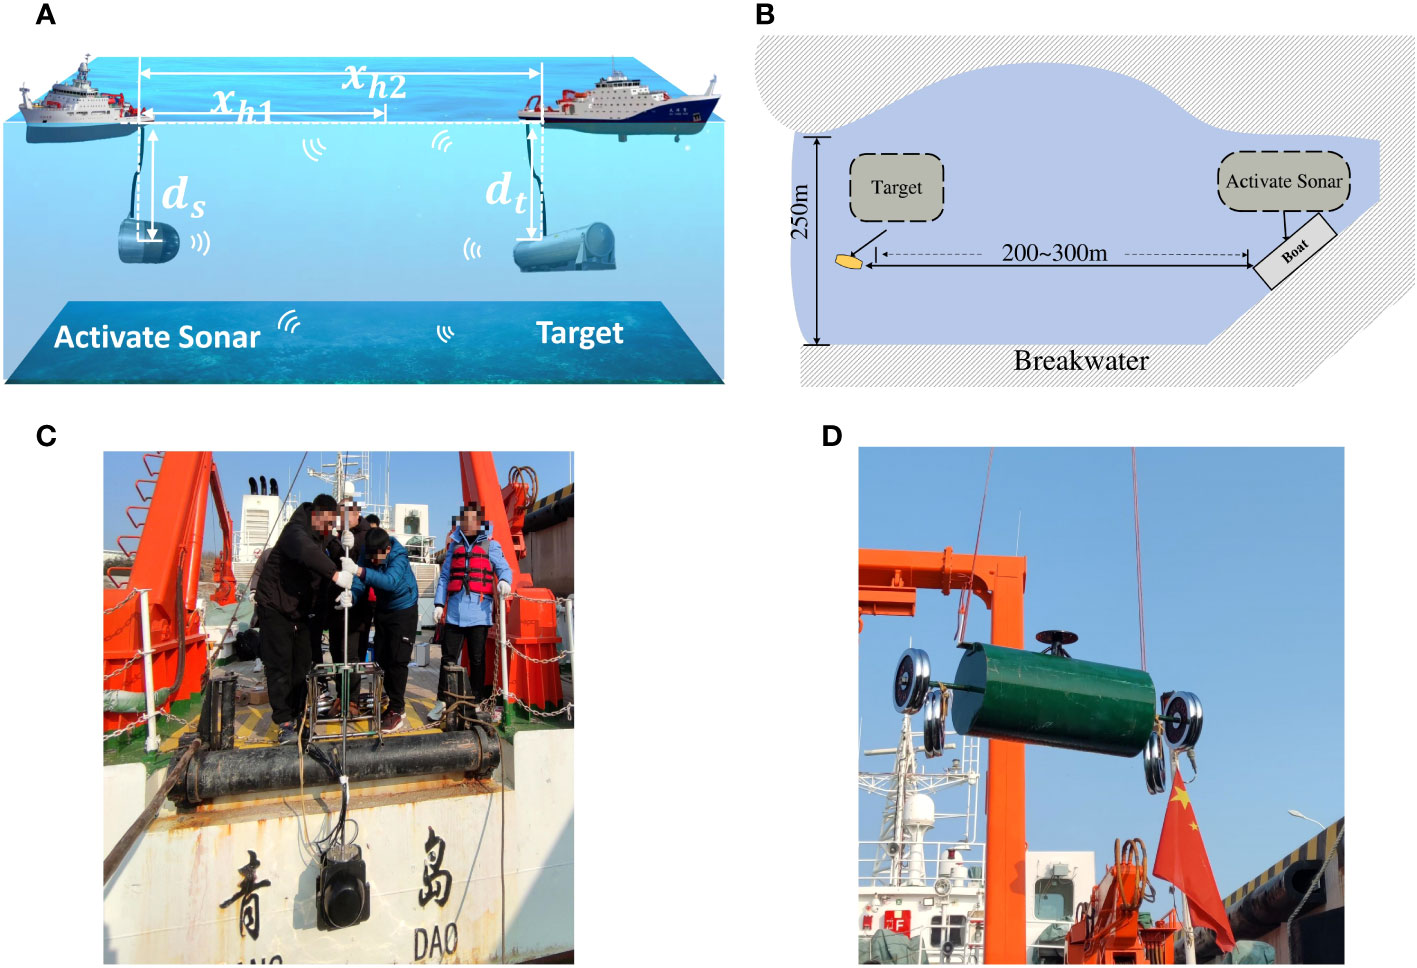
Figure 8 Experimental environment and equipment. (A) Sonar and target underwater deployment status. (B) Sonar and target experiment terrain environment and experiment method. (C) Active sonar equipment during the experiment. (D) Target equipment during the experiment.
Figure 8A is a schematic diagram of the relative position of the active sonar and the target during the test. In the figure, is the shortest distance from the relative position, and is the longest distance from the relative position, active sonar is at the same position as the target at sea level . In Figure 8B, the experiment in the harbor can minimize the error caused by the ship’s swing caused by wind and waves. The narrowest point of the harbor exit is 200m, and the target ship tows the target at a distance of 200-300m from the active sonar. Figures 8A, B show the experimental active sonar equipment and the detected target, respectively. The detected target is a cylindrical object with an internal cavity with a diameter of 533mm and a length of 3m. The essential experimental data of the validation method are obtained in sea trials.
The data are collected and used as the validation set to validate each epoch in the training process. The active sonar of the signal is subjected to reverberation suppression, and the signal change during training is shown in Figure 9.
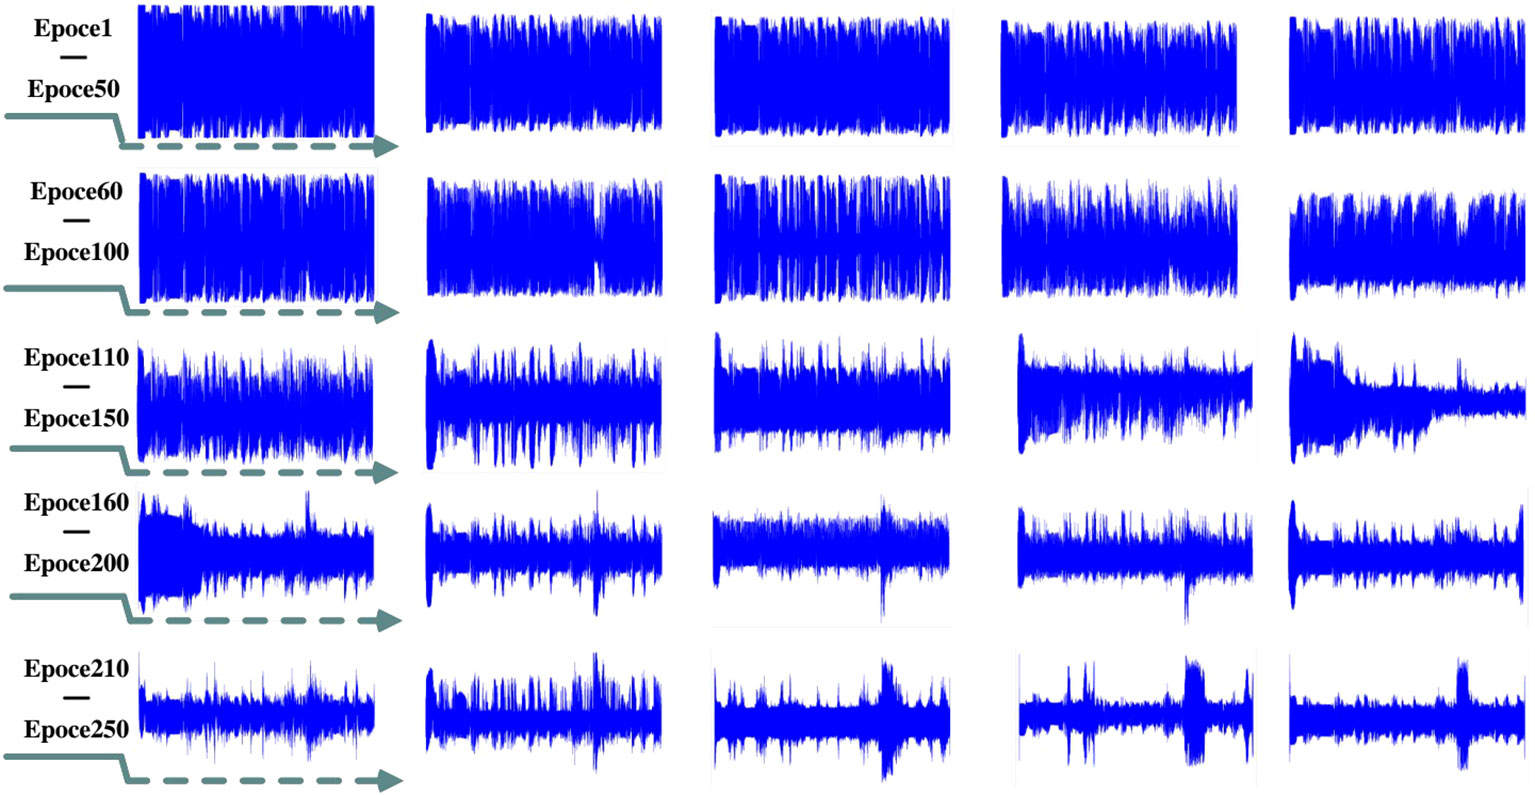
Figure 9 Active sonar reverberation suppression changing graph.
In Figure 9, the time domain diagram shows that the model is trained by mixing simulation data with actual acquisition data, and the trained model is used to process the experimental results of the active sonar signal data of the ocean experiment. The figure shows the results of sonar signal processing of model pairs produced by different iterations. In the Epoch 1-50 iteration training process, the processed sonar signal still has the phenomenon of signal chipping. Still, it shows the state of strong reverberation, and the target position cannot be visually observed from the time domain. Starting from Epoch 60-100, the chipping phenomenon of the echo signal disappears, the correct sinusoidal signal can be restored, and the neural network can already find the desired target feature state. From Epoch 110 onwards, the target can be precisely located, and in subsequent training iterations, the target echo feature can be highlighted while suppressing the strong reverberation state during sonar propagation. When the model training iteration is above Epoch 210, the target echo signal can be observed macroscopically from the time domain diagram. Reverberation changes in the middle state of the network as shown below:
The above-processed feature map, which results from the processing of the network , results in a 288×25 feature array. Feature array is where the network will generate features, which will then be upsampled to recover the signal. In Figure 10, some features of the signal increase and decrease as the epoch increases, representing anti-reverberation operations. From Figure 10A, it can be seen that the convolution features of the signal at the beginning are dispersed to each corner of the array. After iteration, some features weaken, as shown in Figure 10B, which is reflected in the signal that the reverberation part begins to weaken, and then the features disappear, as shown in Figure 10C. Finally, the target echo features are enhanced, as shown in Figure 10D, and the corresponding display in the echo signal explored by sonar is the enhancement of the echo signal.

Figure 10 The intermediate state of the network changes. (A) Initial network intermediate layer processing result. (B) After 50 iterations. (C) After 100 iterations. (D) After 150 iterations.
During the training process, convergence is achieved by continuously correcting errors. The loss curve changes during the training process of RSWGAN-GP, including the generator loss curve and the discriminator loss curve, as shown in Figure 11.

Figure 11 Results for different parameters. (A) The discriminator loss varies with epoch. (B) The generator loss varies with epoch.
Figure 10 shows the training loss curves of RSWGAN-GP under various weight decay and learning rate(lr) settings. Figure 10A is the line chart of the generator loss variation, and Figure 10B is the curve chart of the discriminator loss variation. By setting different parameter values, rapid convergence of the network can be achieved when weight decay and learning rate are set to 0.00001 and 0.0001, respectively. As shown in the figure, in the WGAN-GP network, the generator loss continuously approaches 0, and the discriminator loss continuously approaches 0. The loss of the generator shows a rising trend, and the loss of the discriminator shows a decreasing trend. During training, the generator and discriminator are in a state of mutual competition, and their loss values should fluctuate up and down. The trend shown in the figure represents the main direction.
For applications where target detection will be performed after signal processing, the difference between before and after signal processing is shown in Figure 12.
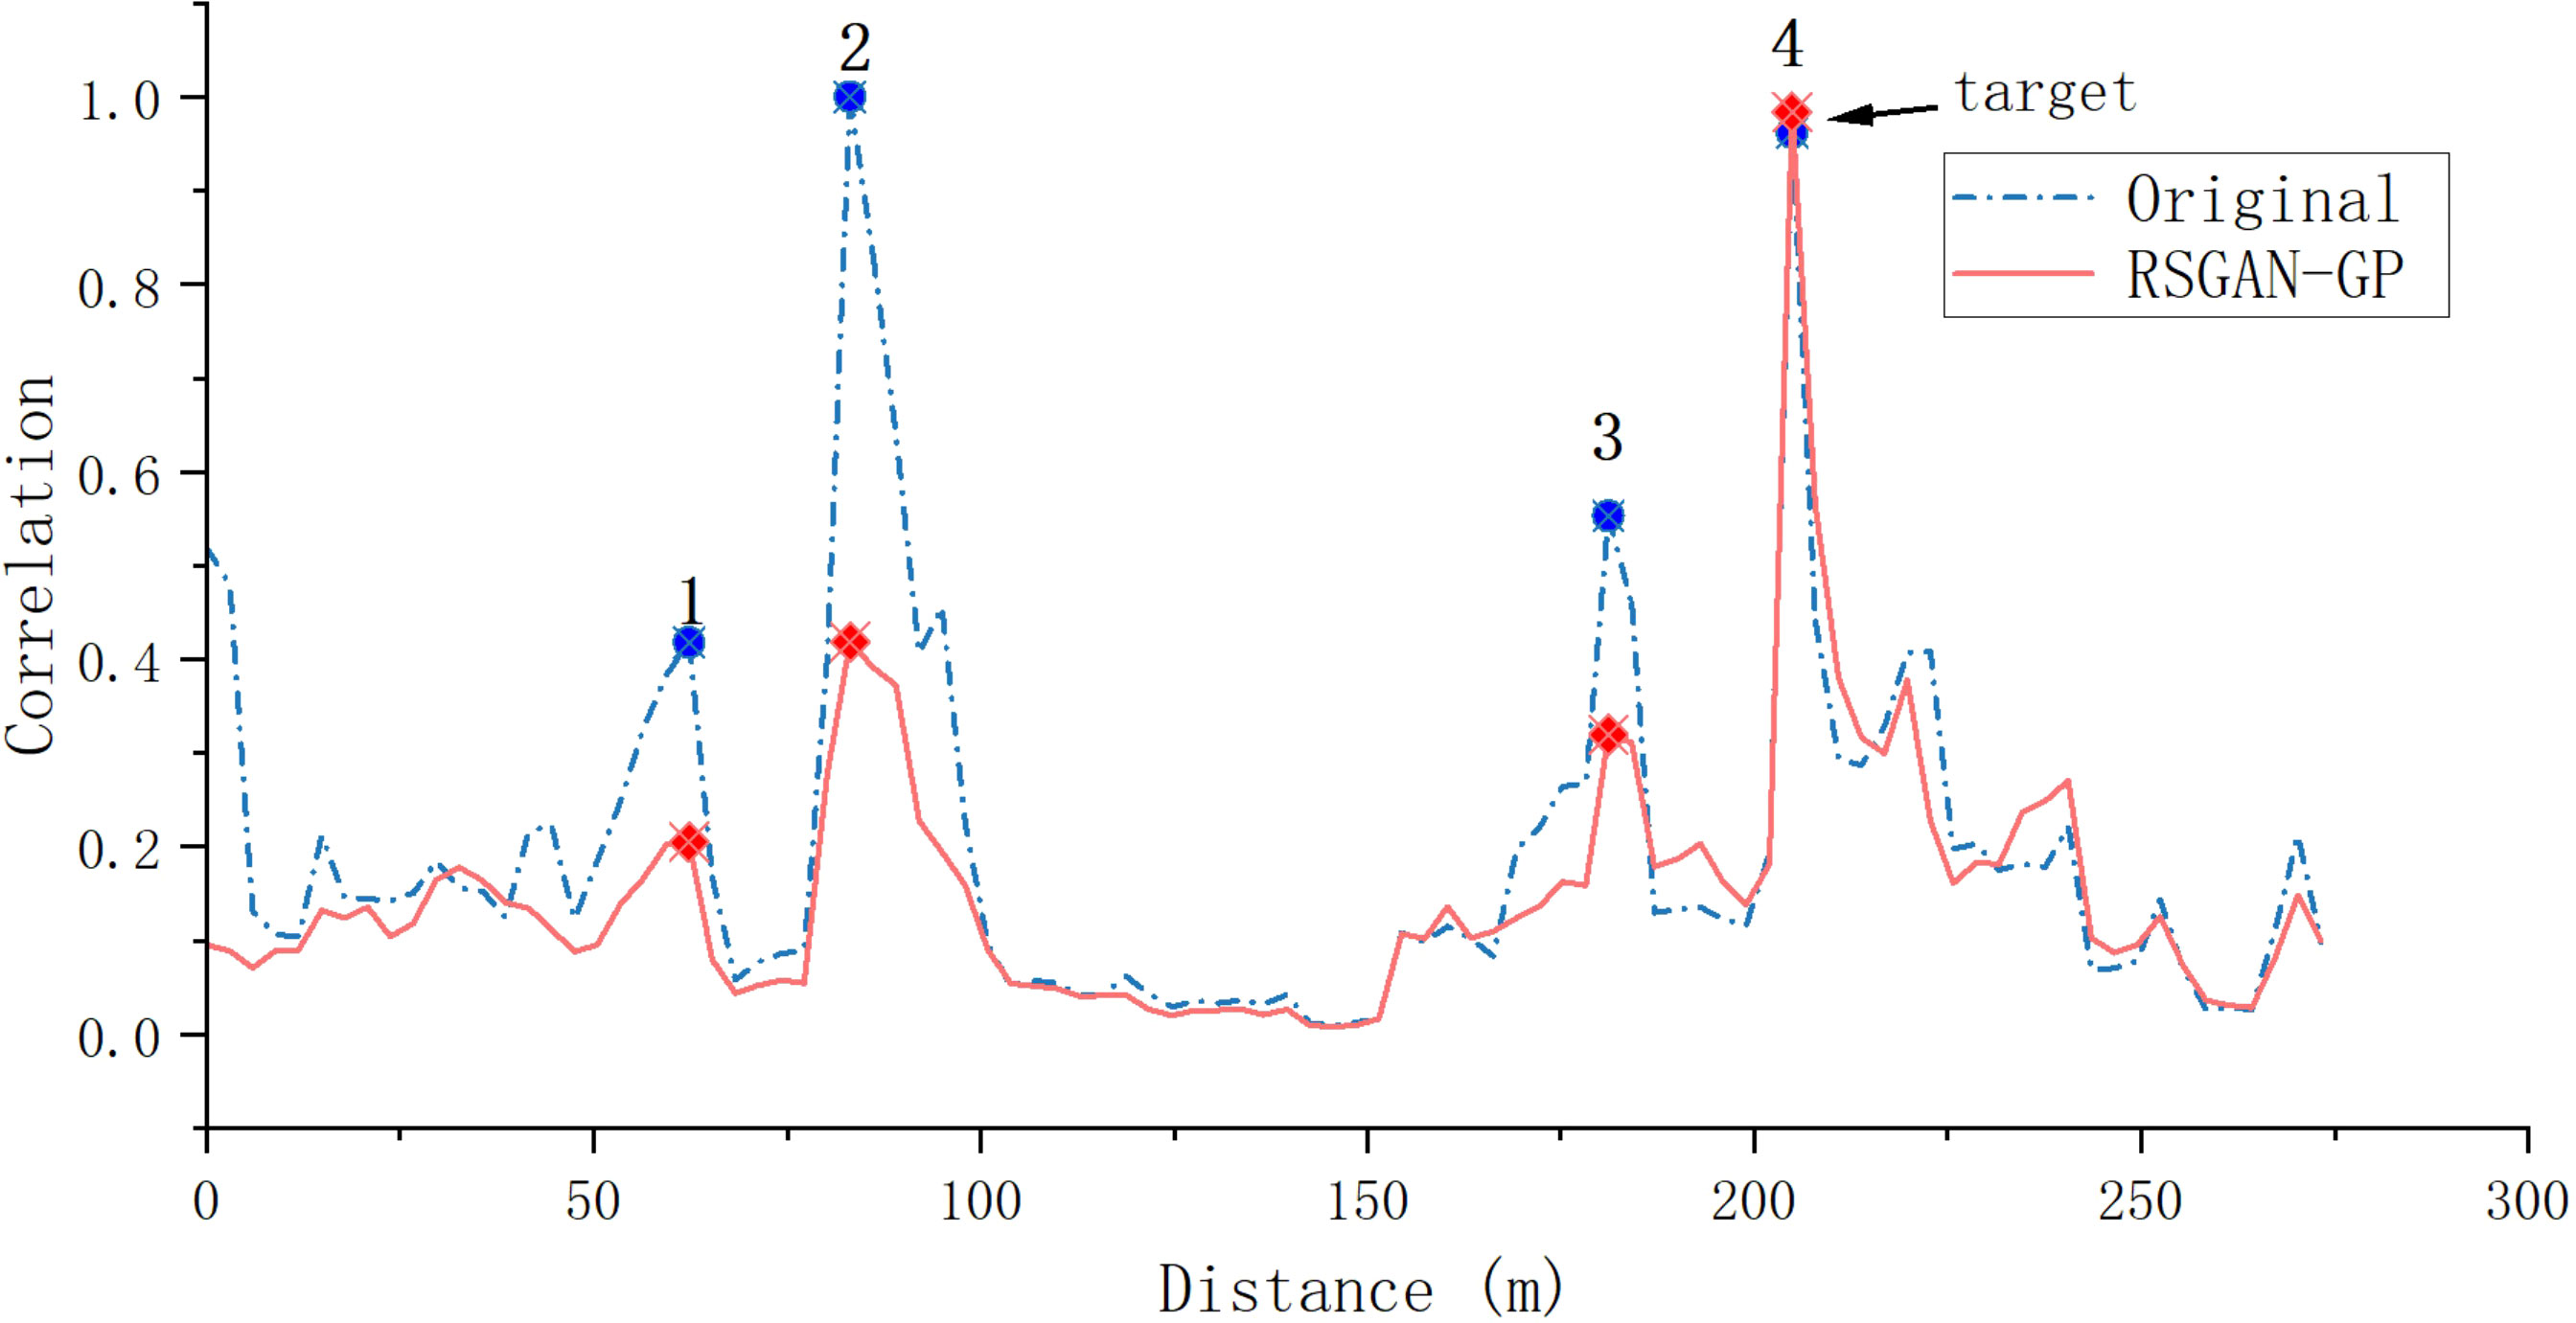
Figure 12 Matching field result.
Figure 12 shows the target position detection map after nonlinear processors in matching fields on CW signal processing Sun and Li (2019), where the target indicates the target’0s location, which is about 204 m—the comparison between the original data and the data after RSWGAN-GP processing is shown. In the original data, before the target position, there is the influence of reverberation on its judgment. When making a prediction, the highest correlation position changes and the highest point in front is judged as the target position. When comparing the red line with the blue line, it is evident that the signal processed by RSWGAN-GP can reduce the influence of reverberation when making target judgments, increasing the success rate of target judgments. Here, four contrasting points are selected, as shown in Table 3.

Table 3 Target detection correlation comparison.
Among the data points, the first three are reverberation points, and the comparison shows that the reverberation is well suppressed, and the fourth is the target point. The SRR is improved after echo suppression. The data comparison can prove that the well-trained model can suppress the reverberation well, making the correlation increase by 0.022 and the reverberation part decrease by 0.3 on average.
There are many excellent algorithms in water acoustics reverberation suppression, here will use collected data for various methods to compare with the method proposed in this paper. The comparison results after processing the sonar signal are shown in Figure 13.

Figure 13 Sonar signal comparison of reverberation suppression methods. (A) Original signal diagram and signal diagram processed by 2D-AR Prewhitening, LMS, Frft, PCI-SVM, RSWGAN-GP methods. (B) SRR changes with SINR after model reverberation suppression.
In Figure 13A, the Original signal is unprocessed, the reverberation power is 0.398, the signal echo power is 0.432, and its SRR is 0.361dB, the highlighted red part indicates the position of the target echo, which cannot be effectively identified from the figure. 2D-AR PreWhitener is used to eliminate correlation and frequency correlation in the signal Li et al. (2008) so that the signal is flatter in the frequency domain, and the processed echo sonar signal shows the position of the target echo. The least mean square filter (LMS) processes the echo signal Kim et al. (2000), and the reverberation component is suppressed, decreasing amplitude. Adaptive fractional Fourier transforms (FrFt) for suppressing reverberation Yu et al. (2022), Although the reverberation is partially suppressed, the actual impact is not apparent. The PCI-SVM reverberation suppression method combines Principal Component Inversion (PCI) and Support Vector Machine (SVM) techniques Wang et al. (2021). This method selects suitable and effective feature values through SVM to extract the main features for reverberation suppression. The figure shows that this method performs better than the previous ones. We present the impact of the RSWGAN-GP method proposed in this paper. Compared to the excellent methods, the reverberation component is effectively suppressed, and the echo component is more visible and prominent. The detailed data comparison is presented in Table 4.
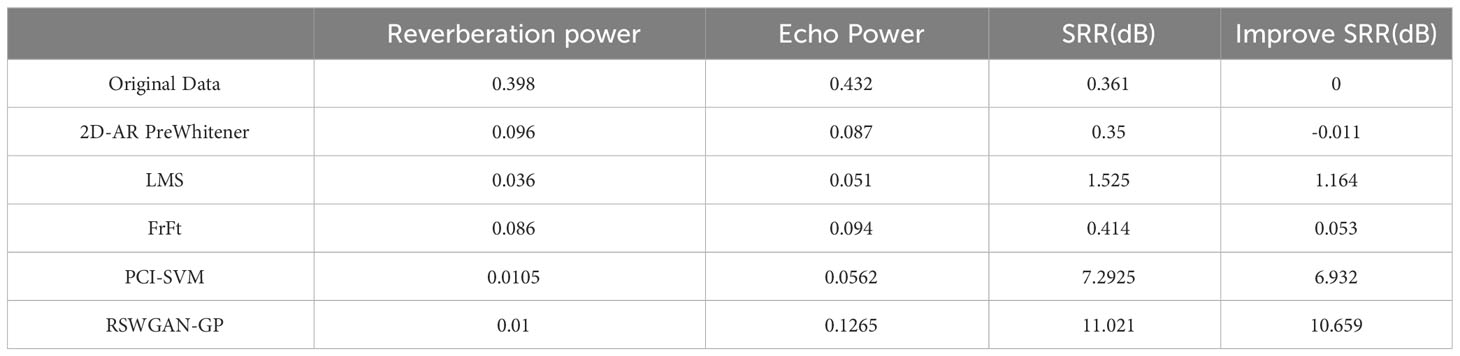
Table 4 Experimental data comparison table.
Figure 13B compares SRR results processed by different methods under different SINR environments. In actual use, the reverberation signal processing SINR is between 0 dB and 10 dB. In order to reflect the processing ability of a high reverberation environment, the signal is mainly concentrated between -10 dB and 10 dB (data comparison in the middle of the two blue colors in the figure). As can be seen from the figure, RSWGAN-GP and PCI-SVM methods are significantly superior to other methods. At the same time, RSWGAN-GP is 3 dB higher than the PCI-SVM method at SINR -10 dB, and the advantages become more evident as SINR increases. The advantage of RSWGAN-GP is that it can learn many high reverberation data to improve the processing ability of high-reverberation data. In Figures 13A, B, we compare different reverberation suppression methods to demonstrate the effectiveness of RSWGAN-GP in suppressing reverberation.
Figure 14 shows the processing results and time-frequency distribution of raw signal, AR pre-whitening, LMS, FrFt, PCI-SVM and RSWGAN-GP, respectively. Experimental results show that the algorithm can effectively suppress reverberation and extract target echo components under high SRR conditions. At the same time, the time-frequency structure of the target highlight echo remains unchanged. The processing results of the original signal distribution are shown in Figure 14A. It can be seen that there is some substantial reverberation interference near the target echo, but its energy is weaker than the target echo. The signal processed by 2D-AR PreWhitener, LMS, FrFt and PCI-SVM is shown in Figures 14B–E, and the target echo energy is still not obvious. As shown in Figure 14F, the RSWAGN-GP processing results show that the overall reverberation background has been effectively removed, and only a tiny part of weak background interference remains near the target echo.
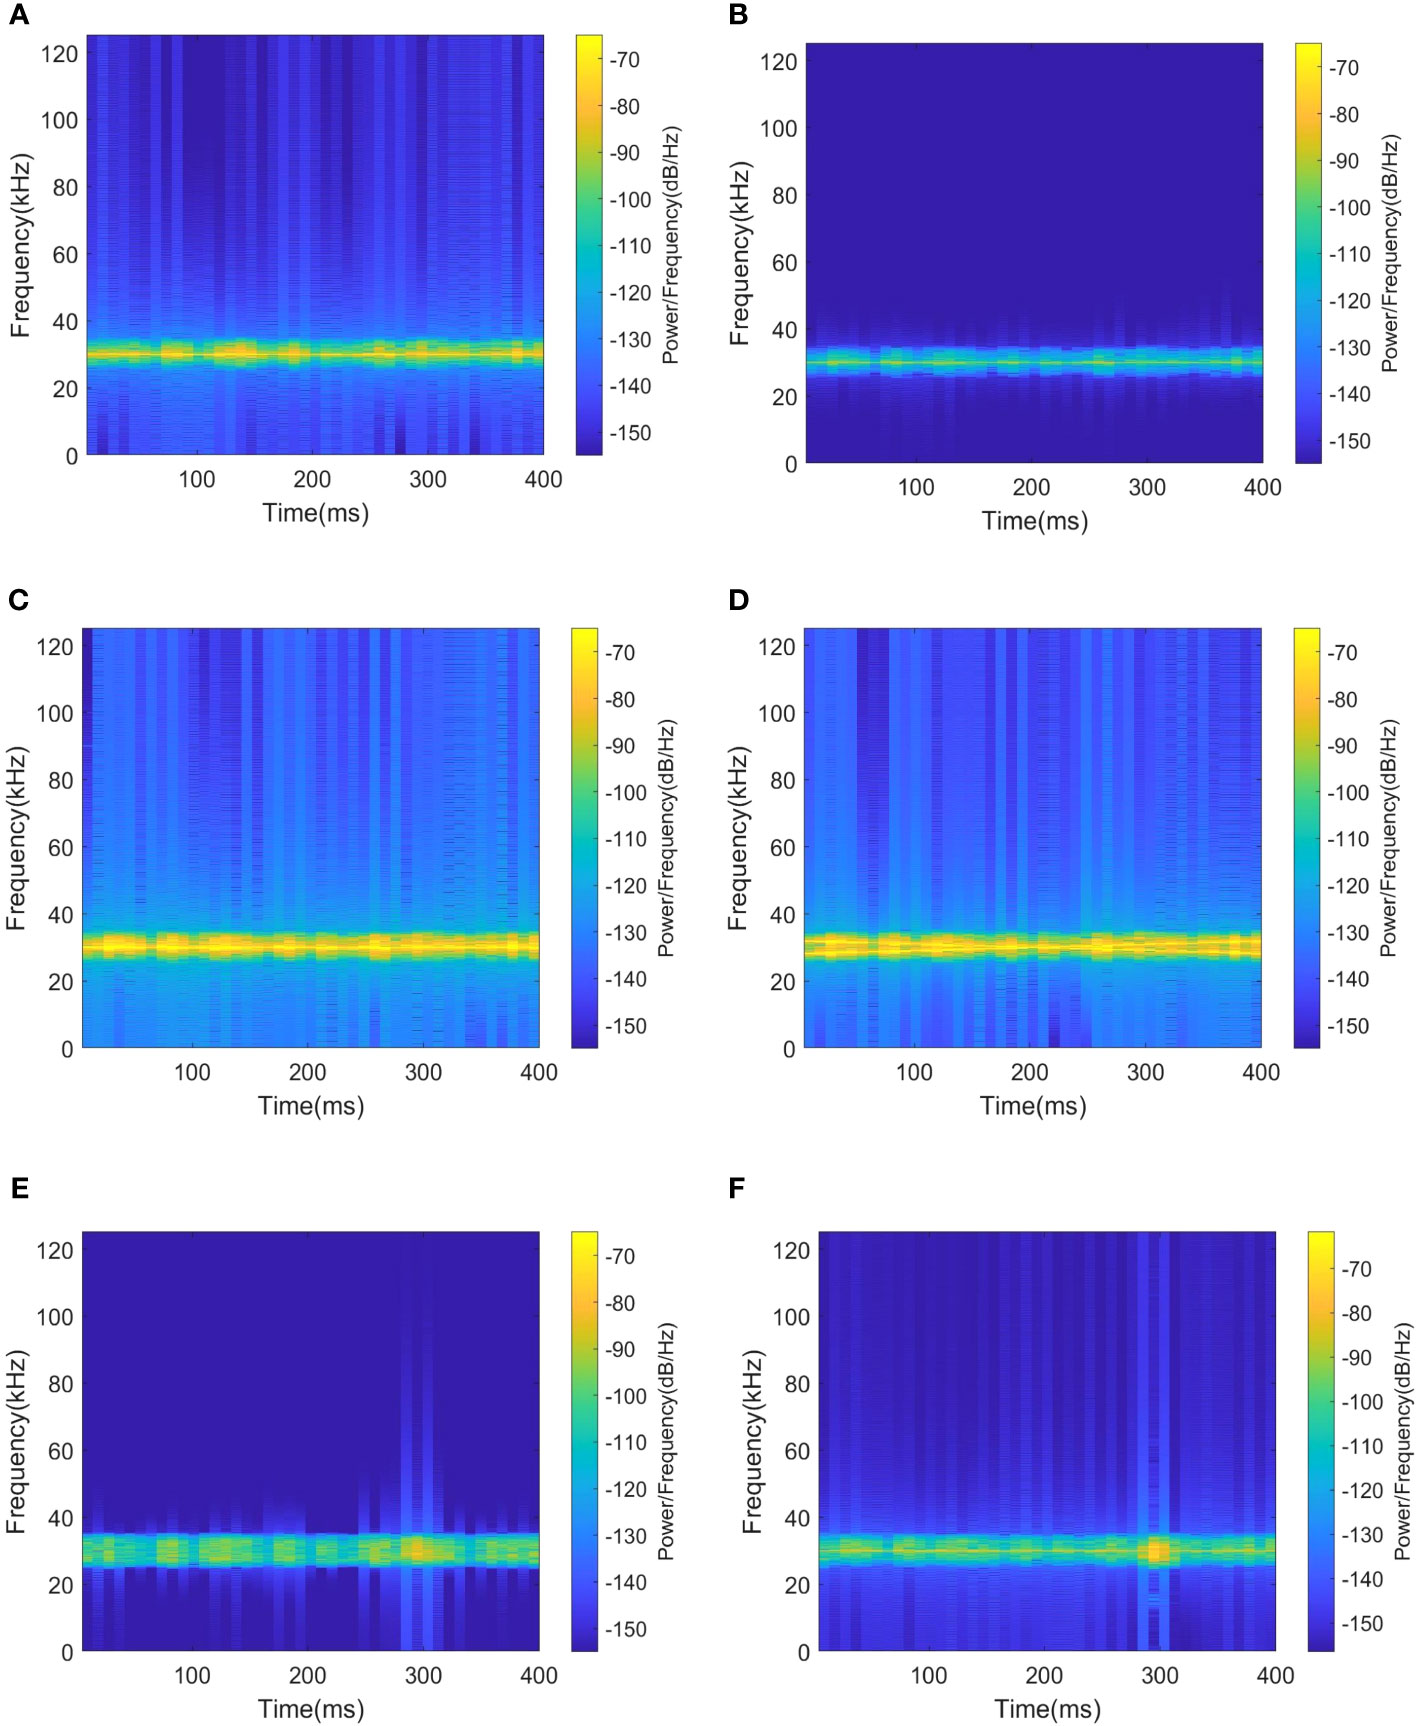
Figure 14 Time-frequency distributions. (A) Signal original state .(B) After 2D-AR PreWhitener processing. (C) After LMS processing. (D) After FrFt processing. (E) After PCI-SVM processing. (F) After RSWGAN-GP processing.
The superiority of the proposed method can be seen in Figures 12, 13, and the detailed parameters are listed here for comparison, including reverberation amplitude, echo amplitude, reverberation power, echo power and SRR. The specific parameters are shown in Table 4.
The findings in Table 4 demonstrate that the RSWGAN-GP method proposed in this study is the most efficient technique for attenuating reverberation compared to the other methods evaluated. With a remarkable improvement in the reverberation ratio by 15dB, RSWGAN-GP significantly enhances speech quality from 0.83dB to 16.79 dB. The PCI-SVM algorithm comes in a close second, mainly when the optimal rank is 42, as determined by the SVM classification experiment, resulting in a significant improvement in the SRR by around 13dB. The 2D-AR PreWhitener, LMS, and FrFt techniques also improve the reverberant environment by -0.024dB, -2.68dB, and 0.12dB, respectively. Nevertheless, their ultimate effects are less substantial than those of RSWGAN-GP and PCI-SVM.
The effectiveness of the RSWGAN-GP method proposed in this paper for suppressing reverberation in sonar signals is demonstrated through experiments. Using experimental data from the ocean during training shows that features are extracted and amplified during the training iterations. By comparing the results of the algorithms, it is evident that this method can significantly improve signal quality. The improved SRR is 15.169 dB, demonstrating the method’s effectiveness and superiority for reverberation suppression.
6 Conclusion
Reverberation suppression of echo signals is a crucial issue in active sonar systems. This paper presents a novel RSWGAN-GP method for suppressing reverberation in sonar signals using the generative adversarial network. This reverberation suppression network employs a one-dimensional convolutional network to process the signal content. RSWGAN-GP refers to U-net and DenseNet, using skip network structure and dense connection network to suppress sonar signal reverberation efficiently. Comparison using actual collected data demonstrates the effectiveness of the proposed method, which can effectively suppress the active sonar reverberation signal, improving SRR by approximately 10 dB, better than other methods.
Through several experiments, it was discovered that the processing model trained by RSWGAN-GP has specific requirements for the transmission pulse width. The transmission pulse width of the signal needs to be adjusted for different detection distances, but the model’s pulse width for echo signal processing is not sensitive to the width. However, this relationship may be specific to the dataset used. In future research, efforts will be made to improve the model’s generalization capabilities to process signals with different pulse widths efficiently.
Data availability statement
The original contributions presented in the study are included in the article/supplementary material. Further inquiries can be directed to the corresponding authors.
Author contributions
ZW: Writing – original draft. HZ: Conceptualization, Supervision, Writing – review & editing. WH: Conceptualization, Formal Analysis, Methodology, Resources, Supervision, Writing – review & editing. XC: Methodology, Supervision, Writing – review & editing. NT: Data curation, Supervision, Writing – review & editing. YA: Data curation, Methodology, Writing – review & editing.
Funding
The author(s) declare financial support was received for the research, authorship, and/or publication of this article. This work was financially supported by the National Natural Science Foundation of China (Grant No. 91938204, 41527901, 61701462 and 62271459), the Marine S&T fund of Shandong Province for Pilot National Laboratory for Marine Science and Technology (Qingdao) (No.2018SDKJ0210), National Defense Science and Technology Innovation special Zone Project: Marine Science and Technology Collaborative Innovation Center (22-05-CXZX-04-01-02), Open Studio for Marine High Frequency Communications.
Conflict of interest
The authors declare that the research was conducted in the absence of any commercial or financial relationships that could be construed as a potential conflict of interest.
Publisher’s note
All claims expressed in this article are solely those of the authors and do not necessarily represent those of their affiliated organizations, or those of the publisher, the editors and the reviewers. Any product that may be evaluated in this article, or claim that may be made by its manufacturer, is not guaranteed or endorsed by the publisher.
References
Abrahamyan L., Ziatchin V., Chen Y., Deligiannis N. (2021). Bias loss for mobile neural networks. Proceedings of the IEEE/CVF International Conference on Computer Vision 1, 6556–6566. doi: 10.1109/ICCV48922.2021.00649
Ashraf H., Jeong Y., Lee C. H. (2021). Underwater ambient-noise removing gan based on magnitude and phase spectra. IEEE Access 9, 24513–24530. doi: 10.1109/ACCESS.2021.3051263
Bharathi B. M. R., Mohanty A. (2019). Time delay estimation in reverberant and low snr environment by emd based maximum likelihood method. Measurement 137, 655–663. doi: 10.1016/j.measurement.2019.01.096
Chalapathy R., Menon A. K., Chawla S. (2017). “Robust, deep and inductive anomaly detection,” in Machine Learning and Knowledge Discovery in Databases: European Conference, ECML PKDD 2017, Skopje, Macedonia, (Skopje, Macedonia: Springer), September 18–22, 2017. 36–51, Proceedings, Part I 10Springer.
Chandrasekaran V., Sanghavi S., Parrilo P. A., Willsky A. S. (2011). Rank-sparsity incoherence for matrix decomposition. SIAM J. Optimization 21, 572–596. doi: 10.1137/090761793
Chen J., Liu C., Xie J., An J., Huang N. (2022). Time–frequency mask-aware bidirectional lstm: A deep learning approach for underwater acoustic signal separation. Sensors 22, 5598. doi: 10.3390/s22155598
Chen L., Fang S., An L. (2018). “Method of spatially correlated wideband ambient noise simulation for underwater acoustic array,” in In INTER-NOISE and NOISE-CON Congress and Conference Proceedings (Chicago, IL: Institute of Noise Control Engineering), Vol. 258. 3160–3169.
Costas J. P. (1984). A study of a class of detection waveforms having nearly ideal range—doppler ambiguity properties. Proc. IEEE 72, 996–1009. doi: 10.1109/PROC.1984.12967
Cox H., Lai H. (1994). Geometric comb waveforms for reverberation suppression. In Proc. 1994 28th Asilomar Conf. Signals Syst. Comput. (IEEE) 2, 1185–1189. doi: 10.1109/ACSSC.1994.471646
Diniz P. S., Da Silva E. A., Netto S. L. (2010). Digital signal processing: system analysis and design (UK: Cambridge University Press).
Dong H.-W., Yang Y.-H. (2018). Convolutional generative adversarial networks with binary neurons for polyphonic music generation. arXiv preprint arXiv:1804.09399. doi: 10.48550/arXiv.1804.09399
Faure P. (1964). Theoretical model of reverberation noise. J. Acoustical Soc. America 36, 259–266. doi: 10.1121/1.1918943
Freburger B., Tufts D. (1997). “Rapidly adaptive signal detection using the principal component inverse (pci) method,” in Conference Record of the Thirty-First Asilomar Conference on Signals, Systems and Computers (Cat. No. 97CB36136) (Pacific Grove, CA: IEEE), Vol. 1. 765–769, IEEE.
Gao Y., Chen Y., Wang F., He Y. (2020). “Recognition method for underwater acoustic target based on dcgan and densenet,” in 2020 IEEE 5th International Conference on Image, Vision and Computing (ICIVC) (Beijing, China: IEEE). 215–221.
Han K., Wang Y., Wang D., Woods W. S., Merks I., Zhang T. (2015). Learning spectral mapping for speech dereverberation and denoising. IEEE/ACM Trans. Audio Speech Lang. Process. 23, 982–992. doi: 10.1109/TASLP.2015.2416653
Hao Y., Wu X., Wang H., He X., Hao C., Wang Z., et al. (2023). Underwater reverberation suppression via attention and cepstrum analysis-guided network. J. Mar. Sci. Eng. 11, 313. doi: 10.3390/jmse11020313
Hodges R. P. (2011). Underwater acoustics: Analysis, design and performance of sonar (United Kingdom: John Wiley & Sons).
Hu N., Rao X., Zhao J., Wu S., Wang M., Wang Y., et al. (2023). A shallow seafloor reverberation simulation method based on generative adversarial networks. Appl. Sci. 13, 595. doi: 10.3390/app13010595
Huang T., Wang T. (2019). Research on analyzing and processing methods of ocean sonar signals. J. Coast. Res. 94, 208–212. doi: 10.2112/SI94-044.1
Innami S., Kasai H. (2012). Nmf-based environmental sound source separation using time-variant gain features. Comput. Mathematics Appl. 64, 1333–1342. doi: 10.1016/j.camwa.2012.03.077
Jiang K.-Y., Cai Z.-M., Lu Z.-B. (2007). Forward and backward prediction model based signal detection in sea bottom reverberation. Acta ELECTONICA Sin. 35, 1766.
Kay S., Salisbury J. (1990). Improved active sonar detection using autoregressive prewhiteners. J. Acoustical Soc. America 87, 1603–1611. doi: 10.1121/1.399408
Kim K. M., Lee C., Youn D. H. (2000). Adaptive processing technique for enhanced cfar detecting performance in active sonar systems. IEEE Trans. Aerospace Electronic Syst. 36, 693–700. doi: 10.1109/7.845261
Koh S., Chia C. S., Tan B. A. (2020). “Underwater signal denoising using deep learning approach,” in Global Oceans 2020: SINGAPORE–US Gulf Coast (Biloxi, MS, USA: IEEE), 1–6.
Li W., Ma X., Zhu Y., Yang J., Hou C. (2008). Detection in reverberation using space time adaptive prewhiteners. J. acoustical Soc. America 124, EL236–EL242. doi: 10.1121/1.2963187
LiXiukun X., Mu W.. (2015). Blind separation of unde rwater target echoes in reverberation back ground. Journal of Harbin Engineering University 36, 62.
Ma L., Gulliver T. A., Zhao A., Zeng C., Wang K. (2021). An underwater bistatic positioning system based on an acoustic vector sensor and experimental investigation. Appl. Acoustics 171, 107558. doi: 10.1016/j.apacoust.2020.107558
Mejjaoli H., Omri S. (2020). Spectral theorems associated with the directional short-time fourier transform. J. Pseudo-Differential Operators Appl. 11, 15–54. doi: 10.1007/s11868-019-00308-z
Nakaoka S., Li L., Inoue S., Makino S. (2021). “Teacher-student learning for low-latency online speech enhancement using wave-u-net,” in ICASSP 2021-2021 IEEE International Conference on Acoustics, Speech and Signal Processing (ICASSP), (Toronto, ON, Canada: IEEE). 661–665.
Neasham J. A., Menon R., Hinton O. R. (2007). “Broadband, ultra-sparse array processing for low complexity multibeam sonar imaging,” in OCEANS 2007-Europe (Aberdeen, UK: IEEE), 1–6.
Ozaktas H. M., Arikan O., Kutay M. A., Bozdagt G. (1996). Digital computation of the fractional fourier transform. IEEE Trans. Signal Process. 44, 2141–2150. doi: 10.1109/78.536672
Qian W., Cao F. (2019). Adaptive algorithms for low-rank and sparse matrix recovery with truncated nuclear norm. Int. J. Mach. Learn. Cybernetics 10, 1341–1355. doi: 10.1007/s13042-018-0814-9
Ratnarajah A., Ananthabhotla I., Ithapu V. K., Hoffmann P., Manocha D., Calamia P. (2023). “Towards improved room impulse response estimation for speech recognition,” in ICASSP 2023-2023 IEEE International Conference on Acoustics, Speech and Signal Processing (ICASSP). (Rhodes Island, Greece: IEEE), 1–5.
Ronneberger O., Fischer P., Brox T. (2015). “U-net: Convolutional networks for biomedical image segmentation,” in Medical Image Computing and Computer-Assisted Intervention–MICCAI 2015: 18th International Conference, Munich, Germany (Springer), October 5-9, 2015. 234–241, Proceedings, Part III 18Springer.
Singer A. C., Nelson J. K., Kozat S. S. (2009). Signal processing for underwater acoustic communications. IEEE Commun. Magazine 47, 90–96. doi: 10.1109/MCOM.2009.4752683
Song Y., He B., Liu P. (2019). Real-time object detection for auvs using self-cascaded convolutional neural networks. IEEE J. Oceanic Eng. 46, 56–67. doi: 10.1109/JOE.2019.2950974
Sun X., Li R. (2019). Robust adaptive beamforming method for active sonar in single snapshot. MATEC Web Conferences (EDP Sciences) 283, 03006. doi: 10.1051/matecconf/201928303006
Sun Q., Wang H., Shen X., Ning W., Fu X. (2010). Research on the statistical modeling and simulation for interface reverberation. IEEE 9, 566–570. doi: 10.1109/ICCSIT.2010.5563616
Wang X., Du J., Wang Y. (2017). “A maximum likelihood approach to deep neural network based speech dereverberation,” in 2017 Asia-Pacific Signal and Information Processing Association Annual Summit and Conference (APSIPA ASC). (Kuala Lumpur, Malaysia: IEEE), 155–158.
Wang M., Wu S., Guo S., Peng D. (2021). Study on an anti-reverberation method based on pci-svm. Appl. Acoustics 182, 108189. doi: 10.1016/j.apacoust.2021.108189
Ward S. (2001). “The use of sinusoidal frequency modulated pulses for low-doppler detection,” in MTS/IEEE Oceans 2001. An Ocean Odyssey. Conference Proceedings (IEEE Cat. No. 01CH37295) (Honolulu, HI, USA: IEEE), Vol. 4. 2147–2151.
Weiss A., Singer A. C., Wornell G. W. (2023). “Towards robust data-driven underwater acoustic localization: A deep cnn solution with performance guarantees for model mismatch,” in ICASSP 2023- 2023 IEEE International Conference on Acoustics, Speech and Signal Processing (ICASSP). (Rhodes Island, Greece: IEEE), 1–5.
Widrow B., Mantey P., Griffiths L., Goode B. (1967). Adaptive antenna systems. Proc. IEEE 55, 2143–2159. doi: 10.1109/PROC.1967.6092
Wu K., Cen F., Cai H. (2008). “Svr-based approach to improve active sonar detection in reverberation,” in 2008 IEEE International Joint Conference on Neural Networks (IEEE World Congress on Computational Intelligence). (Hong Kong, China: IEEE), 563–568.
Wu Y., Li X., Wang Y. (2018). Extraction and classification of acoustic scattering from underwater target based on wigner-ville distribution. Appl. Acoustics 138, 52–59. doi: 10.1016/j.apacoust.2018.03.026
Wuth J., Stern R. M., Yoma N. B. (2020). Non causal deep learning based dereverberation. arXiv preprint arXiv:2009.02832. doi: 10.48550/arXiv.2009.02832
Xiao X., Wang W., Ren Q., Gerstoft P., Ma L. (2021). Underwater acoustic target recognition using attention-based deep neural network. JASA Express Lett. 1, 106001. doi: 10.1121/10.0006299
Yin Z., Zhang S., Sun R., Ding Y., Guo Y. (2023). “Sonar image target detection based on deep learning,” in 2023 International Conference on Distributed Computing and Electrical Circuits and Electronics (ICDCECE). (Ballar, India: IEEE), 1–9.
Yu L., Ma F., Lim E., Cheng E., White L. B. (2018). Rational-orthogonal-wavelet-based active sonar pulse and detector design. IEEE J. Oceanic Eng. 44, 167–178. doi: 10.1109/JOE.2018.2801158
Yu G., Sun J., Li X. (2022). A signal enhancement method based on the reverberation statistical information. EURASIP J. Adv. Signal Process. 2022, 1–13. doi: 10.1186/s13634-022-00902-2
Zhan F., Zhu H., Lu S. (2019). Spatial fusion gan for image synthesis. Proceedings of the IEEE/CVF conference on computer vision and pattern recognition 1, 3653–3662. doi: 10.1109/CVPR.2019.00377
Zhang N., Wen Z., Hou X., Wen W. (2017). “Digital automatic gain control design with large dynamic range in wireless communication receivers,” in 2017 IEEE 17th International Conference on Communication Technology (ICCT). (Chengdu, China: IEEE), 1402–1406.
Zhang X.-W., Yang D.-D., Guo J.-X., Zuo L. (2019). “Weak moving target detection based on short-time fourier transform in sea clutter,” in 2019 IEEE 4th International Conference on Signal and Image Processing (ICSIP). (Wuxi, China: IEEE), 415–419.
Zhang X., Yang P., Sun H. (2023a). An omega-k algorithm for multireceiver synthetic aperture sonar. Electron. Lett. 59, e12859. doi: 10.1049/ell2.12859
Zhang X., Yang P., Zhou M. (2023b). Multireceiver sas imagery with generalized pca. IEEE Geosci. Remote Sens. Lett. 20. doi: 10.1109/LGRS.2023.3286180
Zhao Y., Wang D., Xu B., Zhang T. (2018). “Late reverberation suppression using recurrent neural networks with long short-term memory,” in 2018 IEEE International Conference on Acoustics, Speech and Signal Processing (ICASSP). (Calgary, AB, Canada: IEEE), 5434–5438.
Zhu Y., Duan R., Yang K. (2022). Robust shallow water reverberation reduction methods based on low-rank and sparsity decomposition. J. Acoustical Soc. America 151, 2826–2842. doi: 10.1121/10.0010353
Keywords: active sonar signal, reverberation suppression, generative adversarial network (GAN), high reverberation environment, one-dimensional convolution Frontiers
Citation: Wang Z, Zhang H, Huang W, Chen X, Tang N and An Y (2023) A Wasserstein generative adversarial network with gradient penalty for active sonar signal reverberation suppression. Front. Mar. Sci. 10:1280305. doi: 10.3389/fmars.2023.1280305
Received: 20 August 2023; Accepted: 26 September 2023;
Published: 23 October 2023.
Edited by:
Haixin Sun, Xiamen University, ChinaCopyright © 2023 Wang, Zhang, Huang, Chen, Tang and An. This is an open-access article distributed under the terms of the Creative Commons Attribution License (CC BY). The use, distribution or reproduction in other forums is permitted, provided the original author(s) and the copyright owner(s) are credited and that the original publication in this journal is cited, in accordance with accepted academic practice. No use, distribution or reproduction is permitted which does not comply with these terms.
*Correspondence: Hao Zhang, emhhbmdoYW9Ab3VjLmVkdS5jbg==; Wei Huang, aHdAb3VjLmVkdS5jbg==