
94% of researchers rate our articles as excellent or good
Learn more about the work of our research integrity team to safeguard the quality of each article we publish.
Find out more
ORIGINAL RESEARCH article
Front. Mar. Sci., 19 December 2023
Sec. Marine Fisheries, Aquaculture and Living Resources
Volume 10 - 2023 | https://doi.org/10.3389/fmars.2023.1278778
 Berthe M. J. Vastenhoud1*
 Tobias K. Mildenberger1
 Alexandros Kokkalis1
 Silvia Paoletti1
 Paula Alvarez2
 Dorleta Garcia2
 Alina M. Wieczorek3
 Thor Klevjer4
 Webjørn Melle4
 Sigurður T. Jonsson5
 J. Rasmus Nielsen1
Mesopelagic fish are considered a possible future fisheries resource, but the biological sustainability of their potential exploitation has not yet been assessed. Sustainability should be evaluated at the population level, for which accurate stock-specific life-history parameters are required. Here, we use a length-based model to estimate life-history parameters related to growth and natural mortality, and their uncertainty, for the assessment of Northeast Atlantic populations of Maurolicus muelleri (Gmelin, 1789, Mueller’s Pearlside) and Benthosema glaciale (Reinhardt, 1837, glacier lantern fish). We compare three different approaches to estimate natural mortality rates and provide recommendations for future data collection and monitoring programs. For M. muelleri, we estimated an asymptotic length of 57.98 mm and a von Bertalanffy growth constant of 1.28 year−1, while for B. glaciale, we estimated an asymptotic length of 78.93 mm and a von Bertalanffy growth constant of 0.41 year−1. Estimates of natural mortality rates for M. muelleri were around 1.29 year−1 and 1.80 year−1 based on empirical formulae with the estimated growth parameters and maximum age, respectively, and around 1.51 year−1 with the length-converted catch curve method for B. glaciale estimates ranged between 0.5, 0.68, and 0.75 year−1, with the three respective methods. Due to limited data availability, the estimated uncertainty of the provided life-history parameters is large and should be considered in the evaluation of the sustainability of potential mesopelagic exploitation following the precautionary approach.
The mesopelagic zone of the ocean is located between 200 and 1,000 m deep, enclosed by the epipelagic zone, where light is available, and the bathypelagic zone, where no light penetrates. Global estimates of the mesopelagic fish biomass are large but remain variable, with estimates ranging between 1 and 15 Gt (Gjösæter and Kawaguchi, 1980; Irigoien et al., 2014; Anderson et al., 2019; Proud et al., 2019; Hill Cruz et al., 2023). These high biomass estimates have revived interest in the potential exploitation of mesopelagic species, mainly for the production of fish meal, fish oil, and nutraceuticals (Valinassab et al., 2007; FAO, 2011; FAO, 2016; St. John et al., 2016; Prellezo, 2019; Alvheim et al., 2020; Grimaldo et al., 2020; Olsen et al., 2020; Paoletti et al., 2021). While the potential for exploitation and the economic viability are already being investigated, the ecological sustainability of a potential mesopelagic fishery remains uncertain (Hidalgo and Browman, 2019; Prellezo, 2019; Paoletti et al., 2021; Dowd et al., 2022; Elsler et al., 2022; Kourantidou and Jin, 2022; van der Meer et al., 2023). Nonetheless, potential management strategies should aim for exploitation according to the stock-specific maximum sustainable yield following a precautionary and ecosystem-based approach (UN, 1982; FAO, 1995; UN, 1995; UN, 2002).
In the Northeast Atlantic Ocean, the main potential target fish species are Maurolicus muelleri (Gmelin, 1789, Mueller’s pearlside) and Benthosema glaciale (Reinhardt, 1837, glacier lantern fish) (Grimaldo et al., 2020; Olsen et al., 2020; Albrektsen et al., 2023). The distribution of both M. muelleri and B. glaciale spans the North Atlantic and the Mediterranean Sea (Halliday, 1970; Gjösæter and Kawaguchi, 1980; Rees et al., 2020). Both species perform diel vertical migrations, which vary seasonally and according to life stage—a characteristic of many mesopelagic species (Staby and Aksnes, 2011; Dypvik et al., 2012; Staby et al., 2013; Prihartato et al., 2015). The longevity of M. muelleri can reach up to a maximum of 5 years but varies regionally: Grimaldo et al. (2020) and Kawaguchi and Mauchline (1982)) mainly observed 0- and 1-year-old fish, while individuals up to 3 years were found in Norwegian waters (Gjösæter, 1981b; Goodson et al., 1995). M. muelleri usually reaches a length of 40–50 mm, but individuals up to 70 mm have been observed (Gjösæter, 1981b). B. glaciale grows to a maximum length of about 100 mm over 7–8 years (Gjösæter, 1973). Both species have an extended spawning period, ranging from approximately March to October in the Northeast Atlantic Ocean (do Carmo Lopes, 1979; Gjösæter, 1981b; Rasmussen and Giske, 1994; Goodson et al., 1995; Alvarez et al., 2023) and show high natural mortality rates (Kristoffersen and Salvanes, 1998a; Kristoffersen and Salvanes, 2009). M. muelleri and B. glaciale feed on copepods and euphausiids and are an important resource for higher trophic levels, including commercially important species such as blue whiting (Micromesistius potassium), saithe (Pollachius virens), and juvenile albacore tuna (Thunnus alalunga) (Gjösæter and Kawaguchi, 1980; Gjösæter, 1981b; Kawaguchi and Mauchline, 1982; Bergstad, 1991; Pusineri et al., 2005; Dypvik et al., 2012).
For many stock assessment and ecosystem models used to evaluate the sustainability of potential mesopelagic exploitation, life-history characteristics related to growth and mortality are an essential input (St. John et al., 2016). The current estimates of growth and mortality for M. muelleri and B. glaciale are ontogenetically, seasonally, and regionally variable and often based on limited time series of aging data and/or from geographically confined areas such as fjords (Halliday, 1970; Gjösæter, 1973; Gjösæter, 1981b, Gjösæter, 1981a; Kristoffersen, 2007; Kristoffersen and Salvanes, 2009). For example, both M. muelleri and B. glaciale showed larger asymptotic lengths and higher mortality rates in offshore areas in Norway compared to fjords, and rates between fjords varied (Halliday, 1970; Gjösæter, 1973; Gjösæter, 1981a; Gjösæter, 1981b; Kawaguchi and Mauchline, 1987; Gartner, 1993; Salvanes and Stockley, 1996; Kristoffersen and Salvanes, 1998a). On the other hand, reduced growth rates were reported for adult M. muelleri during autumn and winter, due to reduced feeding, while adult B. glaciale showed lower growth rates during spring and summer, potentially related to spawning (Gjösæter, 1973; Kawaguchi and Mauchline, 1982; Sameoto, 1988; Prihartato et al., 2015).
It is vital to base future stock assessments and the evaluation of the sustainability of a potential mesopelagic fishery on robust growth and mortality information that takes spatial and temporal variability and observation uncertainty into account. There are, however, challenges related to the input data for growth and mortality estimations and common stock assessment methods for those mesopelagic species: the lack of aging and catch data hampers the use of age-based stock assessment and surplus production models [e.g., SPiCT, Pedersen and Berg (2017)], gear avoidance might lead to an underestimation of species-specific abundances of trawl surveys (Kaartvedt et al., 2012), and the use of hydro-acoustic surveys in the mesopelagic zone is challenged by the distinction between trophic levels, species, stocks, and life stages (Proud et al., 2019; Grimaldo et al., 2020; Khodabandeloo et al., 2021; Gjeitsund Thorvaldsen et al., 2023). Length data are a valuable data source that is relatively easy to collect and are often routinely collected during ecosystem surveys and used in length-based methods for data-limited stock assessments (Kokkalis et al., 2015; Kokkalis et al., 2017; Schwamborn et al., 2019; Andersen, 2020). Also for both M. muelleri and B. glaciale, length data provide currently better coverage in space and time compared to age data.
In this study, we used a length-based method developed for data-limited situations (Mildenberger et al., 2017) to estimate robust growth parameters and mortality rates and their uncertainties for B. glaciale and M. muelleri in the Northeast Atlantic that account for the biological variability in growth and mortality and observation uncertainty. We compared those to existing parameter estimates in the region for the two species and evaluated the future perspectives and management implications for their exploitation. We addressed the following aims:
(i) To estimate robust von Bertalanffy growth parameters, and their uncertainties, for M. muelleri and B. glaciale in the Northeast Atlantic region based on available length information.
(ii) To estimate robust natural mortality rates, and their associated uncertainties, for M. muelleri and B. glaciale in the Northeast Atlantic region with empirical formulae and the length-converted catch curve, and to evaluate if the methods result in similar natural mortality estimates for an unexploited population.
We used length frequencies collected during the field campaigns of the H2020 MEESO project (www.meeso.org) and other scientific surveys. The data covers the Norwegian Sea and the North Atlantic region, from the north of the North Sea (58°N) up to 73°N and between 16°W and 12°E (Figure 1).
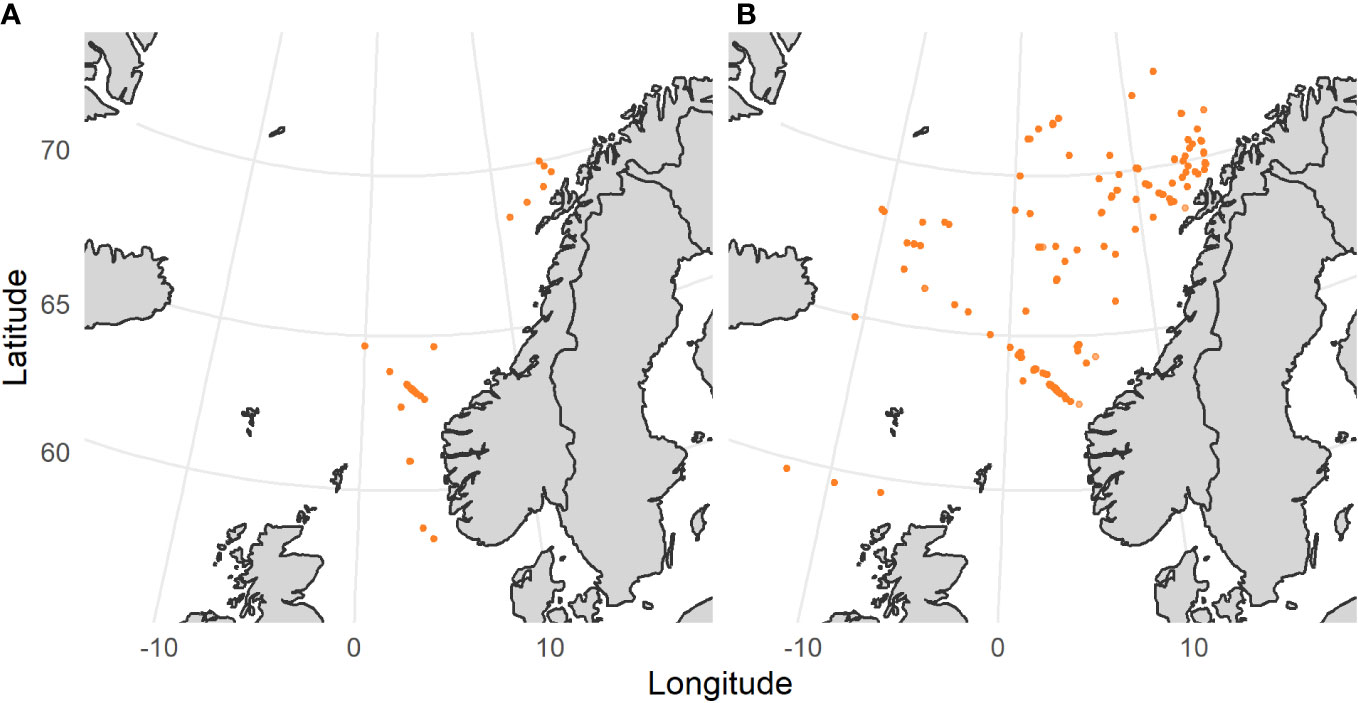
Figure 1 (A) Sampling locations of Maurolicus muelleri. (B) Sampling locations of Benthosema glaciale. Orange dots indicate single-trawl haul samples.
The data cover the period from 2009 to 2020, with sampling conducted between March and October (Table 1). A detailed description of the data collection and processing can be found in Supplementary Material (SM) Section S1. The data were aggregated by species and month, and we only included samples in the analysis where more than 100 individuals were measured. The measured length-frequency distribution in each haul was raised to the total catch of that haul if a subsample was measured to account for differences in sample sizes between hauls within months. The length-frequency distributions used in our analyses are by species, as shown in Supplementary Material Figures 1, 2.

Table 1 Data overview of Maurolicus muelleri and Benthosema glaciale, with an overview of the total number of fish measured in each year and month as well as the minimum and maximum observed length [standard length (SL)].
We applied the Electronic Length Frequency Analysis (ELEFAN) compiled in the TropFishR package (Mildenberger et al., 2017). This method is used globally for the estimation of growth parameters required by fish stock assessment and is robust in even very data-poor circumstances (Chen et al., 2019; Karim et al., 2019; Osei et al., 2021; Asiedu et al., 2022). ELEFAN uses length-frequency (LFQ) data to estimate the parameters of the von Bertalanffy Growth Function (VBGF, von Bertalanffy, 1938):
Here is the length at age L(t) (mm) depending on the asymptotic length L∞ (mm), the von Bertalanffy growth constant K (year−1), and the theoretical age where length is zero (t0). Using ELEFAN, the parameter t indicates “time” rather than “age”: ta is therefore the equivalent of t0 in the year-length coordinate system and can be interpreted as the fraction of the year where the length is equal to zero or the estimated time just before spawning (Pauly, 1980).
Growth parameters are estimated in three steps: (i) the length-frequency data is restructured by scoring the length bins relative to a moving average (MA) calculated from neighboring bins; (ii) a set of VBGF parameters is scored based on the number of peaks that are crossed by the growth curves; and (iii) the set of VBGF parameters is selected, which results in the maximum score value (Taylor and Mildenberger, 2017). The search space of L∞ corresponds to the maximum length in the dataset (Lmax) ± 50%. The search space of K was limited between 0.1 and 2 year−1, and the search space of t0 ranges between 0 and 1. The selected search space limits are based on available data, consider literature values, and are large enough in order not to restrict parameter estimates while ensuring meaningful estimates within the biological limits of the species. We selected a maximum age of 3 and 8 years for M. muelleri and B. glaciale, respectively, which corresponds to the maximum age reported in the region (Gjösæter, 1973; Gjösæter, 1981b). We performed a sensitivity study to determine the optimal bin size and MA, where the best model fits were selected visually according to the number of peaks that were crossed by the growth curves. To estimate the uncertainty of the parameters, we used a nonparametric bootstrapping approach (Schwamborn et al., 2019). It is important to note that the estimated growth parameters represent average values across the sampled years, allowing for the possibility of interannual variability.
We used three independent approaches to estimate the natural mortality rate M (year−1) and associated uncertainty for the two species. The first approach estimates the natural mortality rate based on its relationship with estimated VBGF growth parameters according to the empirical formula by Then et al. (2015). The second approach is a modified version of Hoenig (1983) natural mortality estimator, relying on the correlation between the total mortality rate Z (year−1) and the inverse of the maximum observed age tmax (year). The Hoenig estimator based on tmax is widely used and more robust than other estimators (Kenchington, 2014). In this study, we utilized an updated version of this estimator (Hamel and Cope, 2022), drawing on a comprehensive dataset proposed by Then et al. (2015) and incorporating a more appropriate transformation of the input data. For M. muelleri, we assumed a maximum age of 3 years, while for B. glaciale, the maximum age was set at 8 years, in accordance with the observed maximum ages in the region (Gjösæter, 1973; Gjösæter, 1981b).
As the third approach, we used the length-converted catch-curve method to estimate the total mortality rate Z (year−1) and parameters related to gear selectivity (L50 (mm) and L75 (mm), the lengths at which the fish have a 50% and 75% probability of being caught, respectively). For unexploited stocks where fishing mortality F (year−1) is zero, the estimated total mortality Z is equal to the natural mortality M (year−1). In this method, Z is estimated according to:
with Ni the number of individuals in length class i, dti the time necessary to grow through the length of class. The relative age (age – t0) is indicated by t, and a is the intercept. We assume a logistic selection ogive, characteristic for trawl selectivity, parameterized using length at 50% and 70% retainment (L50 and L75). The length-converted catch-curve method requires a sample of the catch representative of the full year. While combining all samples from all years could result in a more complete length distribution representative of a complete year, it does not account for interannual variability in natural mortality and recruitment success and combines data from different surveys with different sampling regimes. Therefore, we only apply the catch curve to specific years with better data coverage and discuss potential problems caused by incomplete sampling. For M. muelleri, we present the MCatch curve, 2020 for the year 2020. This is the most representative year as it originates from the only trial survey specifically targeting M. muelleri. This is also the only year where the entire length range from around 18 mm to 66 mm was measured, while the other years often show one strong cohort. For B. glacial, we present the MCatch curve, 2018, which is the most recent sampling year and shows the entire length range of the species (21-73 mm). For exploration purposes, we also estimated the mortality rates for the other years for each species as an indication of the interannual variability (Supplementary Material Section S6).
The length measurements were aggregated into length bins of 4 mm for both species. Alternative lower and higher bin sizes between 2 and 10 mm led to noisy or overly aggregated length frequency distributions, respectively (Supplementary Material Section S2). For demonstration purposes, we performed a sensitivity study of the aggregation of the length frequencies to 5 mm, which generated similar growth parameters (Supplementary Material Section S3). The data for M. muelleri mainly showed one or two peaks in the length distribution over a range between 10 and 66 mm, while the data of B. glaciale covered a larger size range (13–73 mm) and mostly showed three length peaks. We performed a sensitivity analysis for MA values between 3 and 7 given the data and length bin sizes. While an MA of 5 or 7 resulted in similar growth parameters (Supplementary Material Section S3), an MA of 3 resulted in low K estimates for both species (Supplementary Material Section S3). A sensitivity study varying the maximum age for both species (M. muelleri: 2 and 4 years and B. glaciale: 6 and 10 years) indicated that the results were consistent (Supplementary Material Section S3). We also performed a sensitivity study on the ELEFAN model settings, which showed that the model fits were robust to the ELEFAN growth model settings (Supplementary Material Section S4).
For M. muelleri, the final growth model estimated maximum density parameter values of L∞ = 57.98 mm, K= 1.28 year−1 and ta = 0.33. The growth curves of this model cross most length peaks (Figure 2).
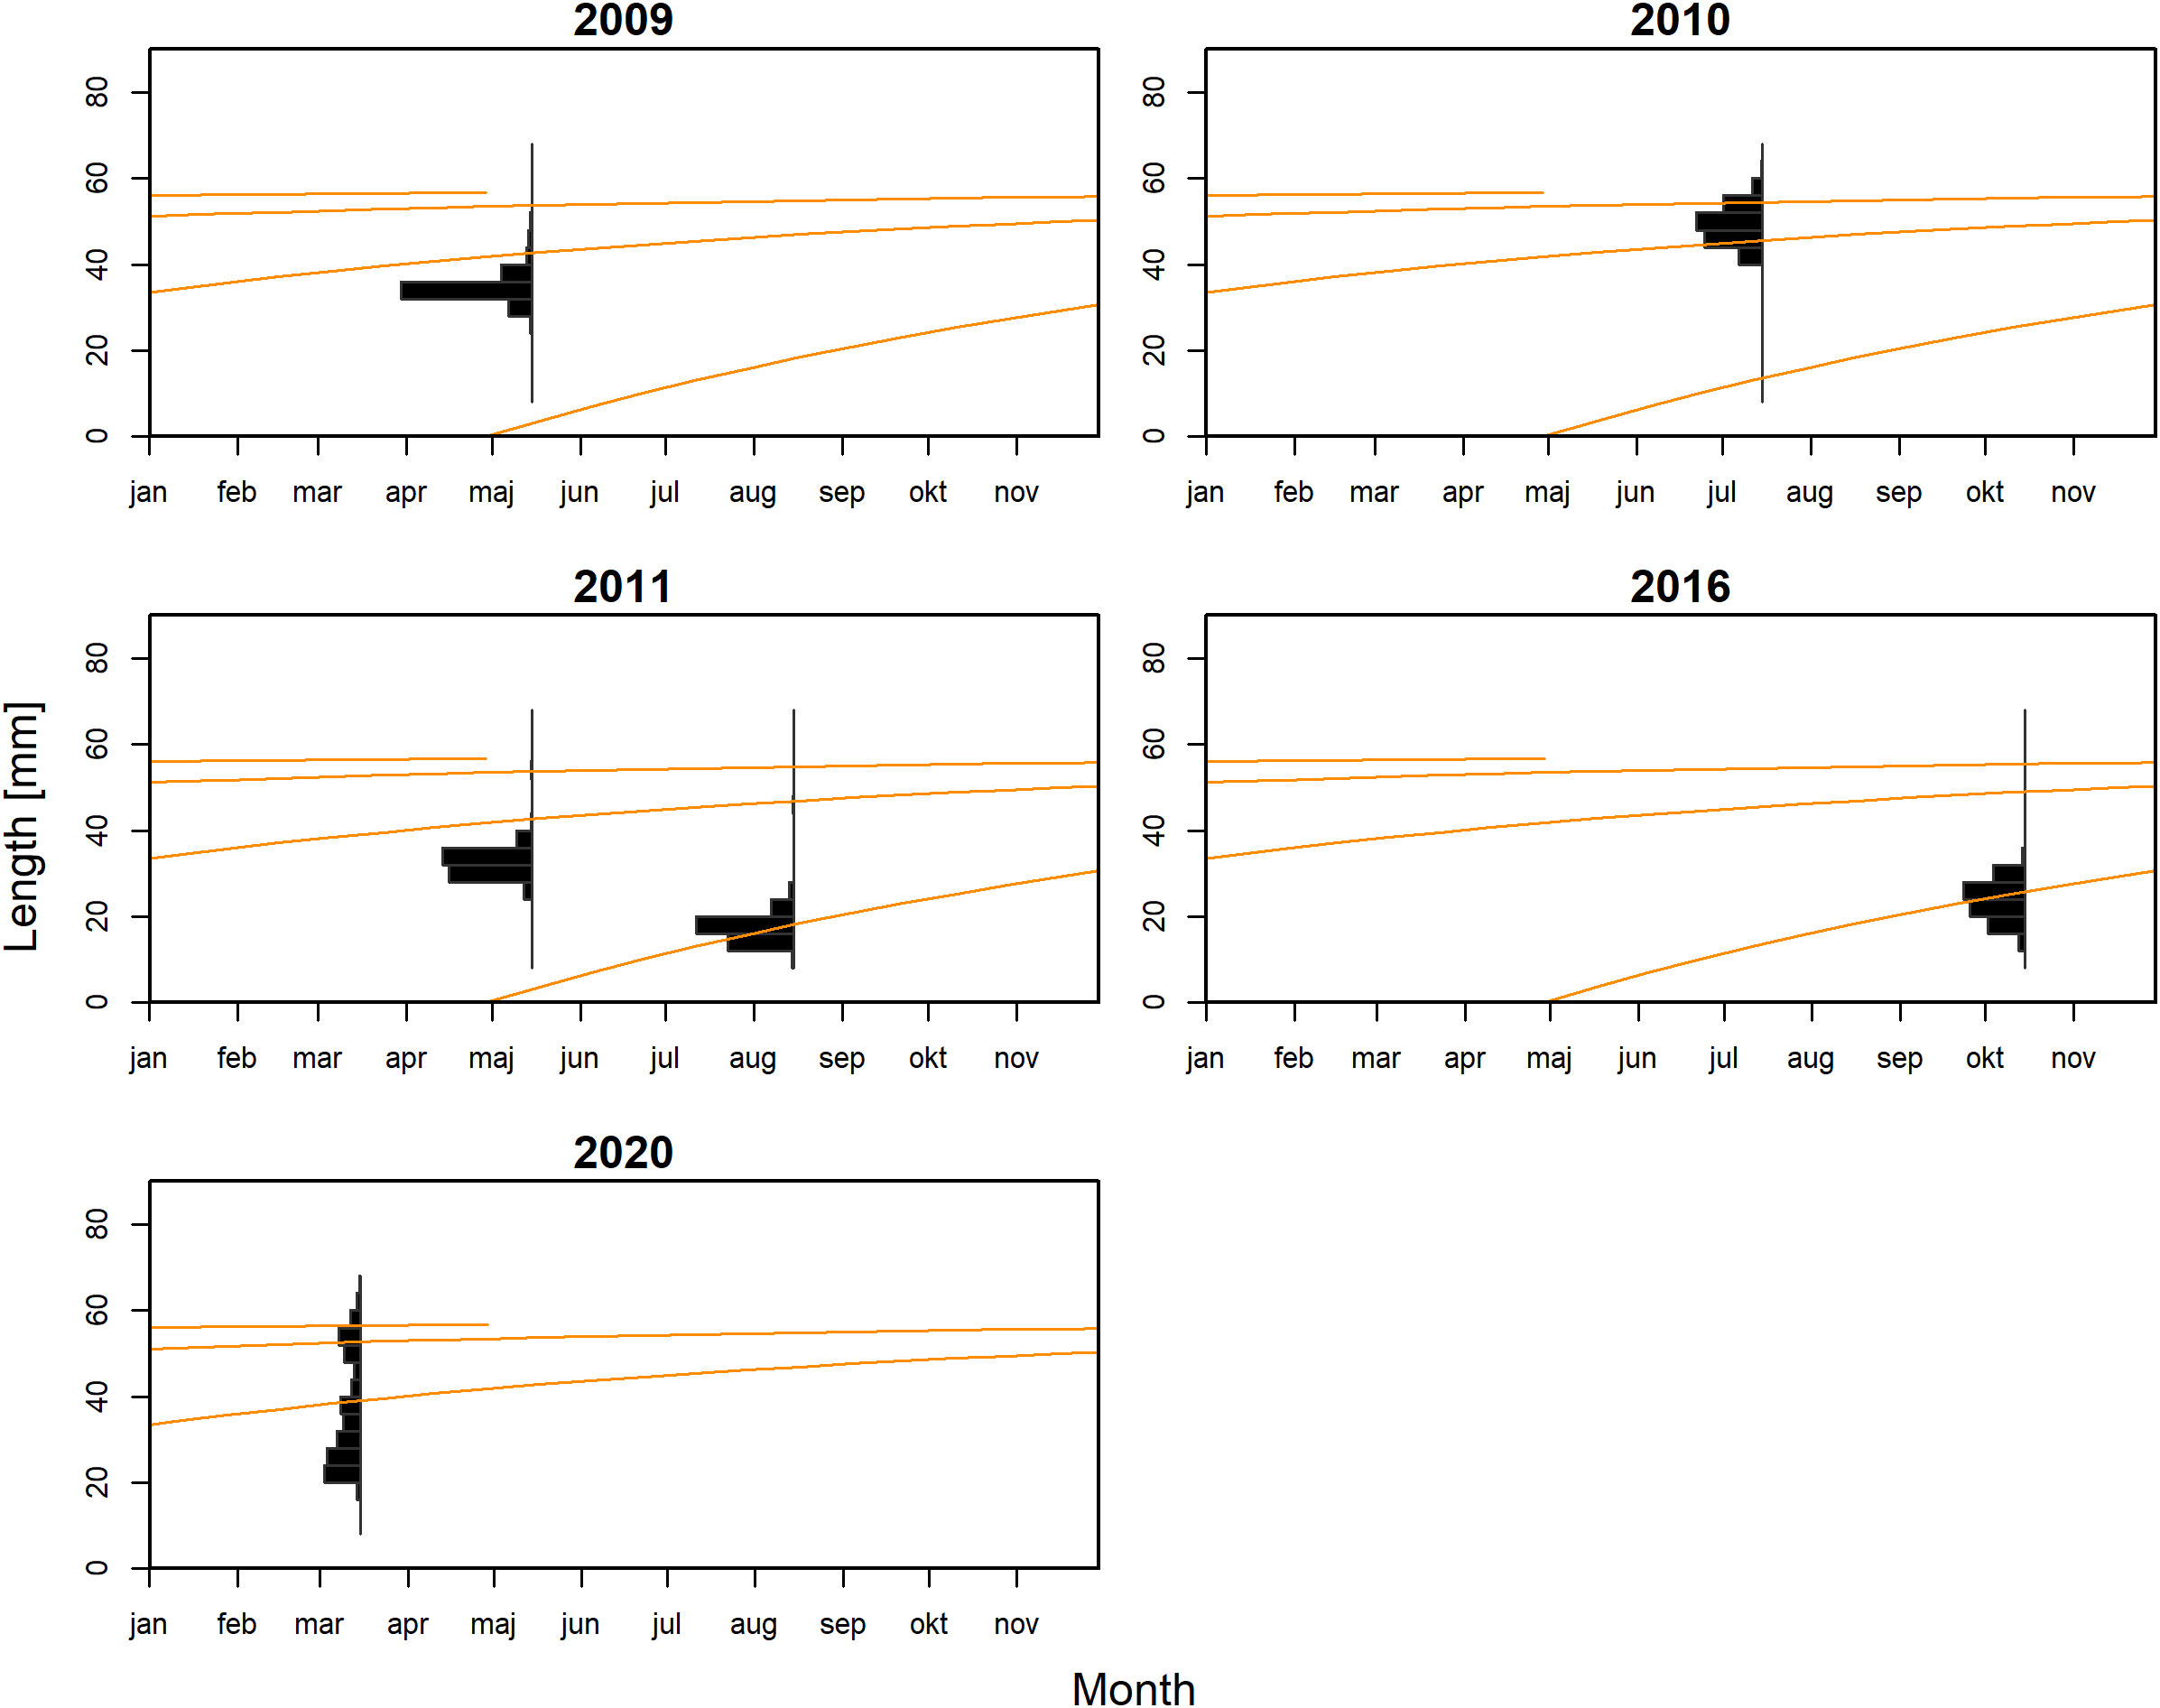
Figure 2 The von Bertalanffy growth curves of Maurolicus muelleri fitted to the length-frequency data.
Using the empirical formula from (Then et al., 2015) and considering the estimated growth parameters along with their uncertainties, we calculated a natural mortality rate of MThen (growth) = 1.29 year−1 for M. muelleri, while the estimate derived from the maximum age was higher, corresponding to MCopeHamel (Max. age) = 1.80 year−1 (Table 2). The estimates obtained with the length-converted catch curve fell within this range with an estimate of MCatch curve, 2020 = 1.51 year−1. Inter-annual variability among catch curve estimates ranged between MCatch curve, 2020 = 1.51 year−1 and MCatch curve, 2016 = 9.1 year−1 (Supplementary Material Section S6.1).
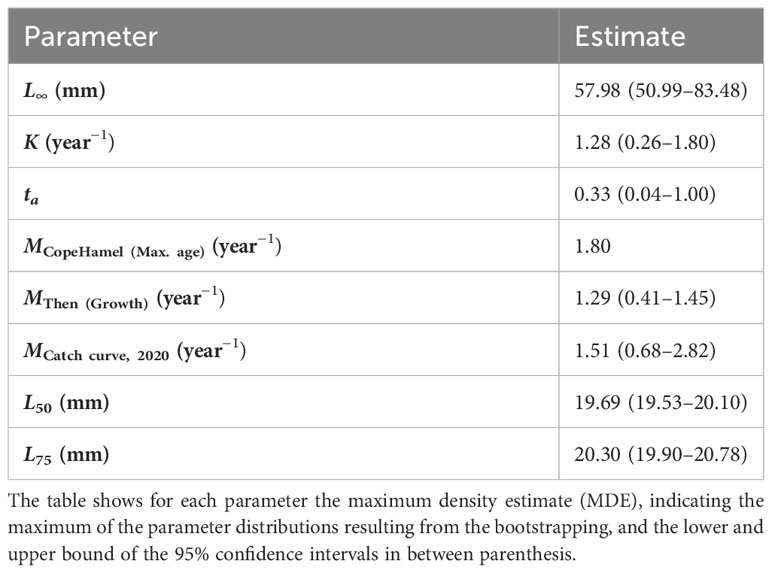
Table 2 Overview of the growth, mortality, and selectivity estimates of Maurolicus muelleri.
The distributions of the parameter estimates show a distinct peak for L∞, ta and the selectivity parameters and a wider range of plausible values for K and the natural mortality estimates (Figure 3). A distinct second peak can be seen in the distribution of ta. Correlation plots between the estimates of L∞ and K showed a primary aggregation of combinations of L∞ and K around L∞ = 57 mm and K = 1.3 year−1, and a secondary aggregation with lower estimates of K = 0.7–1.0 year−1 (Supplementary Material Section S5.2).
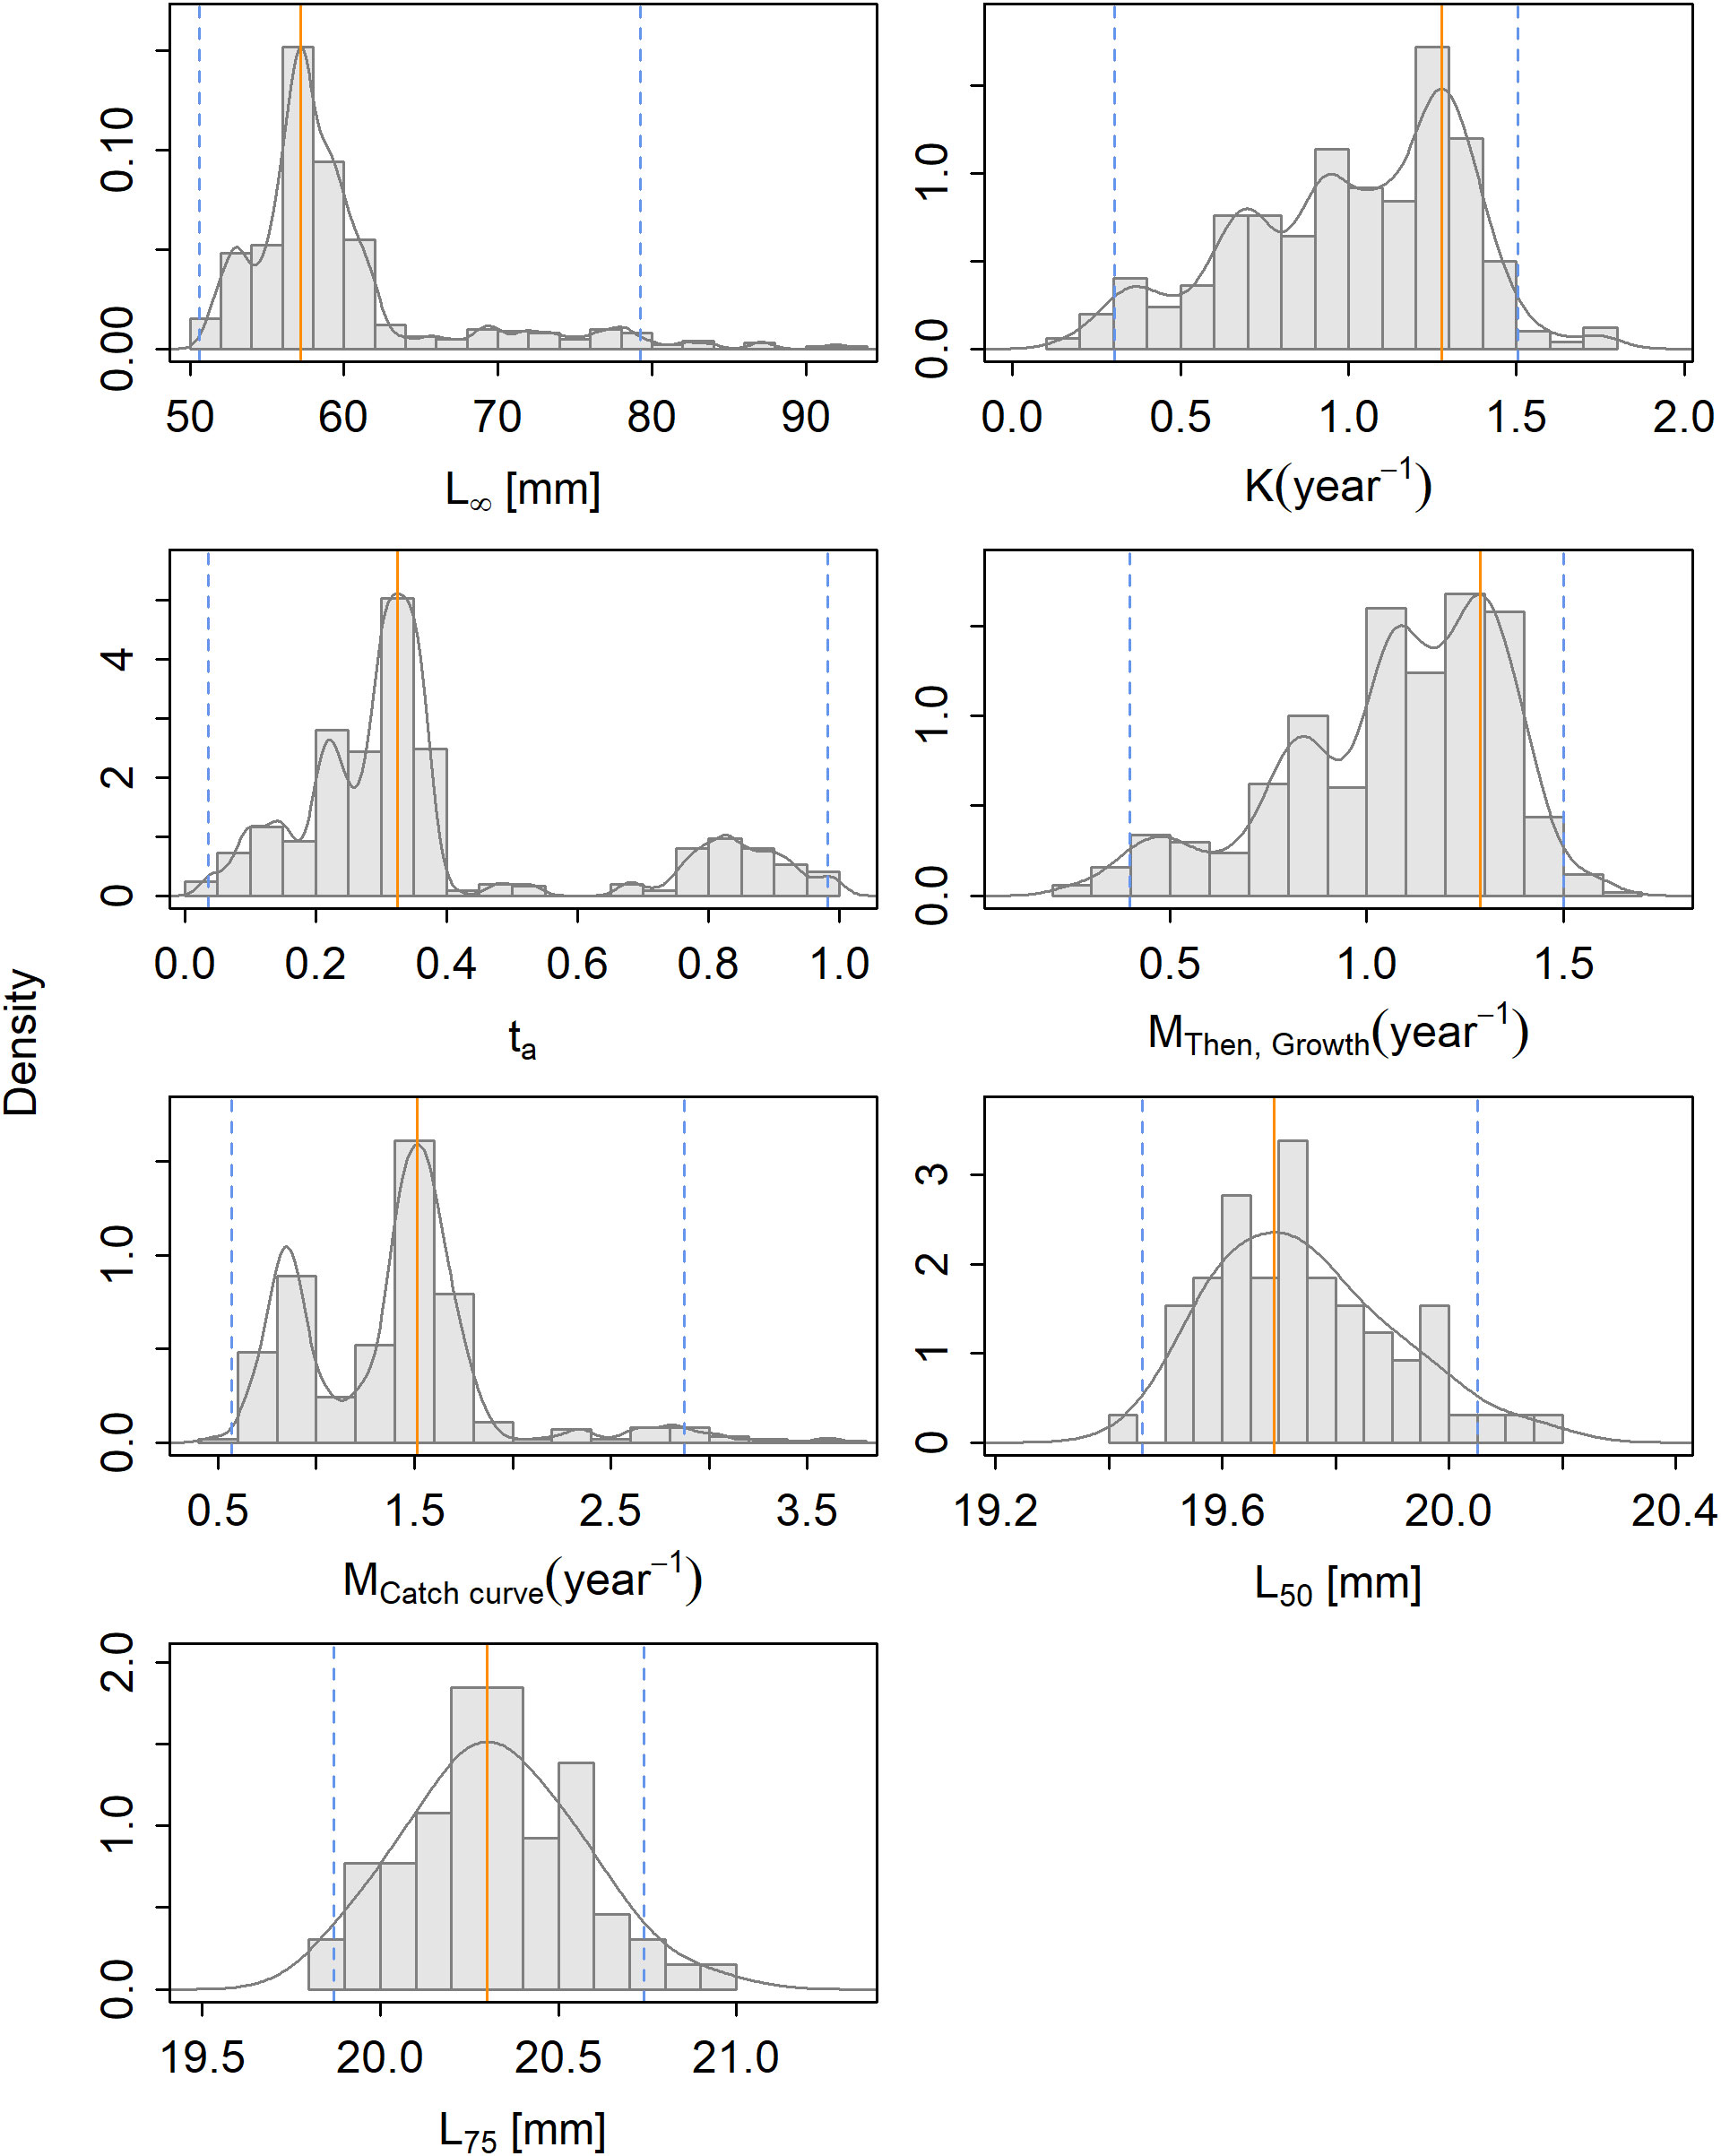
Figure 3 The density of the parameter estimates resulting from the bootstrapping of the selected model for Maurolicus muelleri with the maximum density estimate (solid orange line) and the 95% confidence interval (striped blue line).
The maximum density estimates for growth parameters of B. glaciale are L∞ = 78.93 mm, K = 0.41 year−1 and ta = 0.39. Figure 4 shows the fit of the growth curves to the length data.
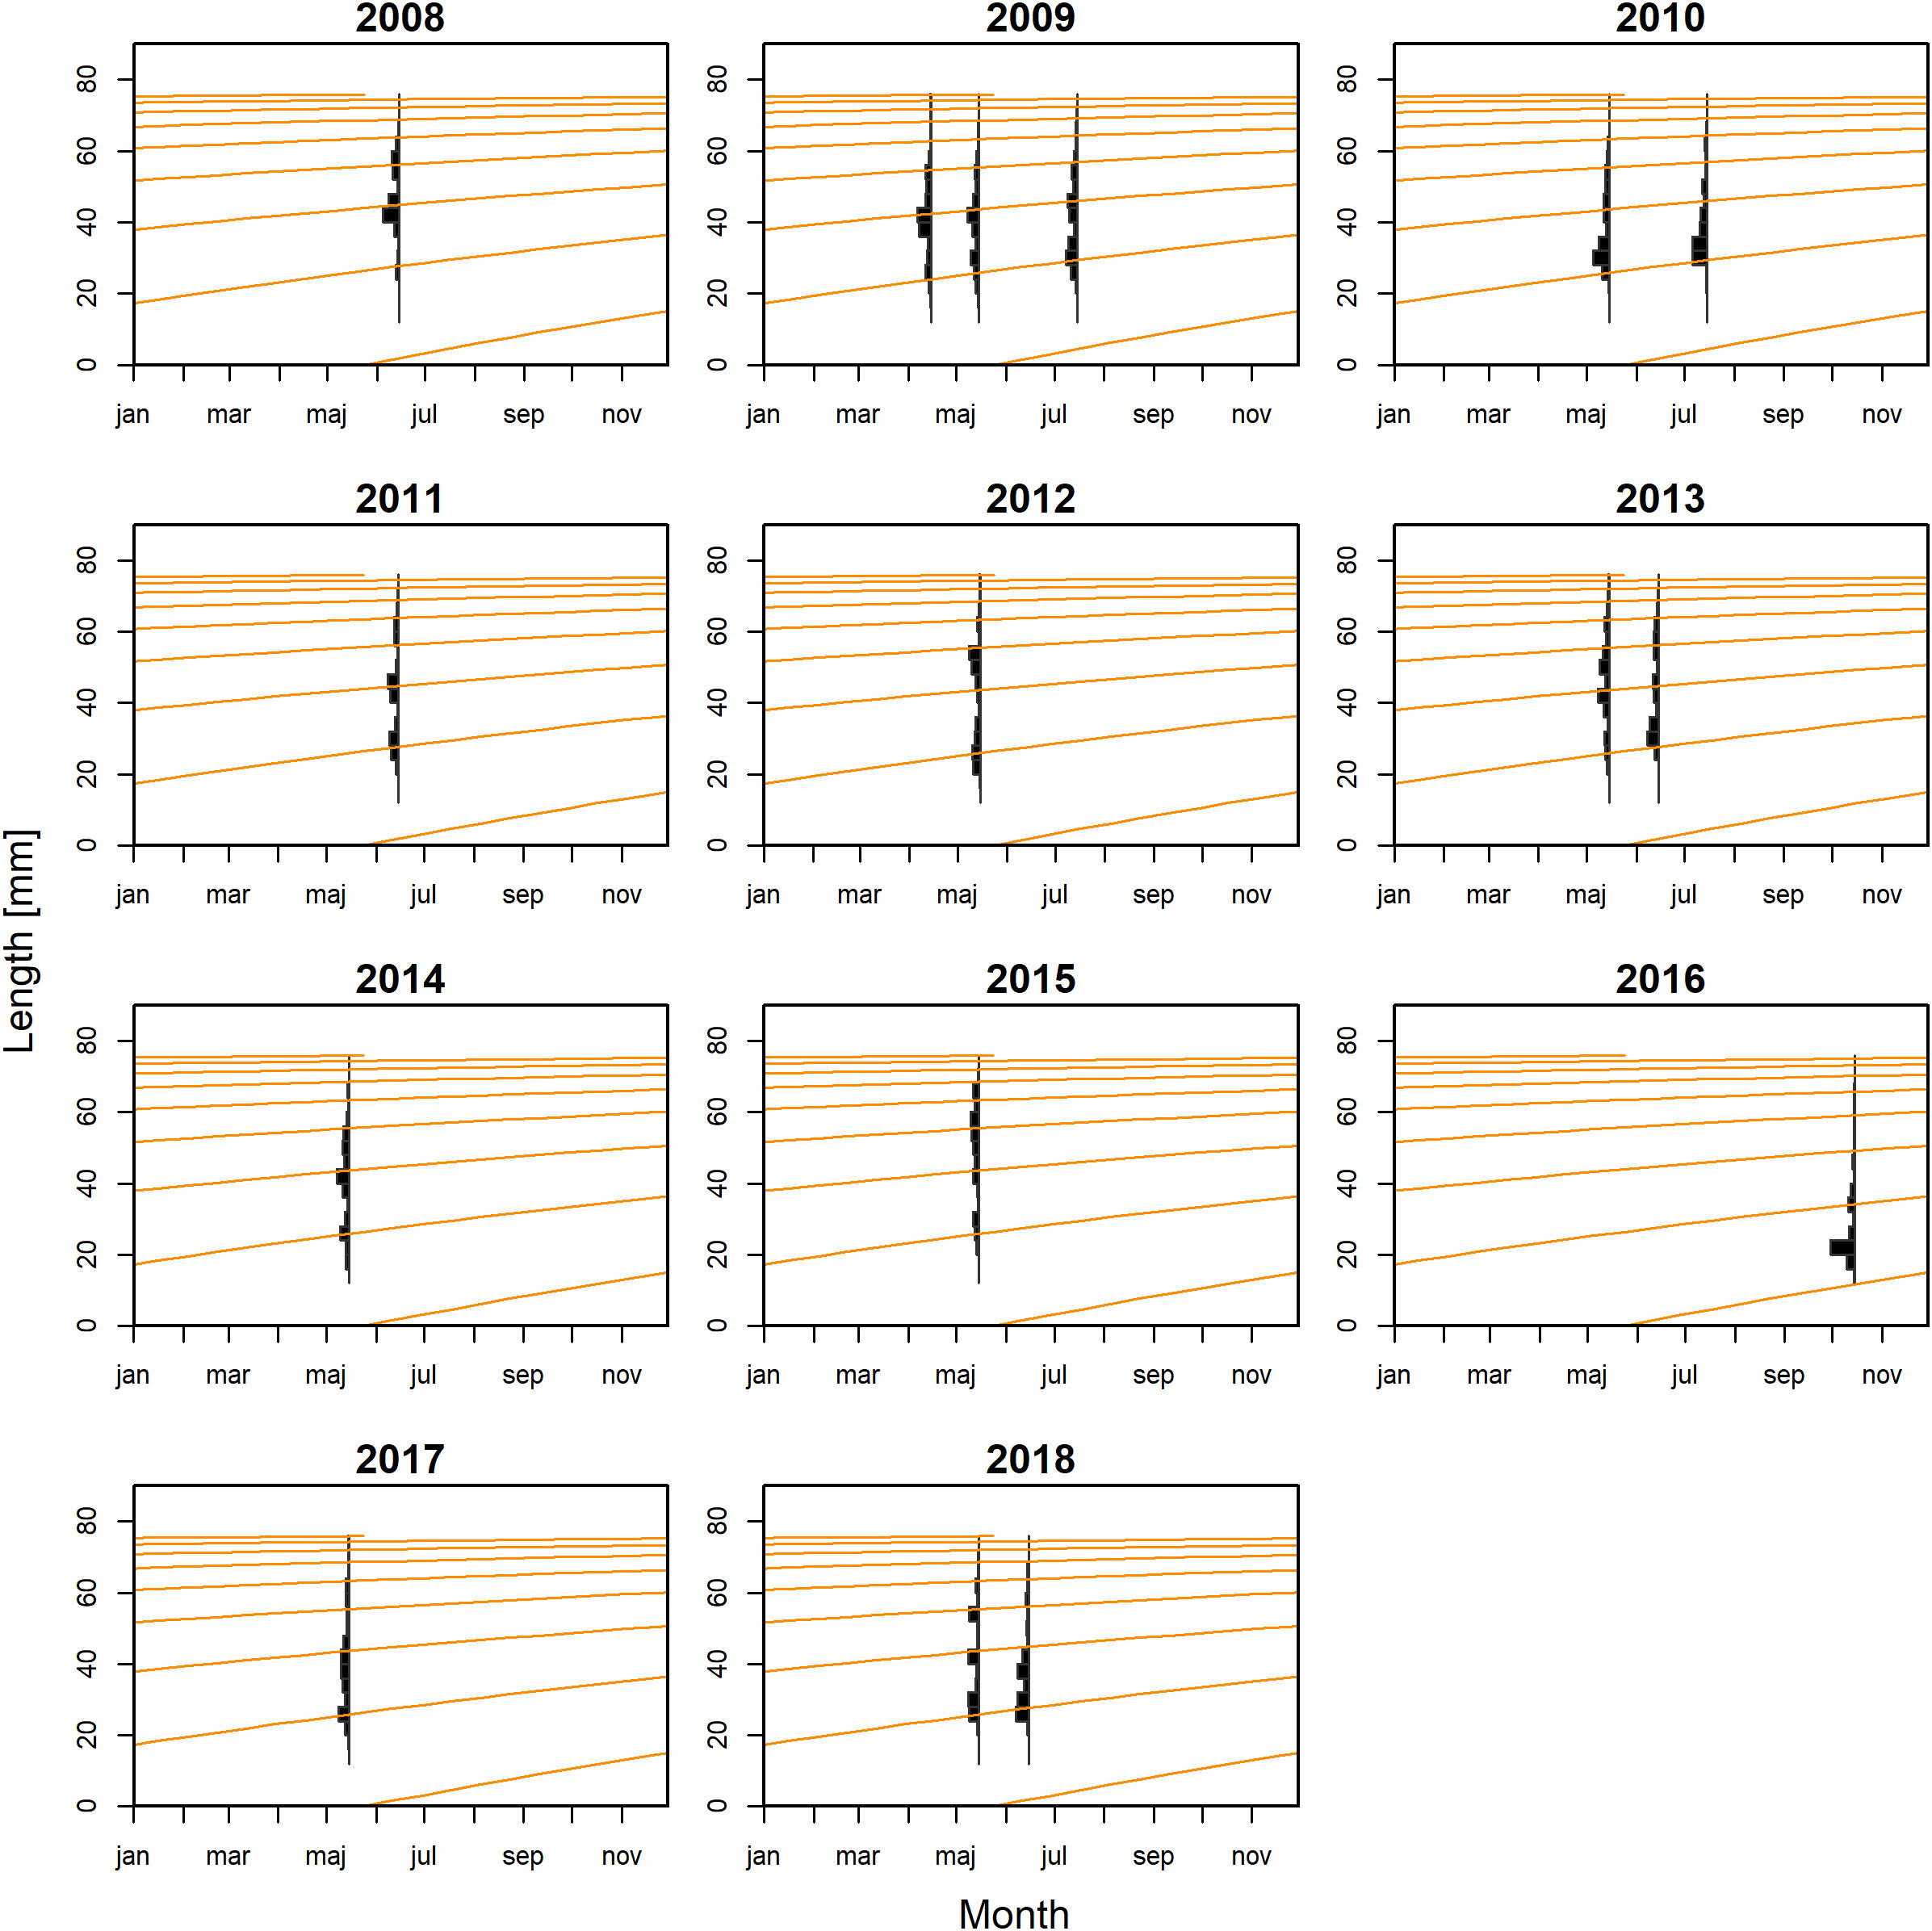
Figure 4 The von Bertalanffy growth curves of Benthosema glaciale fitted to the length-frequency data.
For B. glaciale, we estimated MCopeHamel (Max. age) = 0.68 year−1 based on the relationship with maximum age, and MThen (Growth) = 0.5 year−1 with the empirical formula based on relationships with the estimated growth parameters (Table 3). The MCatch curve was 0.75 year−1 for 2018, and the estimates ranged between 0.5 and 1.44 year−1 between years (Supplementary Material Section S6.2).
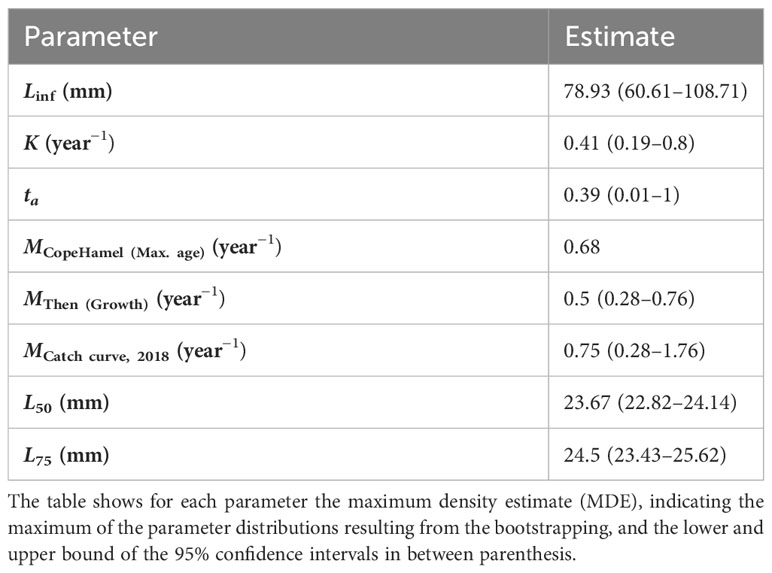
Table 3 Overview of the growth, mortality and selectivity estimates of Benthosema glaciale.
The bootstrapping distributions show distinct peaks for all parameters (Figure 5). Correlation plots between the estimates of L∞ and K showed one main aggregation of L∞–K combinations (Supplementary Material Section S5.2).
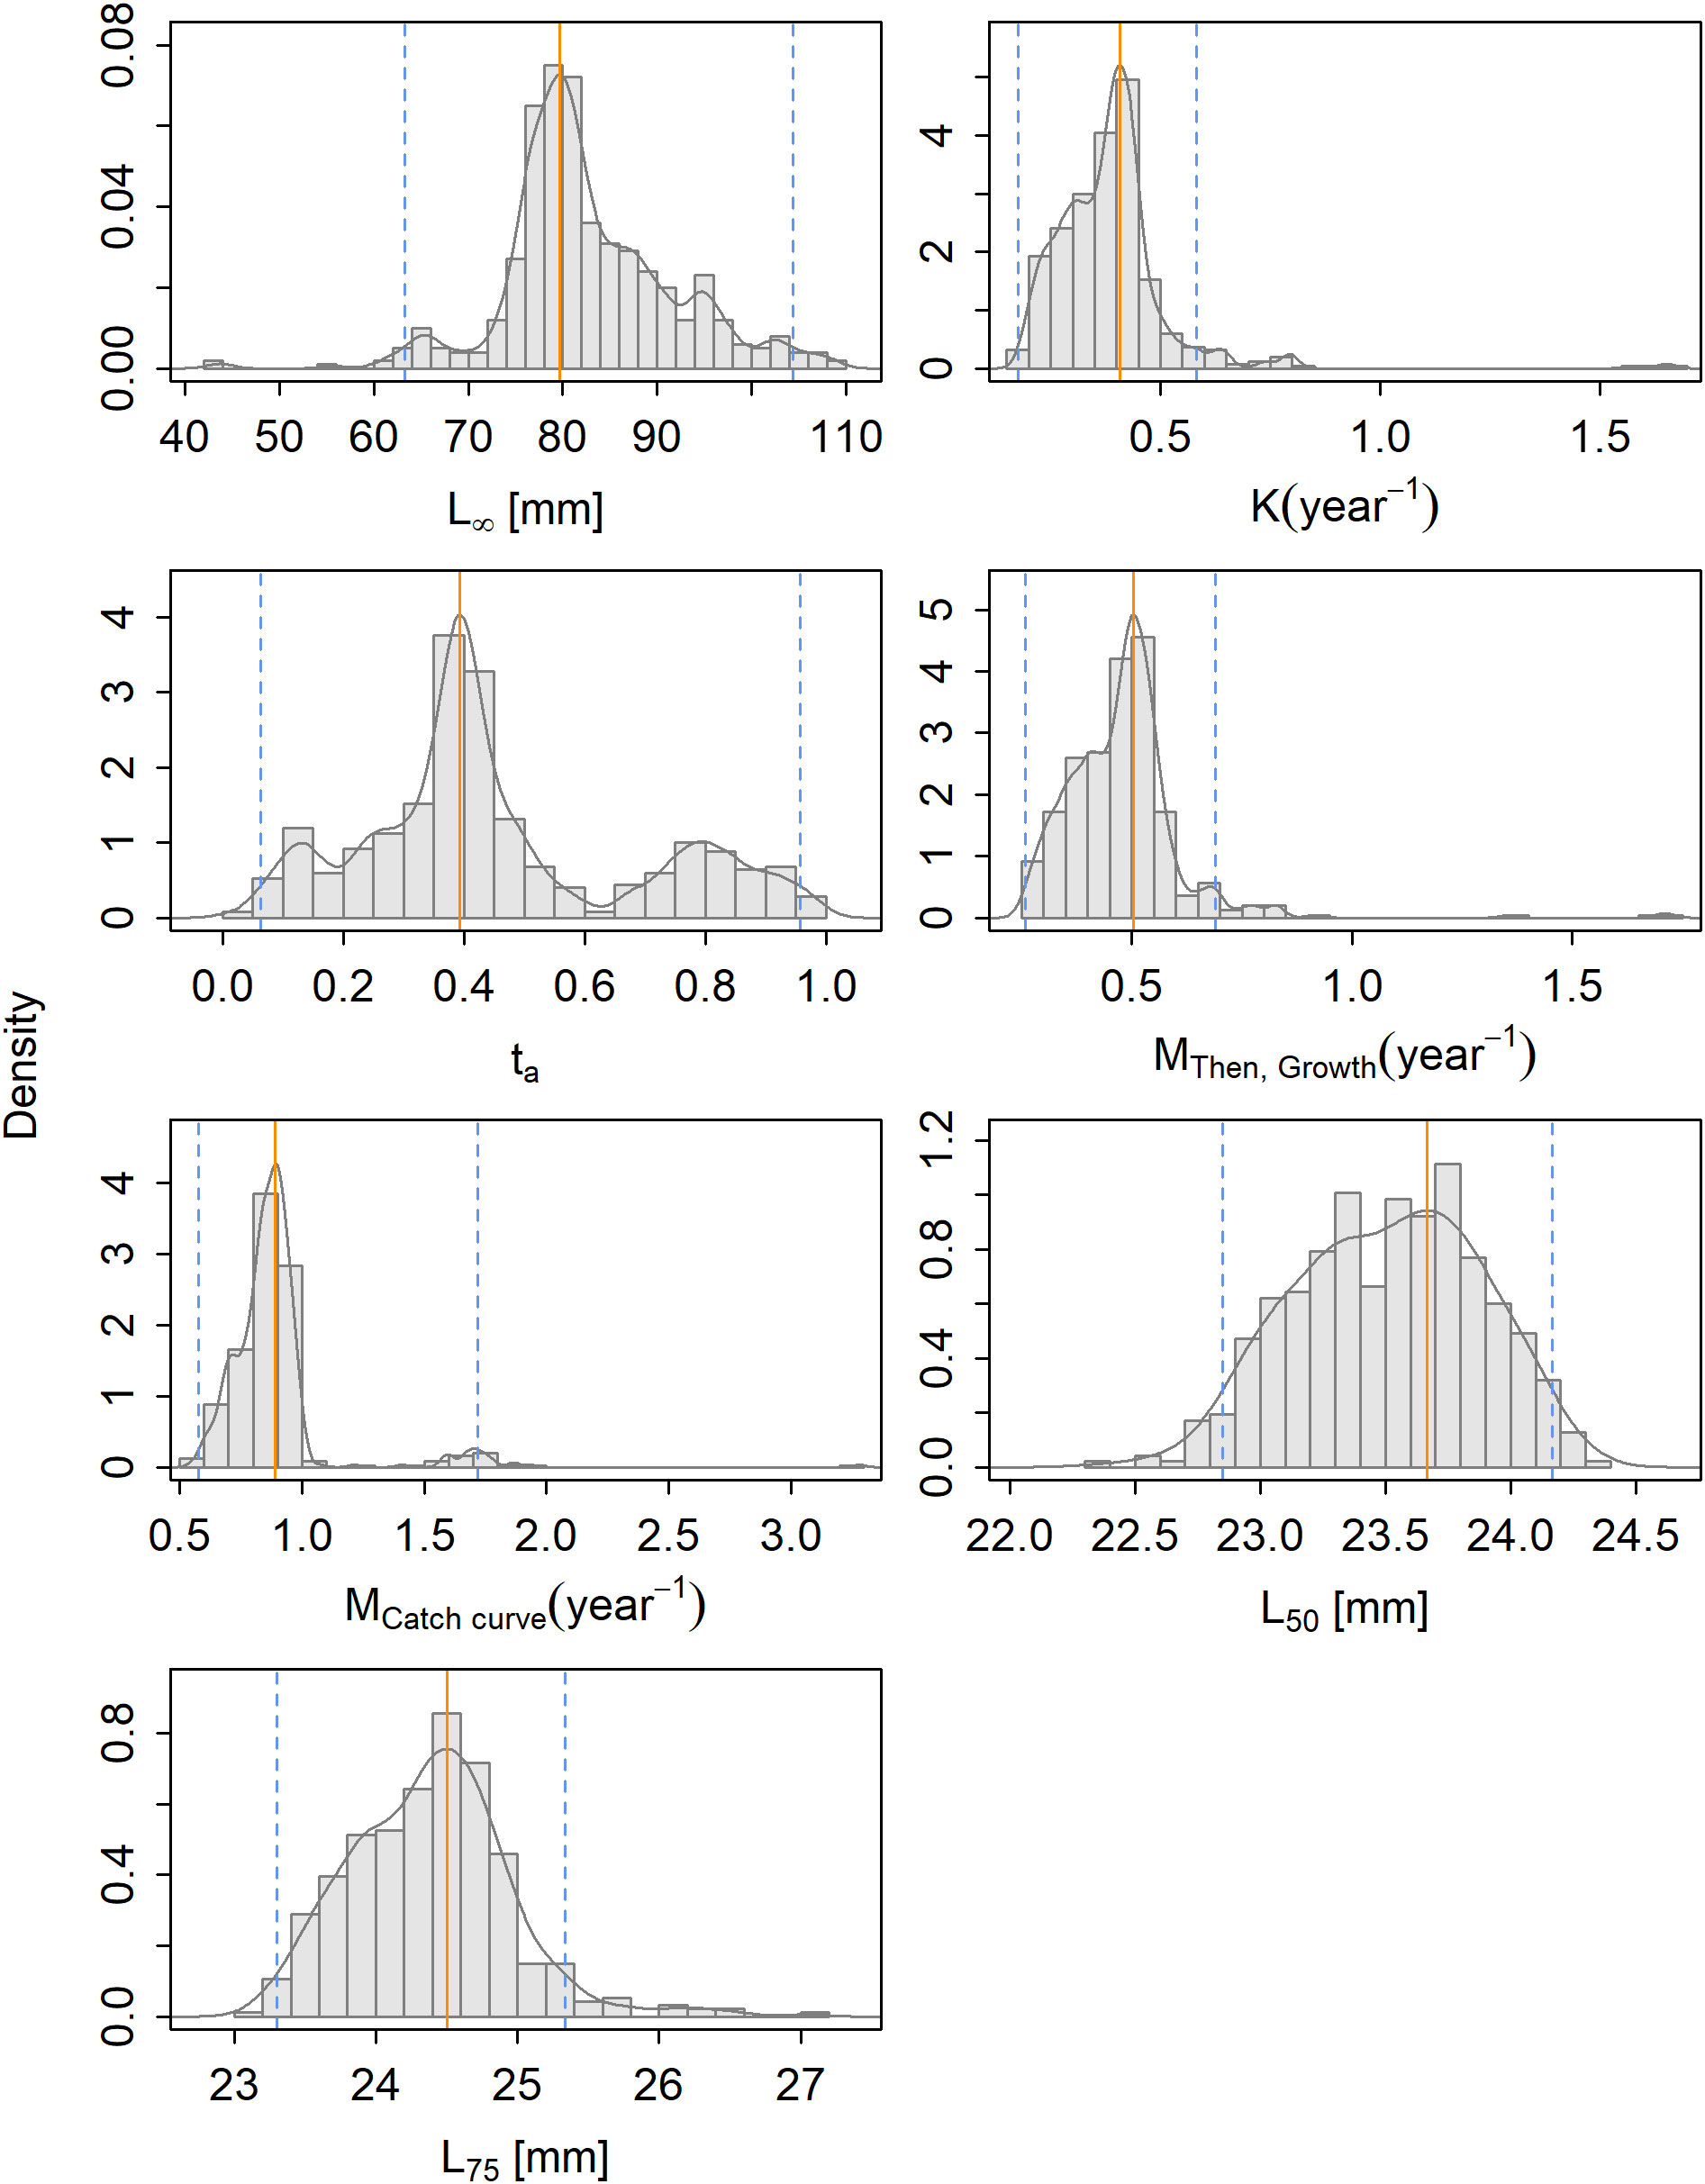
Figure 5 The density of the parameter estimates resulting from the bootstrapping of the selected models for Benthosema glaciale.
In this study, we have used an integrated modeling approach specifically designed for data-poor situations (Mildenberger et al., 2017; Taylor and Mildenberger, 2017; Schwamborn et al., 2019) to estimate growth parameters, mortality rates, gear selectivity parameters, and their uncertainties for M. muelleri and B. glaciale in the Northeast Atlantic. The analyzed dataset is one of the longest existing time series covering a large area in the Northeast Atlantic region and therefore an essential complement to the existing life-history estimates of the two species, especially since parameter uncertainties are also considered here. Providing accurate estimates of population vital rates related to growth and mortality is an essential step in ensuring sustainable potential harvesting of mesopelagic resources as a basis for tropho-dynamic or population-dynamic modeling.
For M. muelleri, we estimated an asymptotic length of 57.98 mm and a von Bertalanffy growth constant of 1.28 year−1. M. muelleri is a fast-growing species that often reaches maturity after the first year (Gjösæter, 1981b; Rasmussen and Giske, 1994; Alvarez et al., 2023). Previously reported L∞ estimates for M. muelleri in the Norwegian Sea ranged between 43.8 and 61.2 mm, and K estimates ranged between 0.88 and 2.0 year−1 (Supplementary Material Table S6). The estimates in this study fall within those previously reported ranges, and the high estimates of K and few length peaks in the data correspond to the observation of mainly 0- and 1-year-old fish (Gjösæter, 1981b; Goodson et al., 1995; Grimaldo et al., 2020). The L∞ is slightly lower than the maximum observed length of the species [70 mm, (Gjösæter, 1981b)], which is not uncommon. Small-scale differences in growth have been observed for the species in the Norwegian Sea: individuals in the open sea show a lower growth rate and larger asymptotic size (K = 0.88 year−1, L∞ = 59.4 mm) compared to populations from individual fjords (K = 1.05 year−1, L∞ = 48.8 mm) (Gjösæter, 1981b), but also populations between fjords showed differences in growth (Kristoffersen, 2007). Furthermore, female M. muelleri can reach a larger asymptotic size (Kristoffersen, 2007; Alvarez et al., 2023), but the analyzed dataset contained insufficient information to include this factor in the analyses. The parameter ta indicates the fraction of the year where the length is equal to zero (see Estimation of growth parameters), and is for M. muelleri estimated at 0.33. This estimate indicates a spawning time of April–May which falls within the reported spawning season in the region ranging from March to October (Gjösæter, 1981b; Rasmussen and Giske, 1994). Although this is the best fit for the growth curve for M. muelleri, not all length peaks are crossed, and the growth curves do not pass through the first length peaks in May 2009, May 2011, and March 2020. Changes in parameter settings related to bin size, moving average, or maximum age did not improve the model fit (Supplementary Material Section S3.1). However, increasing the model fit from one to two spawning events in a year improved the model fit (Supplementary Material Section S3.1). It is possible that multiple spawning events occur for the species: Gjösæter (1981b) found ripening and ripe fish in the region in March–May and October–November and reported two size groups of oocytes. In the Bay of Biscay, there was an indication of spawning of M. muelleri in March–May and in September (Alvarez et al., 2023). A prolonged spawning season has also been reported in the Rockall Through (Kawaguchi and Mauchline, 1987). However, the improved model fit might also result from the sparsity of the data or from other variability, including interannual variation in spawning time or the presence of multiple populations. As the current study does not allow us to identify the driver of the improved model fit allowing for two spawning events, we do not present this model in the main results.
For B. glaciale, we estimated an asymptotic length of 78.93 mm and a von Bertalanffy growth constant of 0.41 year−1. Comparative estimates in the Norwegian Sea (L∞ = 64.8–106.2 mm and K = 0.18–0.60 year−1, see also Supplementary Material Table S6) indicated lower asymptotic length and higher K estimates in fjords compared to open waters, potentially resulting in differences in visibility or food availability (Gjösæter, 1973; Gjösæter, 1981a; Kristoffersen and Salvanes, 2009). The L∞ estimated in this study is smaller than another estimate from the Norwegian Sea but larger than the fjord estimates from that same study (Kristoffersen and Salvanes, 2009) and corresponds to the range reported by Gjösæter (1981a). Our K estimates fall within the range of estimates combining fjord and open water samples (Gjösæter, 1973; Gjösæter, 1981a) but are larger than a sample from open water alone reported by Kristoffersen and Salvanes (2009) and Gjösæter (1973); Gjösæter, (1981a). The lower von Bertalanffy growth coefficient (K) and larger L∞ for B. glaciale reflect its higher longevity compared to M. muelleri, where maturity is only reached after 2–3 years and the maximum lifespan is 8 years. The ta estimate of 0.39 indicates a spawning time in late May, slightly preceding the June–July peak reported for B. glaciale in the region (Gjösæter, 1981a).
In this study, we used the classic ELEFAN method, improved with more powerful optimization methods and nonparametric bootstrapping, for the estimation of uncertainty in the growth estimations (Pauly, 1980; Efron and Tibshirani, 1993; Mildenberger et al., 2017; Schwamborn et al., 2019). The use of a length-based method following length cohorts is appropriate for the species, though especially M. muelleri grows fast; differences in mean length could be found between different age groups for both species (Gjösæter, 1981a; Alvarez et al., 2023). ELEFAN is an established method that continues to be used to date for different data-limited instances (see, e.g., Osei et al., 2021; Asiedu et al., 2022) and has been further developed since the early versions (Pauly and David, 1981). The ELEFAN_GA approach used in this study has a curve-fitting algorithm that allows for unconstrained search within a multidimensional parameter space and is more flexible compared to the original (Mildenberger et al., 2017). Furthermore, the nonparametric bootstrapping approach addresses the variability in goodness of fit within the data and provides 95% confidence intervals for all estimates (Schwamborn et al., 2019). However, the ELEFAN method remains sensitive to the model settings and configuration that must be provided by the user, such as the moving average in the restructuring or the lower and upper limits of the search space for the genetic algorithm (Taylor and Mildenberger, 2017; Wang et al., 2020; Zhou et al., 2022). To take this sensitivity into account, we did extensive sensitivity studies selecting robust model settings (see Results and Discussion).
The estimates of the natural mortality rate for M. muelleri using an empirical formula and the catch curve method, with MThen (Growth) = 1.29 year−1 MCopeHamel (Max. age) = 1.80 year−1 and Mcatch curve, 2020 = 1.51 year−1, were slightly lower than other estimates in the Norwegian Sea, which range between 1.8 and 2.25 year−1 as estimated with different methods (Gjösæter, 1981b; Rasmussen and Giske, 1994; Kristoffersen and Salvanes, 1998a). Higher natural mortality rates were observed in open waters compared to fjords (Gjösæter, 1981b; Kristoffersen and Salvanes, 1998b). An overview of previously estimated natural mortality rates can be found for both species in Supplementary Material Table S7. Potential factors influencing natural mortality include light intensity and turbidity. A reduction in predation rates of an order of magnitude has been observed with a 50-m depth increase, potentially due to those factors (Rasmussen and Giske, 1994; Kristoffersen, 2007). Increased mortality of 2- and 3-year-old fish was observed during the summer, potentially due to spawning (Gjösæter, 1981b). The estimates of natural mortality for B. glaciale (MThen (Growth) = 0.5 year−1, MCopeHamel (Max. age) = 0.68 year−1, MCatch curve = 0.75 year−1) correspond to previously reported estimates in the region between 0.52 and 1.75 year−1, without clear patterns between fjords and open water samples (Gjösæter, 1973; Gjösæter, 1981a; Kristoffersen and Salvanes, 2009).
Natural mortality M is an important parameter in productivity estimates of populations and stock assessments but is also notoriously difficult to estimate (Kenchington, 2014; Punt et al., 2021). The parameter varies with sex, length, age, and other ecological and physiological factors, including food availability, predator abundance, disease, and environmental effects, and complex interactions between those factors, resulting in potential bias and variance when these factors are little understood, as in the current case. Overestimation of M can result in a positive bias in biomass estimates in stock assessments and vice versa, as well as biased fisheries management reference points and ineffective management advice that can be directly related to the error in the M estimates (Punt et al., 2021). This error can result from the use of biased estimates, incorrect estimates of precision, or an increased likelihood that incorrect models are selected (Punt et al., 2021). In the case of data-limited stocks, where it is not possible to estimate M directly within stock assessments, M can be estimated indirectly from empirical relationships between M and life-history parameters such as longevity (tmax) and growth (Pauly, 1980; Hoenig, 1983; Gislason et al., 2010; Kenchington, 2014; Then et al., 2015), life-history theory, or directly by the use of catch-at-age data, allowing for the application of the catch curve method, or mark-recapture data.
The different methods have advantages and disadvantages when applied to the current data and species, and when estimating M outside stock assessment models, the use of multiple estimating methods with robust sensitivity exploration is required (Kenchington, 2014; Punt et al., 2021; Maunder et al., 2023). Different methods show different relationships with M, and they are only as good as the quality of their input parameters (Kenchington, 2014). A general consideration when applying an empirical formula exploiting the correlation with maximum age and life-history parameters is that the underlying meta-studies used to derive the relationships hardly include any mesopelagic species or information from species below 10 cm (e.g., Gislason et al., 2010). The Hoenig estimator based on tmax is widely used and performs relatively well (Kenchington, 2014; Hamel and Cope, 2022). Though widely used, estimators based on maximum age are challenged by the quality of the data used in the meta-analysis and the representation of species with similar life histories, but also by the determination of maximum age, which is often difficult to do accurately, requires a validated aging protocol, and varies for the species under investigation according to region. In terms of selectivity and gear avoidance behavior, it is important to note that the estimate is based on the maximum age observed rather than the maximum age in the population (Maunder et al., 2023). The use of only the old fish might cause instability and extreme sampling error when using only age-based estimators, as there might be significant interannual variability in year-class strength, especially for short-lived species such as M. muelleri. The estimator based on relationships with growth parameters requires accurate estimates of the associated life-history parameters, and bias or error in those estimates will impact the predictions of M (Kenchington, 2014; Punt et al., 2021; Maunder et al., 2023). It can also be assumed that the error already exists in the data used to obtain the relationships, and therefore the relationships should be considered the correlation between estimated rather than true values of M and life-history covariates (Maunder et al., 2023). Furthermore, K and L∞ estimates are often confounded, resulting in significant uncertainty in the K estimates. We hence applied the method to the estimated growth parameters, including their estimated uncertainty from the non-parametric bootstrapping. However, the prediction error of M from empirical methods remains complicated due to the multiple and often unknown sources of uncertainty (Hoenig et al., 2016). The length-converted catch curve method provides information on the total mortality, from which natural mortality can be derived when fishing mortality is known to be negligible (Maunder et al., 2023). However, M estimates from this method might be confounded by changes in selectivity and catchability, and the model might be sensitive to nonequilibrium conditions such as recruitment strength, length-at-age, or predator and prey abundance, which are highly variable in the case of short-lived species (Hordyk et al., 2019). Therefore, this method might be especially sensitive to the gear avoidance behavior of the species as discussed below, potentially leading to an overestimation of M (Punt et al., 2021). The length-converted catch curve method is also more sensitive to sparse data as it assumes the availability of data throughout an entire year.
The length-based methods used to estimate growth and natural mortality rates assume the length-frequency distributions to be representative of the population over the sampled period. However, size distribution sampling is affected by many confounding factors, including (i) environmental conditions, (ii) the selectivity of the gear, and (iii) the spatial and temporal coverage of the sampling and under-sampling, which we discuss in the following paragraphs (Fock et al., 2019). Environmental conditions affect size-distribution sampling and subsequent parameter estimations, and seasonal and ontogenetic differences in vertical distributions have been observed for both M. muelleri and B. glaciale (Dypvik et al., 2012; Prihartato et al., 2015). This underlines the importance of sampling time and depth to cover representative parts of the population. For example, M. muelleri forms two distinct sound scattering layers (SSL) during winter, where the upper layer consists of juveniles and the lower layer consists of adults (Gjösæter, 1981a; Kawaguchi and Mauchline, 1982; Giske et al., 1990; Gjeitsund Thorvaldsen et al., 2023). The adults remain in the lower water layers while juveniles continue their vertical migrations from the upper SSL to shallow waters during dusk. The migrating behavior of juveniles and adults synchronizes again in spring. In the mesopelagic zone, light is an important factor driving the vertical migrations of species since visual foragers require light to find their prey (McFarland, 1986; De Robertis, 2002). The vertical distribution patterns and migrating behavior of many mesopelagic species are determined by their “light comfort zone”, which is also associated with foraging, prey density, and predator avoidance (Kaartvedt et al., 2009; Staby and Aksnes, 2011; Prihartato et al., 2015; Røstad et al., 2016; Langbehn et al., 2019; Gjeitsund Thorvaldsen et al., 2023).
To take into account the selectivity of the gear, we estimated gear selectivity parameters according to a trawl-type logistic curve (Grimaldo et al., 2020; Grimaldo et al., 2022) and found for M. muelleri a value of L50 = 19.69 mm and for B. glaciale, the estimate of L50 = 23.67 mm. Selectivity is affected by the gear and mesh size used and other factors including the trawling operation, trawling speed, net opening, geometry, retention, and morphology of the fish, as well as the species-specific behavior in relation to those factors (Pearcy, 1983; Heino et al., 2011; Fock et al., 2019). Escaping and avoidance behavior of mesopelagic fish to trawls have been reported (Gjösæter and Kawaguchi, 1980; Pakhomov and Yamamura, 2010; Kaartvedt et al., 2012), which could be affected by bio-luminescence, environmental conditions related to visibility, such as turbidity or light availability, or by the light and noise emitted by research vessels (Pearcy, 1983; Koslow et al., 1995; Jamieson et al., 2006; Benoit-Bird et al., 2010; Penã and Ratilal, 2019). Such behavior can result in under-sampling, especially of larger individuals. A misspecified asymptotic selectivity curve might result in positively biased estimates of natural mortality (Maunder et al., 2023). However, knowledge gaps remain regarding the behavioral patterns and catchability of the species, and potential size-specific differences herein are necessary to correct for the escaping behavior (Grimaldo et al., 2020; Grimaldo et al., 2022).
The spatial and temporal coverage of the data used in this study is limited, increasing the uncertainty of the parameter estimates. To reduce the parameter uncertainty and ensure appropriate evaluation of the sustainability of a potential mesopelagic fishery, it is vital that future sampling strategies and data collection methods are expanded and aligned between sea regions. In this study, we included months with a minimum sample size of 100 length measurements per month, which is lower than the general recommendation of 200 samples for the analysis of length frequency distributions (Hoenig et al., 1987; Gulland and Rosenberg, 1992). The two species in this study are fast-growing and have a small maximum length, leading to more distinct cohorts and fewer length bins across the length range. For these two mesopelagic species, a minimum sample size between 100 and 200 samples per month might be sufficient. For slow-growing species with a large maximum length, more than 200 samples might be required, similar to other length-based models [e.g., LIME (Rudd and Thorson, 2018)]. The size range of samples with fewer than 200 length measurements is comparable to samples with more than 200 measurements (Table 1). Nevertheless, for more reliable and less uncertain growth parameters for both species, future sampling efforts should aim at large sample sizes with a good representation of large fish over a long and regular time period. Sampling should take place each month for at least a year and in 6–12 months during the second year, allowing to estimate reliable growth and natural mortality parameters and interannual differences in life-history parameters. These samples should optimally be taken throughout the entire geographical area of the potential fishery and distribution areas of the populations, with enough replication within strata to establish an accurate idea of within-strata variance. A measurement accuracy of 1 mm would be recommended for both species, considering their maximum length of 70 mm (M. muelleri) and 103 mm (B. glaciale) and a minimum gear selection size of 10 mm, to obtain the recommended 20–40 length classes required for length-based methods (Gulland and Rosenberg, 1992).
Although the usage of length-based methods is challenging in the case of short-lived species (ICES, 2019), they provide more robust and useful estimations in the absence of longer time series of age data, as is the case with the species under investigation. To ensure the sustainability of potential future mesopelagic exploitation, simultaneous efforts are necessary to collect age data required for age-based stock assessment methods, as well as genetic studies required to identify potential subpopulations and stock structure. In the Bay of Biscay, a population connectivity study suggested the possibility of population differentiation within the area (Rodriguez-Ezpeleta et al., 2017), and studies comparing populations from individual fjords and offshore areas in Norway also showed genetic differentiation between populations of both M. muelleri and B. glaciale (Suneetha and Nævdal, 2001; Suneetha and Salvanes, 2001). Whether population differentiation occurs on a larger scale in the Northeast Atlantic remains uncertain, and partial isolation, suggested as the main driver for population differentiation in Norway, may also occur on larger basin scales. A preliminary estimation of growth and natural mortality parameters in Iceland and the Bay of Biscay suggests there might be differences in life-history parameters between the regions (Supplementary Material Section S8). For a thorough evaluation of such patterns, more data is required.
The high mesopelagic biomass estimates (e.g., Irigoien et al., 2014) and potentially large catches make M. muelleri and B. glaciale attractive target species for a commercial fishery; however, high costs and technological challenges have prevented the commencement of a fishery to date (Prellezo, 2019; Grimaldo et al., 2020; Standal and Grimaldo, 2020; Paoletti et al., 2021; Kourantidou and Jin, 2022; Albrektsen et al., 2023). Additionally, gaps in our knowledge remain regarding the global biomass, distribution patterns, and composition of mesopelagic diversity, as well as the function of the mesopelagic community in the marine ecosystem and its importance for ecosystem services (St. John et al., 2016; Hidalgo and Browman, 2019; Wright et al., 2020; van der Meer et al., 2023). The mesopelagic community has a significant role in the sequestration of atmospheric carbon into the deep ocean (Anderson et al., 2019; Buesseler et al., 2022), and exploitation could alter the capture and cycling of carbon (Cavan and Hill, 2022). Many mesopelagic species also act as a key resource for higher trophic levels, such as marine mammals (the elephant seal, Mirounga angustirostris, and the common dolphin Delphinus delphis), yellowfin tuna (Thunnus albacares), saithe, and blue whiting (Bergstad, 1991; Potier et al., 2007; Brophy et al., 2009; Naito et al., 2013). To ensure the sustainability of potential mesopelagic exploitation, it is necessary to understand and quantify the population dynamics and resilience of mesopelagic target species such as M. muelleri and B. glaciale, as well as potential subpopulation structures, their trophic links, ecosystem function, and links to biological, physical, and chemical processes and interactions (St. John et al., 2016; Wright et al., 2020; Caiger et al., 2021; van der Meer et al., 2023). An essential step in this process is the estimation of appropriate life-history parameters related to growth and mortality, and their associated uncertainty, for the potential target species.
We have estimated life-history parameters related to growth and natural mortality for M. muelleri and B. glaciale in the Northeast Atlantic Ocean, which are the main species of interest for a potential targeted mesopelagic fishery in the region. M. muelleri showed an asymptotic length of 57.98 mm and a von Bertalanffy growth constant of 1.28 year−1, while for B. glaciale we estimated an asymptotic length of 78.93 mm and a von Bertalanffy growth constant of 0.41 year−1. Estimates of natural mortality rates for M. muelleri ranged between 1.29 year−1 based on an empirical formula using a relationship with the estimated growth parameters, 1.79 year−1 based on an empirical relationship with maximum age, and 1.51 year−1 with the length-converted catch curve method. Natural mortality estimated for B. glaciale ranged between 0.5, 0.73, and 0.75 year−1, with the three respective methods. The parameters were estimated based on the longest currently available time series of length data for both species in the region using a length-based method, providing robust estimates of the life-history parameters, including their uncertainty. The integrated method is flexible and valuable in highly data-limited situations, as in the current case.
The data analyzed in this study is subject to the following licenses/restrictions: The data underlying this article will be shared on reasonable request to the corresponding author. Requests to access these datasets should be directed to Berthe M. J. Vastenhoud,Ym1qdkBhcXVhLmR0dS5kaw==.
BV: Conceptualization, Data curation, Formal Analysis, Investigation, Methodology, Software, Validation, Visualization, Writing – original draft, Writing – review & editing. TM: Conceptualization, Data curation, Formal Analysis, Investigation, Methodology, Software, Writing – original draft, Writing – review & editing. AK: Conceptualization, Data curation, Formal Analysis, Investigation, Methodology, Software, Writing – original draft, Writing – review & editing. SP: Conceptualization, Writing – original draft. PA: Data curation, Writing – review & editing. DG: Data curation, Writing – review & editing. AW: Data curation, Writing – review & editing. TK: Data curation, Writing – review & editing. WM: Data curation, Writing – review & editing. SJ: Data curation, Writing – review & editing. JN: Conceptualization, Funding acquisition, Resources, Supervision, Writing – original draft, Writing – review & editing.
The author(s) declare financial support was received for the research, authorship, and/or publication of this article. This study was financed by the EU H2020 MEESO Project “Ecologically and Economically Sustainable Mesopelagic Fisheries” Grant Agreement No. 817669. TKM acknowledges funding by the EMFF project “Robust management procedures and advice for data-limited stocks (RoMA)” (Ref 33113-B-20-183), which is funded by the European Maritime and Fisheries Fund and the Danish Fisheries Agency.
The authors declare that the research was conducted in the absence of any commercial or financial relationships that could be construed as a potential conflict of interest.
All claims expressed in this article are solely those of the authors and do not necessarily represent those of their affiliated organizations, or those of the publisher, the editors and the reviewers. Any product that may be evaluated in this article, or claim that may be made by its manufacturer, is not guaranteed or endorsed by the publisher.
The Supplementary Material for this article can be found online at: https://www.frontiersin.org/articles/10.3389/fmars.2023.1278778/full#supplementary-material
Albrektsen S., Vander Roost J., Arnesen J. A., Gjerp Solstad R. (2023). Determination of the most effective land based processing methods with regards to products, markets, scalability and economics. Report of H2020 MEESO Deliverable D3.5. Confidential.
Alvarez P., Korta M., Garcia D., Boyra G. (2023). Life history strategy of maurolicus muelleri (Gmenlin 1789) in the Bay of Biscay. Hydrobiology 2, 289–310. doi: 10.3390/hydrobiology2020019
Alvheim A. R., Kjellevold M., Strand E., Sanden M., Wiech M. (2020). Mesopelagic species and their potential contribution to food and feed security—a case study from Norway. Foods 9, 344. doi: 10.3390/foods9030344
Andersen K. H. (2020). Size-based theory for fisheries advice. ICES J. Mar. Sci. 77, 2445–2455. doi: 10.1093/icesjms/fsaa157
Anderson T. R., Martin A. P., Lampitt R. S., Trueman C. N., Henson S. A., Mayor D. J., et al. (2019). Quantifying carbon fluxes from primary production to mesopelagic fish using a simple food web model. ICES J. Mar. Sci. 76, 690–701. doi: 10.1093/icesjms/fsx234
Asiedu B., Amponsah S. K. K., Commey N. A., Failler P. (2022). Assessing the Population Parameters of Decapterus punctatus (Cuvier 1829) from the Coastal Waters of Greater Accra, Ghana using TropFishR. Egypt J. Aquat Biol. Fish 26, 335–347. doi: 10.21608/EJABF.2022.249881
Benoit-Bird K. J., Moline M. A., Schofield O. M., Robbins I. C., Waluk C. M. (2010). Zooplankton avoidance of a profiled open-path fluorometer. J. Plankton Res. 32, 1413–1419. doi: 10.1093/PLANKT/FBQ053
Bergstad O. A. (1991). Distribution and trophic ecology of some gadoid fish of the norwegian deep: 1. Accounts of individual species. Sarsia 75, 269–313. doi: 10.1080/00364827.1991.10413455
Brophy J. T., Murphy S., Rogan E. (2009). The diet and feeding ecology of the short-beaked common dolphin (Delphinus delphis) in the Northeast Atlantic. IWC Sci. Committee Document SC/61/SM14. (Cambridge, UK: International Whaling Commission).
Buesseler K. O., Jin D., Kourantidou M., Levin D. S., Ramakrishna K., Renaud P. (2022). The ocean twilight zone’s role in climate change. Woods Hole Oceanographic Institution, 32 pp. doi: 10.1575/1912/28074
Caiger P. E., Lefebve L. S., Llopiz J. K. (2021). Growth and reproduction in mesopelagic fishes: a literature synthesis. ICES J. Mar. Sci. 78, 765–781. doi: 10.1093/icesjms/fsaa247
Cavan E. L., Hill S. L. (2022). Commercial fishery disturbance of the global ocean biological carbon sink. Glob Chang Biol. 28, 1212–1221. doi: 10.1111/gcb.16019
Chen N., Zhang C., Sun M., Xu B., Xue Y., Ren Y., et al. (2019). Evaluating the performances of size-frequency-based methods for estimating fishing mortality of pholis fangi. Mar. Coast. Fisheries 11, 305–314. doi: 10.1002/mcf2.10085
De Robertis A. (2002). Size-dependent visual predation risk and the timing of vertical migration: An optimization model. Limnol. Oceanogr 47, 925–933. doi: 10.4319/lo.2002.47.4.0925
do Carmo Lopes P. (1979). Eggs and larvae of maurolicus muelleri (gonostomati- dae) and other fish eggs and larvae from two fjords in Western Norway. Sarsia 64, 199–210. doi: 10.1080/00364827.1979.10411382
Dowd S., Chapman M., Koehn L. E., Hoagland P. (2022). The economic tradeoffs and ecological impacts associated with a potential mesopelagic fishery in the California Current. Ecol. Appl. 32, 1–17. doi: 10.1002/eap.2578
Dypvik E., Klevjer T. A., Kaartvedt S. (2012). Inverse vertical migration and feeding in glacier lanternfish (Benthosema glaciale). Mar. Biol. 159, 443–453. doi: 10.1007/s00227-011-1822-4
Efron B., Tibshirani R. (1993). An introduction to the bootstrap (New York, United States: Chapman and Hall).
Elsler L. G., Oostdijk M., Levin L. A., Satterthwaite E. V., Pinsky M. L., Crespo G. O., et al. (2022). Protecting ocean carbon through biodiversity and climate governance. Front. Mar. Sci. 9. doi: 10.3389/fmars.2022.880424
FAO (1995). Code of Conduct for Responsible Fisheries (Rome: FAO), 41 pp. Available at: http://www.fao.org/3/v9878e/V9878E.pdf.
FAO (2011). Review of the state of world marine fishery resources. FAO Fisheries Aquaculture Tech. Paper 569, 334.
FAO (2016). The State of World Fisheries and Aquaculture 2016. Contributing to food security and nutrition for all. (Rome), 200 pp.
Fock H. O., Czudaj S., Bartolino V. (2019). Size structure changes of mesopelagic fishes and community biomass size spectra along a transect from the equator to the Bay of Biscay collected in 1966-1979 and 2014-2015. ICES J. Mar. Sci. 76, 755–770. doi: 10.1093/icesjms/fsy068
Gartner J. V. (1993). Patterns of reproduction in the dominant lantern fish species of the eastern Gulf of Mexico. With a review of reproduction among tropical, subtropical Myctophidae. Bull. Mar. Sci. 52, 721–750.
Giske J., Aksnes D. L., Baliño B. M., Kaartvedt S., Lie U., Nordeide J. T., et al. (1990). Vertical distribution and trophic interactions of zooplankton and fish in Masfjorden, Norway. Sarsia 75, 65–81. doi: 10.1080/00364827.1990.10413442
Gislason H., Daan N., Rice J. C., Pope J. G. (2010). Size, growth, temperature and the natural mortality of marine fish. Fish Fisheries 11, 149–158. doi: 10.1111/j.1467-2979.2009.00350.x
Gjeitsund Thorvaldsen K., Neuenfeldt S., Mariani P., Nielsen J. R. (2023). Hiding in plain sight: Predator avoidance behaviour of mesopelagic Maurolicus muelleri during foraging. Mar. Ecol. Prog. Ser. doi: 10.3354/meps14424
Gjösæter J. (1973). Age, growth, and mortality of the mygtophid fish, benthosema glaciale (Reinhardt), from Western Norway. Sarsia 52, 1–14. doi: 10.1080/00364827.1973.10411227
Gjösæter J. (1981a)Growth, production and reproduction of the myctophid fish Benthosema glaciale from western Norway and adjacent seas. In: Serie havundersokelser - fiskeridirektoratets skrifter. Available at: https://imr.brage.unit.no/imr-xmlui/handle/11250/114508 (Accessed February 3, 2022).
Gjösæter J. (1981b). Life history and ecology of Maurolicus muelleri (Gonostomatidae) in Norwegian waters. Serie Havundersokelser - Fiskeridirektoratets Skrifter 17, 109–131.
Gjösæter J., Kawaguchi K. (1980). A review of the world resources of mesopelagic fish. FAO fisher (Rome: FAO Fisheries Technical Paper).
Goodson M. S., Giske J., Rosland R. (1995). Growth and ovarian development of Maurolicus muelleri during spring. Marine Biology 124, 185–195. doi: 10.1007/BF00347122
Grimaldo E., Grimsmo L., Alvarez P., Herrmann B., Tveit G. M., Tiller R., et al. (2020). Investigating the potential for a commercial fishery in the Northeast Atlantic utilizing mesopelagic species. ICES J. Mar. Sci. 77, 2541–2556. doi: 10.1093/icesjms/fsaa114
Grimaldo E., Herrmann B., Brčić J., Cerbule K., Brinkhof J., Grimsmo L., et al. (2022). Prediction of potential net panel selectivity in mesopelagic trawls. Ocean Eng. 260, 111964. doi: 10.1016/j.oceaneng.2022.111964
Gulland J. A., Rosenberg A. A. (1992). A review of length-based approaches to assessing fish stocks. FAO Fisheries Tech. Paper. No. 323, 100.
Halliday R. G. (1970). Growth and vertical distribution of the glacier lanternfish, benthosema glaciale , in the northwestern atlantic. J. Fisheries Res. Board Canada 27, 105–116. doi: 10.1139/f70-011
Hamel O. S., Cope J. M. (2022). Development and considerations for application of a longevity-based prior for the natural mortality rate. Fish Res. 256, 106477. doi: 10.1016/j.fishres.2022.106477
Heino M., Porteiro F. M., Sutton T. T., Falkenhaug T., Godø O. R., Piatkowski U. (2011). Catchability of pelagic trawls for sampling deep-living nekton in in the mid-North Atlantic the mid-North Atlantic. ICES J. Mar. Sci. 68, 377–389. doi: 10.1093/icesjms/fsq089
Hidalgo M., Browman H. I. (2019). Developing the knowledge base needed to sustainably manage mesopelagic resources. ICES J. Mar. Sci. 76, 609–615. doi: 10.1093/icesjms/fsz067
Hill Cruz M., Kriest I., Getzlaff J. (2023). Diving deeper: Mesopelagic fish biomass estimates comparison using two different models. Front. Mar. Sci. 10. doi: 10.3389/fmars.2023.1121569
Hoenig J. (1983). Empirical use of longevity data to estimate mortality rates. Fishery Bull. 82, 898–903.
Hoenig J., Csirke J., Snaders M. J., Abella A., Andreoli M. G., Levi D., et al. (1987). Data acquisition for length-based stock assessment: Report of Working Group I. J. Sci. Conf. Proc. 13, 343–352.
Hoenig J. M., Then A. Y.-H., Babcock E. A., Hall N. G., Hewitt D. A., Hesp S. A. (2016). The logic of comparative life history studies for estimating key parameters, with a focus on natural mortality rate. ICES J. Mar. Sci. 73, 2453–2467. doi: 10.1093/icesjms/fsw089
Hordyk A. R., Prince J. D., Carruthers T. R., Walters C. J. (2019). Comment on “A new approach for estimating stock status from length frequency data” by Froese et al., (2018). ICES J. Mar. Sci. 76, 457–460. doi: 10.1093/ICESJMS/FSY168
ICES (2019). Workshop on data-limited stocks of short-lived species (WKDLSSLS). ICES Sci. Rep. 1. 166 pp. doi: 10.17895/ices.pub.5549
Irigoien X., Klevjer T. A., Røstad A., Martinez U., Boyra G., Acuña J. L., et al. (2014). Large mesopelagic fishes biomass and trophic efficiency in the open ocean. Nat. Commun. 5, 3271. doi: 10.1038/ncomms4271
Jamieson A. J., Godø O. R., Bagley P. M., Partridge J. C., Priede I. G. (2006). Illumination of trawl gear by mechanically stimulated bioluminescence. Fish Res. 81, 276–282. doi: 10.1016/J.FISHRES.2006.06.021
Kaartvedt S., Røstad A., TA K., Staby A. (2009). Use of bottom-mounted echo sounders in exploring behavior of mesopelagic fishes. Mar. Ecol. Prog. Ser. 395, 109–118. doi: 10.3354/meps08174
Kaartvedt S., Staby A., Aksnes D. L. (2012). Efficient trawl avoidance by mesopelagic fishes causes large underestimation of their biomass. Mar. Ecol. Prog. Ser. 456, 1–6. doi: 10.3354/MEPS09785
Karim E., Liu Q., Sun M., Barman P. P., Hasan S. J., Hoq M. E. (2019). Assessing recent gradual upsurge of marine captured Hilsa stock (Tenualosa ilisha) in Bangladesh. Aquac Fish 4, 156–165. doi: 10.1016/J.AAF.2019.02.005
Kawaguchi K., Mauchline J. (1982). Biology of myctophid fishes (Family myctophidae) in the rockall trough. Northeastern Atlantic Ocean Biol. Oceanography 1, 337–373. doi: 10.1080/01965581.1982.10749447
Kawaguchi K., Mauchline J. (1987). Biology of sternoptychid fishes rockall trough, northeastern atlantic ocean. Biol. Oceanography 4, 99–120. doi: 10.1080/01965581.1987.10749486
Kenchington T. J. (2014). Natural mortality estimators for information-limited fisheries. Fish Fisheries 15, 533–562. doi: 10.1111/faf.12027
Khodabandeloo B., Agersted M. D., Klevjer T., Macaulay G. J., Melle W. (2021). Estimating target strength and physical characteristics of gas-bearing mesopelagic fish from wideband in situ echoes using a viscous-elastic scattering model. J. Acoust Soc. Am. 149, 673. doi: 10.1121/10.0003341
Kokkalis A., Eikeset A. M., Thygesen U. H., Steingrund P., Andersen K. H. (2017). Estimating uncertainty of data limited stock assessments. ICES J. Mar. Sci. 74, 69–77. doi: 10.1093/icesjms/fsw145
Kokkalis A., Thygesen U. H., Nielsen A., Andersen K. H. (2015). Limits to the reliability of size-based fishing status estimation for data-poor stocks. Fish Res. 171, 4–11. doi: 10.1016/j.fishres.2014.10.007
Koslow J. A., Kloser R., Stanley C. A. (1995). Avoidance of a camera system by a deepwater fish, the orange roughy (Hoplostethus atlanticus). Deep Sea Res. Part I: Oceanographic Res. Papers 42, 233–244. doi: 10.1016/0967-0637(95)93714-P
Kourantidou M., Jin D. (2022). Mesopelagic–epipelagic fish nexus in viability and feasibility of commercial-scale mesopelagic fisheries. Nat. Resour Model. 35, e12350. doi: 10.1111/nrm.12350
Kristoffersen J. B. (2007). Growth rate and relative otolith size in populations of adult Müller’s pearlside Maurolicus muelleri. J. Fish Biol. 71, 1317–1330. doi: 10.1111/J.1095-8649.2007.01593.X
Kristoffersen J. B., Salvanes A. G. V. (1998a). Effects of formaldehyde and ethanol preservation on body and otoliths of Maurolicus muelleri and Benthosema glaciale. Sarsia 83, 95–102. doi: 10.1080/00364827.1998.10413675
Kristoffersen J. B., Salvanes A. G. V. (1998b). Life history of Maurolicus muelleri in fjordic and oceanic environments. J. Fish Biol. 53, 1324–1341. doi: 10.1006/jfbi.1998.0799
Kristoffersen J. B., Salvanes A. G. V. (2009). Distribution, growth, and population genetics of the glacier lanternfish (Benthosema glaciale) in Norwegian waters: Contrasting patterns in fjords and the ocean. Mar. Biol. Res. 5, 596–604. doi: 10.1080/17451000903042479
Langbehn T. J., Aksnes D. L., Kaartvedt S., Fiksen Ø., Jørgensen C. (2019). Light comfort zone in a mesopelagic fish emerges from adaptive behaviour along a latitudinal gradient. Mar. Ecol. Prog. Ser. 623, 161–174. doi: 10.3354/MEPS13024
Maunder M. N., Hamel O. S., Lee H. H., Piner K. R., Cope J. M., Punt A. E., et al. (2023). A review of estimation methods for natural mortality and their performance in the context of fishery stock assessment. Fish Res. 257, 106489. doi: 10.1016/j.fishres.2022.106489
McFarland W. N. (1986). Light in the sea—Correlations with behaviors of fishes and invertebrates. Am. Zool 26, 389–401. doi: 10.1093/icb/26.2.389
Mildenberger T. K., Taylor M. H., Wolff M. (2017). TropFishR: an R package for fisheries analysis with length-frequency data. Methods Ecol. Evol. 8, 1520–1527. doi: 10.1111/2041-210X.12791
Naito Y., Costa D. P., Adachi T., Robinson P. W., Fowler M., Takahashi A. (2013). Unravelling the mysteries of a mesopelagic diet: a large apex predator specializes on small prey. Funct. Ecol. 27, 710–717. doi: 10.1111/1365-2435.12083
Olsen R. E., Strand E., Melle W., Nørstebø J. T., Lall S. P., Ringø E., et al. (2020). Can mesopelagic mixed layers be used as feed sources for salmon aquaculture? Deep Sea Res. 2 Top. Stud. Oceanogr 180, 104722. doi: 10.1016/j.dsr2.2019.104722
Osei I. K., Yankson K., Obodai E. A., Okyere I. (2021). Implications of overlooked seasonal growth dynamics in tropical fisheries assessment: A test case of an oyster (Crassostrea tulipa) fishery in the Densu Delta, Ghana. Fish Res. 244, 106118. doi: 10.1016/J.FISHRES.2021.106118
Pakhomov E., Yamamura O. (2010). Report of the advisory panel on micronekton sampling inter-calibration experiment. PICES Sci. Rep. 38, 109.
Paoletti S., Nielsen J. R., Sparrevohn C. R., Bastardie F., Vastenhoud B. M. J. (2021). Potential for mesopelagic fishery compared to economy and fisheries dynamics in current large scale danish pelagic fishery. Front. Mar. Sci. 8. doi: 10.3389/FMARS.2021.720897/BIBTEX
Pauly D. (1980). On the interrelationships between natural mortality, growth parameters, and mean environmental temperature in 175 fish stocks. ICES J. Mar. Sci. 39, 175–192. doi: 10.1093/icesjms/39.2.175
Pauly D., David N. (1981). ELEFAN I, a BASIC program for the objective extraction of growth parameters from length-frequency data. Meeresforch 28, 205–211.
Pearcy W. G. (1983). Quantitative assessment of the vertical distributions of micronektonic fishes with opening/closing midwater trawls. Biol. Oceanography 2, 289–310. doi: 10.1080/01965581.1983.10749463
Pedersen M. W., Berg C. W. (2017). A stochastic surplus production model in continuous time. Fish Fisheries 18, 226–243. doi: 10.1111/faf.12174
Penã M., Ratilal P. (2019). Mesopelagic fish avoidance from the vessel dynamic positioning system. ICES J. Mar. Sci. 76, 734–742. doi: 10.1093/icesjms/fsy157
Potier M., Marsac F., Cherel Y., Lucas V., Sabatié R., Maury O., et al. (2007). Forage fauna in the diet of three large pelagic fishes (lancetfish, swordfish and yellowfin tuna) in the western equatorial Indian Ocean. Fish Res. 83, 60–72. doi: 10.1016/j.fishres.2006.08.020
Prellezo R. (2019). Exploring the economic viability of a mesopelagic fishery in the Bay of Biscay. ICES J. Mar. Sci. 76, 771–779. doi: 10.1093/icesjms/fsy001
Prihartato P. K., Aksnes D. L., Kaartvedt S. (2015). Seasonal patterns in the nocturnal distributionand behavior of the mesopelagic fish Maurolicus muelleri at high latitudes. Mar. Ecol. Prog. Ser. 521, 189–200. doi: 10.3354/meps11139
Proud R., Handegard N. O., Kloser R. J., Cox M. J., Brierley A. S., Demer D. (2019). From siphonophores to deep scattering layers: Uncertainty ranges for the estimation of global mesopelagic fish biomass. ICES J. Mar. Sci. 76, 718–733. doi: 10.1093/icesjms/fsy037
Punt A. E., Castillo-Jordán C., Hamel O. S., Cope J. M., Maunder M. N., Ianelli J. N. (2021). Consequences of error in natural mortality and its estimation in stock assessment models. Fish Res. 233, 105759. doi: 10.1016/j.fishres.2020.105759
Pusineri C., Vasseur Y., Hassani S., Meynier L., Spitz J., Ridoux V. (2005). Food and feeding ecology of juvenile albacore, Thunnus alalunga, off the Bay of Biscay: a case study. ICES J. Mar. Sci. 62, 116–122. doi: 10.1016/j.icesjms.2004.09.004
Rasmussen O. I., Giske J. (1994). Life-history parameters and vertical distribution of Maurolicus muelleri in Masfjorden in summer. Marine Biology 120, 649–664. doi: 10.1007/BF00350086
Rees D. J., Poulsen J. Y., Sutton T. T., Costa P. A. S., Landaeta M. F. (2020). Global phylogeography suggests extensive eucosmopolitanism in Mesopelagic Fishes (Maurolicus: Sternoptychidae). Sci. Rep. 10, 1–12. doi: 10.1038/s41598-020-77528-7
Rodriguez-Ezpeleta N., Álvarez P., Irigoien X. (2017). Genetic diversity and connectivity in maurolicus muelleri in the bay of biscay inferred from thousands of SNP markers. Front. Genet. 8. doi: 10.3389/fgene.2017.00195
Røstad A., Kaartvedt S., Aksnes D. L. (2016). Light comfort zones of mesopelagic acoustic scattering layers in two contrasting optical environments. Deep Sea Res. Part I: Oceanographic Res. Papers 113, 1–6. doi: 10.1016/j.dsr.2016.02.020
Rudd M. B., Thorson J. T. (2018). Accounting for variable recruitment and fishing mortality in length-based stock assessments for data-limited fisheries. Can. J. Fisheries Aquat. Sci. 75, 1019–1035. doi: 10.1139/cjfas-2017-0143
Salvanes A. G. V., Stockley B. M. (1996). Spatial variation of growth and gonadal developments of Maurolicus muelleri in the Norwegian Sea and in a Norwegian fjord. Mar. Biol. 126, 321–332. doi: 10.1007/BF00347456
Sameoto D. D. (1988). Feeding of lantern fish Benthosema glaciale off the Nova Scotia Shelf. Mar. Ecol. Prog. Ser. 44, 113–129. doi: 10.3354/meps044113
Schwamborn R., Mildenberger T. K., Taylor M. H. (2019). Assessing sources of uncertainty in length-based estimates of body growth in populations of fishes and macroinvertebrates with bootstrapped ELEFAN. Ecol. Modell 393, 37–51. doi: 10.1016/j.ecolmodel.2018.12.001
Staby A., Aksnes D. L. (2011). Follow the light-diurnal and seasonal variations in vertical distribution of the mesopelagic fish Maurolicus muelleri. Mar. Ecol. Prog. Ser. 422, 265–273. doi: 10.3354/MEPS08938
Staby A., Srisomwong J., Rosland R. (2013). Variation in DVM behaviour of juvenile and adult pearlside Maurolicus muelleri linked to feeding strategies and related predation risk. Fish Oceanogr 22, 90–101. doi: 10.1111/fog.12012
Standal D., Grimaldo E. (2020). Institutional nuts and bolts for a mesopelagic fishery in Norway. Mar. Policy 119, 104043. doi: 10.1016/j.marpol.2020.104043
St. John M. A., Borja A., Chust G., Heath M., Grigorov I., Mariani P., et al. (2016). A dark hole in our understanding of marine ecosystems and their services: Perspectives from the mesopelagic community. Front. Mar. Sci. 3. doi: 10.3389/fmars.2016.00031
Suneetha K. B., Nævdal G. (2001). Genetic and morphological stock structure of the pearlside, Maurolicus muelleri (Pisces, Sternoptychidae), among Norwegian fjords and offshore area. Sarsia 86, 191–201. doi: 10.1080/00364827.2001.10420475
Suneetha K. B., Salvanes A. G. V. (2001). Population genetic structure of the glacier lanternfish, Benthosema glaciale (Myctophidae) in Norwegian waters. Sarsia 86, 203–212. doi: 10.1080/00364827.2001.10420476
Taylor M. H., Mildenberger T. K. (2017). Extending electronic length frequency analysis in R. Fish Manag Ecol. 24, 330–338. doi: 10.1111/fme.12232
Then A. Y., Hoenig J. M., Hall N. G., Hewitt D. A. (2015). Evaluating the predictive performance of empirical estimators of natural mortality rate using information on over 200 fish species. ICES J. Mar. Sci. 72, 82–92. doi: 10.1093/icesjms/fsu136
UN. (1982). United nations convention on the law of the sea (UNCLOS). Available at: http://www.un.org/Depts/los/convention_agreements/convention_overview_convention.htm.
UN. (1995). United nations conference on straddling fish stocks and highly migratory fish stocks. Available at: http://www.un.org/Depts/los/convention_agreements/convention_overview_fish_stocks.htm.
UN. (2002). World summit on sustainable development (WSSD). Available at: https://sustainabledevelopment.un.org/milesstones/wssd.
Valinassab T., Pierce G. J., Johannesson K. (2007). Lantern fish (Benthosema pterotum) resources as a target for commercial exploitation in the Oman Sea. J. Appl. Ichthyology 23, 573–577. doi: 10.1111/j.1439-0426.2007.01034.x
van der Meer J., Callier M., Fabi G., van Hoof L., Nielsen J. R., Raicevich S. (2023). The carrying capacity of the seas and oceans for future sustainable food production : Current scientific knowledge gaps. Food and Energy Security 12(4). doi: 10.1002/fes3.464
von Bertalanffy L. (1938). A quantitative theory of organic growth (Inquiries on growth laws. II). Hum. Biol. 10, 181–213.
Wang H.-Y., Shen S.-F., Chen Y.-S., Kiang Y.-K., Heino M. (2020). Life histories determine divergent population trends for fishes under climate warming. Nat. Commun. 11, 4088. doi: 10.1038/s41467-020-17937-4
Wright G., Gjerde K. M., Finkelstein A. R., Currie D. (2020). Fishing in the Twilight Zone. Illuminating governance challenges at the next fisheries frontier. IDDRI, Study N°06/20.
Keywords: Maurolicus muelleri, Benthosema glaciale, TropFishR, length-based assessment, mesopelagic zone, data-limited stock assessment methods, Von Bertalanffy growth function, natural mortality
Citation: Vastenhoud BMJ, Mildenberger TK, Kokkalis A, Paoletti S, Alvarez P, Garcia D, Wieczorek AM, Klevjer T, Melle W, Jonsson ST and Nielsen JR (2023) Growth and natural mortality of Maurolicus muelleri and Benthosema glaciale in the Northeast Atlantic Ocean. Front. Mar. Sci. 10:1278778. doi: 10.3389/fmars.2023.1278778
Received: 16 August 2023; Accepted: 08 November 2023;
Published: 19 December 2023.
Edited by:
Torstein Pedersen, UiT The Arctic University of Norway, NorwayReviewed by:
Zachary Siders, University of Florida, United StatesCopyright © 2023 Vastenhoud, Mildenberger, Kokkalis, Paoletti, Alvarez, Garcia, Wieczorek, Klevjer, Melle, Jonsson and Nielsen. This is an open-access article distributed under the terms of the Creative Commons Attribution License (CC BY). The use, distribution or reproduction in other forums is permitted, provided the original author(s) and the copyright owner(s) are credited and that the original publication in this journal is cited, in accordance with accepted academic practice. No use, distribution or reproduction is permitted which does not comply with these terms.
*Correspondence: Berthe M. J. Vastenhoud, Ym1qdkBhcXVhLmR0dS5kaw==
Disclaimer: All claims expressed in this article are solely those of the authors and do not necessarily represent those of their affiliated organizations, or those of the publisher, the editors and the reviewers. Any product that may be evaluated in this article or claim that may be made by its manufacturer is not guaranteed or endorsed by the publisher.
Research integrity at Frontiers
Learn more about the work of our research integrity team to safeguard the quality of each article we publish.