 Yasong Wang
 Bilin Liu
 Weichao Wu
 Liang Liu
 Yinghui Wang
 Yunping Xu
- 1Shanghai Frontiers Research Center of the Hadal Biosphere, College of Marine Sciences, Shanghai Ocean University, Shanghai, China
- 2Key Laboratory of Sustainable Exploitation of Oceanic Fisheries Resources, Ministry of Education, Shanghai Ocean University, Shanghai, China
- 3Guangdong Key Laboratory of Soil and Groundwater Pollution Control, School of Environmental Science and Engineering, Southern University of Science and Technology, Shenzhen, Guangdong, China
The Kuroshio-Oyashio confluence region (K/O region) plays a significant role in the global carbon cycle and climate change. In this study, we examined the concentration and composition of dissolved organic matter (DOM) in water samples collected from depths of 0 to 1000 meters between 2019 and 2021. The concentration of dissolved organic carbon (DOC) ranged from 30.54 to 113.21 μmol L-1, with higher concentrations observed in surface waters. The biological index (BIX) decreases with increasing depth, indicating decreasing in-situ production of plankton downwards. Additionally, the humification index (HIX) increased with depth, suggesting the transformation of labile to refractory DOC by bacteria. Using parallel factor analysis, we identified two humic-like (C1, C3) and one protein-like (C2) fluorescent components in 467 water samples. Water samples collected in 2020 exhibited significantly higher specific ultraviolet absorbance at 254 nm (SUVA254) (0.5 ± 0.2 L mg-1 m-1) and higher intensities of C1 (8.2 ± 2.69 *10-3 R.U.) and C3 (9.22 ± 4.39 *10-3 R.U.) compared to samples from 2019 and 2021. We found that water temperature had a positive correlation with C2 intensity (r = 0.33; p< 0.01), but negative correlations with C1 (r = −0.72; p< 0.01) and C3 intensity (r = −0.55; p< 0.01). Comparison of measured and theoretical values using a conservative physical mixing model revealed active biogeochemical processes of DOM during water mixing of the Kuroshio, Oyashio, and North Pacific Intermediate Water that change concentration and composition of DOM. Since the hydrology in the K/O region is sensitive for the ongoing climate warming, further investigation is needed to understand water mass mixing and associated DOM dynamics.
1 Introduction
Dissolved organic matter (DOM) represents the largest pool of reduced carbon in the ocean, with a carbon stock of 680–700 × 1015 g (Carlson and Hansell, 2015). DOM serves many important roles in marine biogeochemical cycling by fueling microorganisms, influencing primary productivity, protecting organisms from UV damage, and mobilizing trace metals and pollutants (Hedges, 2002). Thus, understanding the composition and reactivity of dissolved organic carbon (DOC) is essential for comprehending the intricate relationship between DOC and the ocean carbon cycle (Wagner et al., 2020). The environmental stability of DOC is influenced by intrinsic chemical properties, such as molecular structure, size, and concentration, as well as external factors, such as nutrient concentration, water depth, and temperature. Water mass mixing zones generate significant environmental gradients, making them an ideal location for deciphering the mechanisms that regulate the environmental stability of DOC (Dittmar et al., 2021).
The upper ocean in the Northwest Pacific is strongly influenced by two western boundary currents, the Kuroshio and Oyashio (Hansell et al., 2002; Swan et al., 2009; Yatsu et al., 2013). The Oyashio originates in the sub-Arctic and carries relatively fresh, cold, and nutrient-rich water to lower latitudes (Okuda et al., 2001), while the Kuroshio originates in the equatorial Pacific warm current and carries high temperature, high salinity, and low nutrient water to higher latitudes. These two currents meet at approximately 37°N in the Northwestern Pacific, forming the Kuroshio-Oyashio confluence region (K/O region). In addition to the Kuroshio and Oyashio, which dominate the surface ocean, the North Pacific Intermediate Water (NPIW) affects the middle water in the K/O region (Yasuda et al., 1996). The upwelling of the NPIW provides a relatively rich source of nutrients to the upper water (Nishioka et al., 2020). These complex hydrological processes make the K/O region an important area for marine biogeochemical cycling.
Ding et al. (2019) conducted a study on DOC concentrations and radiocarbon ages in the K/O region, with sampling depths reaching 4000 m. Their findings revealed that the spatial distribution of DOC in the upper 700 m was primarily influenced by the mixing of Kuroshio and Oyashio waters. Yamashita et al. (2010) identified one protein-like and two humic-like components in fluorescent dissolved organic matter (FDOM) from the Northwest Pacific Ocean. They discovered an excess allochthonous FDOM in NPIW, which originated mainly from the Sea of Okhotsk rather than the Bering Sea (Yamashita et al., 2021). Our previous study reported that the intensity of humic-like C1 FDOM component differed significantly among the Kuroshio, Oyashio, and NPIW, and the relative contributions of these three water masses could be roughly estimated based on C1 intensity and salinity data (Wang et al., 2022). Overall, previous studies paid more attention to spatial and seasonal variability of DOM, while the studies on interannual changes in DOC in the K/O region are limited. Nakanowatari et al. (2007) reported that the middle water of NPIW had warmed over the past 50 years (1955–2004), while its dissolved oxygen content had decreased. Additionally, a decadal-scale climate change in the North Pacific had impacted fish community and productivity (Miller et al., 2004), but its long-term influence on DOM biogeochemistry remains unclear.
In this study, we present new data on DOC and CDOM in water samples collected during two cruises in 2020 and 2021 in the K/O region. By combining these data with our previously reported data from 2019 (Wang et al., 2022), we aim to evaluate the variability in concentration and composition of DOM from 2019 to 2021 under different influences of water masses, and gain insights into the carbon cycle associated with water circulation and mixing processes in the K/O region.
2 Materials and methods
2.1 Water sampling
During three cruises aboard the R/V Songhang, water samples were collected from 86 sites in the K/O region. A total of 110 samples (water depth: 0–300 m) were collected from November 26 to December 18, 2020, and 185 samples (water depth: 0–1000 m) were collected from June 18 to August 6, 2021. The sampling sites are depicted in Figure 1, and detailed information is provided in Table S1 in Supplementary Information. The data for samples collected in 2019 have already been reported (Wang et al., 2022), while the data for samples collected in 2020 and 2021 are being reported for the first time. In situ salinity and temperature were measured using a conductivity-temperature-depth (CTD) profiler (SBE 911plus, USA) mounted beneath a water sampling rosette ensemble. The samples were collected using Niskin bottles with a carousel multisampling system.
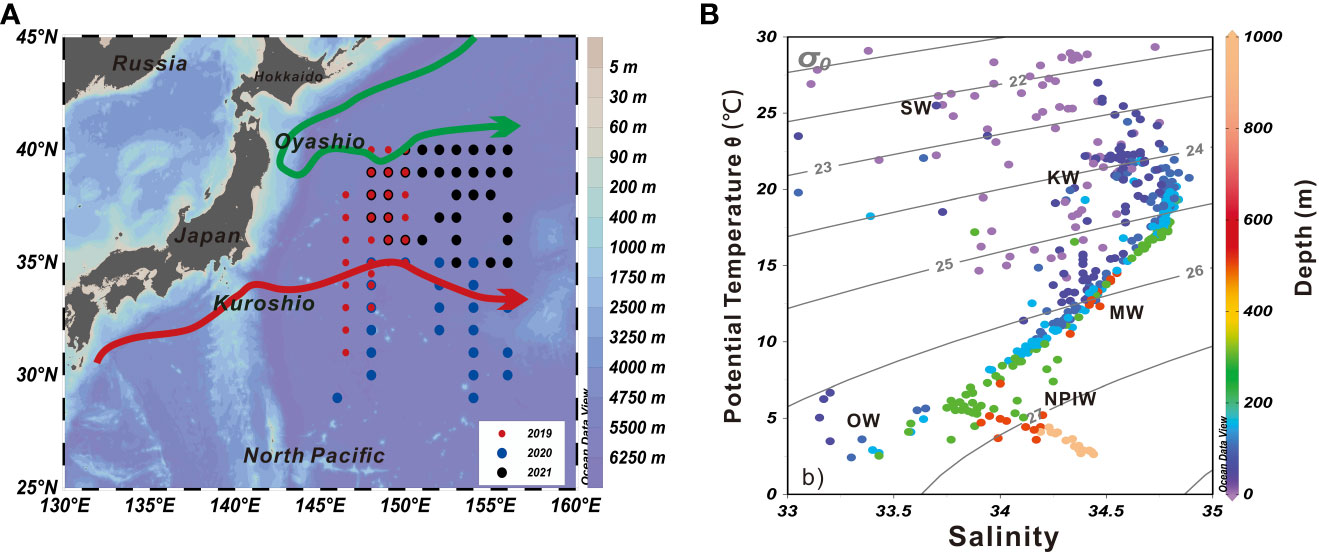
Figure 1 (A) Map showing sampling stations in the K/O region. The red line and green line denote Kuroshio and Oyashio, respectively. The blue diamond, green circle and red hexagon are for samples from 2019, 2020 and 2021, respectively. (B) Potential Temperature (°C)–Salinity–Depth (m) diagram of the study area. The gray contours lines are potential density anomaly (σθ, kg m–3) isopycnals.
For each sample, 500 ml of water was immediately filtered using a pre-combusted (450°C for 4 h) glass fiber filter (0.7 μm GF/F, Whatman) and stored in high-density polyethylene bottles that had been pre-cleaned with ultrapure water rinse, hydrochloric acid rinse, and ultrapure water rinse. The samples were stored at −20°C on board until they were transported to the laboratory in Shanghai. The DOC concentrations and optical parameters were analyzed within 24 hours of warming the samples to room temperature (20°C).
2.2 Measurement of DOC concentration and DOM optical property
The concentration of DOC was determined using a Shimadzu TOC-VCPH analyzer. Each sample was analyzed in triplicate, with a coefficient of variation below 2%. Deep-sea water reference samples (provided by the Hansell Biogeochemical Laboratory at the University of Miami, USA) were analyzed every nine samples to ensure the reliability of the instrument. The instrumental blank was corrected using Milli-Q ultrapure water (18.2 mΩ.cm), which was analyzed every three samples.
The optical properties of CDOM were measured using a Shimadzu UV-2600 dual-beam spectrophotometer equipped with 10 cm quartz cuvettes and Milli-Q water as a reference. The absorption spectra were recorded at 1 nm intervals from 800 to 200 nm. Baseline correction was performed by subtracting the measured absorbance at 700 nm from each wavelength (Kieber et al., 2006). The CDOM absorption coefficient, aλ (m-1), was calculated using the equation: , where Aλ is the absorbance measured across path length l (m) at wavelength λ (nm). In this study, a325 was used as an indicator of CDOM abundance.
Fluorescence excitation-emission matrices (EEMs) were measured using a Hitachi F-7000 fluorometer equipped with 1 cm quartz cuvettes and Milli-Q water as a reference. Emission spectra were recorded from 220 to 550 nm at 5 nm intervals, while excitation wavelengths ranged from 220 to 450 nm at 1 nm increments. Fluorescence intensity was reported in equivalent water Raman units (R.U.) (Lawaetz and Stedmon, 2009). The EEMs-PARAFAC model was constructed for semi-quantitative analyses of 467 samples using the DOM Fluor Toolbox, and three fluorescent components were identified based on the maximum excitation and emission wavelengths (Stedmon and Bro, 2008).
Several optical parameters were calculated to characterize CDOM and FDOM sources and reactivity, including specific ultraviolet absorbance at 254 nm (SUVA254) (Weishaar et al., 2003), humification index (HIX) (Ohno, 2002), and biological index (BIX) (Wilson and Xenopoulos, 2008). The spectral slope (S, nm-1) was calculated between 275 and 295 nm (S275-295) (Helms et al., 2008). The detailed instrumental parameters has been described in the previous report (Wang et al., 2022).
2.3 Model calculations
We estimate the contribution fractions (F) of KW, OW, and NPIW to mixing water (MW) using a three-endmember mixing model based on water temperature (T) and salinity (S).
The endmember values of KW, OW and NPIW were determined by the average value and standard deviation of each water mass for each cruise (See Table S2 in Supporting Information). For example, during the 2021 cruise, the average temperature of KW, OW and NPIW are 18.48 ± 2.45°C, 5.11 ± 0.96°C and 4.73 ± 1.17°C, whereas the average salinity of KW, OW and NPIW are 34.71 ± 0.09, 33.32 ± 0.19 and 33.94 ± 0.26. A Monte Carlo simulation strategy was applied to track the source distribution in the DOM pool with the consideration of the spread endmember parameter values (Andersson, 2011). After obtaining Fkw, Fow, and Fnpiw based on the T and S (Equations 1-3), we further calculated theoretical concentration of DOC (DOCt) or theoretical intensity of specific DOM components in water samples assuming conservative mixing (Equation 4). After that, we estimated the deviation that is difference between theoretical and actual values. Taking DOC as an example, the derivation between theoretical and actual DOC concentrations (ΔDOC) was calculated as follows.
While DOCt is the theoretical value of DOC concentration assuming the conservative mixing of KW, OW and NPIW, whereas DOCsamples, DOCow, DOCkw and DOCnpiw are the actual DOC concentrations measured for samples in the mixing region, KW, OW and NPIW (Table S2 in Supporting Information). A negative (positive) deviation value suggests the net loss (addition) of DOC during water mixing processes due to the biogeochemical processes.
2.4 Statistical analyses
The Monte Carlo simulation and the EEMs-PARAFAC model analysis was conducted using MATLAB R2018b software (Math-Works Corporation, USA). Statistical indicators (i.e., mean value, standard deviation), the principal component analysis (PCA) was analyzed using Origin software (Version 2018, Origin Lab Corporation) and SPSS (Version 25.0, IBM Corporation, USA). The data of net primary productivity (NPP) were downloaded online from http://sites.science.oregonstate.edu/ocean.productivity/site.php (Behrenfeld and Falkowski, 1997). The data of sea surface temperature (SST) were downloaded online from https://psl.noaa.gov/data/gridded/data.cobe.html. The SST data used are from the monthly mean optimal interpolation data set provided by the National Oceanic and Atmospheric Administration (NOAA) with a resolution of 1.0° latitude x 1.0° longitude for 28°N - 45°N,145°E -157°E. The period is from 2019/01 to 2021/12. The test of the differences using one-way analysis of variance (ANOVA), and results were considered significant at p< 0.05.
3 Results
3.1 Hydrological character of K/O region
Water temperature and salinity varied in a range of 11.14–24.37°C and 34.31–34.80 during the 2020 cruise, and 2.76–27.41°C and 33.11–35.35 during the 2021 cruise (Table S1 in Supplementary Information). Their trends were consistent across different cruises, with temperature decreasing as depth increased and salinity exhibiting a slight increase in the top 50 m before gradually decreasing downward. For surface water only, temperature and salinity ranged from 20.25–24.37°C and 34.41–34.75 during the 2020 cruise, and 14.21–27.41°C and 33.11–35.35 during the 2021 cruise.
The KW, OW, and NPIW are defined by specific water temperature and potential density anomaly (σθ) values at certain depths. The KW is characterized by a water temperature of ≥ 14°C at a depth of 200 m (Kakehi et al., 2017), the OW exhibits a water temperature of ≤ 5°C at a depth of 100 m (Takasugi and Yasuda, 1993), and the NPIW is associated with a potential density anomaly (σθ) of 26.6–27.6 kg m-3 (Talley et al., 1995; Yasuda, 2003). Based on these threshold values, 66 samples from the 2019 cruise, 88 samples from the 2020 cruise, and 43 samples from the 2021 cruise were categorized as KW, while 4 samples from the 2019 cruise, 0 sample from the 2020 cruise, and 4 samples from the 2021 cruise were categorized as OW. Additionally, 33 samples from the 2019 cruise, 0 sample from the 2020 cruise, and 23 samples from the 2021 cruise were categorized as NPIW. The remaining samples were categorized as either surface waters (SW; 0 m), which comprised 29 samples from the 2019 cruise, 22 samples from the 2020 cruise, and 35 samples from the 2021 cruise, or mixed water (MW), which included 40 samples from the 2019 cruise, 0 sample from the 2020 cruise, and 80 samples from the 2021 cruise. It is important to note that the samples from the 2020 cruise were collected from the more southern part and had a water depth of 0–300 m, while those from 2019 and 2021 were collected from the more northern part and had a water depth of 0–1000 m (Figure 1). Therefore, the samples from the 2020 cruise were more influenced by the KW.
3.2 DOC concentrations and CDOM indicators
Table 1 summarizes DOC concentration and optical parameters of water samples from three cruises. During the 2020 and 2021 cruises, the average concentration of DOC was found to be 64.65 ± 19.44 μmol L-1 (31.68–109.29 μmol L-1) and 61.40 ± 15.67 μmol L-1 (35.25–98.47 μmol L-1), respectively. The vertical distribution of DOC exhibited higher concentrations in surface water samples and lower concentrations in deeper water samples, which is a typical depth profile observed in ocean waters (Figure 2A). The comparison of DOC in surface water among the three cruises showed the highest concentration in 2021 (70.88 ± 16.91 μmol L-1) and the lowest concentration in 2020 (60.98 ± 17.16 μmol L-1).
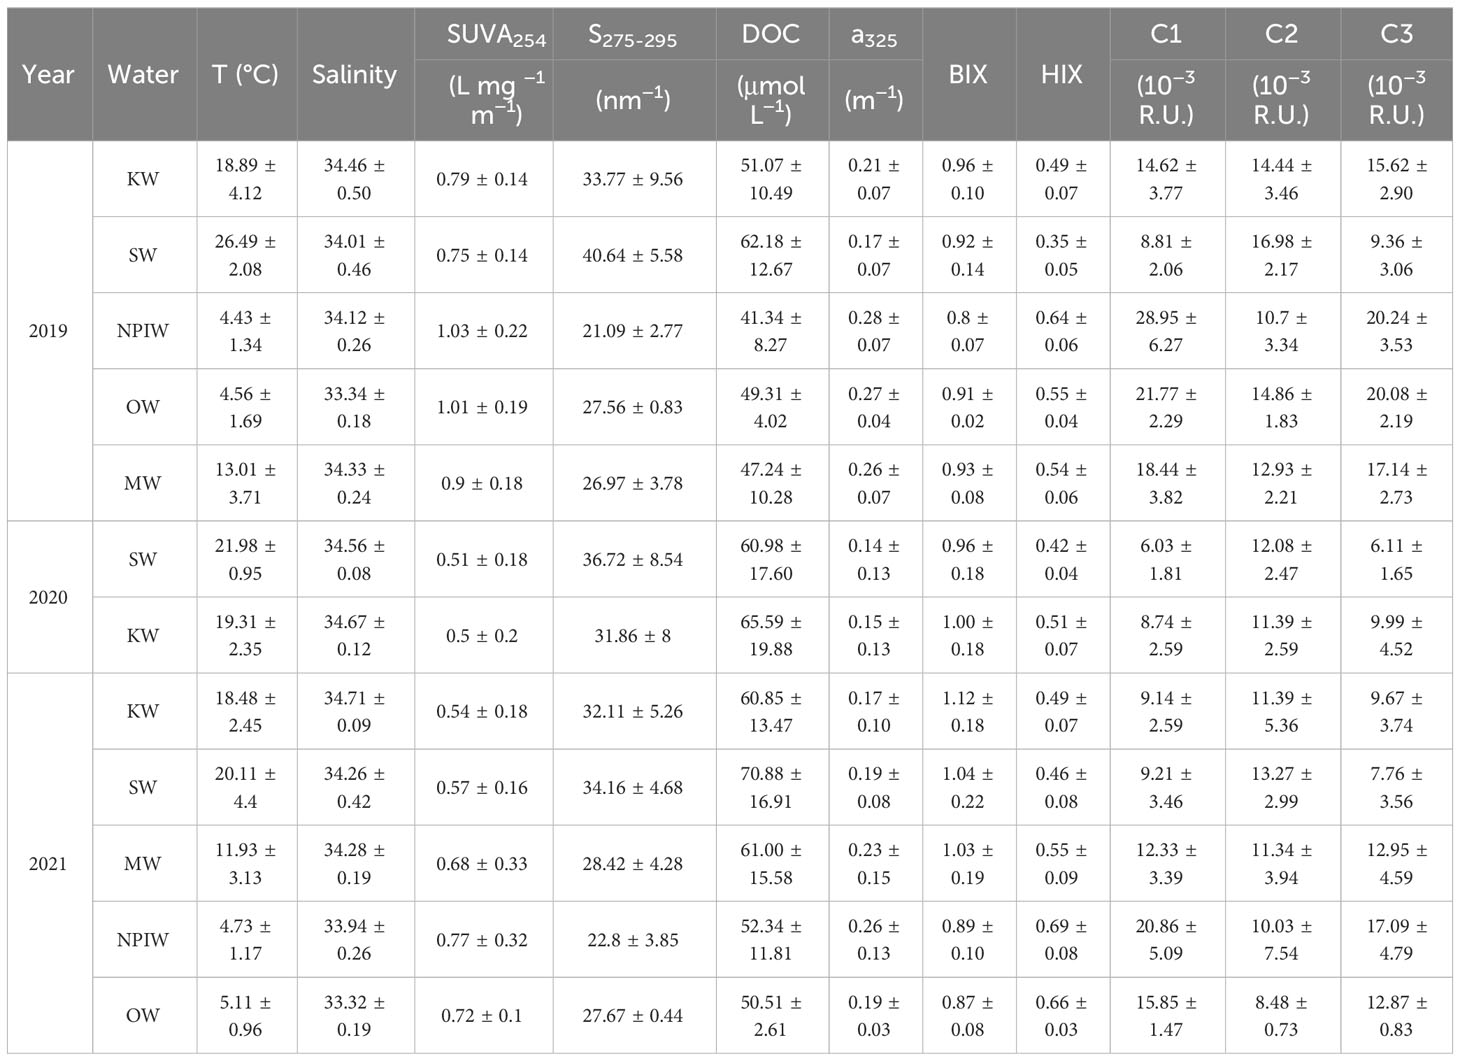
Table 1 Physical and optical parameters of water samples in the K/O region during 2019-2021 cruises.
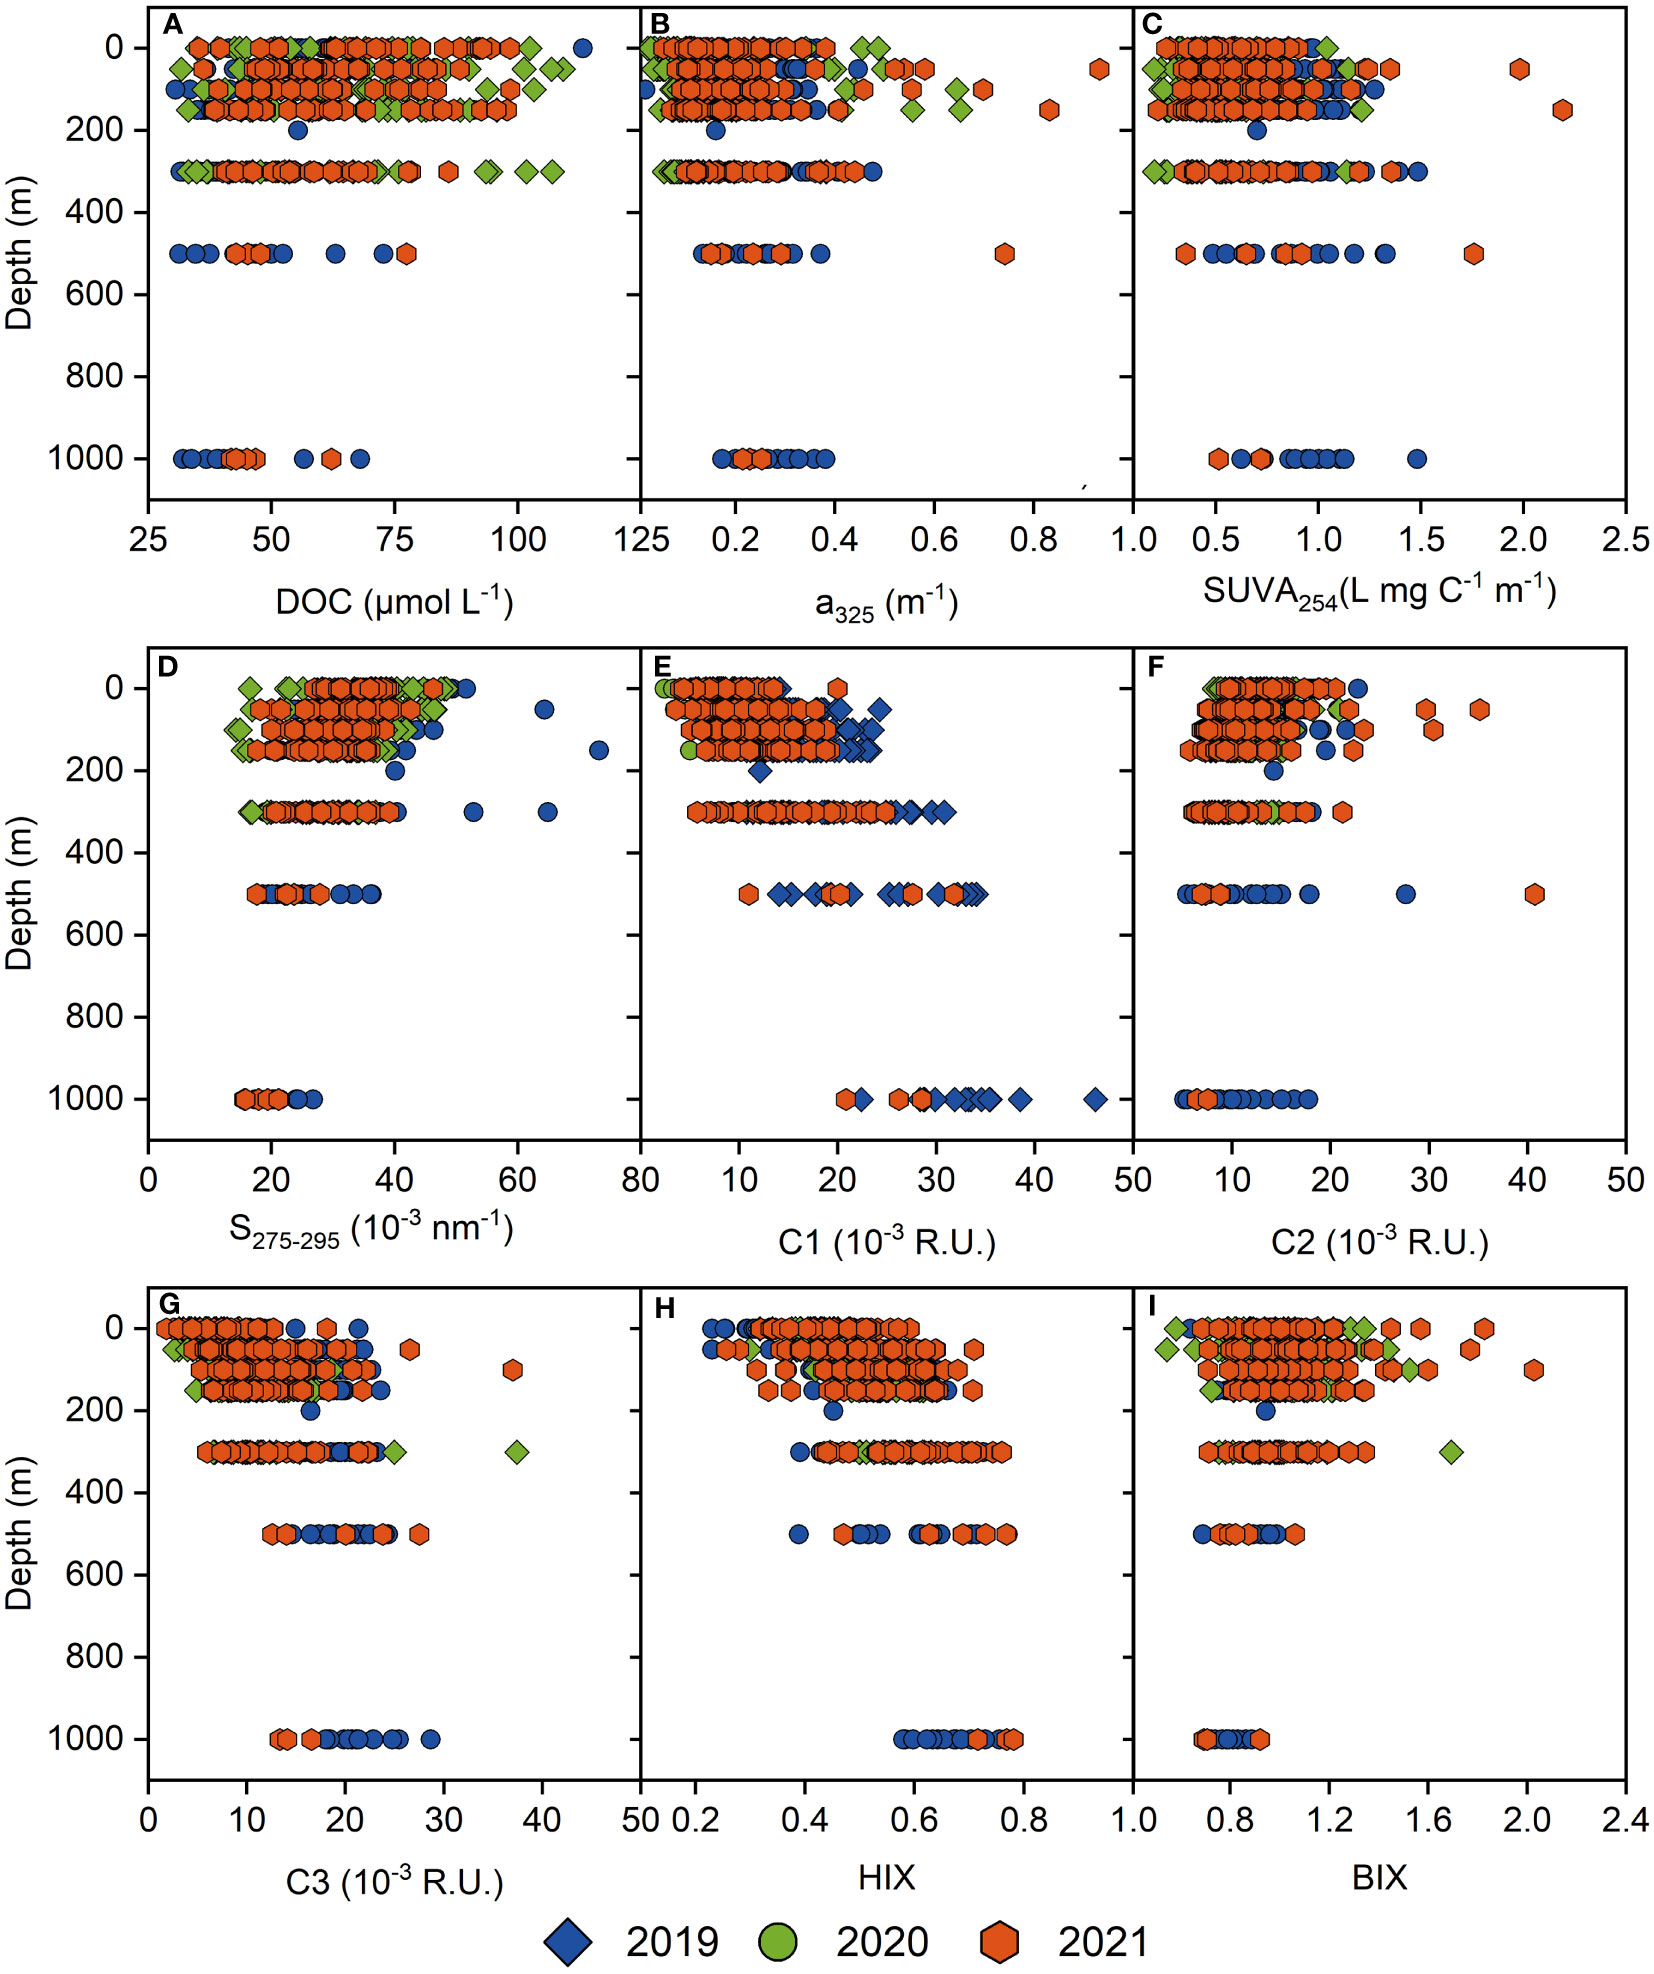
Figure 2 Vertical profiles of the DOC concentration and optical parameters of DOM in the K/O region during 2019–2021. (A) DOC concentration; (B) a325; (C) SUVA254; (D) S275-295; (E) C1; (F) C2; (G) C3; (H) HIX; and (I) BIX.
The average absorption coefficient at 325 nm (a325) was found to be 0.15 ± 0.13 m−1 (0.02–0.65 m−1) in 2020 and 0.21 ± 0.13 m−1 (0.06–0.93 L mg −1 m−1) in 2021, showing a decreasing trend with increased depth for all cruises. For surface water, the a325 varied in the range of 0.02 to 0.49 m−1 (Figure 2B). The average SUVA254 was 0.50 ± 0.20 L mg C−1 m−1 (0.20–1.21 L mg C−1 m−1) in 2020, and 0.63 ± 0.28 L mg C−1 m−1 (0.22–2.19 L mg C−1 m−1) in 2021. From surface to deep waters, the SUVA254 showed an increasing trend for all three cruises (Figure 2C). For surface waters, the SUVA254 ranged from 0.28 to 1.04 L mg C−1 m−1 in 2020 and 0.26 to 0.90 L mg C−1 m−1 in 2021. The average spectral slope between 275 and 295 nm (S275-295) was 32.84 ± 8.35 *10−3 nm−1 (14.25–48.44 *10−3 nm−1) in 2020, and 29.65 ± 5.68 *10−3 nm−1 (15.61–46.28 *10−3 nm−1) in 2021. The vertical profile of S275-295 exhibited a decreasing trend with increased depth, 17.95 ± 2.10 *10−3 nm−1 in the 2021 cruise (1000 m) (Figure 2D). For surface waters, it varied from 16.55 to 48.44 *10−3 nm−1 in 2020, and 26.97 to 46.28 *10−3 nm−1 in 2021.
3.3 FDOM components and indicators
Three fluorescent components were identified by the EEMs-PARAFAC model for the 467 water samples (Figures 3A–C), and their vertical profiles and interannual distribution are shown in Figures 2E–G. Two humic-like and one protein-like components were compared with the components of the Open Fluor database (TCCex, em > 0.95, 95% minimum similarity score) (https://openfluor.lablicate.com/) (Murphy et al., 2014). The C1 (Exmax/Emmax =< 245(340)/471) is a humic-like component, likely derived from microbial processes or photobleaching of DOM (Tanaka et al., 2014; Goncalves-Araujo et al., 2016; Pitta and Zeri, 2021). The C2 (Exmax/Emmax = 275/342) is a protein-like component closely associated with biological activity (Stedmon et al., 2007; Dainard et al., 2015; Zhou et al., 2019). The C3 (Exmax/Emmax =< 240(290)/388) is a marine humic-like substance, which may be related to the biodegradation of marine particulate organic carbon (Goncalves-Araujo et al., 2016; Yang et al., 2019; Zhou et al., 2019). For all three cruises, the vertical profiles of C1 and C3 intensity exhibited an increasing trend with increased depth (Figures 2E, G), whereas the C2 intensity gradually decreased with increased depth (Figure 2F). The C1 had the highest intensity with an average of 17.44 ± 7.67 *10−3 R.U. (5.61–45.93 *10−3 R.U.) in 2019, followed by 2021 with an average of 12.07 ± 5.01 *10−3 R.U. (3.55–31.82 *10−3 R.U.), and then by 2020 with an average of 8.2 ± 2.69*10−3 R.U. (5.61–45.93 *10−3 R.U.). The intensity of C3 showed similar interannual variability to that of C1, with an average of 15.91 ± 4.54*10−3 R.U. in 2019, followed by 2021 (11.67 ± 5.06*10−3 R.U.) and then by 2020 (9.22 ± 4.39*10−3 R.U.). Despite being the highest intensity in 2019 (13.81 ± 3.56*10−3 R.U.), the C2 showed the similar intensity between 2020 (11.53 ± 2.58*10−3 R.U.) and 2021 (11.49 ± 4.81*10−3 R.U.).
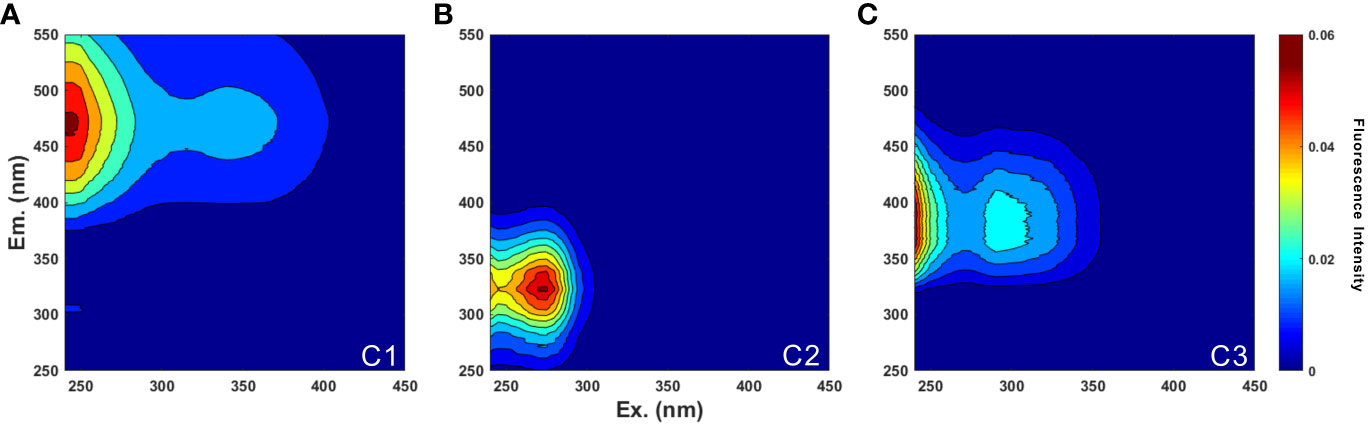
Figure 3 Three components C1 (A), C2 (B) and C3 (C) identified by the EEMs-PARAFAC analysis.
Like the C1 and C3 intensity, the HIX increased with increased depth, with an average of 0.49 ± 0.08 in 2020, and 0.54 ± 0.11 in 2021 (Figure 2H). In contrast, the BIX index (0.55–1.07) decreased with increased depth, with an average of 0.99 ± 0.18 in 2020 and 1.03 ± 0.2 in 2021 (Figure 2I).
4 Discussion
4.1 Spatial distribution charactersitics of DOM in the K/O region
We integrated data on DOM concentrations and compositions from three cruises and examined their correlations with environmental parameters. The correlation coefficients between these parameters were summarized in Table 2. Our analysis revealed a significant positive correlation between the intensities of C1 and C3 (r = 0.76; p< 0.01), indicating that these two humic-like fluorescent components share a common source and undergo similar biogeochemical processes. In contrast, the concentrations of DOC and the intensity of C2 showed a negative correlation with water depth (r = −0.29, −0.20; p< 0.01), while the intensities of C1 and C3 showed positive correlations with depth (r = 0.69, 0.48; p< 0.01). These vertical profiles are consistent with previous reports in open ocean that humic-like C1 and C3 were accumulated in ocean interior, whereas protein-like C2 was preferentially consumed by bacteria in subsurface water (Yamashita and Tanoue, 2008; Wang et al., 2022). The occurrence of the maximum DOC concentration, BIX, and C2 in surface waters suggests that autochthonous production by phytoplankton is a controlling factor on labile and bulk DOC concentrations (Moran et al., 2022). In contrast, the higher humic-like C1 and C3 intensity and the higher HIX in deep water suggest the accumulation of higher aromatic-enriched compounds, which supports that humic-like components were mainly driven by microbial degradation and conversion of labile DOM into refractory DOM in the deeper ocean. Furthermore, we observed a significant positive correlation between temperature and DOC when combining all depth data (0–1000 m) based on our data (r = 0.31; p< 0.01). The influence of water temperature on DOC could be attributed to the enhanced production of DOC resulting from plankton degradation, grazing, and excretion at upper water with higher temperature (Engel et al., 2010; Moran et al., 2022). In deep water where photosynthesis is weak or absent, the DOC concentration is mainly controlled by microbial degradation rate that has a positive correlation with water temperature (Carlson et al., 2010).
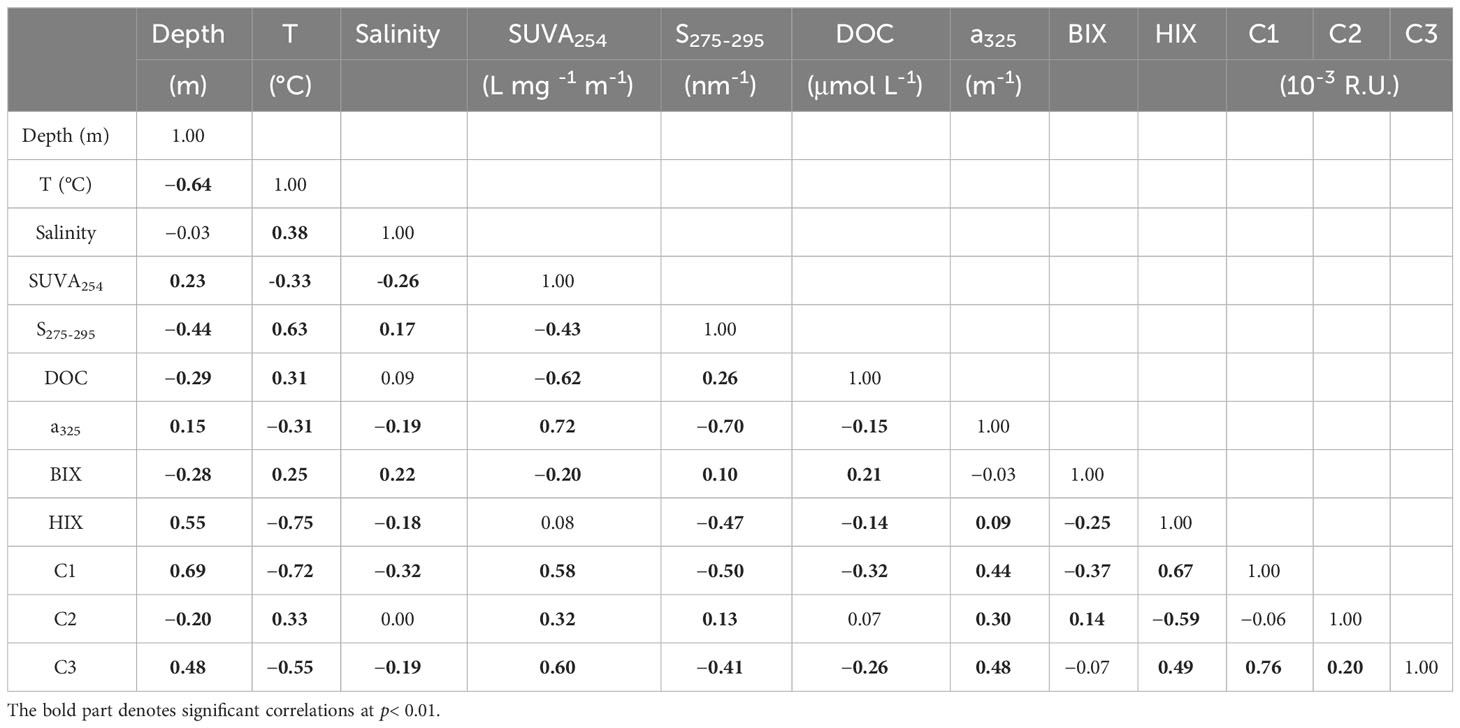
Table 2 Summary on correlation coefficient between environmental parameters and indicators of DOM, CDOM and FDOM.
4.2 Temporal variability in DOM composition among three cruises
Due to differences in sampling location and time among three cruises (Figure 1), we are unable to conduct a site-to-site comparison. Instead, we utilized the PCA for all samples based on water temperature, salinity, and compositions of DOM, CDOM and FDOM (as shown in Figure 4). The first two principal components, PC1 (accounting for 42.6% of total variables) and PC2 (accounting for 17.4% of total variables), together accounted for 60% of total variables. Depth had a positive loading on PC1, while temperature and salinity had negative loadings on PC1. Overall, the deep-water samples (> 300 m; 2019-D and 2021-D in Figure 4) had higher positive loadings on PC1 than the shallow water samples.
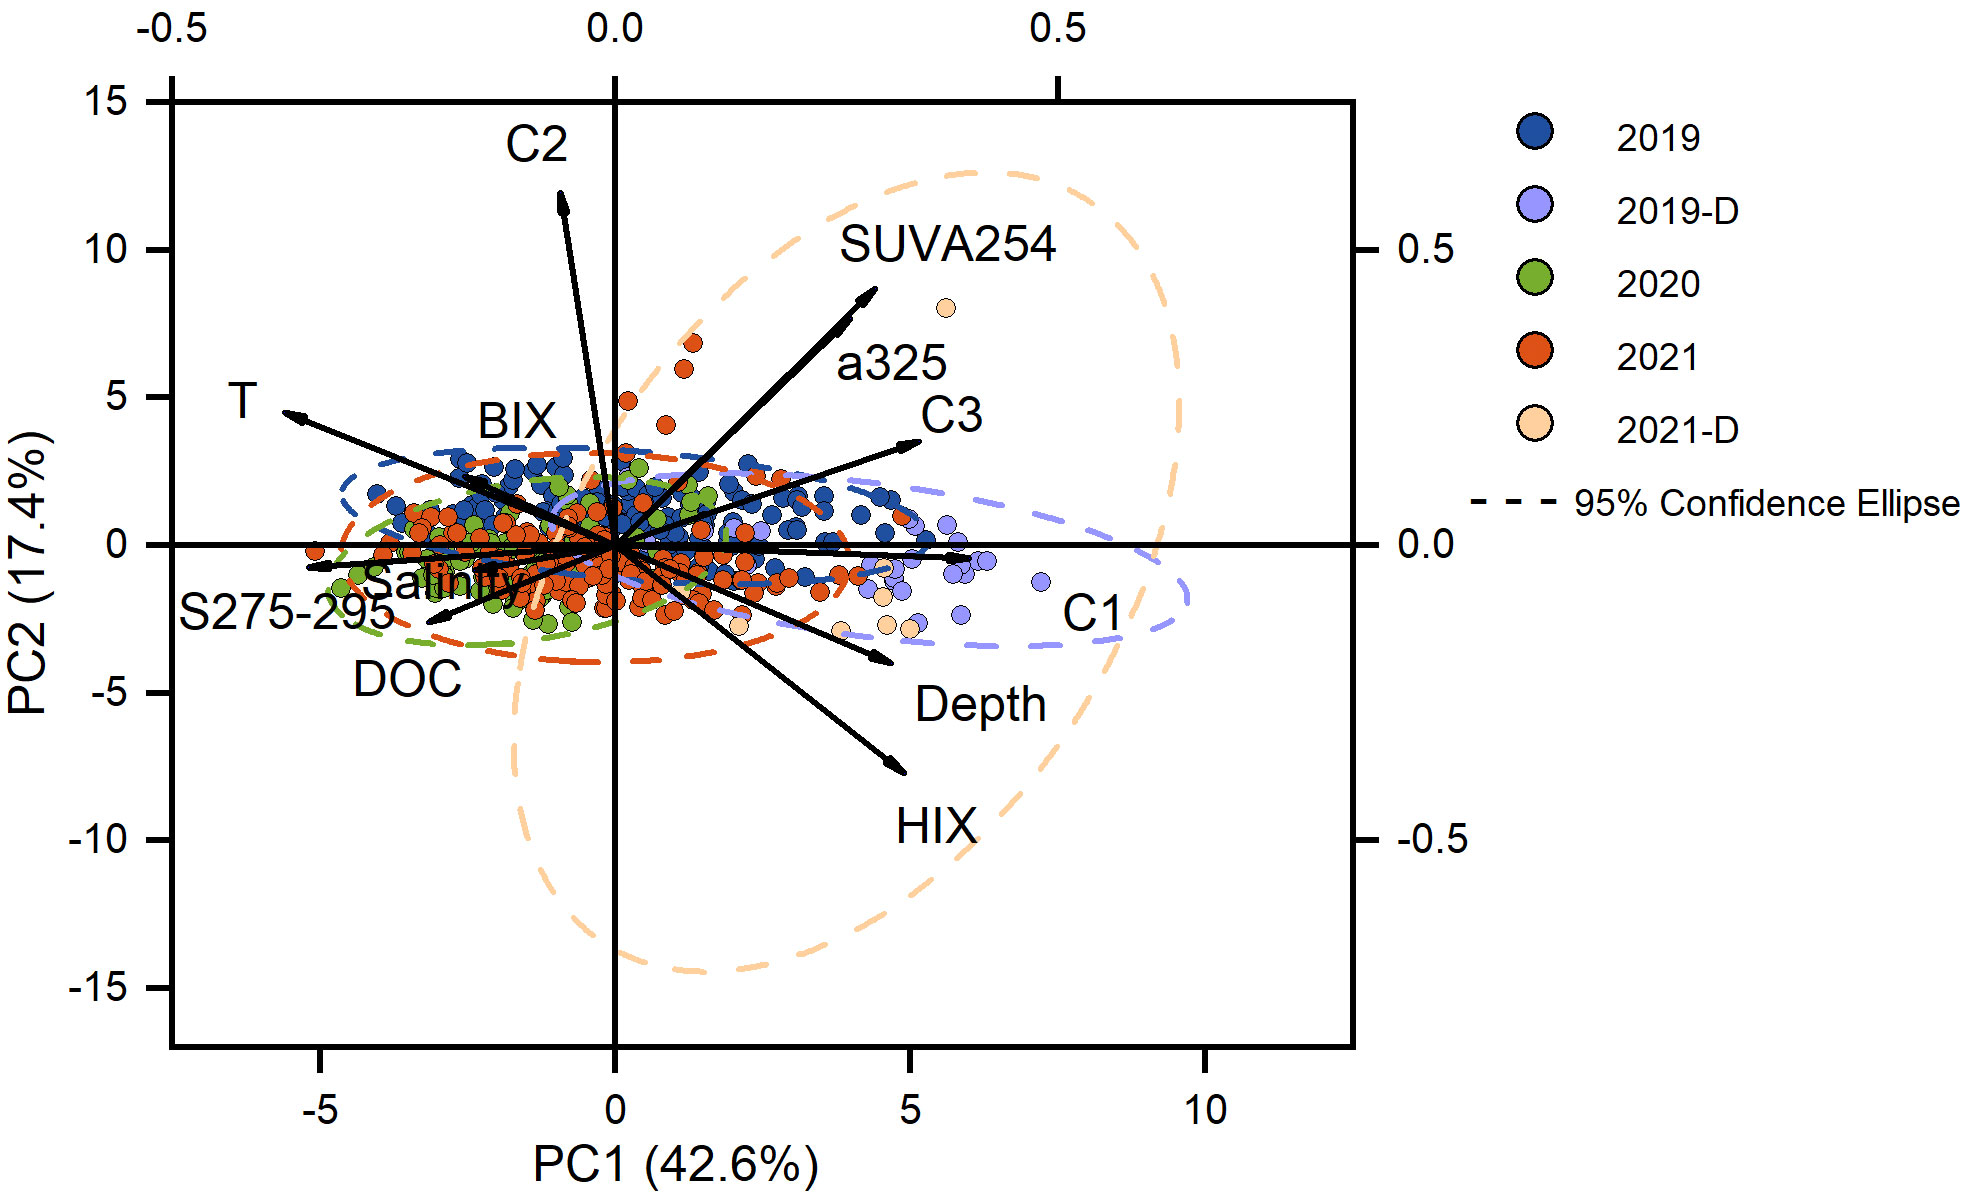
Figure 4 Principal component analysis between the DOM and the parameters of CDOM, FDOM. The blue dots are samples for 2019 cruise (≤ 300 m), and the purple dots (2019-D) for the deeper water samples (> 300 m), the green dots for 2020 cruise, the red dots for 2021 cruise (≤ 300 m), and the orange dots for the deeper water samples (> 300 m). Ellipses represent 95% confidence intervals for each group.
Interestingly, the samples from the 2020 cruise were strongly influenced by water salinity. This can be attributed to two reasons. Firstly, the samples obtained during the 2020 cruise are from the southernmost part of the K/O region compared to the 2019 and 2021 samples (Figure 1) and are therefore under the strongest influence of the KC, characterized by warm and salty water from low latitudes. Secondly, the samples from the 2020 cruise only span the top 300 m of water, whereas the samples from 2019 and 2021 were taken from surface to 1000 m depth. Thus, the influence of NPIW on the samples in 2020 was weaker compared to those in 2019 and 2021. Additionally, the samples from 2020 had relatively low a325 and C2 intensity, which are typical characteristics of the KC due to strong photodegradation during long-distance transport from the equatorial Pacific region (Wang et al., 2022). These results suggest an important influence of water mass on the quality of DOM in the K/O region.
In our study, we observed a decreasing trend in DOC concentrations in surface water samples (≤ 100 m) as latitude increased during the 2019 and 2021 cruises (Figures 5A, C). This finding aligns with the results reported by Ge et al. (2022), who also found a negative correlation between DOC concentrations and latitude in the Northwestern Pacific region. Ge et al. (2022) attributed this correlation to the influence of water temperature on primary production. However, we observed an increasing trend in DOC concentrations with latitude during the 2020 cruise (Figure 5B). This difference may be explained by variable contributions of KW and OW to the upper ocean DOM pool. The 2020 samples (29–35 °N) were collected from lower latitude areas, while the 2019 samples (31–40 °N) and the 2021 samples (35–40 °N) were collected from higher latitude areas. As the KW and the OW converge around 37 °N, the 2020 samples were more influenced by the nutrient-depleted KW, whereas the 2019 and 2021 samples were more influenced by the nutrient-rich OW. These findings highlight the complex spatiotemporal pattern of DOC concentrations in the Northwestern Pacific region.
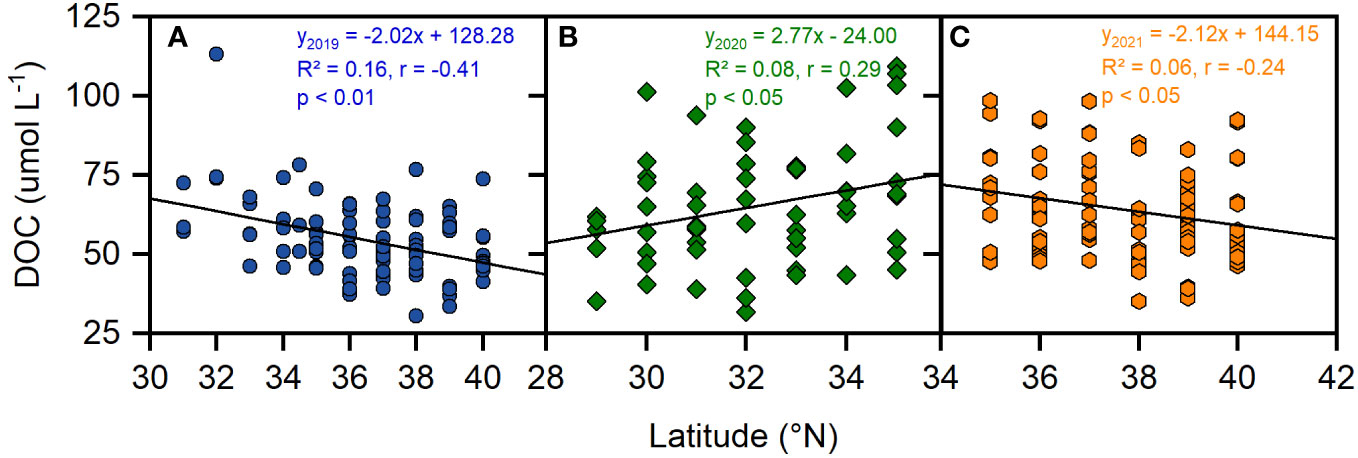
Figure 5 Corrlations between the concentrations of DOC versus latitude in the upper 100 m water depth from the 2019 (A) 2020 (B) and 2021 (C) cruises.
Comparing water samples from the 2019, 2020, and 2021 cruises, we observed that under similar temperatures, the humic-like fluorescence intensity (C1, C3) of samples from the 2019 cruise was generally higher than those from the 2020 and 2021 cruises (Figures 6A–C). This difference may be attributed to variations in sampling location and time, which correspond to different levels of net primary productivity (NPP). The sampling sites in 2019 were located in the northeastern area and closer to the Japanese islands (Figure 1), resulting in stronger OW influence and higher NPP compared to the 2020 and 2021 cruises (NPP: 397.81 vs. 285.21 vs. 391.26 mg C m-2 day-1). Consequently, more organic matter was produced in the euphotic zone during the sampling period in 2019, leading to increased sinking of particulate organic matter into deeper waters and greater microbial transformation of labile organic matter into refractory DOM compounds like C1 and C3 (Wagner et al., 2020; Wang et al., 2021). Additionally, the samples collected during the 2019 cruise were obtained in August and September, with a corresponding surface temperature of 26.49 ± 2.08°C. On the other hand, the samples from the 2020 and 2021 cruises were collected in November-December and June-August, respectively, and their corresponding surface temperature is 21.98 ± 0.95°C and 20.11 ± 4.4°C. These variations in temperature contributed to differences in DOC concentrations among the different cruises.
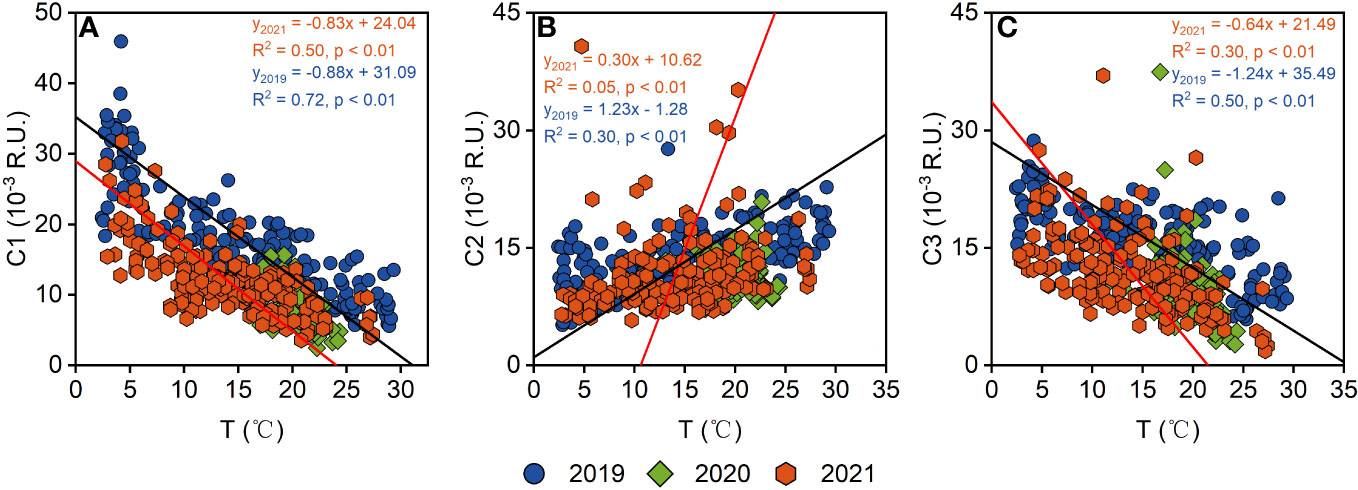
Figure 6 Scatterplots of the fluorescence intensity C1 (A), C2 (B) and C3 (C) against T for water samples from the 2019, 2020 and 2021 cruises. The blue dots and the blue fitting line are samples for 2019 cruise, the green dots for 2020 cruise (no fitting line without the > 300 m samples), and the red dots and the red fitting line for 2021 cruise.
4.3 Different effects on DOM and CDOM during water mass mixing
The proportions of KW, OW, and NPIW in the mixed water of the K/O region are influenced by hydrological and biogeochemical processes (Yasuda et al., 1996; Yasuda, 2003). By applying a three-endmember mixing model, it was determined that the KW was the main source of the mixed water in the 50–300 m layer in 2021, with an average contribution of 57.70 ± 16.80%, whereas the OW contributed 20.04 ± 9.72%, followed by the NPIW with 22.26 ± 13.49% (Figure 7). In comparison to 2021, the water samples from 2019 (50–300 m) had a higher proportion of KW (60.8 ± 18.2%) and lower proportions of OW (18.2 ± 9.5%) and NPIW (21.0 ± 12.2%). This difference is consistent with the significantly higher temperature of the 2019 samples compared to the 2021 samples (26.49 ± 2.08°C vs 20.11 ± 4.40°C). Additionally, there were noticeable differences in DOC concentration and optical parameters in the mixed water. The 2019 samples exhibited lower DOC concentration and higher SUVA254, C1, and C3 intensity compared to the 2021 samples (DOC, 0.57 ± 0.12 vs 0.73 ± 0.19 μmol/L; SUVA254, 0.90± 0.18 vs 0.68 ± 0.33 L mg C-1 m-1; C1, 18.44 ± 3.82 vs 12.33 ± 3.39 *10-3 R.U.; C3, 17.14 ± 2.73 vs 12.95 ± 4.59 *10-3 R.U.). These optical data suggest higher contributions of KW in the 2019 samples since the KW is characterized by lower DOC concentration and higher levels of aromatic-enriched compounds originating from low latitudes between July and September.
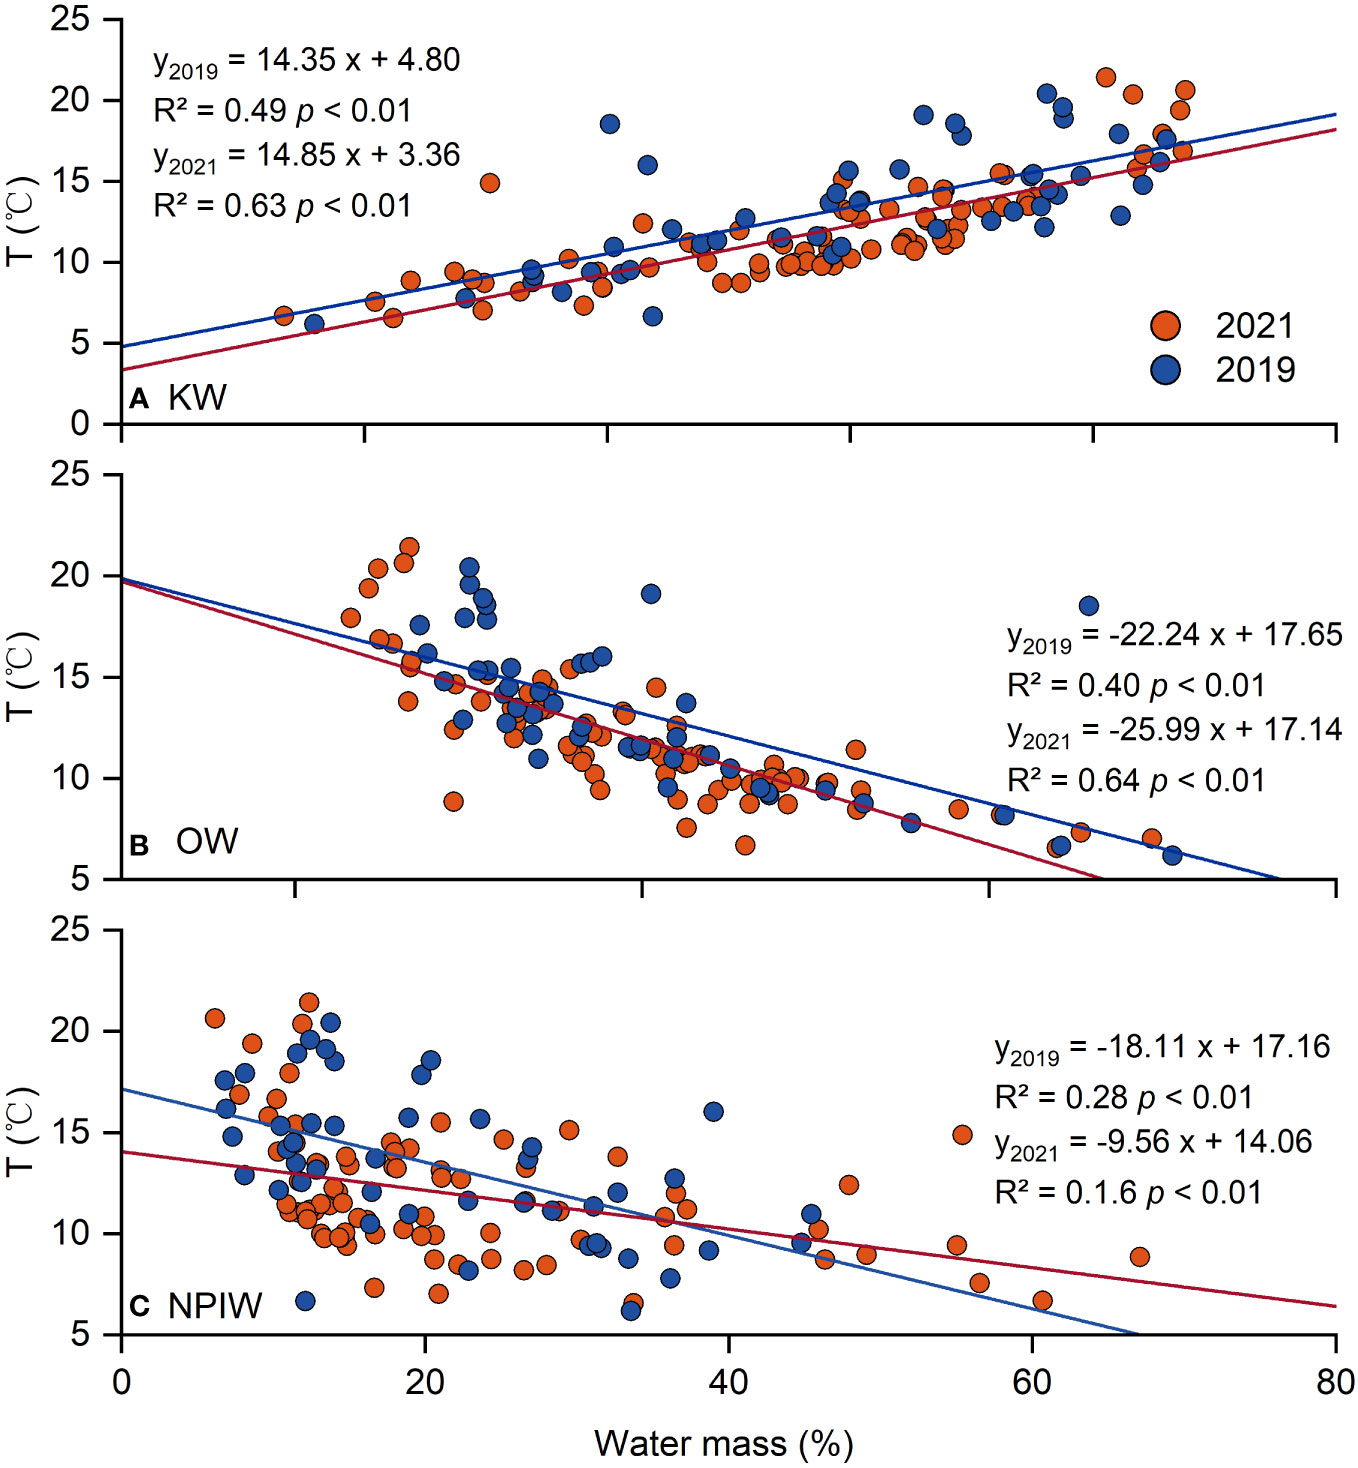
Figure 7 Correlations between water temperature (°C) and the net fraction of water mass (%) in 2019 and 2021. (A) OW; (B) KW; (C) NPIW. The red dots are 50 m water samples, the red dots are 100 m water samples, the green dots are 150 m water samples, and the blue dots are 300 m water samples. The round dots are water samples for the 2019 cruise and the hexagonal dots are water samples for the 2021 cruise.
The deviation of measured values from theoretical values ranged from −25.91 to 28.44 μmol L-1 for ΔDOC, −0.11 to 0.34 m−1 for Δa325, −0.23 to 0.57 for HIX, −8.57 to 6.46 *10-3 R.U for ΔC1, −4.43 to 18.49 *10-3 R.U for ΔC2, and −7.06 to 24.19 *10-3 R.U for ΔC3. In percentages, the maximum positive deviation and negative derivation of ΔDOC/DOCt were found at water mass mixing of KW: OW: NPIW in a ratio of 39.7%: 22.1%: 38.2% and 56.5%:18.2%:25.2%, respectively (Figure 8A). While for Δa325/a325t, the maximum positive was found by 90.0%:3.8%:6.2% of KW, OW, NPIW and the maximum negative was found in 48.0%:17.0%:35.1%, respectively (Figure 8B).
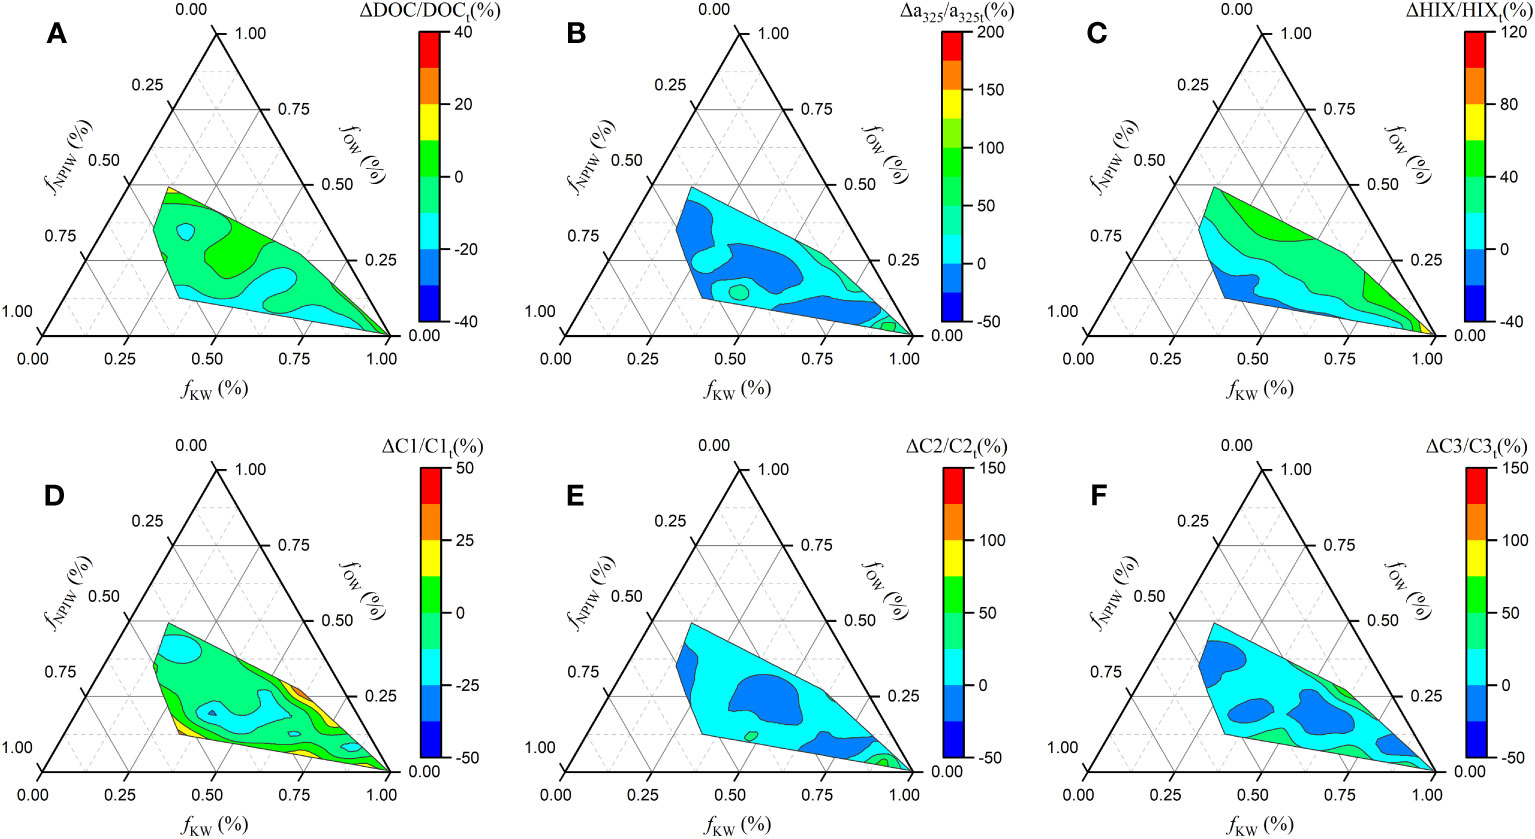
Figure 8 Ternary diagrams for deviations (Δ) with the theoretical values of (A) DOC concentration, (B) a325, (C) HIX, (D) C1, (E) C2 and (F) C3 during varying water mixing in the K/O region of samples from the 2019 cruise and 2021 cruise. Note samples from the 2020 cruise is not included since they are not influenced by the OW.
Figures 8A–F illustrates the variations in different DOM parameters during the mixing of water masses, expressed as a percentage deviation from theoretical values. Despite the complex patterns observed, we found that different water masses had varying influences on the bulk and specific components of DOM in the mixed water. Notably, the deviation in DOC (ΔDOC) increased from negative to positive values (−45.5% to 51.3%) with an increase in contributions from the OW (Figure 8A). We attribute this positive effect to the addition of nutrient-rich OW, which may enhance productivity in subsurface layers (50 to 300 m) and consequently increase the input of fresh DOM into the mixed water. In contrast to ΔDOC, the deviation in CDOM (ΔCDOM) at 325 nm (a325) generally decreased from 195.3% to −55.4% with an increasing proportion of NPIW (Figure 8B). This could be due to the influx of a substantial amount of CDOM from deeper layers (NPIW) to the upper mixed water (50–300 m), leading to accelerated removal of CDOM through photodegradation and biodegradation processes in the upper ocean, which is refractory to the native microbial community in deeper sea. One possible pathway is that the mixing of different water masses introduces new bacteria or additional nutrients, which stimulate bacterial activity or enhance primary productivity, leading to the degradation of old DOM. Additionally, water mass mixing can bring intermediate water, such as NPIW, to the upper ocean, which may accelerate the photodegradation of refractory DOM in the deep ocean interior. The latter pathway has been demonstrated by Shen and Benner (2018) through bioassay experiments using DOC isolated from surface, mesopelagic, and deep waters of the Atlantic Ocean. This explanation is also supported by the negative effect of the NPIW on the ΔHIX (Figure 8C). Since the HIX in the NPIW is significantly higher than that in the KW and OW (Table 1), an increased contribution of NPIW brings more bio-refractory humic-like compounds to the upper water, where they are more effectively photo- and microbial degraded compared to deep seawater. The impact of the KW on DOM and CDOM in the mixed water is not evident. However, we observed a positive effect on ΔCDOM and ΔHIX when the KW contribution exceeded 90% (Figures 8B, C). This is likely due to the transformation of DOM to CDOM through downwelling of KW water. The effect of water mass mixing on FDOM components is complex (Figures 8D-F). In light of our collective discoveries, it is evident that there exists an active and heterogenous biogeochemical reactivity of DOM within water mass mixing. Considering the significant impact of ongoing climate change on oceanic circulation patterns, it is highly recommended to undertake further investigations into the reaction and removal mechanisms of DOM in different oceanic regions experiencing water mass mixing.
5 Conclusions
We investigated DOC concentration and the absorption and fluorescence properties of DOM at various depths (0−1000 m) in the K/O region during three cruises in 2019, 2020 and 2021. Our study yielded four conclusions.
1. Surface water samples had higher DOC concentrations, higher absorption at 325 nm (a325), and BIX, while deeper water samples had higher HIX values. These results suggest that primary productivity and microbial transformation of labile organic matter are the main factors influencing the quantity and quality of bulk DOM and CDOM (including FDOM) in surface and deep waters, respectively.
2. The samples collected during the 2019 cruise exhibited lower DOC concentrations and higher intensity of humic-like fluorescence (C1, C3) compared to the samples collected during the 2021 cruise, even under similar temperature conditions. These differences were attributed to variations in sampling locations and the time interval between the two cruises, which corresponds to a greater contribution of Kuroshio water to the 2019 samples.
3. The DOC concentrations in the top 100-m samples displayed distinct latitudinal trends in the southern (28−34°N) and northern (30−42 °N) regions. These trends reflect the varying influences of the nutrient-depleted Kuroshio Current and the nutrient-rich Oyashio Current in their respective regions.
4. The application of the three-endmember mixing model revealed nonconservative and diverse behaviors of DOM during water mass mixing. Our finding suggests that the water mass mixing (particularly overturning circulation) may play an important role in removal of refractory DOM.
Data availability statement
The original contributions presented in the study are included in the article/Supplementary Materials. Further inquiries can be directed to the corresponding author.
Author contributions
YSW: Writing – original draft, Formal Analysis, Investigation, Methodology. BL: Writing – original draft, Funding acquisition, Project administration, Resources. WW: Software, Validation, Writing – review and editing. LL: Methodology, Software, Writing – original draft. YHW: Software, Methodology, Writing – original draft. YX: Writing – original draft, Conceptualization, Funding acquisition, Project administration, Supervision, Writing – review and editing.
Funding
The author(s) declare that no financial support was received for the research, authorship, and/or publication of this article.
Acknowledgments
The financial supports are from the Shanghai Science and Technology Commission (23230760300), National Natural Science Foundation of China (42276033), and the Project on the Survey and Monitor-Evaluation of Global Fishery Resources (Comprehensive Scientific Survey of Fishery Resources at the High Seas). Samples were obtained during the cruise by the RV Songhang funded by Shanghai Ocean University. We thank captain, crews, and scientists for their excellent support to obtain these samples. We also thank three reviewers for their constructive comments.
Conflict of interest
The authors declare that the research was conducted in the absence of any commercial or financial relationships that could be construed as a potential conflict of interest.
The author(s) declared that they were an editorial board member of Frontiers, at the time of submission. This had no impact on the peer review process and the final decision.
Publisher’s note
All claims expressed in this article are solely those of the authors and do not necessarily represent those of their affiliated organizations, or those of the publisher, the editors and the reviewers. Any product that may be evaluated in this article, or claim that may be made by its manufacturer, is not guaranteed or endorsed by the publisher.
Supplementary material
The Supplementary Material for this article can be found online at: https://www.frontiersin.org/articles/10.3389/fmars.2023.1276600/full#supplementary-material
References
Andersson A. (2011). A systematic examination of a random sampling strategy for source apportionment calculations. Sci. Total Environ. 412–413, 232–238. doi: 10.1016/j.scitotenv.2011.10.031
Behrenfeld M. J., Falkowski P. G. (1997). Photosynthetic rates derived from satellite-based chlorophyll concentration. Limnol. Oceanogr. 42, 1–20. doi: 10.4319/lo.1997.42.1.0001
Carlson C. A., Hansell D. A. (2015). “DOM sources, sinks, reactivity, and budgets,” in Biogeochemistry of Marine Dissolved Organic Matter. (Elsevier Inc.), 65–126. doi: 10.1016/C2012-0-02714-7
Carlson C. A., Hansell D. A., Nelson N. B., Siegel D. A., Smethie W. M., Khatiwala S., et al. (2010). Dissolved organic carbon export and subsequent remineralization in the mesopelagic and bathypelagic realms of the North Atlantic basin. Deep-Sea Res. Pt. II 57, 1433–1445. doi: 10.1016/j.dsr2.2010.02.013
Dainard P. G., Guéguen C., McDonald N., Williams W. J. (2015). Photobleaching of fluorescent dissolved organic matter in Beaufort Sea and North Atlantic Subtropical Gyre. Mar. Chem. 177, 630–637. doi: 10.1016/j.marchem.2015.10.004
Ding L., Ge T., Wang X. (2019). Dissolved organic carbon dynamics in the East China Sea and the northwest Pacific Ocean. Ocean Sci. 15, 1177–1190. doi: 10.5194/os-15-1177-2019
Dittmar T., Lennartz S. T., Buck-Wiese H., Hansel D. A., Santinelli C., Vanni C., et al. (2021). Enigmatic persistence of dissolved organic matter in the ocean. Nat. Rev. Earth Env. 2, 570–583. doi: 10.1038/s43017-021-00183-7
Engel A., Handel N., Wohlers J., Lunau M., Grossart H. P., Sommer U., et al. (2010). Effects of sea surface warming on the production and composition of dissolved organic matter during phytoplankton blooms: results from a mesocosm study. J. Plankton Res. 33, 357–372. doi: 10.1093/plankt/fbq122
Ge T., Luo C., Ren P., Zhang H., Chen H., Chen Z., et al. (2022). Dissolved organic carbon aong a meridional transect in the Western North Pacific Ocean: distribution, variation and controlling processes. Front. Mar. Sci. 9. doi: 10.3389/fmars.2022.909148
Goncalves-Araujo R., Granskog M. A., Bracher A., Azetsu-Scott K., Dodd P. A., Stedmon C. A. (2016). Using fluorescent dissolved organic matter to trace and distinguish the origin of Arctic surface waters. Sci. Rep. 6, 33978. doi: 10.1038/srep33978
Hansell D. A., Carlson C. A., Suzuki Y. (2002). Dissolved organic carbon export with North Pacific Intermediate Water formation. Global Biogeochem Cy 16, 7–1-7-8. doi: 10.1029/2000gb001361
Hedges J. I. (2002). “Chapter 1 - Why dissolved organics matter,” in Biogeochemistry of marine dissolved organic matter. Eds. Hansell D. A., Carlson C. A. (San Diego: Academic Press), 1–33. doi: 10.1016/B978-012323841-2/50003-8
Helms J. R., Stubbins A., Ritchie J. D., Minor E. C., Kieber D. J. (2008). Absorption spectral slopes and slope ratios as indicators of molecular weight, source and photobleaching of chromophoric dissolved organic matter. Limnol. Oceanogr. 53, 955–969. doi: 10.4319/lo.2008.53.3.0955
Kakehi S., Ito S.-i., Wagawa T. (2017). Estimating surface water mixing ratios using salinity and potential alkalinity in the Kuroshio-Oyashio mixed water regions. J. Geophys. Res. Oceans 122, 1927–1942. doi: 10.1002/2016JC012268
Kieber R. J., Whitehead R. F., Reid S. N., Willey J. D., Seaton P. J. (2006). Chromophoric dissolved organic matter (CDOM) in rainwater, Southeastern North Carolina, USA. J. Atmos. Chem. 54, 21–41. doi: 10.1007/s10874-005-9008-4
Lawaetz A. J., Stedmon C. A. (2009). Fluorescence intensity calibration using the raman scatter peak of water. Appl. Spectrosc. 63, 936–940. doi: 10.1366/000370209788964548
Miller A. J., Chai F., Chiba S., Moisan J. R., Neilson D. J. (2004). Decadal-scale climate and ecosystem interactions in the North Pacific Ocean. J. Oceanogr. 60, 163–188. doi: 10.1023/B:JOCE.0000038325.36306.95
Moran M. A., Ferrer-González F. X., Fu H., Nowinski B., Olofsson M., Powers M. A., et al. (2022). The Ocean's labile DOC supply chain. Limnol. Oceanogr. 67, 1007–1021. doi: 10.1002/lno.12053
Murphy K. R., Stedmon C. A., Wenig P., Bro R. (2014). OpenFluor– an online spectral library of auto-fluorescence by organic compounds in the environment. Anal. Methods 6, 658–661. doi: 10.1039/c3ay41935e
Nakanowatari T., Ohshima K. I., Wakatsuchi M. (2007). Warming and oxygen decrease of intermediate water in the northwestern North Pacific, originating from the Sea of Okhotsk 1955–2004. Geophys. Res. Lett. 34, L04602. doi: 10.1029/2006gl028243
Nishioka J., Obata H., Ogawa H., Ono K., Yamashita Y., Lee K., et al. (2020). Subpolar marginal seas fuel the North Pacific through the intermediate water at the termination of the global ocean circulation. Proc. Natl. Acad. Sci. U.S.A. 117, 12665–12673. doi: 10.1073/pnas.2000658117
Ohno T. (2002). Fluorescence inner-filtering correction for determining the humification index of dissolved organic matter. Environ. Sci. Technol. 36, 742–746. doi: 10.1021/es0155276
Okuda K., Yasuda I., Hiroe Y., Shimizu Y. (2001). Structure of subsurface intrusion of the oyashio water into the kuroshio extension and formation process of the North Pacific intermediate water. J. Oceanogr. 57, 121–140. doi: 10.1023/a:1011135006278
Pitta E., Zeri C. (2021). The impact of combining data sets of fluorescence excitation - emission matrices of dissolved organic matter from various aquatic sources on the information retrieved by PARAFAC modeling. Spectrochim. Acta A 258, 119800. doi: 10.1016/j.saa.2021.119800
Shen Y., Benner R. (2018). Mixing it up in the ocean carbon cycle and the removal of refractory dissolved organic carbon. Sci. Rep. 8, 2542. doi: 10.1038/s41598-018-20857-5
Stedmon C. A., Bro R. (2008). Characterizing dissolved organic matter fluorescence with parallel factor analysis: a tutorial. Limnol. Oceanogr. Methods 6, 572–579. doi: 10.4319/lom.2008.6.572
Stedmon C. A., Markager S., Tranvik L., Kronberg L., Slätis T., Martinsen W. (2007). Photochemical production of ammonium and transformation of dissolved organic matter in the Baltic Sea. Mar. Chem. 104, 227–240. doi: 10.1016/j.marchem.2006.11.005
Swan C. M., Siegel D. A., Nelson N. B., Carlson C. A., Nasir E. (2009). Biogeochemical and hydrographic controls on chromophoric dissolved organic matter distribution in the Pacific Ocean. Deep Sea Res. I Oceanogr. Res. Pap. 56, 2175–2192. doi: 10.1016/j.dsr.2009.09.002
Takasugi S., Yasuda I. (1993). Temperature indices of the Oyashio Front between the Oyashio water and the Tsugaru warm water at 100 m depth in the Iwate coastal region. Bull. Jap. Soc Fish. Oceanogr. 57, 333–344.
Talley L. D., Nagata Y., Fujimura M., Iwao T., Kono T., Inagake D., et al. (1995). North Pacific intermediate water in the Kuroshio/Oyashio Mixed Water Region. J. Phys. Oceanogr. 25, 475–501. doi: 10.1175/1520-0485(1995)0252.0.CO;2
Tanaka K., Kuma K., Hamasaki K., Yamashita Y. (2014). Accumulation of humic-like fluorescent dissolved organic matter in the Japan Sea. Sci. Rep. 4, 5292. doi: 10.1038/srep05292
Wagner S., Schubotz F., Kaiser K., Hallmann C., Waska H., Rossel P. E., et al. (2020). Soothsaying DOM: A current perspective on the future of oceanic dissolved organic carbon. Front. Mar. Sci. 7. doi: 10.3389/fmars.2020.00341
Wang C., Guo W., Li Y., Dahlgren R. A., Guo X., Qu L., et al. (2021). Temperature-regulated turnover of chromophoric dissolved organic matter in global dark marginal basins. Geophys. Res. Lett. 48, e2021GL094035. doi: 10.1029/2021gl094035
Wang Y., Wang Y., Ge H., Liu B., Wu J., Han L., et al. (2022). Optical characterization of dissolved organic matter in Kuroshio-Oyashio confluence region: Implication for water mass mixing. Deep Sea Res. I Oceanogr. Res. Pap. 185, 103807. doi: 10.1016/j.dsr.2022.103807
Weishaar J. L., Aiken G. R., Bergamaschi B. A., Fram M. S., Fujii R., Mopper K. (2003). Evaluation of specific ultraviolet absorbance as an indicator of the chemical composition and reactivity of dissolved organic carbon. Environ. Sci. Technol. 37, 4702–4708. doi: 10.1021/es030360x
Wilson H. F., Xenopoulos M. A. (2008). Effects of agricultural land use on the composition of fluvial dissolved organic matter. Nat. Geosci. 2, 37–41. doi: 10.1038/ngeo391
Yamashita Y., Cory R. M., Nishioka J., Kuma K., Tanoue E., Jaffé R. (2010). Fluorescence characteristics of dissolved organic matter in the deep waters of the Okhotsk Sea and the northwestern North Pacific Ocean. Deep Sea Res. II Top. Stud. Oceanogr. 57, 1478–1485. doi: 10.1016/j.dsr2.2010.02.016
Yamashita Y., Tosaka T., Bamba R., Kamezaki R., Goto S., Nishioka J., et al. (2021). Widespread distribution of allochthonous fluorescent dissolved organic matter in the intermediate water of the North Pacific. Prog. Oceanogr. 191, 102510. doi: 10.1016/j.pocean.2020.102510
Yamashita Y., Tanoue E. (2008). Production of bio-refractory fluorescent dissolved organic matter in the ocean interior. Nat. Geosci. 1, 579–582. doi: 10.1038/ngeo279
Yang L., Cheng Q., Zhuang W. E., Wang H., Chen W. (2019). Seasonal changes in the chemical composition and reactivity of dissolved organic matter at the land-ocean interface of a subtropical river. Environ. Sci. pollut. Res. Int. 26, 24595–24608. doi: 10.1007/s11356-019-05700-2
Yasuda I. (2003). Hydrographic structure and variability in the Kuroshio-Oyashio Transition Area. J. Oceanogr. 59, 389–402. doi: 10.1023/a:1025580313836
Yasuda I., Okuda K., Shimizu Y. (1996). Distribution and modification of North Pacific Intermediate Water in the Kuroshio-Oyashio frontal zone. J. Phys. Oceanogr. 26, 448–465. doi: 10.1175/1520-0485(1996)026<0448:DAMONP>2.0.CO;2
Yatsu A., Chiba S., Yamanaka Y., Ito S.-i., Shimizu Y., Kaeriyama M., et al. (2013). Climate forcing and the Kuroshio/Oyashio ecosystem. ICES J. Mar. Sci. 70, 922–933. doi: 10.1093/icesjms/fst084
Keywords: Kuroshio-Oyashio confluence regions, chromophoric dissolved organic matter (CDOM), fluorescent dissolved organic matter (FDOM), parallel factor analysis (PARAFAC), interannual variation
Citation: Wang Y, Liu B, Wu W, Liu L, Wang Y and Xu Y (2023) Water mass mixing contributes dynamics of dissolved organic matter in Kuroshio-Oyashio confluence region. Front. Mar. Sci. 10:1276600. doi: 10.3389/fmars.2023.1276600
Received: 12 August 2023; Accepted: 20 October 2023;
Published: 02 November 2023.
Edited by:
Liyang Yang, Fuzhou University, ChinaReviewed by:
Ruifeng Zhang, Shanghai Jiao Tong University, ChinaChen He, China University of Petroleum, China
Copyright © 2023 Wang, Liu, Wu, Liu, Wang and Xu. This is an open-access article distributed under the terms of the Creative Commons Attribution License (CC BY). The use, distribution or reproduction in other forums is permitted, provided the original author(s) and the copyright owner(s) are credited and that the original publication in this journal is cited, in accordance with accepted academic practice. No use, distribution or reproduction is permitted which does not comply with these terms.
*Correspondence: Yunping Xu, eXB4dUBzaG91LmVkdS5jbg==