
95% of researchers rate our articles as excellent or good
Learn more about the work of our research integrity team to safeguard the quality of each article we publish.
Find out more
ORIGINAL RESEARCH article
Front. Mar. Sci. , 07 December 2023
Sec. Marine Evolutionary Biology, Biogeography and Species Diversity
Volume 10 - 2023 | https://doi.org/10.3389/fmars.2023.1275320
 Hedvig Csapó1,2*Aleksandra Jabłońska2Jan Marcin Węsławski1Nova Mieszkowska3,4Michael Gantsevich5Ida Dahl-Hansen6Paul Renaud6,7Michał Grabowski2
Introduction: Post-glacial climate variation is known to have influenced the distribution of marine species in the North Atlantic. In particular, the Atlantic side of the Arctic has experienced strong fluctuations in both atmospheric and sea surface temperature, as well as seasonal ice coverage since the last glacial maximum (LGM). Here, we aim to unveil the phylogeography and historical demography of three rocky intertidal marine invertebrates showing a trans-Atlantic distribution and presently inhabiting the Arctic: Gammarus oceanicus, Littorina saxatilis and Semibalanus balanoides.
Methods: We used a large amount of mitochondrial DNA barcode data, both newly-obtained and stored in public databases. We performed phylogeographic and demographic analyses on 1119 G. oceanicus, 205 L. saxatilis, and 884 S. balanoides sequences.
Results: Our results show that all three of these boreal species have expanded their effective population sizes in the high Arctic Svalbard Archipelago since the LGM. Analyses investigating the origin of all these populations point to the eastern Atlantic.
Discussion: Based on our results we conclude that the expansion of these boreal species to the Arctic possibly happened during an earlier warm cycle of the Holocene era, and is probably not the result of the recent ‘Atlantification’ of the Arctic. We also discuss the effects of dispersal potential on population structure as an important aspect of comparative biogeographical studies.
Arctic environments have undergone several cycles of temperature fluctuation in the past few hundred-thousand years (White et al., 2010; Osika et al., 2022). Apart from the prominent alterations between glacial and interglacial periods, there had been changes in arctic climate on smaller time scales as well. The most recent of these were the climate fluctuations of the Holocene era (ca. 11 700 ya - present day), during which the marine ecosystems of North Atlantic and the Arctic oceans had to adapt and reshape their species composition. Due to such climate fluctuations the Arctic fauna and flora is relatively young in evolutionary terms (Dunton, 1992). When it comes to the present day composition of Arctic marine fauna, it is a mixture of species adapted to arctic climate and species of boreal origin, which have expanded their distribution to more northern latitudes during warmer periods (Csapó et al., 2021). The exact sources and expansion times of organisms of boreal origin are in many cases unknown. Some of them had colonized Arctic habitats during earlier warm periods, while others expanded their distribution as a result of the most recent ‘Atlantification’ processes and/or anthropogenic aid (Chan et al., 2019; Csapó et al., 2021; Ingvaldsen et al., 2021).
Studying the biogeographic history of species and populations is an effective way to characterize such expansion in both spatial and temporal context. In the case of comparative biogeographical studies certain factors influencing population structure need to be taken into consideration. One of these is the influence of dispersal ability (Bohonak, 1999). In general theory, higher dispersal potential leads to weak population structure and increased levels of gene flow. Conversely, the reduced ability of organisms to disperse (either passively via propagules or actively by movement) over large geographic distances may lead to well-pronounced population genetic structure. In the marine realm the presence of planktonic larval and/or actively swimming stages in the organism’s life cycle will increase the chances of a homogeneous genetic landscape in a population over a wide geographic area. This process has been studied in marine populations in all oceans both on a small and large scale (Pelc et al., 2009; Hoffman et al., 2011; Riginos et al., 2011; Dawson et al., 2014; Haye et al., 2014; Arranz et al., 2021; Blakeslee et al., 2021).
DNA barcoding is one tool which is widely applied in a variety of biodiversity studies, from basic biodiversity surveys, through integrative taxonomy and phylogeography, to population genetics (Fišer Pečnikar and Buzan, 2014). The application of DNA barcode data to investigate marine biodiversity is widely recognized (Radulovici et al., 2010). Across most animal phyla the mitochondrial cytochrome oxidase I subunit (COI) coding gene serves as the universal DNA barcode (Folmer et al., 1994; Lobo et al., 2013; Guo et al., 2022). With the development of Barcode of Life Data Systems (BOLD) (Ratnasingham and Hebert, 2007) and other public DNA sequence databases, like Genbank, the possibility to extract data from various sources and include it in a comparative study has expanded. This way DNA barcodes can be integrated from wide geographic ranges, allowing for large scale phylogeographic/population genetic analyses to be conducted. Population genetic studies of the marine environment especially need to target large spatial scales, as the distributions of many organisms are broad and such works can be globally relevant (O’Hara et al., 2017). Such broadly distributed species of boreal origin, currently inhabiting the Arctic were chosen as models of this study. Keeping in mind the influence of dispersal potential on inferred population structure, we considered species with differing life history straits.
Gammarus oceanicus is an amphipod crustacean of Atlantic-boreal origin, presently inhabiting northern coasts of Europe and North America (Węławski, 1994). G. oceanicus, like all amphipods, is a brooder, meaning that females keep the fertilized eggs as well as juveniles in the marsupium and release fully-formed juveniles with morphological and ecological characteristics of adults (Figure 1B) (Väinölä et al., 2008). As a planktonic larval stage is absent from the life cycle, the dispersal potential of gammarids is expected to be low (Väinölä et al., 2008). The first data on the phylogeography of G. oceanicus has been inferred with the help of mitochondrial DNA by Krebes et al. (2011). They identified two monophyletic clades, one of which inhabits the north-western Atlantic, while the second the north-eastern Atlantic and Arctic localities. The Arctic populations of the species have not been extensively studied, besides the ones residing on Svalbard. Recent studies (Węsławski et al., 2018; Grabowski et al., 2019) showed that due to warming conditions, G. oceanicus has expanded its population along the North Atlantic-influenced western Svalbard coastline, while its Arctic sister species, Gammarus setosus has retreated to the eastern coasts of the archipelago.
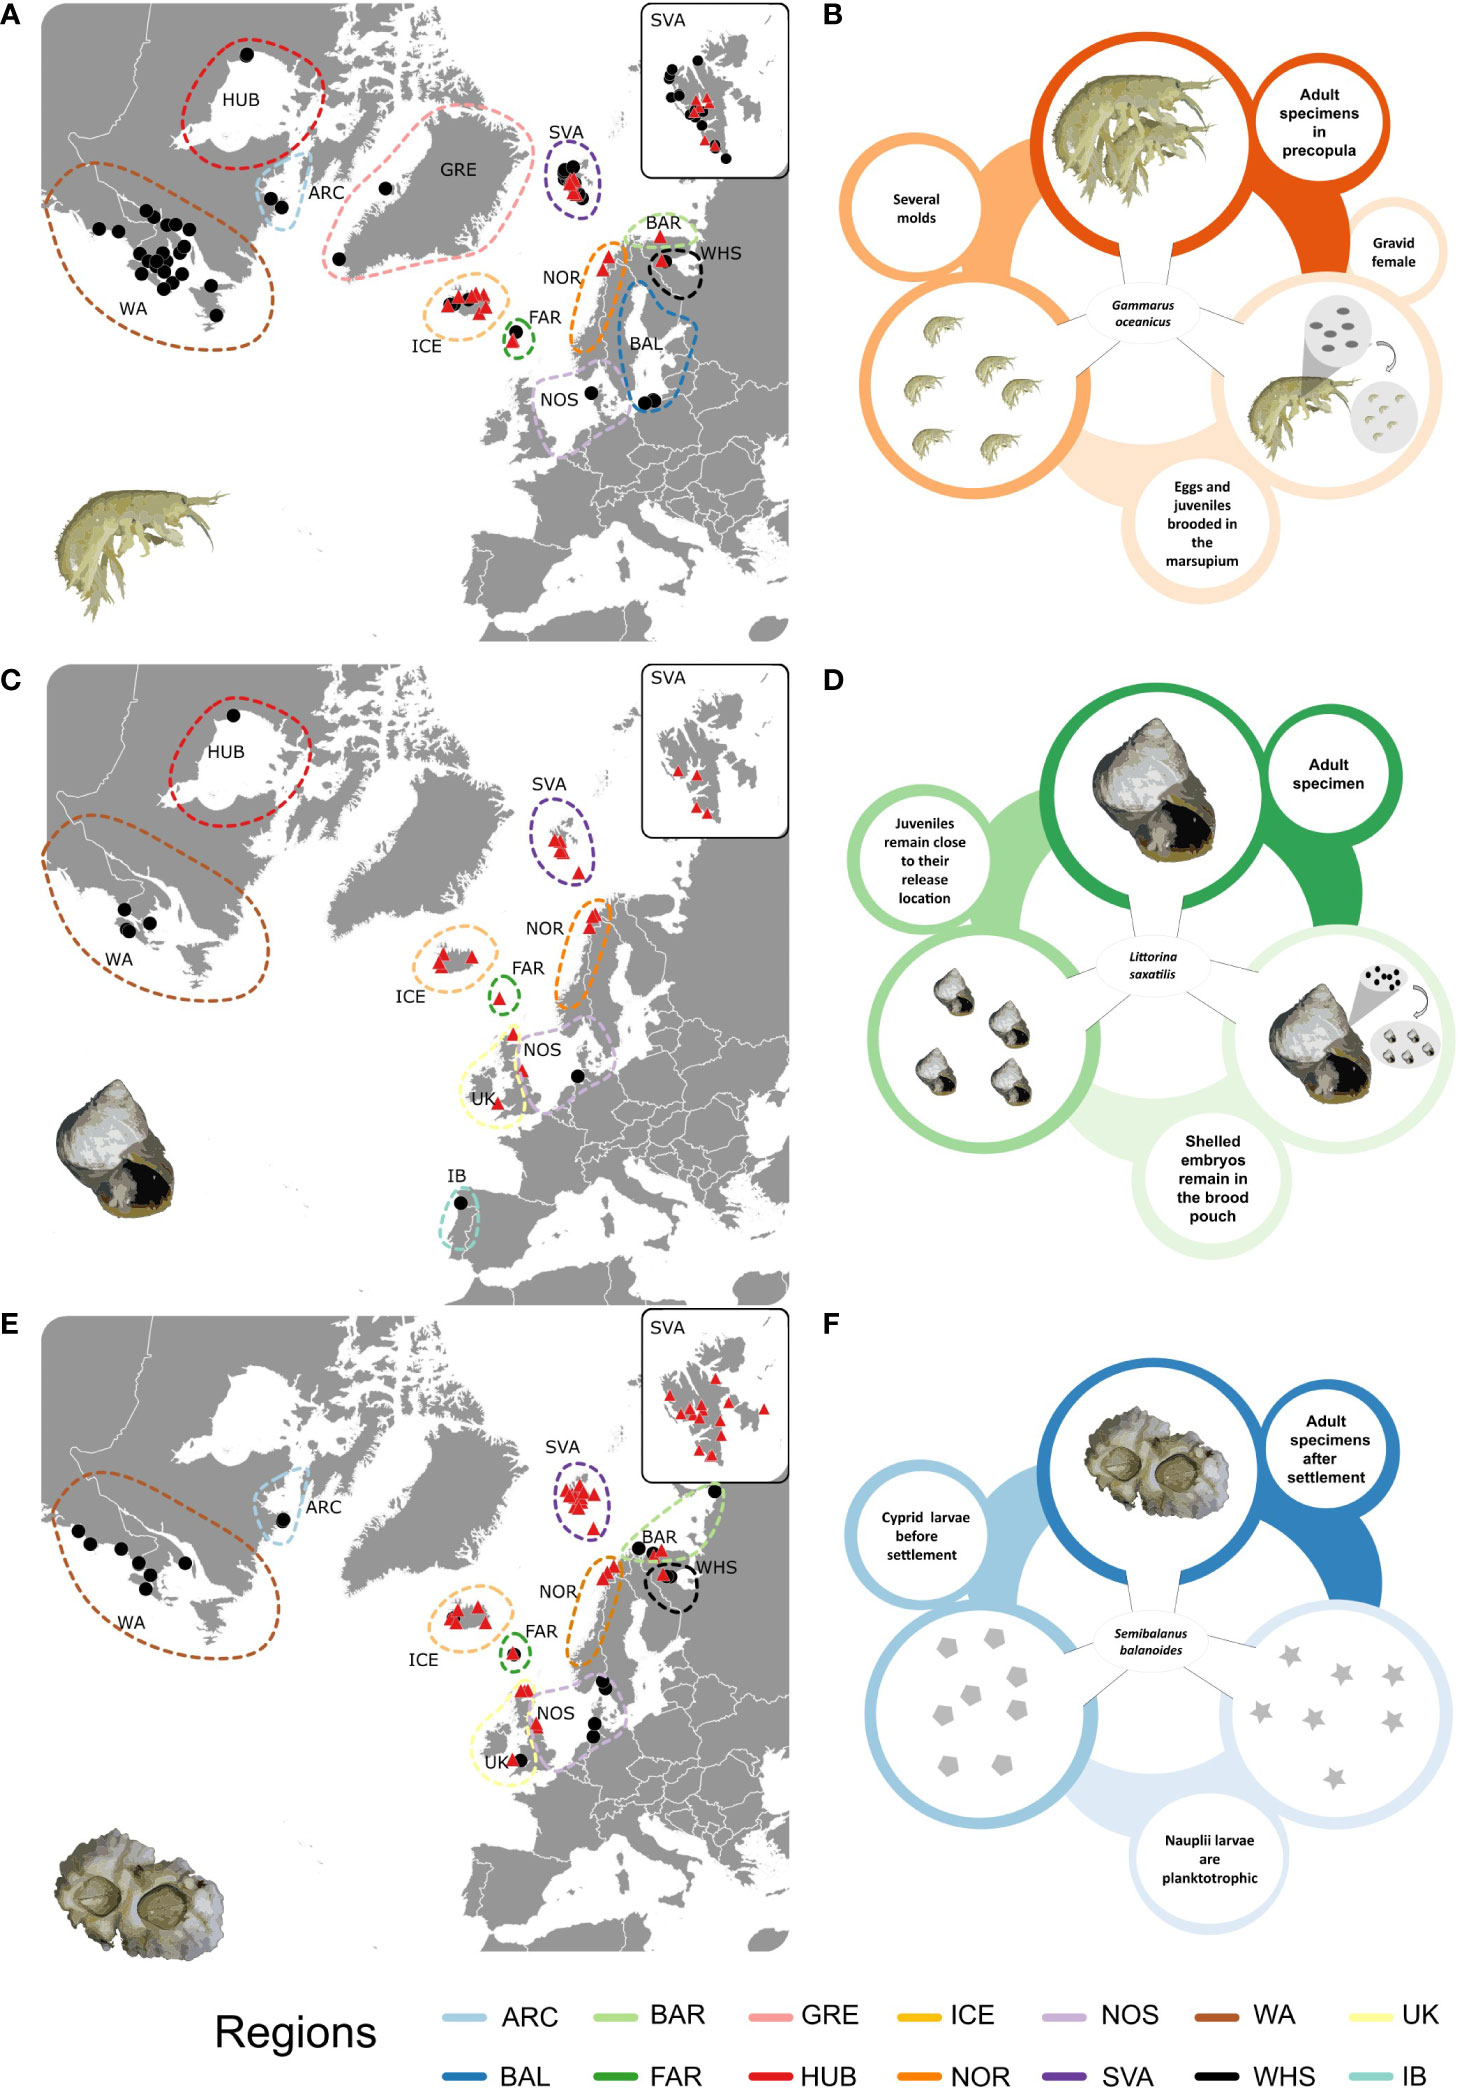
Figure 1 Geographic localisation of sampled populations and their categorisation into sampling regions for: (A) Gammarus oceanicus, (C) Littorina saxatilis and (E) Semibalanus balanoides Black dots mark populations made up from publicly available COI sequences. Red triangles mark populations sampled for this study. (ARC, Arctic Canada; BAL, Baltic Sea; BAR, Barents Sea; FAR, Faroe Islands; GRE, Greenland; HUB, Hudson Bay; ICE, Iceland; NOR, Norwegian Sea; NOS, North Sea; SVA, Svalbard Archipelago; WA, Western Atlantic; WHS, White Sea; UK, Western United Kingdom; IB, Iberian Peninsula). The charts summarize the life cycles of (B) Gammarus oceanicus, (D) Littorina saxatilis and (F) Semiblanus balanoides.
The rough periwinkle, Littorina saxatilis, unlike other congeners, does not have a free living larval stage, but a brood pouch with shelled embryos (Reid, 1996) (Figure 1D). The species is a well known example of ongoing habitat-associated speciation processes. L. saxatilis resides in highly heterogeneous habitats, where different levels of exposure to waves and predation by crabs have led to the arisal of ecotypes adapted to specific conditions. The underlying genomic architecture of the formation of these ecotypes has been attributed to variation stored on chromosomal inversions (Morales et al., 2019). The current knowledge about the biogeography of the species in the North Atlantic was established by Panova et al., 2011 and Doellman et al., 2011, both of which used mitochondrial markers in their research. Both studies revealed complex postglacial histories across the North Atlantic ocean basin, hypothesizing multiple glacial refugia both along the eastern and western Atlantic shores. A recent study by Stankowski et al. (2022) placed the complex phylogeography of L. saxatilis into a new perspective by analyzing 5.7 M variable sites along the whole genome. The study identified refugial areas along the coasts of the Iberian Peninsula, France and Wales and unexpectedly, Norway.
Contrary to the previously mentioned species, Semibalanus balanoides has multiple (6 nauplii and cypris) larval stages in its life cycle (Anderson, 1994) (Figure 1F). Depending on the thermal conditions nauplii larvae stay in the water column for several weeks (Bassindale, 1936). After six naupliar molts cyprid larvae develop, which aim to settle on suitable substrate, often several hundreds or thousands kilometers from their original release locality (Flowerdew, 1983). The species has a circumboreal distribution, and is present in both the Atlantic and Pacific oceans. S. balanoides is considered an arcto-boreal species and its distribution is mainly limited in the south by thermal limitation of its reproduction (Herrera et al., 2019). Phylogeographic studies of the species based on the mitochondrial marker revealed two main mitochondrial lineages, both with trans-atlantic distribution (Wares and Cunningham, 2001; Nunez et al., 2018). Similarly to L. saxatilis, there have been genomic studies conducted on S. balanoides in recent years, aiming to provide insight into the population structure of the species across the north Atlantic and north Pacific oceans (Nunez et al., 2018; Nunez et al., 2021). Analyses of whole genome pool-sequencing data suggested a genome-wide divergence between oceans with the lack of recent gene flow. In the northern Atlantic, the geography of genetic relationships between populations was most probably shaped by the last Pleistocene glacial cycle, resulting in the formation of two trans-atlantic lineages (Nunez et al., 2021).
Although all three species have populations residing in the Arctic, the literature lacks the characterisation of the Arctic populations in the context of their genetic connectivity with those from the North Atlantic (but see Krebes et al. (2011) with limited data on G. oceanicus). The significance of the genetic characterization of Arctic populations has increased in the face of the ongoing ‘Atlantification’ processes. There is no space within the scope of this paper to describe in detail the Atlantification and related processes, but for comprehensive review on the phenomenon see Csapó et al. (2021) and Ingvaldsen et al. (2021).
Within the frames of this study we used high numbers of both newly produced and publicly available DNA barcode sequences in an attempt to unveil the phylogeography and historical demography of three rocky intertidal marine invertebrates showing a trans-Atlantic distribution, differing in life history/dispersal mode. Particularly we aim to: 1. for the first time, genetically characterize the Arctic populations of the rough periwinkle Littorina saxatilis and the acorn barnacle Semibalanus balanoides; and 2. reveal and compare the genetic relationships between the North Atlantic and the Arctic populations of L. saxatilis, S. balanoides and G. oceanicus in the context of their differing dispersal potential. We hypothesize that: 1. the Arctic populations of these species are in expansion, probably since the end of the Last Glacial Maximum, 2. taking into account the direction of the Atlantic sea currents, the Arctic populations of all species should be genetically more similar and connected to those in the north-eastern Atlantic, 3. the distribution of genetic diversity will show stronger geographic regionalisation and more pronounced population genetic structure in the case of directly developing species showing lower dispersal potential (G. oceanicus, L. saxatilis) compared to the one with planktonic life stages (S. balanoides). Finally, we expect our study to demonstrate the predictive capacity of the widely available COI data stored in publically accessible repositories in the large-scale phylogeographic and demographic studies.
Samples for the study were collected during several sampling campaigns, operating according to the local legal rules. Sampling in Svalbard was carried out during the annual AREX cruise in 2019 and in 2021, organized by the Institute of Oceanology Polish Academy of Sciences (IO PAS). Independent sampling expeditions to the Faroe Islands and to Iceland were organized in 2018 and 2021, respectively. Sample collections in the British Isles, in Norway and in Russia were conducted during 2021 and 2022 (see sampling occasions sampled for this study marked with red triangles on Figures 1A–C). Gammarus oceanicus was collected from 21 sites across the eastern north Atlantic, including localities from the Svalbard Archipelago, Iceland, Faroe Islands, Norwegian Sea, the Barents Sea and the White Sea (Figure 1A). Specimens of G. oceanicus were not found in the samples from the British Islands. Littorina saxatilis was collected from 16 stations (Svalbard Archipelago, Iceland, Faroe Islands, Norwegian Sea, Barents Sea, North Sea, Scotland, Wales) (Figure 1C), while Semibalanus balanoides specimens had been collected from 37 (Svalbard Archipelago, Iceland, Faroe Islands, Norwegian Sea, Barents Sea, North Sea, Scotland, Wales and White Sea) sites across the eastern section of the study area (Figure 1E). Data acquired from specimens collected from these sites were supplemented with publicly available sequences from 57, 23 and 7 sampling sites for the three species respectively. (Figures 1A, C, E marked with black dots). All the individuals were collected from an intertidal zone. G. oceanicus was collected from under loose rocks with the help of a handnet. Individuals of L. saxatilis and S. balanoides were scraped from rocks with the help of a knife. Subsequently, all individuals were preserved in 96% ethanol and stored in -20°C. All the specimens used in this study are currently stored in the collection of the Department of Hydrobiology and Invertebrate Zoology at the University of Lodz in Lodz, Poland.
The animals used in this study were dissected under stereomicroscope prior to DNA extraction. In the case of Gammarus oceanicus, a few pleopods and a small amount of muscle tissue, from Littorina saxatilis a small piece of the foot tissue and from Semibalanus balanoides individuals a few cirri, were taken. Female L. saxatilis specimens were identified based on the presence of brooding pouches, which distinguish the species from other species of the genera. Whole DNA was extracted with the help of A&A Biotechnology Genomic Mini Kit or EurX GeneMATRIX Tissue DNA Purification Kit from G. oceanicus and S. balanoides, and with the modified hexadecyltrimethylammonium bromide (CTAB) method from L. saxatilis (Panova et al., 2016). A ca. a 650 bp long fragment of the mitochondrial cytochrome oxidase I (COI) was amplified using the standard LCO1490-HCO2198 primer pair (Folmer et al., 1994). The conditions of the PCR reactions were described by Hou et al. (2007). The presence and length of the amplified fragment in the PCR product was verified by agarose gel-electrophoresis. Enzymatic cleaning of the PCR products before sequencing was done using Exo-FasAP mixture (Thermo Scientific). The amplicons were sequenced with Sanger methodology using the BigDye sequencing protocol (Applied Biosystems 3730xl) by Macrogen Inc., Korea.
The dataset for each of the three species consisted of two main components. First, newly acquired COI sequences obtained from individuals collected from the eastern North Atlantic and from the Svalbard archipelago (Figures 1A, C, E) were generated with 192, 136 and 370 COI sequences for Gammarus oceanicus, Littorina saxatilis and Semibalanus balanoides, respectively. Raw sequences were trimmed, edited and aligned using Geneious 11.1.5 software (https://www.geneious.com/). The translation frame in COI sequences containing no stop codons was found. All the sequences have been uploaded to the Barcode of Life Database (BOLD). Subsequently, all publicly available COI sequences from Genbank and BOLD, with a minimum length of 450 bp, were added to each dataset (for sampling localities of publicly available sequences see black dots on Figures 1A–C, for the list of the sequence IDs of public data, see Supplementary Material). Final alignment for each species was built in Geneious 11.1.5 with the MUSCLE algorithm (Edgar, 2004). G. oceanicus sequences acquired from Krebes et al. (2011) were represented by individual haplotypes. As haplotype frequencies were indicated in the Supplementary Materials of this publication, we decided to multiply the number of these sequences according to their representation in the source dataset (see Supplementary Table 1). In all cases, localities with fewer than 5 samples were either merged with other geographically close localities, or excluded from the subsequent analyses. Sampling localities were then grouped into sampling regions based on geography. The main sampling regions were the following: Arctic (including Arctic Canada, Greenland, Hudson Bay and Svalbard), Eastern Atlantic (Barents Sea, Baltic Sea, Faroe Islands, Iberian Peninsula, North Sea, Norwegian Sea, United Kingdom (west coast), and White Sea), West Atlantic and Iceland (see Figures 1A, C, E). Sampling maps were prepared with the help of QGIS 3.22.10 Białowieża (QGIS Development Team, 2021), while polygons for marking regions were added in Inkscape 1.2 (http://www.inkscape.org) (Inkscape Project, 2020).
Haplotypes were identified in DNASp 6 (Rozas et al., 2017). To visualize the phylogenetic relationships between haplotypes, we constructed phylogenetic networks based on the Neighbor-Net algorithm (Bryant and Moulton, 2004) in SplitsTree 5 (Huson and Bryant, 2006). Additionally, minimum spanning haplonetworks were built in PopArt (Leigh and Bryant, 2015). Both methods were based on Hamming-distances (Bookstein et al., 2002). Networks were coloured based on the previously defined geographic regions (see the above section). Haplotype richness within each region was calculated with the ‘rarefy’ function of the ‘vegan’ package in R 4.2.1 (R Core Team, 2022). Rarefaction curves per region were plotted for each three species with the help of the ‘ggplot2’ package in R.
To test for the presence of population structure within the three datasets we ran the program STRUCTURE 2.3.4 (Pritchard et al., 2000). The ancestry of the individuals were inferred using the admixture model implemented in the program. For G. oceanicus, the individuals in the dataset were assigned to twelve sampling regions, for L. saxatilis the number of sampling regions was nine, while for S. balanoides it was ten (see Figures 1A, C, E). The assignments aimed to help in reaching conclusions about population structure, once the optimal number of hypothetical demographic units (k) had been chosen. In the case of all three species STRUCTURE was run from k=1 to k=5, with three independent runs for each k with 200 000 repetition and 100 000 burn in cycles. The optimal k was chosen with the ‘evannoMethodStructure’ function of the ‘pophelper’ package in R (Francis, 2017). As the strong influence of the two main lineages of G. oceanicus (Figure 2D), sharing no haplotypes, was expected to appear in the demographic structure, a subsequent run of STRUCTURE was carried out, excluding the individuals from the Western Atlantic region to uncover potentially masked substructure.
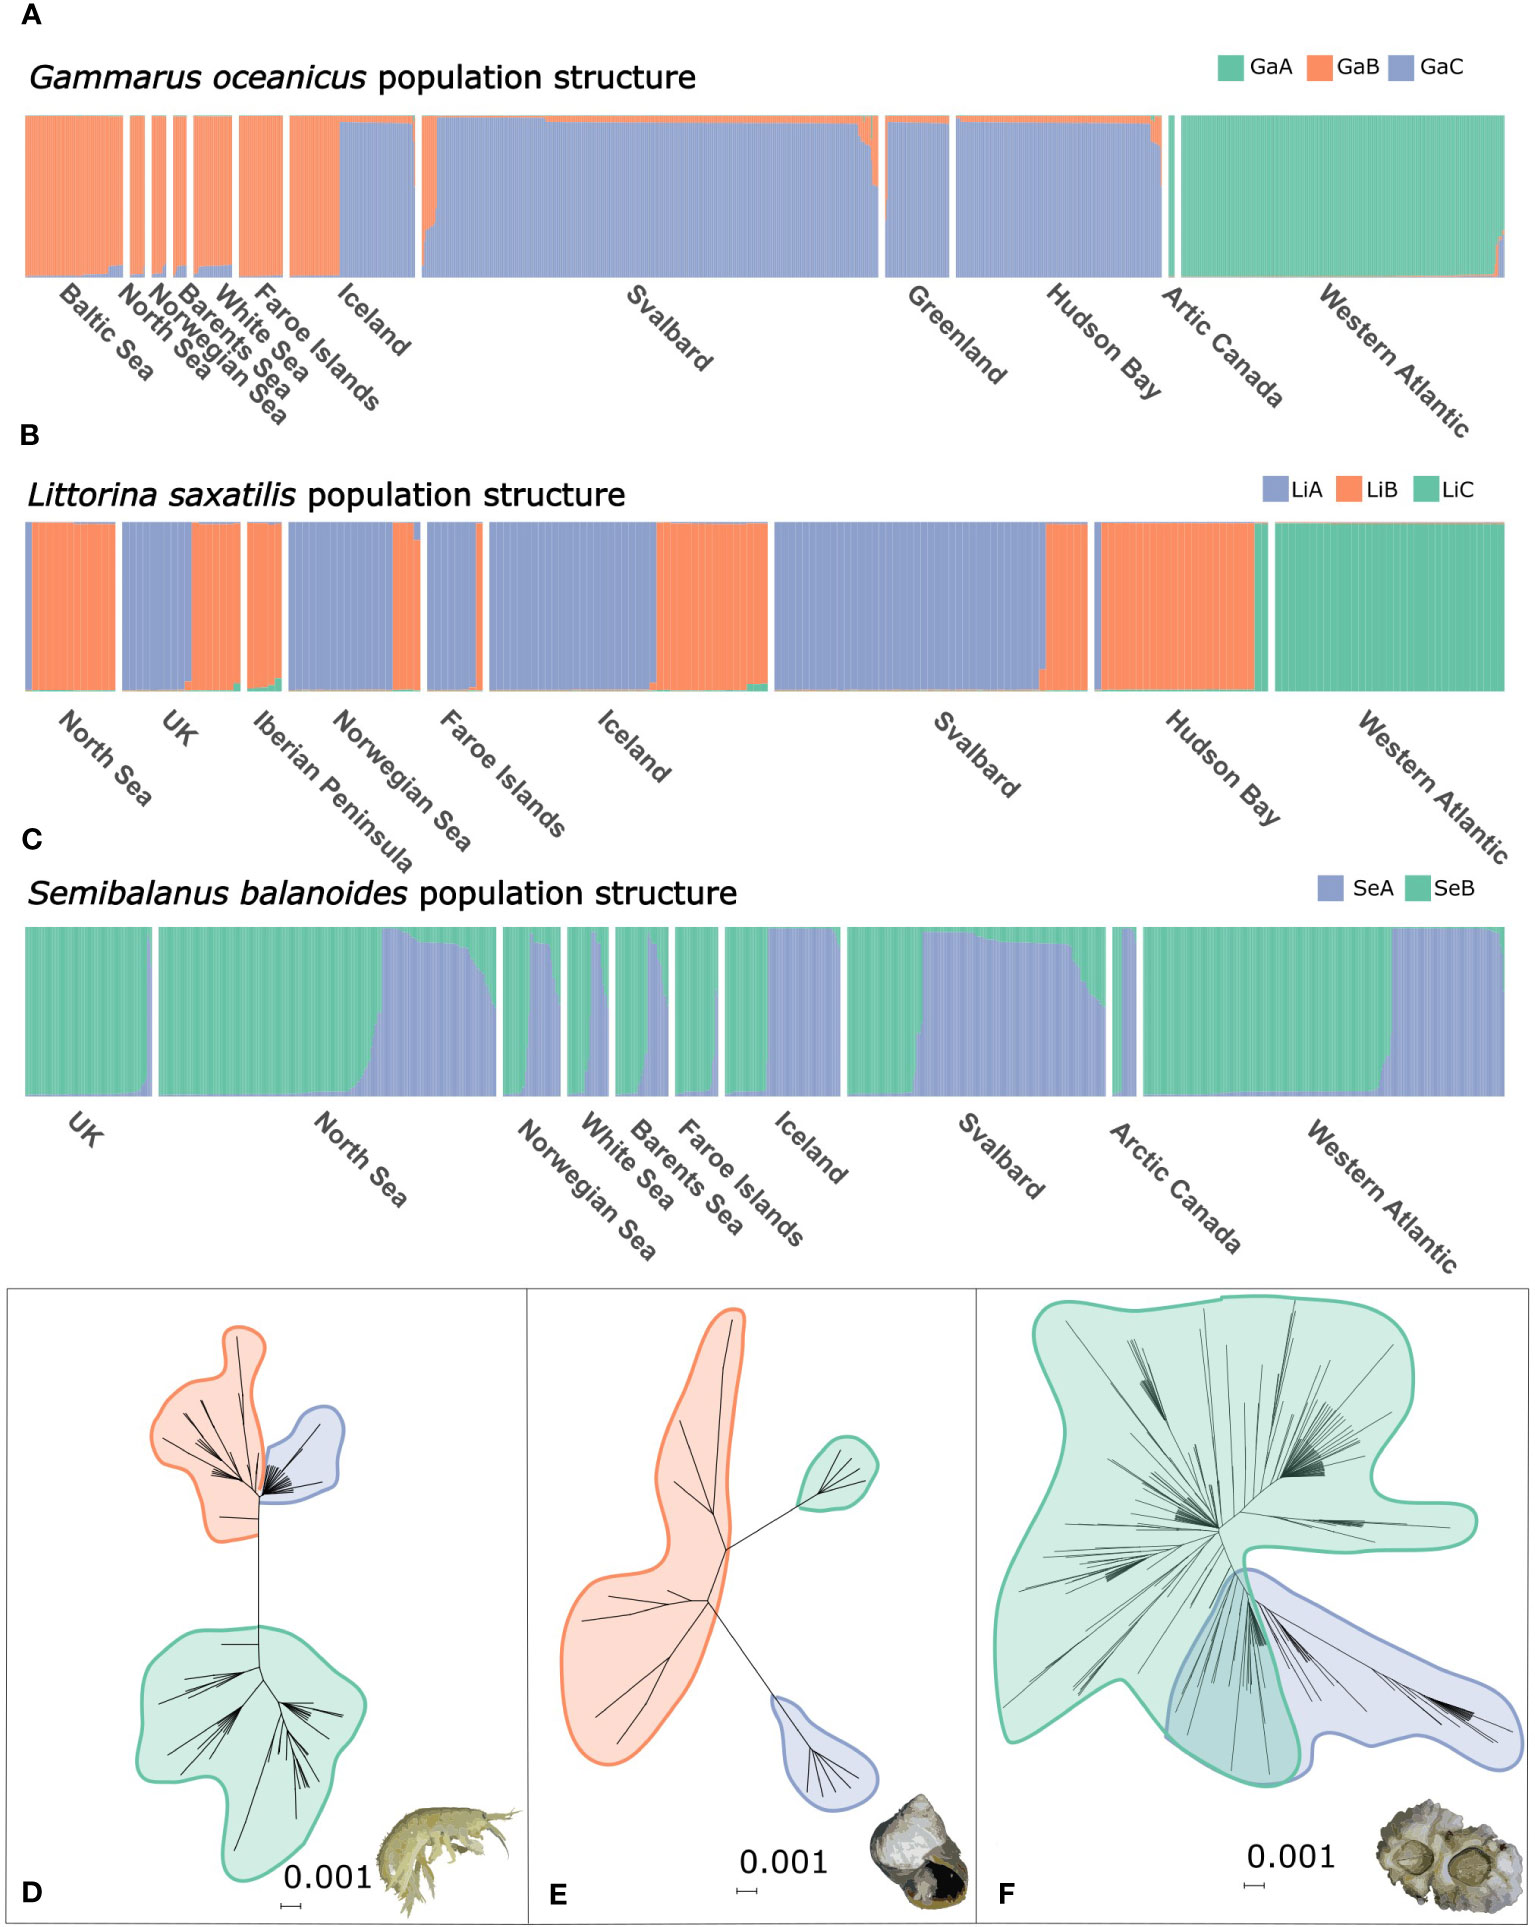
Figure 2 Population structure and phylogenetic networks of the three studied species: STRUCTURE plots of (A) Gammarus oceanicus, (B) Littorina saxatilis and (C) Semibalanus balanoides. Neighbour-joining phylogenetic networks of (D) Gammarus oceanicus, (E) Littorina saxatilis and (F) Semibalanus balanoides. Demographic groups identified by STRUCTURE are marked on the networks. GaA, GaB and GaC: Gammarus oceanicus group A, B and C respectively. LiA, LiB and LiC: Littorina saxatilis group A, B and C respectively. SeA and SeB: Semibalanus balanoides group A and B respectively.
In the case of L. saxatilis data used for the second STRUCTURE run excluded all the individuals from the Western Atlantic and some from the Hudson Bay (those which form LiC (Figure 2E). Finally, STRUCTURE plots were prepared by grouping individual ancestry bars by regions with the help of ‘pophelper’ in R (Francis, 2017).
Another approach was used to visualize the genetic relationship between populations of each species. A population was defined as a sampling site, where the number of individuals were at least n=5. Subsequently, we used Arlequin 3.5 (Excoffier and Lischer, 2010) to acquire the matrix of population pairwise Fst. Then, to find the optimal number of dimensions for illustrating the genetic connectivity pattern between populations, non-metric multidimensional scaling (NMDS) was performed using the metaMDS function of the ‘vegan’ package in R (Oksanen et al., 2023). The Bray-Curtis distance method (Bray and Curtis, 1957) was used with a maximum number of iterations of 250 and with the number of dimensions from k=1 to k=5. Stress values were assessed for each k. As k>1 values were all below 0.2, we decided to plot NMDS values of the k=2 run for each species, to simplify figures. Two-dimensional NMDS figures were prepared with the help of the ‘ggplot2’ package in R (Wickham, 2016). Additionally we prepared 3-dimensional figures to showcase between-population relationships with even lower stress levels. The k=3 three-dimensional NMDS figures were prepared using the ‘plotly’ package in R (Sievert, 2020).
Demographic analyses were conducted in order to reveal the population histories of each species. Mismatch distribution analyses for testing for the presence of demographic and spatial expansion, as well as Tajima’s D and Fu’s F neutrality tests were run in Arlequin 3.5. To reconstruct the historical changes of effective population size of panmictic lineages identified by the STRUCTURE analysis, the Extended Bayesian Skyline Plot (eBSP) analysis was run in BEAST 2.5 (Bouckaert et al., 2019), with the HKY model of evolution. The runs were each time inspected in Tracer 1.7 (Rambaut et al., 2018) to check if the ESS values were sufficiently high. Depending on those results the analysis was based on the 10 million iterations long runs in the case of Littorina and 20-30 million iterations long runs in case of Gammarus and Semibalanus. The runs were sampled every 1000 iterations. The molecular clock rate was estimated according to the results by Loeza-Quintana et al. (2019), who provided the values for Arctic invertebrates, thus the rate for Littorina amounted 0.032 per million years and the rate for crustaceans was 0.051 per million years. The plots were generated in R (R Core Team, 2019).
Together with the publicly available data, the final sizes of the datasets were 1119 (205 own, 914 public) sequences for G. oceanicus L. saxatilis 200 sequences (136 own, 64 public) and 884 sequences (370 own, 514 public) for S. balanoides. The final length of the alignments were 481 bp, 486 bp and 551 bp for G. oceanicus, L.saxatilis and S. balanoides, respectively. For the complete list of samples with sampling localities see (BOLD DOI provided after acceptance).
We identified 98 haplotypes of G. oceanicus in our dataset. There was a well pronounced genetic split in our dataset between samples from the west Atlantic coast and the eastern Atlantic-Arctic. The topology of the haplotype network in the west Atlantic is intricate and the level of divergence between haplotypes is generally higher (Supplementary Figure 1A). The eastern side of the distribution shows less complex haplotype relations, while at the same time certain regions hold an increased number of individuals belonging to private haplotypes (Faroe Islands, Baltic Sea, Norwegian Sea). A prominent starlike topology is apparent, the star including Arctic regions (Greenland, Hudson Bay, Svalbard) and Iceland (Supplementary Figure 1A). When considering regions, the Western Atlantic showed the steepest increase in haplotype richness, followed by the Norwegian and the Baltic Sea (Supplementary Figure 2A).
We identified 23 haplotypes in our L. saxatilis dataset. We need to keep in mind that this dataset consists of relatively few individuals, compared to the previous two species. Despite the relatively low number of haplotypes, we could identify three haplogroups. One group contains individuals only from the western Atlantic and Hudson Bay, while the other three include individuals from wide geographic ranges, even sharing haplotypes (Supplementary Figure 1B). Generally, the haplotype richness was higher in the Iberian Peninsula, the North Sea, Iceland, the British Isles and in the Norwegian Sea if compared to the Arctic localities (Hudson Bay and Svalbard), the Faroe Islands and the Western Atlantic coasts (Supplementary Figure 2B).
As many as 327 haplotypes were identified for S. balanoides. Both the phylogenetic network (Figure 2F) and haplotype network (Supplementary Figure 1C) showed a highly complex relationship between haplotypes, with the lack of clear geographical association of any of the branches. The slope of haplotype richness curves were steep in all of the studied regions, except for Iceland (Supplementary Figure 2C).
The STRUCTURE analysis including the whole G. oceanicus dataset showed best support for the scenario with two demographic units (k=2). Out of the substructure runs excluding samples from the west Atlantic, again, the scenario with two demographic units (k=2) had the best support. The first one included samples from the Faroe Islands, the Baltic Sea, the Barents Sea, the White Sea and the North Sea (GaB), while the other was composed of samples from Svalbard, Greenland and the Hudson Bay (GaC). Iceland is inhabited by individuals having ancestry from either the Eastern Atlantic (GaB) or the Arctic (GaC). The western Atlantic samples together with one population from Arctic Canada formed the third demographic group (GaA) (Figure 2A). The NMDS plot of Fst values recovered the clear distinction between Western Atlantic and Eastern Atlantic-Arctic G. oceanicus haplogroups, lineages and demographic units. The geographic regionalisation of genetic connectivity between populations is well-pronounced, with Iceland being the only region with populations that show quite a high level of differentiation between each other. Populations of the Faroe Islands appear to be relatively differentiated from the other eastern Atlantic populations (Figure 3A). The dissimilarity of these populations from others attributed by STRUCTURE to the same demographic unit is even more apparent on the three-dimensional NMDS plot (10.6084/m9.figshare.23652513).
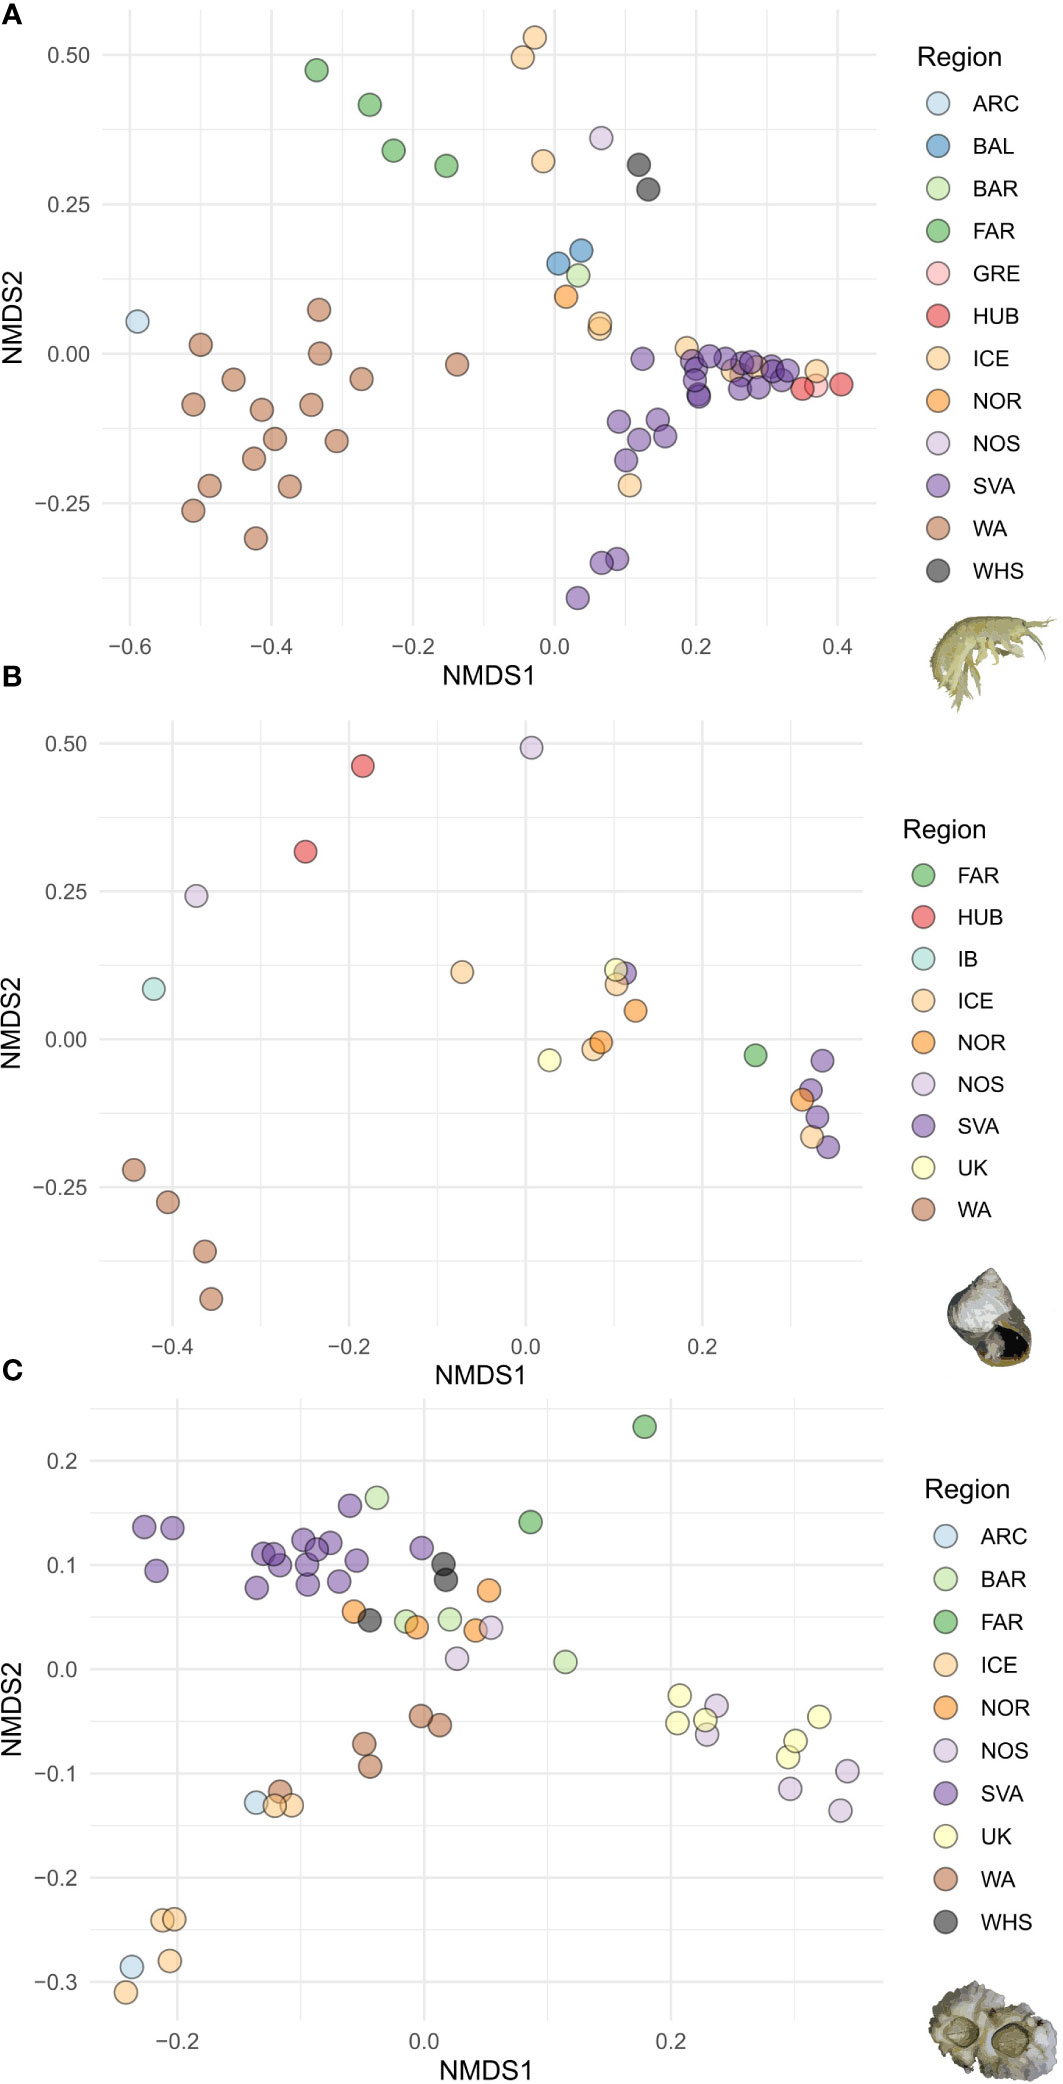
Figure 3 Non-metric multidimensional scaling (NMDS) plots of between population Fst values of (A) Gammarus oceanicus, (B) Littorina saxatilis and (C) Semibalanus balanoides populations. Colors correspond with sampling regions defined on Figure 1.
Out of the three species, L. saxatilis showed the most complex pattern of genetic connectivity between populations. The first STRUCTURE run on the whole dataset concluded k=2 to be the optimal number of groups. Excluding individuals from the Western Atlantic coast, which formed a clearly distinct unit, samples from all other geographic regions were attributed to two demographic units (Figure 2B). Similarly, on the 2-dimensional NMDS plot the Western Atlantic populations are grouped together and are clearly distinguishable from all the others. Populations of the Hudson Bay, the North Sea (England, Germany) and the Iberian Peninsula (Spain) were positioned very remotely. The rest of the eastern Atlantic populations formed two groups. One included populations from Scotland, Wales, Iceland, Norway and the Bjornoya Island, while the second contained the rest of the Svalbard populations, and one population from each, Iceland, Norway and the Faroe Islands (Figure 3B).
For Semibalanus balanoides, the STRUCTURE analysis provided best support for the presence of two demographic units (k=2) (SeA, SeB), however, no obvious geographical partitioning between the two units could be observed as both units are present in all of the studied sampling regions. Only the samples from the British Isles and the Faroes were composed almost exclusively of representatives of SeA (Figure 2C).
S. balanoides populations within sampling regions were found to be genetically less differentiated within regions than among the regions. The Iceland populations showed higher genetic proximity to the Western Atlantic than to the Eastern Atlantic. Similarly, as in the case of G. oceanicus, the Faroe Island populations of. S. balanoides were genetically differentiated from all the others (Figure 3C).
For G. oceanicus, the results of mismatch analyses do not reject the assumption of both spatial and demographic population expansion in either of the groups (GaA, GaB, GaC) (Supplementary Table 2). The scenario of recent population expansion is further supported by the significantly negative values of Tajima’s D and Fu’s F neutrality tests for both clades. The EBSP analysis detected the expansion of effective population size ca. 8000 years ago for GaB (Figure 4B) and 2500 years ago for GaC (Figure 4C).
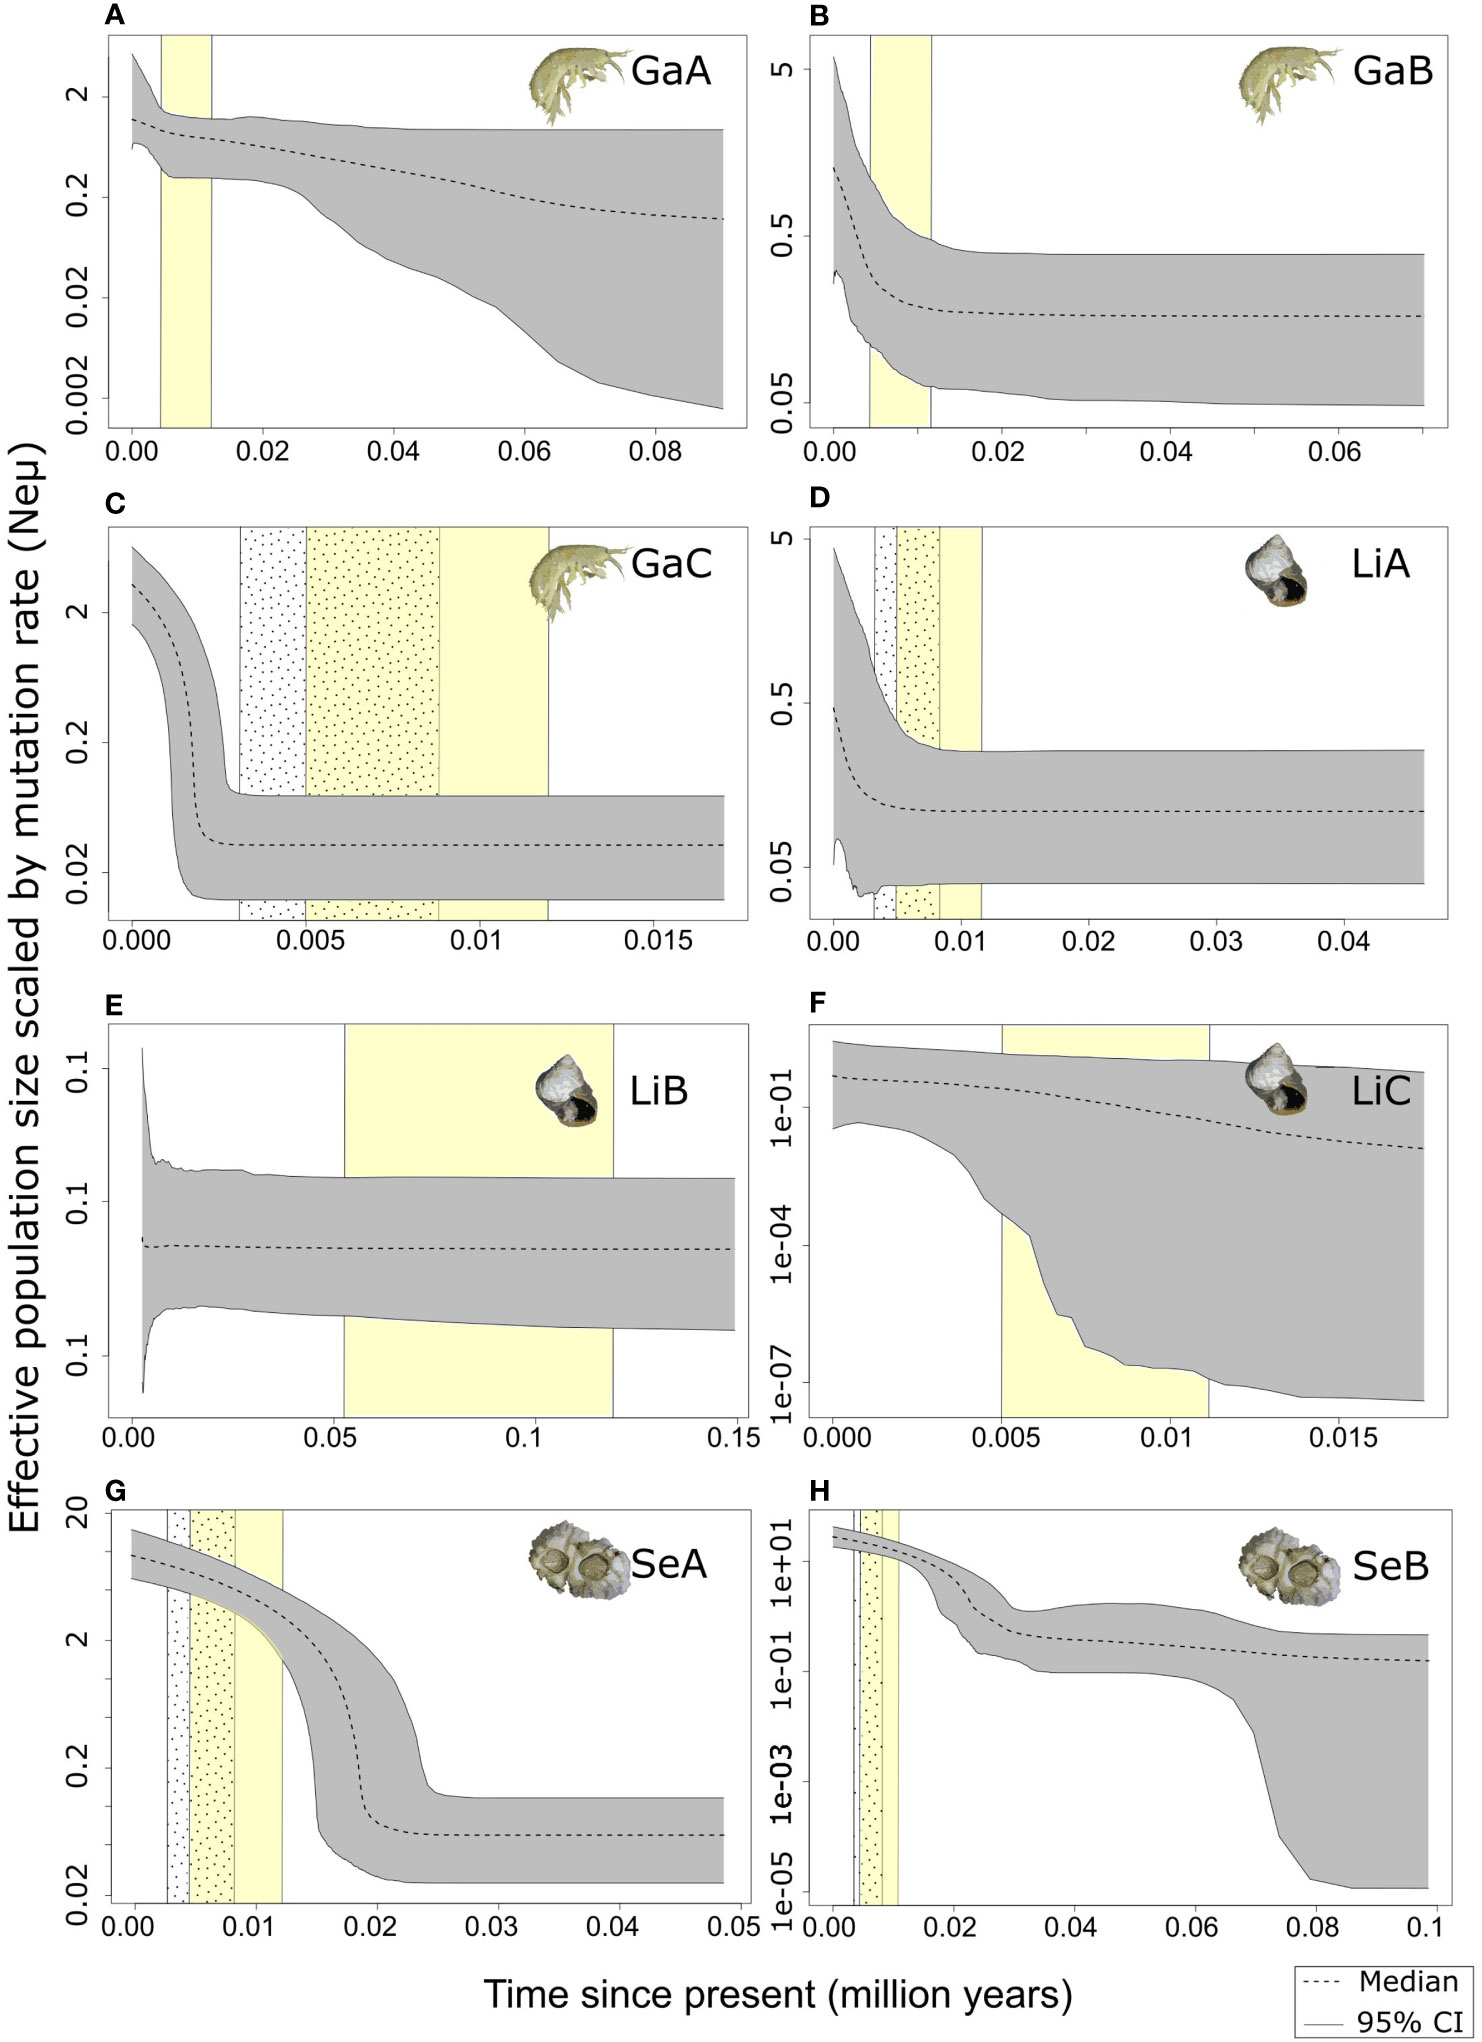
Figure 4 Extended Bayesian Skyline plots of all demographic groups defined by STRUCTURE for the three studied species. (A): Gammrus oceanicus group GaA, (B): Gammrus oceanicus group GaB, (C): Gammrus oceanicus group GaC, (D): Littorina saxatilis group LiA, (E): Littorina saxatilis group LiB, (F): Littorina saxatilis group LiC, (G): Semibalanus balanoides group SeA, (H): Semibalanus balanoides group SeA. Period of the global Holocene Thermal Optimum (HTO) (ca. 11500-5000 BP) is marked with yellow on all plots. Dotted area marks the period of cold climatic oscillations during the HTO, which affected mainly the Arctic (after Hald et al., 2007). These periods are only indicated in the case of groups, which include individuals from the Arctic regions.
Two out of the three L. saxatilis STRUCTURE groups (LiB and LiC) did not show any signs of change in the effective population size (Figures 4E, F). Based on our results the effective population size of group LiA started to grow ca. 2500-3000 years ago (Figure 4D).
For the S. balanoides dataset our analyses detected two demographic groups. Group SeA population size was steady through time, with a slight increase starting ca. 25-30 000 years ago (Figure 4G). On the other hand, group SeB presented a sharp increase of population size starting from ca. 20 000 years ago (Figure 4H).
Our study with the help of publicly and freely available, DNA barcode data gives an insight into the postglacial history and the subsequent Arctic expansion of three boreal invertebrate species: Gammarus oceanicus, Littorina saxatilis and Semibalanus balanoides. Here, we provide fundamental information on the genetic composition, diversity and population structure of these species in the North Atlantic and Arctic regions.
In the case of G. oceanicus Svalbard populations were genetically closest to other Arctic populations, and to Iceland: together with Greenland and Hudson Bay forming an Arctic group GaC (Figure 2A). This is the first time such an Arctic demographic unit has been identified for this species. The group GaC has started to expand ca. 2500 years ago (Figure 4C). While the Holocene climate in the North Atlantic was relatively stable, the Arctic experienced cooler periods, one of which occurred ca. 5500-3000 years ago (Hald et al., 2007) (Figure 4). The same study by Hald et al. (2007) also revealed that the south-to-north sea surface temperature gradient along the North Sea-Barents Sea-Svalbard transect reached its maximum of ca. 12°C around 5000 years BP. It is possible that the expansion of the Arctic lineage of G. oceanicus started only after this period. This finding is in line with this study’s hypothesis stating that the species has undergone postglacial population expansion in the Arctic. Our results suggest the possibility that Iceland might have acted as a stepping stone for the colonization of the Arctic from the eastern Atlantic. Such sequence of events are in alignment with previous studies discussing the potential North Atlantic glacial refugia during the LGM pointing to mid Atlantic islands (Maggs et al., 2008; Faurby et al., 2011). The study by Krebes et al. (2011) hypothesized the existence of a glacial refugium on the Faroe Islands. The high number (35) of individuals belonging to private haplotypes and the high genetic dissimilarity of the Faroe Islands populations from the rest of the Eastern Atlantic (Figure 3A) let us conclude that although there might have been a refugium for the species in this area, the subsequent recolonisation of the eastern Atlantic potentially did not start from this region. The Faroe Islands not only lie between deep oceanic trenches (deeper than 1000 meters), but are also surrounded by circular current systems (Hansen and Østerhus, 2000; Larsen et al., 2008). These particular oceanographic and bathymetric conditions around the islands have also contributed to the formation of isolated populations of other marine species, namely the European flounder, Platichthys flesus L. (Hemmer-Hansen et al., 2007) and the veined squid, Loligo forbesi (Shaw et al., 1999). The high number of haplotypes and their complex genetic relations on both the eastern and western Atlantic point to long population history for the species. Contradicting the hypothesis proposed by early studies concerning the complete loss of rocky intertidal habitats in the area during the last glacial maximum (LGM) (Ingolfsson, 1992; Waltari and Hickerson, 2013), the West Atlantic coast served as a marine glacial refugia for a limited number of intertidal species e.g. the fucoid seaweed, Ascophyllum nodosum (Olsen et al., 2010) and the red algae Chondrus crispus and Palmaria palmata (Li et al., 2016).
Similarly, to G. oceanicus, Svalbard L. saxatilis populations seem to be genetically close to other Eastern Atlantic populations (mainly Iceland and Norway), but do not share haplotypes with the West Atlantic ones (Figure 3B, Supplementary Figure 1B). This finding strongly argues for the eastern origin of these populations. Our demographic analyses showed a steep increase in the effective population size of the L. saxatilis group that includes the majority of the Svalbard individuals (LiA). The expansion was dated from ca. 3000 years ago (Figure 4D). The dating of the Arctic expansion is very similar to that of G. oceanicus. This could indicate that similar, climate related factors could have operated in first, restricting and later aiding the northern expansion of these two species. Based on current distribution data, the preferred mean temperature of G. oceanicus is around 9.3, while for L. saxatilis it is 10.9 degrees Celsius (Kaschner et al., 2010). Contrary to G. oceanicus, L. saxatilis presented mixing of different ancestries within the same region. In the case of a species like L. saxatilis with limited large-scale natural dispersal (absence of pelagic larval stage), such a pattern could indicate the aid of recent anthropogenic factors in the mixing of demographic groups between distant regions. Particularly the Hudson Bay is an interesting example, where each L. saxatilis group is present as a distinct haplotype. One of these three haplotypes is private to the Hudson Bay, while the other two are shared between the Hudson Bay and other regions (Supplementary Figure 1B). As the area is a sheltered Arctic bay, it is possible that the independent introduction of the distant haplotypes happened via human aid. This scenario seems even more probable considering that all L. saxatilis samples used in this study were collected in the vicinity of Churchill, a major Arctic port, connected to the Arctic Bridge among many other shipping routes. Human introduced populations of L. saxatilis have been described already in the Mediterranean Sea and along the shores of South Africa (Reid, 1996), thus it is not unlikely for such introduction to happen in other regions as well. Why G. oceanicus does not show a similar pattern is up for debate. Species of the genus have been described to be transported in the ballast of ships (Pienimäki and Leppäkoski, 2004; Adebayo et al., 2014). At the same time the possibility of biofouling as a vector could be much more limited for this species. We hypothesize that the difference in settling probability and survival rate could be another key motif. G. oceanicus is a mobile, omnivorous species and needs a highly structured microenvironment to survive, hide and search for food. It can pose challenges to find a suitable habitat upon introduction to a new environment. The fundamentals of the North Atlantic phylogeography of Littorina saxatilis have been laid down by previous studies using the mitochondrial cytochrome b coding sequence as a marker (Doellman et al., 2011; Panova et al., 2011). Due to these studies utilizing a different mitochondrial marker, we could not include those sequences in our analyses. Nevertheless, the comparison of the conclusions between our study using COI and that using mitochondrial markers is possible. We identified regions with high haplotype richness (Supplementary Figure 2B) on the east side of the Atlantic. These areas (namely the British Isles, the North Sea and the Iberian Peninsula), could have served as glacial refugia for the species in the past, like they did for other marine taxa e.g. the European stalked barnacle, Pollicipes pollicipes (Campo et al., 2010), the marine snail Nassarius nitidus (Albaina et al., 2012), and the brown seaweed, Fucus serratus (Hoarau et al., 2007) among many others (Maggs et al., 2008).
The Svalbard populations of S. balanoides formed a somewhat distant group, only a few localities exhibiting genetic construction similar to Norwegian, Barents and White Sea populations (Figure 3C). The potential Scandinavian and/or Icelandic origin of the Svalbard populations is strongly supported by the ocean-current pattern of the region. Atlantic water enters the Arctic Ocean using the Nordic Seas as a gateway. The main branch flows along the Norwegian slope (Norwegian Current) and through the Barents Sea to reach the Western coasts of Svalbard (West Spitsbergen Current) (Woodgate et al., 2001). Additionally, a smaller branch of the same system forms the North Icelandic Irminger Current, which rejoins the North Atlantic Current after following the Icelandic shelf break from the north (Semper et al., 2022). There was no obvious Arctic group detected for this species, as both group SeA and SeB were present in all studied Arctic regions. The increase of the effective population size of group SeA starting from ca. 20 000 years ago (Figure 4G) indicates that population expansion potentially started already during the LGM, probably from one or more glacial refugia. At the same time we detected the presence of multiple starlike topologies in the reconstructed haplotype network (Supplementary Figure 1C), which indicates several population expansion events in these geographic areas, including Svalbard. Although we can explain this result with population expansion of this particular lineage in southern refugia, we also need to be aware that estimation of population size growth of high-latitude species dated during or before the LGM might be the result of not adequately chosen mutation rate for the species (Grant, 2015).
In contrast to the direct developing species, S. balanoides presented a much more homogenous population structure. S. balanoides with the help of ocean currents and highly dispersive larvae could potentially reach very remote locations. The high dispersal potential, propagule pressure, and gregarious settlement of the species might make sudden population expansions at distant areas possible, when environmental conditions allow (Mieszkowska et al., 2014). The species has a potential to be a pioneer in changing habitats during and after the LGM. The generally high proportion of shared ancestral polymorphism across the Atlantic basin makes it a difficult task to confidently identify glacial refugia for the species. Similarly to previous studies (Wares and Cunningham, 2001), our results do not support the scenario of postglacial recolonisation of western Atlantic shores from the east. While results from the previous two species suggested Iceland as a potential mid-Atlantic refugium/stepping stone for the postglacial recolonisation of the eastern Atlantic and Arctic, Icelandic populations of S. balanoides seem to exhibit genetic proximity to those inhabiting the western- Atlantic and Arctic (Figure 3C). Such a pattern has already been shown with genomic pool sequencing data (Nunez et al., 2018). The overall high haplotype richness suggests a long history of multiple colonization events on both sides of the Atlantic Ocean. The geographic regionalisation of genetic differences between populations (Figure 3C) might seem surprising amid the apparent panmixia. Sites geographically close to one another present populations with similar haplotype frequencies. This is possibly the reflection of several regional founder effects, but at the same time due to the high mobility of larvae, which can have an effect of diffusing this signal.
Although the phylogeography of all three species has been studied before, this is the first time to investigate Svalbard populations in relation with their North Atlantic phylogeographic history. In particular, Svalbard populations of Littorina saxatilis and Semibalanus balanoides have not been genetically characterized before. Our study showcased how differing dispersal potential of the species arising from their life history traits (brooded or pelagic larvae), are reflected in their population structure. In the case of both directly developing species (G. oceanicus and L. saxatilis) we detected a clear decrease of haplotype richness towards higher latitude regions. We did not observe such a pattern for the highly dispersive S. balanoides, however due to the high proportion of shared ancestral polymorphism across the Atlantic basin might make it difficult to uncover such a signal. We conclude that, in accordance with our initial hypothesis, demographic groups within each species containing the majority of the Arctic individuals show signatures of population expansion in the past 20 000 years. Although population expansion is the most likely interpretation of our results, we need to keep in mind that there can be alternative explanations of these patterns, such as positive selection which is often overlooked. All three species show postglacial population expansion in the studied Arctic regions, however we have not found any evidence indicating that these expansion events were the result of the contemporary Atlantification processes. Observing these findings, one needs to keep in mind the limitations of single marker population genetic studies. However, our study shows that the mitochondrial COI, used as a standard barcoding marker in animals, is able to capture the difference in the population structure of species with different dispersal potential. To more confidently infer the times of population expansion, it is recommended to conduct studies utilizing multiple markers or whole genome data.
The original contributions presented in the study are publicly available. This data can be found here: http://www.boldsystems.org/index.php/Public_SearchTerms?query=DS-HCLIT, http://www.boldsystems.org/index.php/Public_SearchTerms?query=DS-HCSEM, http://www.boldsystems.org/index.php/Public_SearchTerms?query=DS-HCATL. DNA barcode data has been reposited in three datasets in the Barcode of Life Database (BOLD).
Ethical approval was not required for the studies on animals in accordance with the local legislation and institutional requirements because only commercially available established cell lines were used.
HC: Conceptualization, Investigation, Data curation, Formal analysis, Visualization, Writing – original draft, Writing – review & editing. AJ: Formal analysis, Investigation, Writing – original draft, Writing – review & editing. JW: Conceptualization, Resources, Writing – review & editing. NM: Investigation, Writing – review & editing. MGa: Investigation, Writing – review & editing. ID: Investigation, Writing – review & editing. PR: Investigation, Writing – review & editing. MGr: Conceptualization, Writing – original draft, Resources, Supervision, Writing – review & editing.
The author(s) declare financial support was received for the research, authorship, and/or publication of this article. Sampling expeditions and molecular processing of samples were funded fro two projects from the Polish National Science Centre: DAINA 1 2017/27/L/NZ8/03331 and PRELUDIUM 18 2019/35/N/NZ8/04023.
We would like to thank all of the employees and students of the Institute of Oceanology Polish Academy of Sciences, who helped with sample collection. We are grateful to Dr. Petr Strelkov from the Saint Petersburg State University for providing samples for this study.
The authors declare that the research was conducted in the absence of any commercial or financial relationships that could be construed as a potential conflict of interest.
The author(s) declared that they were an editorial board member of Frontiers, at the time of submission. This had no impact on the peer review process and the final decision.
All claims expressed in this article are solely those of the authors and do not necessarily represent those of their affiliated organizations, or those of the publisher, the editors and the reviewers. Any product that may be evaluated in this article, or claim that may be made by its manufacturer, is not guaranteed or endorsed by the publisher.
The Supplementary Material for this article can be found online at: https://www.frontiersin.org/articles/10.3389/fmars.2023.1275320/full#supplementary-material
Additionally, 3-dimentional graphsh have already been published and available on figshare under the followin doi numbers: https://doi.org/10.6084/m9.figshare.23807838.v1, https://doi.org/10.6084/m9.figshare.23695239.v1, https://doi.org/10.6084/m9.figshare.23652513.v1.
Supplementary Figure 1 | Minimum spanning haplonetworks of (A) Gammarus oceanicus, (B) Littorina saxatilis and (C) Semibalanus balanoides. Colors correspond with sampling regions defined on . On G. oceanicus and L. saxatilis networks, demographic groups identified by STRUCTURE are indicated.
Supplementary Figure 2 | Haplotype richness curves per sampling region for (A) Gammarus oceanicus, (B) Littorina saxatilis and (C) Semibalanus balanoides. Colors correspond with sampling regions defined on .
Adebayo A. A., Zhan A., Bailey S. A., MacIsaac H. J. (2014). Domestic ships as a potential pathway of nonindigenous species from the Saint Lawrence River to the Great Lakes. Biol. Invasions 16 (4), 793–801. doi: 10.1007/s10530-013-0537-5
Albaina N., Olsen J. L., Couceiro L., Ruiz J. M., Barreiro R. (2012). Recent history of the European Nassarius nitidus (Gastropoda): phylogeographic evidence of glacial refugia and colonization pathways. Mar Biol 159 (9), 1871–1884. doi: 10.1007/s00227-012-1975-9
Anderson D. T. (1994). Barnacles Structure, Function, Developmen and Evolution (Geological Magazine, Cambridge University Press:Chapman & Hall).
Arranz V., Thakur V., Lavery S. D. (2021). Demographic history, not larval dispersal potential, explains differences in population structure of two New Zealand intertidal species. Mar. Biol. 168 (7), 105. doi: 10.1007/s00227-021-03891-2
Bassindale R. (1936). The developmental stages of three English barnacles, Balanus balanoides (Linn.), Chthamalus stellatus (Poli), and Verruca stroemia (O. F. Müller). Proc. Zool Soc. Lond 1, 57–74.
Blakeslee A. M. H., Whitman Miller A., Ruiz G. M., Johannesson K., André C., Panova M., et al. (2021). Population structure and phylogeography of two North Atlantic Littorina species with contrasting larval development. Mar. Biol. 168 (7), 117. doi: 10.1007/s00227-021-03918-8
Bookstein A., Kulyukin V. A., Raita T. (2002). Generalized hamming distance. Inf. Retrieval 74 (1), 21–45. http://www.jstor.org/stable/2664376. doi: 10.1023/A:1020499411651
Bouckaert R., Vaughan T. G., Barido-Sottani J., Duchêne S., Fourment M., Gavryushkina A., et al. (2019). BEAST 2.5: An advanced software platform for Bayesian evolutionary analysis. PLoS Comput. Biol. 15 (4), e1006650. doi: 10.1371/journal.pcbi.1006650. Edited by M. Pertea.
Bray J. R., Curtis J. T. (1957). An ordination of the upland forest communities of southern Wisconsin. Ecol. Monogr. 27 (4), 325–349. doi: 10.2307/1942268
Bryant D., Moulton V. (2004). Neighbor-net: an agglomerative method for the construction of phylogenetic networks. Mol. Biol. Evol. 21 (2), 255–265. doi: 10.1093/molbev/msh018
Campo D., Molares J., Garcia L., Fernandez-Rueda P., Garcia-Gonzalez C., Garcia-Vazquez E., et al. (2010). Phylogeography of the European stalked barnacle (Pollicipes pollicipes): identification of glacial refugia. Mar. Biol. 157 (1), 147–156. doi: 10.1007/s00227-009-1305-z
Chan F. T., Stanislawczyk K., Sneekes A. C., Dvoretsky A., Gollasch S., Minchin D., et al. (2019). Climate change opens new frontiers for marine species in the Arctic: Current trends and future invasion risks. Glob. Chang. Biol. 25 (1), 25–38. doi: 10.1111/gcb.14469
Csapó H. K., Grabowski M., Węsławski J. M. (2021). Coming home - Boreal ecosystem claims Atlantic sector of the Arctic. Sci. Total Environ. 771, 144817. doi: 10.1016/j.scitotenv.2020.144817
Dawson M. N., Hays C. G., Grosberg R. K., Raimondi P. T. (2014). Dispersal potential and population genetic structure in the marine intertidal of the eastern North Pacific. Ecol. Monogr. 84 (3), 435–456. doi: 10.1890/13-0871.1
Doellman M. M., Trussell G. C., Grahame J. W., Vollmer S. V. (2011). Phylogeographic analysis reveals a deep lineage split within North Atlantic Littorina saxatilis. Proc. R. Soc. B: Biol. Sci. 278 (1722), 3175–3183. doi: 10.1098/rspb.2011.0346
Dunton K. (1992). Arctic biogeography: The paradox of the marine benthic fauna and flora. Trends Ecol. Evol. 7 (6), 183–189. doi: 10.1016/0169-5347(92)90070-R
Edgar R. C. (2004). MUSCLE: a multiple sequence alignment method with reduced time and space complexity. BMC Bioinf. 5 (1), 113. doi: 10.1186/1471-2105-5-113
Excoffier L., Lischer H. E. L. (2010). Arlequin suite ver 3.5: a new series of programs to perform population genetics analyses under Linux and Windows. Mol. Ecol. Resour. 10 (3), 564–567. doi: 10.1111/j.1755-0998.2010.02847.x
Faurby S., Jørgensen A., Kristensen R. M., Funch P. (2011). Phylogeography of North Atlantic intertidal tardigrades: refugia, cryptic speciation and the history of the Mid-Atlantic Islands: Phylogeography of North Atlantic intertidal tardigrades. J. Biogeography 38 (8), 1613–1624. doi: 10.1111/j.1365-2699.2011.02533.x
Fišer Pečnikar Ž., Buzan E. V. (2014). 20 years since the introduction of DNA barcoding: from theory to application. J. Appl. Genet. 55 (1), 43–52. doi: 10.1007/s13353-013-0180-y
Flowerdew M. (1983). Electrophoretic investigation of populations of the cirripede Balanus balanoides (L) around the North Atlantic Seaboard. Crustaceana 45 (3), 260–278.
Folmer O., Black M., Hoeh W., Lutz R., Vrijenhoek R. (1994). DNA primers for amplification of mitochondrial cytochrome c oxidase subunit I from diverse metazoan invertebrates. 3 (5), 294–299.
Francis R. M. (2017). Pophelper: an R package and web app to analyse and visualize population structure. Mol. Ecol. Resour. 17 (1), 27–32. doi: 10.1111/1755-0998.12509
Grabowski M., Jabłońska A., Weydmann-Zwolicka A., Gantsevich M., Strelkov P., Skazina M., et al. (2019). Contrasting molecular diversity and demography patterns in two intertidal amphipod crustaceans reflect Atlantification of High Arctic. Mar. Biol. 166 (12), 155. doi: 10.1007/s00227-019-3603-4
Grant W. S. (2015). Problems and cautions with sequence mismatch analysis and Bayesian skyline plots to infer historical demography. J. Heredity 106 (4), 333–346. doi: 10.1093/jhered/esv020
Guo M., Yuan C., Tao L., Cai Y., Zhang W.. (2022). Life barcoded by DNA barcodes. Conserv. Genet. Resour. 14 (4), 351–365. doi: 10.1007/s12686-022-01291-2
Hald M., Anderssonb C., Ebbesena H., Jansenb E., Klitgaard-Kristensenc D., Risebrobakken B., et al. (2007). Variations in temperature and extent of Atlantic Water in the northern North Atlantic during the Holocene. Quaternary Sci. Rev. 26 (25–28), 3423–3440. doi: 10.1016/j.quascirev.2007.10.005
Hansen B., Østerhus S. (2000). North Atlantic–Nordic seas exchanges. Prog. Oceanography 45 (2), 109–208. doi: 10.1016/S0079-6611(99)00052-X
Haye P. A., Segovia N. I., Munoz-Herrera N. C., Galvez F. E., Martınez A., Meynard A., et al. (2014). Phylogeographic structure in benthic marine invertebrates of the southeast pacific coast of Chile with differing dispersal potential. PloS One 9 (2), e88613. doi: 10.1371/journal.pone.0088613
Hemmer-Hansen J., Nielsen E. E. G., Grønkjær P., Loeschcke V.. (2007). Evolutionary mechanisms shaping the genetic population structure of marine fishes; lessons from the European flounder ( Platichthys flesus L.): population structure in european flounder. Mol. Ecol. 16 (15), 3104–3118. doi: 10.1111/j.1365-294X.2007.03367.x
Herrera M., Wethey D. S., Vázquez E., Macho G. (2019). Climate change implications for reproductive success: temperature effect on penis development in the barnacle Semibalanus balanoides. Mar. Ecol. Prog. Ser. 610, 109–123. doi: 10.3354/meps12832
Hoarau G., Coyer J. A., Veldsink J. H., Stam W. T., Olsen J. L. (2007). Glacial refugia and recolonization pathways in the brown seaweed Fucus serratus. Mol. Ecol. 16 (17), 3606–3616. doi: 10.1111/j.1365-294X.2007.03408.x
Hoffman J. I., Clarke A., Linse K., Peck L. S., et al. (2011). Effects of brooding and broadcasting reproductive modes on the population genetic structure of two Antarctic gastropod molluscs. Mar. Biol. 158 (2), 287–296. doi: 10.1007/s00227-010-1558-6
Hou Z., Fu J., Li S. (2007). A molecular phylogeny of the genus Gammarus (Crustacea: Amphipoda) based on mitochondrial and nuclear gene sequences. Mol Phylogenet Evol 45 (2), 596–611. doi: 10.1016/j.ympev.2007.06.006
Huson D. H., Bryant D. (2006). Application of phylogenetic networks in evolutionary studies. Mol. Biol. Evol. 23 (2), 254–267. doi: 10.1093/molbev/msj030
Ingolfsson A. (1992). The origin of the rocky shore Fauna of Iceland and the Canadian maritimes. J. Biogeography 19 (6), 705–712. doi: 10.2307/2845711
Ingvaldsen R. B., Assmann K. M., Primicerio R., Fossheim M., Polyakov I. V., Dolgov A. V., et al. (2021). Physical manifestations and ecological implications of Arctic Atlantification. Nat. Rev. Earth Environ. 2 (12), 874–889. doi: 10.1038/s43017-021-00228-x
Inkscape Project. (2020). Inkscape. Retrieved from https://inkscape.org.
Kaschner K., Rius-Barile J., Kesner-Reyes K., Garilao C., Kullander S. O., Rees T., et al. (2010). AquaMaps: Predicted range maps for aquatic species. Version 08/2010 (World wide web electronic publication). Available at: www.aquamaps.org.
Krebes L., Blank M., Bastrop R. (2011). Phylogeography, historical demography and postglacial colonization routes of two Amphi-Atlantic distributed amphipods. Systematics Biodiversity 9 (3), 259–273. doi: 10.1080/14772000.2011.604359
Larsen K. M. H., Hansen B., Svendsen H. (2008). Faroe shelf water. Continental Shelf Res. 28 (14), 1754–1768. doi: 10.1016/j.csr.2008.04.006
Leigh J. W., Bryant D. (2015). Popart : full-feature software for haplotype network construction. Methods Ecol. Evol. 6 (9), 1110–1116. doi: 10.1111/2041-210X.12410. Edited by S. Nakagawa.
Li J.-J., Hu Z.-M., Duan D.-L. (2016). “Survival in glacial refugia versus postglacial dispersal in the north atlantic: the cases of red seaweeds,” in Seaweed Phylogeography. Eds. Hu Z.-M., Fraser C. (Netherlands: Dordrecht: Springer), 309–330. doi: 10.1007/978-94-017-7534-2_12
Lobo J., Teixeira M. A. L., Ferreira M. S. G., Costa M. H., Costa F. O. (2013). Enhanced primers for amplification of DNA barcodes from a broad range of marine metazoans. BMC Ecol. 13 (1), 34. doi: 10.1186/1472-6785-13-34
Loeza-Quintana T., Carr C. M., Khan T., Bhatt Y. A., Lyon S. P., Hebert P. D. N., et al. (2019). Recalibrating the molecular clock for Arctic marine invertebrates based on DNA barcodes. Genome 62 (3), 200–216. doi: 10.1139/gen-2018-0107
Maggs C. A., Castilho R., Foltz D., Henzler C., Jolly M. T., Kelly J., et al. (2008). Evaluating signatures of glacial Refugia for North Atlantic Benthic marine taxa. Ecology 89 (sp11), S108–S122. doi: 10.1890/08-0257.1
Mieszkowska N., Burrows M., Pannacciulli F. G., Hawkins S.J. (2014). Multidecadal signals within co-occurring intertidal barnacles Semibalanus balanoides and Chthamalus spp. linked to the Atlantic Multidecadal Oscillation. J. Mar. Syst. 133, 70–76. doi: 10.1016/j.jmarsys.2012.11.008
Morales H. E., Faria R., Johannesson K., Larsson T., Panova M., Westram A. M., et al. (2019). Genomic architecture of parallel ecological divergence: Beyond a single environmental contrast. Sci. Adv. 5, eaav9963. doi: 10.1126/sciadv.aav99
Nunez J. C. B., Elyanow R. G., Ferranti D. A., Rand D. M. (2018). “Population genomics and biogeography of the northern acorn barnacle (Semibalanus balanoides) using pooled sequencing approaches,” in Population Genomics: Marine Organisms. Eds. Oleksiak M. F., Rajora O. P. (Cham: Springer International Publishing (Population Genomics), 139–168. doi: 10.1007/13836_2018_58
Nunez J. C. B., Rong S., Damian-Serrano A., Burley J. T., Elyanow R. G., Ferranti D. A., et al. (2021). Ecological load and balancing selection in circumboreal barnacles. Mol. Biol. Evolution. 38 (2), 676–685. doi: 10.1093/molbev/msaa227. Edited by R. Michael.
O’Hara C. C., Afflerbach J. C., Scarborough C., Kaschner K., Halpern B. S.. (2017). Aligning marine species range data to better serve science and conservation. PloS One 12 (5), e0175739. doi: 10.1371/journal.pone.0175739. Edited by R. Guralnick.
Oksanen J., Simpson G. L., Blanchet F. G., Kindt R., Legendre P., Minchin P. R., et al. (2023). vegan: Community Ecology Package (R package version 2.6-5). Available at: https://github.com/vegandevs/vegan.
Olsen J. L., Zechman F.W., Hoarau G., Coyer J. A., Stam W. T., Valero M., et al. (2010). The phylogeographic architecture of the fucoid seaweed Ascophyllum nodosum : an intertidal “marine tree” and survivor of more than one glacial-interglacial cycle. J. Biogeography 37 (5), 842–856. doi: 10.1111/j.1365-2699.2009.02262.x
Osika A., Jania J., Szafraniec J. E. (2022). Holocene ice-free strait followed by dynamic Neoglacial fluctuations: Hornsund, Svalbard. Holocene 32 (7), 664–679. doi: 10.1177/09596836221088232
Panova M., Blakeslee A. M. H., Miller A. W., Makinen T., Ruiz G. M., Johannesson K., et al. (2011). Glacial history of the North Atlantic marine snail, littorina saxatilis, inferred from distribution of mitochondrial DNA lineages. PLoS One 6 (3), e17511. doi: 10.1371/journal.pone.0017511
Panova M., Aronsson H., Cameron R. A., Dahl P., Godhe A., Lind U., et al. (2016). “DNA extraction protocols for whole-genome sequencing in marine organisms,” in Marine Genomics. Ed. Bourlat S. J. (New York, NY: Springer New York), 13–44. doi: 10.1007/978-1-4939-3774-5_2
Pelc R. A., Warner R. R., Gaines S. D. (2009). Geographical patterns of genetic structure in marine species with contrasting life histories. J. Biogeography 36 (10), 1881–1890. doi: 10.1111/j.1365-2699.2009.02138.x
Pienimäki M., Leppäkoski E. (2004). Invasion pressure on the Finnish lake district: invasion corridors and barriers. Biol. Invasions 6 (3), 331–346. doi: 10.1023/B:BINV.0000034607.00490.95
Pritchard J. K., Stephens M., Donnelly P. (2000). Inference of population structure using multilocus genotype data. Genetics 155 (2), 945–959. doi: 10.1093/genetics/155.2.945
QGIS Development Team. (2021). QGIS Geographic Information System. Available at: https://www.qgis.org.
Radulovici A. E., Archambault P., Dufresne F. (2010). DNA barcodes for marine biodiversity: moving fast forward? Diversity 2 (4), 450–472. doi: 10.3390/d2040450
Rambaut A., Drummond A.J., Xie D., Baele G., Suchard M. A. (2018). Posterior summarization in Bayesian phylogenetics using tracer 1.7. Systematic Biol. 67 (5), 901–904. doi: 10.1093/sysbio/syy032
Ratnasingham S., Hebert P. D. N. (2007). Bold: The barcode of life data system http://www.barcodinglife.org. Mol. Ecol. Notes 7, 355–364. doi: 10.1111/j.1471-8286.2007.01678.x
R Core Team. (2022). R: A language and environment for statistical computing. (Vienna, Austria: R Foundation for Statistical Computing). Available at: https://www.R-project.org/.
R Core Team. (2019). R: A language and environment for statistical computing. (Vienna, Austria: R Foundation for Statistical Computing). Available at: https://www.R-project.org/.
Riginos C., Douglas K. E., Jin Y., Shanahan D. F., Treml E. A. (2011). Effects of geography and life history traits on genetic differentiation in benthic marine fishes. Ecography 34 (4), 566–575. doi: 10.1111/j.1600-0587.2010.06511.x
Rozas J., Ferrer-Mata A., Sanchez-DelBarrio J. C., Guirao-Rico S., Librado P., Ramos-Onsins S. E., et al. (2017). DnaSP 6: DNA sequence polymorphism analysis of large data sets. Mol. Biol. Evol. 34 (12), 3299–3302. doi: 10.1093/molbev/msx248
Semper S., Våge K., Pickart R. S., Jónsson S., Valdimarsson H.. (2022). Evolution and transformation of the north Icelandic Irminger current along the North Iceland shelf. J. Geophysical Research: Oceans 127 (3), e2021JC017700. doi: 10.1029/2021JC017700
Shaw P. W., Pierce G. J., Boyle P. R. (1999). Subtle population structuring within a highly vagile marine invertebrate, the veined squid Loligo forbesi , demonstrated with microsatellite DNA markers. Mol. Ecol. 8 (3), 407–417. doi: 10.1046/j.1365-294X.1999.00588.x
Sievert C. (2020). Interactive Web-Based Data Visualization with R, plotly, and shiny (Chapman and Hall/CRC). Available at: https://plotly-r.com.
Stankowski S., Zagrodzka Z. B., Galindo J., Montaño-Rendón M., Faria R., Mikhailova N., et al. (2022). Whole-genome phylogeography of the intertidal snail Littorina saxatilis (Authorea: preprint. Preprints). doi: 10.22541/au.167024888.84660705/v1
Väinölä R., Witt J. D. S., Grabowski M., Bradbury J. H., Jazdzewski K., Sket B.. (2008). Global diversity of amphipods (Amphipoda; Crustacea) in freshwater. Hydrobiologia 595 (1), 241–255. doi: 10.1007/s10750-007-9020-6
Węławski J. M. (1994). Gammarus (Crustacea, amphipoda) from Svalbard and Franz Josef land. Distribution and density. Sarsia 79 (2), 145–150. doi: 10.1080/00364827.1994.10413553
Węsławski J. M., Dragańska-Deja K., Legeżyńska J., Walczowski W. (2018). Range extension of a boreal amphipod Gammarus oceanicus in the warming Arctic. Ecol. Evol. 8 (15), 7624–7632. doi: 10.1002/ece3.4281
Waltari E., Hickerson M. J. (2013). Late Pleistocene species distribution modelling of North Atlantic intertidal invertebrates. J. Biogeography. 40 (2), 249–260. doi: 10.1111/j.1365-2699.2012.02782.x
Wares J. P., Cunningham C. W. (2001). Phylogeography and historical ecology of the North Atlantic intertidal. Evolution 55 (12), 2455–2469. doi: 10.1111/j.0014-3820.2001.tb00760.x
White J. W., Alley R. B., Brigham-Grette J., Fitzpatrick J. J., Jennings A. E., Johnsen S. J., et al. (2010). Past rates of climate change in the Arctic. Quaternary Sci. Rev. 29 (15–16), 1716–1727. doi: 10.1016/j.quascirev.2010.04.025
Wickham H. (2016). ggplot2: Elegant Graphics for Data Analysis (New York: Springer-Verlag). Available at: https://ggplot2.tidyverse.org.
Woodgate R., Aagaard K., Muench R. D., Gunn J., Björk G., Rudels B., et al. (2001). The Arctic Ocean Boundary Current along the Eurasian slope and the adjacent Lomonosov Ridge: Water mass properties, transports and transformations from moored instruments. Deep Sea Res. Part I: Oceanographic Res. Papers 48 (8), 1757–1792. doi: 10.1016/S0967-0637(00)00091-1
Keywords: biogeography, marine, demography, DNA barcoding, Arctic
Citation: Csapó H, Jabłońska A, Węsławski JM, Mieszkowska N, Gantsevich M, Dahl-Hansen I, Renaud P and Grabowski M (2023) mtDNA data reveal disparate population structures and High Arctic colonization patterns in three intertidal invertebrates with contrasting life history traits. Front. Mar. Sci. 10:1275320. doi: 10.3389/fmars.2023.1275320
Received: 09 August 2023; Accepted: 07 November 2023;
Published: 07 December 2023.
Edited by:
Tito Monteiro da Cruz Lotufo, University of São Paulo, BrazilReviewed by:
Karelyn Emily Knott, University of Jyväskylä, FinlandCopyright © 2023 Csapó, Jabłońska, Węsławski, Mieszkowska, Gantsevich, Dahl-Hansen, Renaud and Grabowski. This is an open-access article distributed under the terms of the Creative Commons Attribution License (CC BY). The use, distribution or reproduction in other forums is permitted, provided the original author(s) and the copyright owner(s) are credited and that the original publication in this journal is cited, in accordance with accepted academic practice. No use, distribution or reproduction is permitted which does not comply with these terms.
*Correspondence: Hedvig Csapó, hedvig.csapo@biol.uni.lodz.pl
Disclaimer: All claims expressed in this article are solely those of the authors and do not necessarily represent those of their affiliated organizations, or those of the publisher, the editors and the reviewers. Any product that may be evaluated in this article or claim that may be made by its manufacturer is not guaranteed or endorsed by the publisher.
Research integrity at Frontiers
Learn more about the work of our research integrity team to safeguard the quality of each article we publish.